Article

Effects of Increasing Nitrogen Content on Process Stability and Reactor Performance in Anaerobic Digestion

State Institute of Agricultural Engineering and Bioenergy, University of Hohenheim, 70599 Stuttgart, Germany
*
Author to whom correspondence should be addressed.
Energies 2020, 13(5), 1139; https://doi.org/10.3390/en13051139
Submission received: 1 December 2019 / Revised: 13 February 2020 / Accepted: 26 February 2020 / Published: 3 March 2020
(This article belongs to the Special Issue Biogas for Rural Areas)

Abstract

:
The aim of this study was to analyse the effect of different nitrogen increase rates in feedstock on the process stability and conversion efficiency in anaerobic digestion (AD). The research was conducted in continuously stirred tank reactors (CSTR), initially filled with two different inocula: inocula #1 with low and #2 with high nitrogen (N) concentrations. Three N feeding regimes were investigated: the “0-increase” feeding regime with a constant N amount in feeding and the regimes “0.25-increase” and “0.5-increase” where the N concentrations in feedstock were raised by 0.25 and 0.5 g·kg−1, respectively, related to fresh matter (FM) every second week. The N concentration inside the reactors increased according to the feeding regimes. The levels of inhibition (Inhibition) in specific methane yields (SMY), related to the conversion efficiency of the substrates, were quantified. At the N concentration in digestate of 10.82 ± 0.52 g·kg−1 FM measured in the reactors with inoculum #2 and “0.5-increase” feeding regime, the level of inhibition was equal to 38.99% ± 14.99%. The results show that high nitrogen increase rates in feeding regime are negatively related to the efficiency of the AD process, even if low volatile fatty acid (VFA) concentrations indicate a stable process.

Graphical Abstract

1. Introduction

Utilization of protein-rich substrates, such as kitchen waste, poultry manure, microalgae, green legumes, oilseeds, etc. may lead to high concentrations of nitrogen (N) in the reactor during anaerobic digestion (AD) [1,2,3,4]. High concentrations of N inside the reactor negatively affect process stability and efficiency due to ammonia formation. Total ammonia nitrogen (TAN), which is generally defined as the sum of free ammonia nitrogen (FAN, NH3-N) and ammonium nitrogen (NH4+-N), is formed during the hydrolysis of proteins, urea and nucleic acids [5,6,7,8]. Ammonia freely passes through the cell membranes of methanogens and causes a proton imbalance [5,8,9]. Free ammonia changes the intracellular pH of methanogenic bacteria and inhibits specific enzymatic reactions [10]. Therefore, high concentrations of ammonia in anaerobic reactors lead to inhibition of methanogenesis and may cause complete failure of AD [6,11,12]. As reported by Chen et al. [13], temperature change has a direct impact on both microbial growth rates and free ammonia concentration: increased process temperature affects the metabolic rate of the microorganisms in a positive way; however, it also results in higher ammonia levels.
The chemical balance between NH3 (free ammonia) and NH4+ (ammonium) is shown in Equation (1) [14,15].
N H 4   + + O H N H 3 + H 2 O
The shift of this equilibrium depends mainly on the process conditions, i.e., temperature and pH [7,9,14]. The concentration of free ammonia is positively correlated with temperature and pH [5,16].
Under high ammonia concentrations in the reactor, the acetoclastic methanogens (e.g., Methanosarcina, Methanosaeta spp.) are unable to degrade acetate, which results in its accumulation, depletion of buffer capacity and a subsequent drop in pH [16,17,18,19].
According to the literature [9,10,12,13,20], inhibition of the AD process by ammonia is indicated by the decrease in the specific methane yields along with the increase in volatile fatty acid (VFA) concentrations and a pH drop due to inhibition of bacterial growth. However, the limiting concentrations of TAN and FAN for maintaining AD without inhibition are subject to discussion (Table 1). In addition, there is a controversy whether TAN or FAN mainly inhibits methanogenesis [20].
Most authors in previous studies tend to agree that TAN ≥ 3.00 g·L−1 and FAN ≥ 0.20 g·L−1 have an inhibitory effect on AD (see Table 1). According to Table 1, very few studies have measured the level of inhibition in methane production when treating N-rich substrates.
For maintaining stable and efficient biogas production under high and/or increasing TAN and FAN concentrations, acclimatization strategies can be applied. A frequently used approach is to feed the reactor with a specific N- or ammonia-increase rate. However, no information on the maximum increase rates is available [1,4,12,21,22,23,24].
High nitrogen concentrations in the digestate are generally the result of a narrow carbon-to-nitrogen (C/N) ratio of the feedstock [9,12,25,26]. To reduce the concentrations of TAN and FAN in the digestate and thus to maximise biogas and methane yields, Shanmugam and Horan [26] recommend keeping the C/N ratio of the feedstock in the range of 15 to 20, while according to Kayhanian [9], this ratio should be between 27 and 32.
Currently, many operators of biogas plants suffer from AD inhibition and methane losses when utilizing N-rich substrates. The application of the acclimatization strategy with an optimal N-increase rate could stabilize AD and prevent or minimize methane losses. In this study, natural N-sources and microbial communities from full-scale biogas digesters were utilized. The research was conducted in continuously operated reactors under conditions similar to those in full-scale biogas plants. The aim of this investigation is to determine the effect of different nitrogen increase rates on anaerobic digestion in order to achieve an optimal process performance. The nitrogen increase in the feedstock was carried out every two weeks at rates of 0.25 and 0.5 g·kg−1 related to fresh matter. The N content of the digestate rose continuously in response to the two different increase rates in the feedstock. At the same time, the C/N ratio of the feedstock consistently decreased throughout the experiment. Thus, the influence of high nitrogen content on the stability of the fermentation process with regards to the C/N ratio could be investigated. By comparing the values of specific methane yield (SMY) obtained from the continuous experiment with those obtained from the batch experiment, the effect of increasing N content in the feedstock on the conversion efficiency of the substrates was studied.

2. Materials and Methods
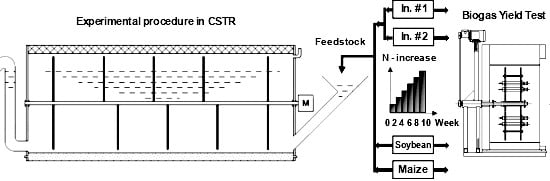
2.1. Reactor Design

The experiment was conducted in 12 horizontal, stainless steel, continuously stirred tank reactors (CSTR) of 20 L total volume (working volume 17 L) each, as described in [38], in duplicate repetition according to the Guideline 4630 issued by the Association of German Engineers (VDI) [39]. Different N-increase rates in the CSTR were achieved by different feeding regimes described in Section 2.2. During the experimental period, the organic loading rate related to volatile solids (OLRVS) was kept at 3 kg∙m−3∙d−1 with a hydraulic retention time (HRT) of 40 days. The temperature in each reactor was mesophilic at 37 ± 1 °C.

2.2. Inocula and N-Increase in Feeding Regimes

Each digester was filled with 17 L of inoculum at the beginning of the experiment. Inoculum #1 and inoculum #2 from two full-scale biogas plants were used in this trial. These inocula differed in total Kjeldahl nitrogen (TKN) concentrations, with inoculum #2 containing twice as much nitrogen as inoculum #1 (Table 2). Inoculum #1 was taken from a digester treating cattle manure (35–40%), maize silage (40%), grain whole plant silage (5%) and triticale (rest). Inoculum #2 was taken from a digester treating turkey manure (10%), cattle manure (8%), cereals (10%) and maize silage (62%).
The substrates were fed into the reactor daily are described in [38]. The daily feedstock consisted of fresh inoculum, maize silage (low nitrogen content) and soybean meal (N-rich substrate). Tap water was added in order to keep the HRT and OLRVS constant, thus resulting in 425 g of fresh matter daily feedstock. Characteristics of the substrates are described in Table 2. The values of the specific methane yield for the feeding substrates were determined by the Hohenheim biogas yield test [40,41].
For each inoculum, the different feeding regimes were separately analysed, as shown in Figure 1. These feeding regimes represent the rate of N increase in the feeding ratio. The investigated feeding regimes were “0-increase”, “0.25-increase” and “0.5-increase”. Under the “0-increase” feeding regime, the nitrogen content did not change over the whole course of the experiment. For the other two regimes, there was an increase in nitrogen content in the feedstock (see Figure 1a). The increase in nitrogen concentration was achieved by adding soybean meal and simultaneously decreasing the share of maize silage. In the feeding regimes “0.25-increase” and “0.5-increase”, the share of soybean meal was increased stepwise, thus leading to N-increase rates of 0.25 and 0.5 g·kg−1 FM every two weeks, respectively. By contrast, the C/N ratio in feedstock was decreasing as shown in Figure 1b.

2.3. Trace Elements Supplementation

For AD process stability, the importance of micronutrients, i.e., iron, nickel, molybdenum, cobalt and selenium is described in literature [27,42,43,44,45]. After observing process instability for the reactors with inoculum #1 at the beginning of week 17, micronutrient levels were tested. In response to the identified deficiency in trace elements (TE) in the reactors with inoculum #1 and for keeping the TE in the range as recommended by Vintiloiu et al. [42], 1.23 g of BC.Pro Akut® was added to all the reactors (with #1 and #2) weekly, starting from the end of week 17 up to the end of the experimental trials. BC.Pro Akut® is a mixture of TE and other components comprising the following active substances in the ionic form: aluminium, boron, calcium, iron, cobalt, copper, magnesium, manganese, molybdenum, sodium, nickel, selenium, tungsten and zinc.

2.4. Analytical Methods

The produced biogas was collected in gas bags as described by Haag et al. [38]. A gas measuring unit automatically analysed the gas quantity (Hoentzsch FA MS40, Waiblingen, Germany), as well as the content of CH4 and CO2 (AGM 10, Sensors Europe, Erkrath, Germany). The measurements were carried out once per day before feeding.
Samples were taken from the reactors weekly. The dry matter content related to fresh matter (DMFM) and volatile solids content related to dry matter (VSDM) of the collected samples were determined by differential weighing before and after drying at 105 °C for 24 h and by subsequent ashing at 550 °C for 8 h, respectively. The pH was measured in each reactor three times per week with a WTW 323, using a SenTix 41 pH-electrode (WTW, Weilheim, Germany). Concentrations of VFA in the samples were determined by gas chromatography. The gas chromatograph Shimadzu GC-2010plus (Tokyo, Japan) was equipped with a FFAP 50 m × 0.32 mm column with a chemically bonded polyethylene glycol CP-Wax 58 FFAP CB 1.2 μm film, a flame ionization detector and helium as a carrier gas. Total ammonium concentrations in the digestate were determined by the automatic distillation system Gerhardt Vapodest 50s (Koenigswinter, Germany). Total Kjeldahl nitrogen (TKN) is expressed as total nitrogen or N if not stated otherwise. The total nitrogen in the samples was determined by Kjeldahl analysis. The potassium determination was done by means of flame atomic absorption spectroscopy (AAS, Eppendorf, ELEX 6361, Wesseling-Berzdorf, Germany), operated with an acetylene gas. For the determination of phosphorus, a cuvette test [46] and a spectrophotometer UV–VIS 1240 (Shimadzu, Tokyo, Japan) were used. All the analyses were carried out according to standard methods [46]. The analysis on trace element content in the samples was done by an external laboratory in accordance with standard methods [47,48,49].

2.5. Calculation of FAN and TAN

The N H 3 (free ammonia) concentration was calculated by using the equation described in [14].
N H 3 = K N H 4 · N H 4 + H +
where N H 4 + is the ammonium concentration in g∙kg−1 related to FM; K N H 4 is the ionization constant of ammonium (for 37 °C, K N H 4 = 1.14∙10−9 [21]); H + is the hydrogen ion concentration ( H + = 10 p H [14]).   N H 3 was recalculated to NH3-N (FAN), and N H 4 + was recalculated to N H 4 + -N (ammonium nitrogen) according to their molar masses. The concentration of TAN was calculated as the sum of FAN (NH3-N) and N H 4 + -N.

2.6. Statistical Analysis

For data processing and visualization, Microsoft EXCEL 2016, SAS 9.4, R and RStudio (version 1.1.463) were used.

2.6.1. Inhibition in SMY

The inhibition in specific methane yields (Inhibition) for different N increase-rates in feeding regimes is defined by Equation (3):
Inhibition = 1 n i = 1 n S M Y t S M Y m S M Y t · 100 %
where n is the number of observations over the experimental period taken for the analysis. The theoretical methane yields (SMYt) were calculated based on the amounts of VSDM added to the reactors and the SMYVS of the substrates obtained by the Hohenheim biogas yield test (Table 2). The measured SMY (SMYm) was based on the measured value of methane yield divided by the amount of VS added to the reactor. This inhibition can also be described as the conversion efficiency between the theoretical SMYt values obtained from the batch experiment and the measured SMYm values obtained from the continuous experiment.
The one-sided Tukey test was applied to identify whether the difference between the SMYt and SMYm was statistically significant. The analysis was done in Excel and Rstudio.

2.6.2. Analysis of the effect of TAN and FAN on inhibition

Based on the experimental data for the three investigated feeding regimes along with inocula #1 and #2, the effects of TAN and FAN concentrations in the reactor on the level of inhibition were analysed. For this purpose, mixed modelling for repeated measurements was applied [50]. This model was selected for serial correlation among observations on the same experimental unit. The experimental unit, in our case, was the reactor [50]. Analyses were based on the experimental data starting from week 17 of the trials after the TE supplementation was started. The applied data were checked by using the normality test on the studentized residuals. For meeting the requirements of the mixed model, the square-root transformation of the data on inhibition in SMY (sqrt_Inhibition) was used. Several types of models (independent, compound symmetry, autoregressive, unstructured) were checked; on the grounds of the normally distributed residual plots and the lowest Akaike information criterion (AIC) value, the compound symmetry type was selected as the best-fitting model.
The applied model is given in Equation (4):
y i t k = μ + α i + r t + b t k + e i t k
where y i t k is the dependent variable; i is the i-th observation, t is the weekly measurement and k is related to the interaction between the fixed factor and the point in time (t); μ describes the general effect of the model; α i is the i-th observation of the fixed factor; r t is the replicate of a weekly measurement; b t k is the random effect of a week and the interaction between week and the fixed factor; e i t k is the random deviation associated with y i t k .
The sqrt_Inhibition was used as the dependent variable; the TAN and FAN were separately analysed as the fixed factor. The influence of time and interaction between time ("WEEK", in our case) and a fixed factor was analysed on a random effect in the model. The "MIXED" procedure of SAS was used to fit the model.

3. Results and Discussion

The reactors were continuously monitored over the whole period of the trials. The measured values for N, TAN, FAN, acetic acid (HAc), pH, SMYm and inhibition are shown in Figure 2. The trial period included a starting phase and an experimental phase.

3.1. The Starting Phase

During the starting phase, the OLRVS was increased until the aimed values were achieved.
The starting phase was needed for the microorganisms to adapt to the operating conditions. During this phase, all reactors were fed with a constant N feeding ratio equivalent to the “0-increase” variant (Figure 2a) to establish stable conditions. The stable operation was determined by monitored VFA concentrations (Figure 2d) and specific methane production (Figure 2f). In week four to six, the TE concentrations were additionally tested, which showed sufficient nutrient levels according to Vintiloiu et al. [42] (see Table 3). For inoculum #1, the starting phase lasted for 48 days. For inoculum #2, the starting phase took 90 days.
The values provided in Figure 2 for the starting phase can be relevant for farmers and biogas operators when utilizing protein-rich substrates in biogas plants. However, these values are excluded from the statistical analysis described in Section 3.3.

3.2. The Experimental Period

After the starting phase, the reactors were continuously operated and monitored for 26 and 20 weeks for inoculum #1 and #2, respectively.
The lack of TE in the reactors with inoculum #1, which resulted in the accumulation of acetic acid up to 8.53 g∙kg−1 FM, along with a drop in pH up to 6.40 (as described in [12,42]), was identified at the beginning of week 17 of the trials (see Figure 2d,e and Table 3). The weekly supplementation of the CSTR with TE was established thereafter in order to compensate for the deficiency in TE in the reactors with inoculum #1 and to ensure a sufficient TE supply for the remainder of the experiment. The vertical line shown at week 17 in Figure 2 marks the beginning of weekly TE supplementation. The positive effect of TE to AD process stability can be seen in Figure 2d,e in the stabilization of pH and HAc in the weeks following supplementation. The analysis of TE measured in week 24 showed that the amounts of these nutrients in the reactors were well-balanced (see Table 3).
Additionally, the total phosphorus and potassium concentrations inside the reactors were analysed. The availability of these nutrients may be of great interest when using digestate as a fertilizer. The concentrations of these macro elements within the research period were the following: for inoculum #1, P = 0.62 ± 0.13 g∙kg−1 FM, K = 3.20 ± 0.35 g∙kg−1 FM; for inoculum #2, P = 0.99 ± 0.09 g∙kg−1 FM, K = 3.73 ± 1.11 g∙kg−1 FM.
Over the experimental period, the concentration of N in the digestate was accumulating, as shown in Figure 2a. The accumulation of N in the reactors was related to the analysed N-increase rates. The average N-increase rate in the daily feedstock under the “0.5-increase” feeding regime was 35.7 mg∙kg−1∙d−1 related to the fresh matter of the input substrates. At the end of the experiment, the highest values of total nitrogen in the digestate were 10.09 ± 0.08 g∙kg−1 FM and 11.49 ± 0.01 g∙kg−1 FM for the reactors with inoculum #1 and #2, respectively. Accordingly, a maximum “nitrogen loading rate” (NLR) can be given; the NLR was equal to 0.25 g∙L−1∙d−1 for the reactors with inoculum #1 and 0.30 g∙L−1∙d−1 for those with inoculum #2.
Concurrently, the TAN and FAN concentrations in the digestate increased, as shown in Figure 2b,c. At the end of the experiment, the highest values of TAN were 7.72 ± 0.33 g∙kg−1 FM (for the reactors with inoculum #1) and 7.95 ± 1.08 g∙kg−1 FM (for the reactors with inoculum #2). The highest FAN concentration in the final samples was 0.72 ± 0.03 g∙kg−1 FM and 0.74 ± 0.12 g∙kg−1 FM for the reactors with inoculum #1 and #2, respectively.
The concentration of HAc in the reactors over the period of the trials is shown in Figure 2d. The average concentrations of acetic and propionic acids in the CSTR during the experimental period were 0.88 ± 0.46 g∙kg−1 FM and 0.17 ± 0.32 g∙kg−1 FM, respectively, independent of the inoculum. In the reactors with #1, acetate accumulation caused by TE deficiency decreased to a minimum after the start of TE supplementation, with no acetate found in weeks 31–33. In the reactors with inoculum #2, acetate remained at a stable low concentration over the entire experimental phase with zero-values at the end of the trials. The concentrations of other VFA, i.e., iso-butyric, n-butyric, iso-valeric, n-valeric and caproic acids were low over the research period; the concentration of these acids was 0.04 ± 0.16 g∙kg−1 FM for both inocula.
The pH-values during the experimental phase were slightly higher than those in the starting phase. Over the entire experimental period, the pH levels in the CSTR were stable, except for the reactors with inoculum #1 under the TE deficiency with a drop in pH up to 6.40 (see Figure 2e). The average pH was 7.45 ± 0.21 for the experiments based on inoculum #1 and 7.77 ± 0.11 for those based on inoculum #2.
The values of SMYm during the experimental phase are given in Figure 2f. The mean SMYm was 289.93 ± 35.13 L∙kg−1 VS and 267.20 ± 19.86 L∙kg−1 VS for the reactors with #1 and #2, respectively.
The values of inhibition during the experimental phase are given in Figure 2g. At the end of the experiment, the values of inhibition for inoculum #1 were 0.57% ± 1.22% (in weeks 32–33), 18.02% ± 22.64% (in weeks 32–33) and 26.96% ± 22.88% (in weeks 29–33) for the “0-increase”, “0.25-increase” and “0.5-increase” variants, respectively. At the final phase of the experiment (in weeks 29–33) the values of inhibition for inoculum #2 were 10.91% ± 4.58%, 19.38% ± 8.93%, 38.99% ± 14.99% for the “0-increase”, “0.25-increase” and “0.5-increase” variants, respectively. The 38.99% ± 14.99% inhibition determined in the reactors with #2 and “0.5-increase” feeding regime was related to N, TAN and FAN concentrations of 10.82 ± 0.52 g∙kg−1 FM, 7.92 ± 0.27 g∙kg−1 FM and 0.69 ± 0.10 g∙kg−1 FM, respectively. As seen in Figure 2g, inhibition levels in the reactors with both inocula appear to have reached higher levels at the higher N increase rate.

3.3. Results of Statistical Analysis

3.3.1. Results of analysis on inhibition in SMY

The results of the analysis on inhibition in SMY over the experimental phase are given in Table 4 and are shown in Figure 3. According to the results of the Tukey test, for all the analysed feeding regimes the difference between the SMYt and SMYm was statistically significant. The large variation in the SMYm for the reactors with inoculum #1 and the “0-increase” variant can be explained by the instability of the AD process under the TE deficiency. The highest inhibition was determined in the reactors with inoculum #2 and the “0.5-increase” variant.
According to the results of the analysis, the N-increase rate in feeding regime had a negative effect on the AD process efficiency.

3.3.2. Results of analysis of the effect of TAN and FAN on inhibition

The results of the fitted model were the following: The increase in TAN levels resulted in an increase of inhibition in SMY, p-value = 0.0001 (Table 5 and Figure 4). The increase in FAN concentration in the AD reactor resulted in an increase of the inhibition level, p-value = 0.0012 (Table 5 and Figure 5). The observed noise in Figure 4 and Figure 5 can be associated with the fact that the inhibition does not derive only from TAN or FAN concentrations inside the reactors; this inhibition can be also affected by other parameters.
The results of the data analysis show that the analysed N-increase rates can be recommended for a stable AD process. However, the level of inhibition in SMY depends on the concentration of TAN and FAN inside the reactors and the N-increase rate in the feeding regimes (see Figure 4 and Figure 5).

3.4. Discussion

The inhibitory effect of urea, NH4Cl, TAN, FAN and high N concentration in feeding, as well as the effect of elevated ammonium (NH4+), elevated ammonium nitrogen (NH4+-N) and elevated TAN on biogas and methane yields, have been previously studied [1,4,15,17,22,32,51,52,53]. However, no results on the effects of N concentration in inoculum and N-increase rate in feedstock on the level of inhibition in specific methane yield were found.
Contrary to the research results reported by Siegrist et al. [18], Chen et al. [17], Meng et al. [19] and Theuerl et al. [16], the stable AD-process was found in this study as indicated by stable pH values and a minimal accumulation of acetate (except for the reactors with #1 under the TE deficiency) (see Figure 2e,d). During the experimental phase, the specific methane yields were kept stable in all the reactors, and their values were in a normal range (see Figure 2f). Based on the results obtained it can be assumed that the analysed feeding regimes enabled the microorganisms to adapt to changing N-conditions, which is indicated by a stable AD process. The regular supplementation of reactors with TE positively contributed to the process stability. The proposed increase rates did not have any negative effect on the process stability. Hereby the N-increase variants of “0.25-increase”, “0.5-increase” and the NLR up to 0.30 g∙L−1∙d−1 can be recommended for maintaining a biogas plant in a stable way.
In contrast, the efficiency of AD, which in this study corresponded to the inhibition in specific methane yield (Inhibition), was affected by N-increase rate and the level of TAN and FAN inside the reactor. The conversion process in the reactors, which in this study is described as inhibition, became more and more inefficient due to the closer C/N ratio in feedstock (see Figure 1b). Chen et al. [17] has stated that the methane production was intensely inhibited when TAN increased to 5 g∙L−1 and they recommended to maintain the ammonium concentration below 2 g∙L−1 in the reactors for preventing the ammonium shock to the AD process. According to the review made by Chen et al. [15], in different studies there is controversial information on the level of inhibition in methane production depending on the TAN and FAN concentrations in the AD reactor: 50% of methane inhibition was observed at TAN of 1.44 g·L−1, 2.48 g·L−1 and 5.60 g·L−1 and FAN of 0.03 g·L−1 and 0.64 g·L−1; 100% of methane inhibition was identified at TAN values above 5.20 g·L−1 and FAN of 0.20 g·L−1 and 0.62 g·L−1. Fotidis et al. [32,53] specify that at the NH4+-N in the range of 3–5 g·L−1, an ammonia induced inhibited-steady state in the AD reactors was observed with inhibition in methane production of 30–40%, and the authors recommend a bioaugmentation strategy for overcoming an ammonia inhibiting effect. However, in our research, under NH4+-N of 5.03 ± 0.06 g·kg−1 FM, our TAN and FAN concentrations in the reactors were 5.34 ± 0.15 g·kg−1 FM and 0.31 ± 0.14 g·kg−1 FM, respectively, and the value of inhibition was equal to 9.46% ± 5.60%. According to the results of the data analysis, both TAN and FAN had a significant effect on the level of inhibition. As FAN levels are mostly affected by temperature and pH fluctuations [7,9,14,21], the effect of FAN was less significant than TAN in our research, since the reactors were operated under mesophilic conditions at stable temperature and pH (except for the pH values in the reactors with inoculum #1 under the TE deficiency). As the OLRVS, HRT, temperature and pH in the reactors were kept stable, the results show that the N-increase rate in the feeding regime was negatively related to the efficiency of the AD process even if low VFA concentrations indicated a stable process. In further studies, the influence of the increasing N concentrations in the digestate on the microbial population should be investigated.
The results of this study can be applied by biogas operators running their systems at high nitrogen concentrations up to 11.5 g·kg−1 FM or utilizing substrates with varying nitrogen contents.

4. Conclusions

In this study, we analysed the effect of different inocula and different N-increase rates in feeding regimes on AD process stability and efficiency. The stepwise acclimatisation strategy used for microorganisms to adapt to a new nitrogen concentration according to the feeding regime prevented failure of the AD process under high and elevated ammonia levels. The research approach applied in this study enabled us to run the CSTR in a stable way under the elevated nitrogen loading rates up to 0.30 g·L−1∙d−1. The highest N, TAN and FAN in the digestate at the end of the experiment were equal to 11.50 g∙kg−1 FM, 9.07 g·kg−1 FM and 0.85 g·kg−1 FM. However, the study indicates that the N-increase rate was negatively related to the AD process efficiency. The level of inhibition in specific methane yield was positively correlated to the TAN and FAN concentrations in the digestate.

Author Contributions

Data curation: I.M., N.N. and A.L.; formal analysis: I.M.; funding acquisition: H.O. and A.L.; project administration: A.L. and I.M.; resources: H.O. and A.L.; supervision: A.L.; writing—original draft: I.M; writing—review and editing: I.M., A.L. and J.K. All authors have read and agreed to the published version of the manuscript.

Funding

This research was supported by the Agency for Renewable Resources (Fachagentur Nachwachsende Rohstoffe e. V. or FNR) under the framework of the project “Optimized substrate management and influence of digestate composition on the soil nitrogen and soil humus balance” (grant no. 22402412). All experiments were conducted at the State Institute of Agricultural Engineering and Bioenergy, University of Hohenheim. The APC was funded by the State Institute of Agricultural Engineering and Bioenergy, University of Hohenheim.

Acknowledgments

We want to thank Prof. Dr. Hans-Peter Piepho for his valuable advice and help during the statistical analysis. Ievgeniia Morozova would like to thank the German Academic Exchange Service (Deutscher Akademischer Austauschdienst, DAAD) for the financial support.

Conflicts of Interest

The authors declare no conflicts of interest.

References

  1. Yirong, C.; Zhang, W.; Heaven, S.; Banks, C.J. Influence of ammonia in the anaerobic digestion of food waste. J. Environ. Chem. Eng. 2017, 5, 5131–5142. [Google Scholar] [CrossRef] [Green Version]
  2. Zhang, C.; Wang, F.; Pei, M.; Qiu, L.; Qiang, H.; Yao, Y. Performance of Anaerobic Digestion of Chicken Manure Under Gradually Elevated Organic Loading Rates. Int. J. Environ. Res. Public Health 2019, 16, 2239. [Google Scholar] [CrossRef] [Green Version]
  3. Zhang, Q.; Hu, J.; Lee, D.-J. Biogas from anaerobic digestion processes: Research updates. Renew. Energy 2016, 98, 108–119. [Google Scholar] [CrossRef]
  4. Tian, H.; Fotidis, I.A.; Mancini, E.; Treu, L.; Mahdy, A.; Ballesteros, M.; González-Fernández, C.; Angelidaki, I. Acclimation to extremely high ammonia levels in continuous biomethanation process and the associated microbial community dynamics. Bioresour. Technol. 2018, 247, 616–623. [Google Scholar] [CrossRef] [PubMed] [Green Version]
  5. Korres, N. Bioenergy Production by Anaerobic Digestion; Routledge: Abingdon, UK, 2013; ISBN 9780203137697. [Google Scholar]
  6. Carlos, A.; De Lemos, C. Anaerobic Reactors. Biological Wastewater Treatment Series; IWA Publishing: London, UK, 2007; Volume 4, ISBN 9781843391647. [Google Scholar]
  7. Anthonisen, A.C.; Loehr, R.C.; Prakasam, T.B.; Srinath, E.G. Inhibition of Nitrification by Ammonia and Nitrous Acid. J. Water Pollut. Control Fed. 1976, 48, 835–852. [Google Scholar]
  8. Poirier, S.; Madigou, C.; Bouchez, T.; Chapleur, O. Improving anaerobic digestion with support media: Mitigation of ammonia inhibition and effect on microbial communities. Bioresour. Technol. 2017, 235, 229–239. [Google Scholar] [CrossRef]
  9. Kayhanian, M. Ammonia Inhibition in High-Solids Biogasification: An Overview and Practical Solutions. Environ. Technol. 1999, 20, 355–365. [Google Scholar] [CrossRef]
  10. Krakat, N.; Demirel, B.; Anjum, R.; Dietz, D. Methods of ammonia removal in anaerobic digestion: A review. Water Sci. Technol. 2017, 76, 1925–1938. [Google Scholar] [CrossRef]
  11. Fotidis, I.A.; Karakashev, D.; Kotsopoulos, T.A.; Martzopoulos, G.G.; Angelidaki, I. Effect of ammonium and acetate on methanogenic pathway and methanogenic community composition. Fems Microbiol. Ecol. 2013, 83, 38–48. [Google Scholar] [CrossRef] [Green Version]
  12. Rajagopal, R.; Massé, D.I.; Singh, G. A critical review on inhibition of anaerobic digestion process by excess ammonia. Bioresour. Technol. 2013, 143, 632–641. [Google Scholar] [CrossRef]
  13. Chen, Y.; Cheng, J.J.; Creamer, K.S. Inhibition of anaerobic digestion process: A review. Bioresour. Technol. 2008, 99, 4044–4064. [Google Scholar] [CrossRef] [PubMed]
  14. Perry, L.; McCarty, P.L.; McKenney, R.E. Salt Toxicity in Anaerobic Digestion. J. Artic. 1961, 33, 399–415. [Google Scholar]
  15. Chen, J.L.; Ortiz, R.; Steele, T.W.J.; Stuckey, D.C. Toxicants inhibiting anaerobic digestion: A review. Biotechnol. Adv. 2014, 32, 1523–1534. [Google Scholar] [CrossRef]
  16. Theuerl, S.; Klang, J.; Prochnow, A. Process Disturbances in Agricultural Biogas Production—Causes, Mechanisms and Effects on the Biogas Microbiome: A Review. Energies 2019, 12, 365. [Google Scholar] [CrossRef] [Green Version]
  17. Chen, H.; Wang, W.; Xue, L.; Chen, C.; Liu, G.; Zhang, R. Effects of Ammonia on Anaerobic Digestion of Food Waste: Process Performance and Microbial Community. Energy Fuels 2016, 30, 5749–5757. [Google Scholar] [CrossRef]
  18. Siegrist, H.; Vogt, D.; Garcia-Heras, J.L.; Gujer, W. Mathematical Model for Meso- and Thermophilic Anaerobic Sewage Sludge Digestion. Environ. Sci. Technol. 2002, 36, 1113–1123. [Google Scholar] [CrossRef] [PubMed]
  19. Meng, X.; Zhang, Y.; Sui, Q.; Zhang, J.; Wang, R.; Yu, D.; Wang, Y.; Wei, Y. Biochemical Conversion and Microbial Community in Response to Ternary pH Buffer System during Anaerobic Digestion of Swine Manure. Energies 2018, 11, 2991. [Google Scholar] [CrossRef] [Green Version]
  20. Yenigün, O.; Demirel, B. Ammonia inhibition in anaerobic digestion: A review. Process Biochem. 2013, 48, 901–911. [Google Scholar] [CrossRef]
  21. Hashimoto, A.G. Ammonia inhibition of methanogenesis from cattle wastes. Agric. Wastes 1986, 17, 241–261. [Google Scholar] [CrossRef]
  22. Tian, H.; Fotidis, I.A.; Mancini, E.; Angelidaki, I. Different cultivation methods to acclimatise ammonia-tolerant methanogenic consortia. Bioresour. Technol. 2017, 232, 1–9. [Google Scholar] [CrossRef] [Green Version]
  23. Angenent, L.T.; Sung, S.; Raskin, L. Methanogenic population dynamics during startup of a full-scale anaerobic sequencing batch reactor treating swine waste. Water Res. 2002, 36, 4648–4654. [Google Scholar] [CrossRef]
  24. Koster, I.W.; Lettinga, G. Anaerobic digestion at extreme ammonia concentrations. Biol. Wastes 1988, 25, 51–59. [Google Scholar] [CrossRef]
  25. Kayhanian, M. Performance of a high-solids anaerobic digestion process under various ammonia concentrations. J. Chem. Technol. Biotechnol. 1994, 59, 349–352. [Google Scholar] [CrossRef]
  26. Shanmugam, P.; Horan, N.J. Optimising the biogas production from leather fleshing waste by co-digestion with MSW. Bioresour. Technol. 2009, 100, 4117–4120. [Google Scholar] [CrossRef] [PubMed]
  27. Molaey, R.; Bayrakdar, A.; Sürmeli, R.Ö.; Çalli, B. Anaerobic digestion of chicken manure: Mitigating process inhibition at high ammonia concentrations by selenium supplementation. Biomass Bioenergy 2018, 108, 439–446. [Google Scholar] [CrossRef]
  28. Moestedt, J.; Müller, B.; Westerholm, M.; Schnürer, A. Ammonia threshold for inhibition of anaerobic digestion of thin stillage and the importance of organic loading rate. Microb. Biotechnol. 2016, 9, 180–194. [Google Scholar] [CrossRef]
  29. Li, Y.; Zhang, Y.; Sun, Y.; Wu, S.; Kong, X.; Yuan, Z.; Dong, R. The performance efficiency of bioaugmentation to prevent anaerobic digestion failure from ammonia and propionate inhibition. Bioresour. Technol. 2017, 231, 94–100. [Google Scholar] [CrossRef] [PubMed] [Green Version]
  30. Lauterböck, B.; Ortner, M.; Haider, R.; Fuchs, W. Counteracting ammonia inhibition in anaerobic digestion by removal with a hollow fiber membrane contactor. Water Res. 2012, 46, 4861–4869. [Google Scholar] [CrossRef] [PubMed]
  31. Grimsby, L.K.; Fjørtoft, K.; Aune, J.B. Nitrogen mineralization and energy from anaerobic digestion of jatropha press cake. Energy Sustain. Dev. 2013, 17, 35–39. [Google Scholar] [CrossRef]
  32. Fotidis, I.A.; Wang, H.; Fiedel, N.R.; Luo, G.; Karakashev, D.B.; Angelidaki, I. Bioaugmentation as a solution to increase methane production from an ammonia-rich substrate. Environ. Sci. Technol. 2014, 48, 7669–7676. [Google Scholar] [CrossRef]
  33. Niu, Q.; Qiao, W.; Qiang, H.; Hojo, T.; Li, Y.-Y. Mesophilic methane fermentation of chicken manure at a wide range of ammonia concentration: Stability, inhibition and recovery. Bioresour. Technol. 2013, 137, 358–367. [Google Scholar] [CrossRef] [PubMed]
  34. van Velsen, A. Adaptation of methanogenic sludge to high ammonia-nitrogen concentrations. Water Res. 1979, 13, 995–999. [Google Scholar] [CrossRef]
  35. Sun, C.; Cao, W.; Banks, C.J.; Heaven, S.; Liu, R. Biogas production from undiluted chicken manure and maize silage: A study of ammonia inhibition in high solids anaerobic digestion. Bioresour. Technol. 2016, 218, 1215–1223. [Google Scholar] [CrossRef] [Green Version]
  36. Yao, Y.; Yu, L.; Ghogare, R.; Dunsmoor, A.; Davaritouchaee, M.; Chen, S. Simultaneous ammonia stripping and anaerobic digestion for efficient thermophilic conversion of dairy manure at high solids concentration. Energy 2017, 141, 179–188. [Google Scholar] [CrossRef]
  37. Nielsen, H.B.; Angelidaki, I. Strategies for optimizing recovery of the biogas process following ammonia inhibition. Bioresour. Technol. 2008, 99, 7995–8001. [Google Scholar] [CrossRef] [PubMed]
  38. Haag, N.L.; Nägele, H.-J.; Reiss, K.; Biertümpfel, A.; Oechsner, H. Methane formation potential of cup plant (Silphium perfoliatum). Biomass Bioenergy 2015, 75, 126–133. [Google Scholar] [CrossRef]
  39. VDI-Society Energy and Environment. VDI 4630 Fermentation of Organic Materials. Characterization of the Substrate, Sampling, Collection of Material Data, Fermentation Tests; VDI: Düsseldorf, Germany, 2006. [Google Scholar]
  40. Helffrich, D.; Oechsner, H. The Hohenheim Biogas Yield Test. Landtechnik 2003, 58, 148–149. [Google Scholar]
  41. Mittweg, G.; Oechsner, H.; Hahn, V.; Lemmer, A.; Reinhardt-Hanisch, A. Repeatability of a laboratory batch method to determine the specific biogas and methane yields. Eng. Life Sci. 2012, 12, 270–278. [Google Scholar] [CrossRef]
  42. Vintiloiu, A.; Lemmer, A.; Oechsner, H.; Jungbluth, T. Mineral substances and macronutrients in the anaerobic conversion of biomass: An impact evaluation. Eng. Life Sci. 2012, 12, 287–294. [Google Scholar] [CrossRef]
  43. Voelklein, M.A.; O’ Shea, R.; Jacob, A.; Murphy, J.D. Role of trace elements in single and two-stage digestion of food waste at high organic loading rates. Energy 2017, 121, 185–192. [Google Scholar] [CrossRef]
  44. Wintsche, B.; Glaser, K.; Sträuber, H.; Centler, F.; Liebetrau, J.; Harms, H.; Kleinsteuber, S. Trace Elements Induce Predominance among Methanogenic Activity in Anaerobic Digestion. Front. Microbiol. 2016, 7, 2034. [Google Scholar] [CrossRef] [PubMed]
  45. Choong, Y.Y.; Norli, I.; Abdullah, A.Z.; Yhaya, M.F. Impacts of trace element supplementation on the performance of anaerobic digestion process: A critical review. Bioresour. Technol. 2016, 209, 369–379. [Google Scholar] [CrossRef] [PubMed]
  46. American Public Health Association; American Water Works Association; Water Environment Federation. Standard Methods for the Examination of Water and Wastewater, 20th ed.; American Public Health Association: Washington, DC, USA, 1998. [Google Scholar]
  47. DIN EN 13650. Soil Improvers and Growing Media—Extraction of Aqua Regia Soluble Elements, German version EN 136502001; British Standards Institution: London, UK, 2001. [Google Scholar]
  48. DIN EN ISO 17294-2. Water Quality—Application of Inductively Coupled Plasma Mass Spectrometry. Determination of Selected Elements Including Uranium Isotopes, German version EN ISO 172942016; International Organization for Standardization: Geneva, Switzerland, 2017. [Google Scholar]
  49. DIN EN ISO 11885. Water Quality—Determination of Selected Elements by Inductively Coupled Plasma Optical Emission Spectrometry, German version EN ISO 118852009; International Organization for Standardization: Geneva, Switzerland, 2017. [Google Scholar]
  50. Piepho, H.P.; Buchse, A.; Richter, C. A Mixed Modelling Approach for Randomized Experiments with Repeated Measures. J. Agron. Crop. Sci. 2004, 190, 230–247. [Google Scholar] [CrossRef]
  51. Tian, H.; Fotidis, I.A.; Kissas, K.; Angelidaki, I. Effect of different ammonia sources on aceticlastic and hydrogenotrophic methanogens. Bioresour. Technol. 2018, 250, 390–397. [Google Scholar] [CrossRef] [Green Version]
  52. Dai, X.; Yan, H.; Li, N.; He, J.; Ding, Y.; Dai, L.; Dong, B. Metabolic adaptation of microbial communities to ammonium stress in a high solid anaerobic digester with dewatered sludge. Sci. Rep. 2016, 6, 28193. [Google Scholar] [CrossRef] [Green Version]
  53. Fotidis, I.A.; Treu, L.; Angelidaki, I. Enriched ammonia-tolerant methanogenic cultures as bioaugmentation inocula in continuous biomethanation processes. J. Clean. Prod. 2017, 166, 1305–1313. [Google Scholar] [CrossRef] [Green Version]
Figure 1. Experimental procedure: (a) N content in feedstock; (b) C/N ratio in feedstock. The results are given separately for inoculum #1 and inoculum #2. Different line colours in the graphs and in the legend correspond to the N-increase rates “0-increase”, “0.25-increase” and “0.5-increase” in the feeding regimes. Grey and white backgrounds in the graphs are related to the starting phase and the experimental phase, respectively.
Energies 13 01139 g001
Figure 2. Measured values of the following parameters in the continuously stirred tank reactors (CSTR) under different N-increase rates in feeding regimes: (a) total nitrogen (N); (b) total ammonia nitrogen (TAN); (c) free ammonia nitrogen (FAN); (d) acetic acid (HAc); (e) pH; (f) the measured values of specific methane yield (SMYm); (g) inhibition in specific methane yield (Inhibition). The results are given separately for inoculum #1 and inoculum #2. Different line colours along with different marks in the graphs and in the legend correspond to the N-increase rates “0-increase”, “0.25-increase” and “0.5-increase” in the feeding regimes. Grey and white backgrounds in the graphs are related to the starting phase and the experimental phase, respectively. The vertical line in the graphs corresponds to the beginning of regular weekly trace elements (TE) supplementation.
Energies 13 01139 g002
Figure 3. The results of analysis on inhibition in specific methane yield (SMY). The results are given separately for inoculum #1 and inoculum #2. Tick marks “0”, “0.25” and “0.5” on the x-axis correspond to the N-increase variants of “0-increase”, “0.25-increase” and “0.5-increase” in feeding regimes. The “measured” value is the measured SMY (SMYm); the “theoretical” value is the theoretical SMY (SMYt). Letters “a” and “b” denote the significant differences between the SMYm and SMYt for the same variant of N-increase according to the results of the one-sided Tukey test.
Energies 13 01139 g003
Figure 4. The correlation between the total ammonia nitrogen (TAN) and the inhibition in specific methane yield (Inhibition). The “0”, “0.25” and “0.5” marks in the legend correspond to the N-increase variants of “0-increase”, “0.25-increase” and “0.5-increase” in the feeding regimes. The regression line was built based on the results obtained from the model.
Energies 13 01139 g004
Figure 5. The correlation between the free ammonia nitrogen (FAN) and the inhibition in specific methane yield (Inhibition). The “0”, “0.25” and “0.5” marks in the legend correspond to the N-increase variants of “0-increase”, “0.25-increase” and “0.5-increase” in the feeding regimes. The regression line was built based on the results obtained from the model.
Energies 13 01139 g005
Table 1. Limiting total ammonia nitrogen (TAN)- and free ammonia nitrogen (FAN)-concentrations (g·L−1) for maintaining stable anaerobic digestion (AD) under different temperature conditions.
Mesophilic conditions
TANTreated SubstrateOperating TemperatureInhibition in CH4 ProductionReferenceFANTreated SubstrateOperating TemperatureInhibition in CH4 ProductionReference
1.00Mashed biowaste, residual
food waste
Not indicatedNot indicated[8]0.03Mashed biowaste, residual food
waste, steers manure
Not indicated, 35 °CNot indicated[8,21]
2.00Food waste37 °CNot indicated[17]0.49 (b)Animal manure, food waste37 ± 1 °CNot indicated[22]
2.40Chicken manure, spent poppy straw36 ± 1 °CNot indicated[27]1.10Thin stillage38 °CNot indicated[28]
3.00Municipal wastewater biosolids36 ± 1 °CNot indicated[29]1.20Pig slurry, maize silage, other38.0 ± 0.5 °CNot indicated[30]
3.20 (b)Municipal wastewater~22 °CNot indicated[23]agricultural wastes
3.50Municipal wastewater biosolids37 ± 1 °CNot indicated[1]
4.56 (b)Jatropha press cake37 °CNot indicated[31]
5.00Animal/poultry manure,
organic waste, municipal
wastewater
30–38 °C50% inhibition at TAN of 3.0 g·L−1 [11,32,33,34]
6.00Pig slurry, maize silage,
other agricultural wastes
38.0 ± 0.5 °CNot indicated[30]
7.00Chicken manure, maize silage37–41 °C10–20% at TAN ≥ 7.0 g·L−1,
FAN ~ 600 mg·L−1;
50% at TAN ≥ 8.8 g·L−1
[35]
10.00 (b)Animal waste, food waste37 ± 1 °CNot indicated[4]
11.80 (b)Beet-sugar factory wastewater30 ± 1 °CNot indicated[24]
Thermophilic Conditions
TANTreated SubstrateOperating TemperatureInhibition in CH4 ProductionReferenceFANTreated SubstrateOperating TemperatureInhibition in CH4 ProductionReference
1.80–2.40Dairy manure55 °CNot indicated[36]0.20 (a)Steer manure55 °CNot indicated[21]
4.32 (b)Animal manure, food industrial organic waste53 ± 1 °CNot indicated[22]0.39 (b)Steer manure55 °CNot indicated[21]
0.85Municipal wastewater biosolids55 °CNot indicated[1]
1.20Cattle manure53–55 °CNot indicated[37]
1.43 (b)Animal manure, food industrial organic waste53 ± 1 °CNot indicated[22]
if stated: (a) unacclimatised, (b) acclimatized.
Table 2. Characteristics of the substrates. Gas volumes are given under standard temperature and pressure conditions (0 °C, 101.325 kPa). Units are given in square brackets. Values are given as mean; the standard deviation is given in round brackets.
ParameterInoculumMaize SilageSoybean Meal
#1#2
DMFM (a) [g∙kg−1]59.80 (2.99)103.75 (5.18)377.61 (18.88)887.99 (18.46)
VSDM (b) [g∙kg−1]738.74 (36.93)789.74 (39.48)907.38 (45.37)927.19 (4.06)
TKNFM (c) [g∙kg−1]3.34 (0.70)7.14 (0.36)4.00 (0.20)67.83 (3.39)
NH4+FM (d) [g∙kg−1]1.35 (0.07)5.00 (0.25)0.60 (0.03)9.50 (0.48)
pH7.44 (0.37)8.42 (0.42)NANA
SMYVSe) [L∙kg−1]25.78 (1.30)88.43 (4.42)330.66 (15.08)423.16 (21.11)
(a) Dry matter (DM) related to fresh matter (FM), (b) volatile solids (VS) related to DM, (c) total Kjeldahl nitrogen (TKN) related to FM, (d) ammonium related to FM, e) specific methane yield (SMY) related to VS.
Table 3. Concentrations of trace elements in the reactors over the trial period, in mg∙kg−1 related to dry matter. Feeding regime expresses the N-increase rate in a feeding ratio. Values are given as mean; standard deviation is given in brackets.
InoculumFeedingWeek
Regime4561724
Fe
10-increase1827.94 (91.40)1625.38 (81.27)1463.40 (73.17)936.00 (77.78)2105 (106.07)
10.25-increase1515.01 (75.75)1512.09 (75.60)1449.05 (72.45)1120.00 (367.70)1810.00 (84.85)
10.5-increase1625.33 (81.27)1368.86 (68.44)1402.16 (70.11)837.50 (74.25)1835.00 (134.35)
20-increase3055.97 (102.47)2986.89 (246.08)2779.68 (138.98)2835.00 (473.76)3795.00 (700.04)
20.25-increaseNANANA2840.00 (339.41)3540.00 (650.54)
20.5-increase3116.76 (155.84)2846.76 (142.34)2705.63 (135.28)2910.00 (14.14)3380.00 (183.85)
Ni
10-increase12.06 (0.60)11.70 (0.59)10.99 (0.55)5.33 (2.26)21.25 (0.21)
10.25-increase6.81 (0.34)6.92 (0.35)6.57 (0.33)15.79 (14.02)21.15 (8.41)
10.5-increase7.72 (0.39)6.29 (0.31)6.76 (0.34)8.17 (3.16)21.20 (1.27)
20-increase8.14 (0.29)8.62 (0.06)8.45 (0.42)9.22 (1.05)21.10 (0.28)
20.25-increaseNANANA9.97 (0.18)20.80 (0.85)
20.5-increase13.82 (0.69)13.81 (0.69)13.1 (0.66)12.85 (0.49)20.45 (3.18)
Mo
10-increase4.91 (0.25)4.83 (0.24)4.83 (0.24)2.85 (0.08)5.02 (0.15)
10.25-increase4.32 (0.22)4.66 (0.23)4.62 (0.23)4.39 (0.92)6.49 (0.59)
10.5-increase4.93 (0.25)4.39 (0.22)4.84 (0.24)4.06 (0.33)7.145 (0.49)
20-increase5.18 (0.39)5.57 (0.34)5.59 (0.28)5.22 (0.66)7.32 (1.01)
20.25-increaseNANANA5.29 (0.25)7.61 (0.95)
20.5-increase5.70 (0.28)5.77 (0.29)5.78 (0.29)5.67 (0.40)7.56 (0.35)
Co
10-increase1.14 (0.06)1.17 (0.06)1.12 (0.06)0.51 (0.02)1.90 (0.08)
10.25-increase0.98 (0.05)1.07 (0.05)1.03 (0.05)0.76 (0.31)1.71 (0.15)
10.5-increase1.05 (0.05)0.95 (0.05)1.04 (0.05)0.65 (0.09)1.83 (0.15)
20-increase1.23 (0.10)1.28 (0.01)1.25 (0.06)0.91 (0.11)2.11 (0.25)
20.25-increaseNANANA0.94 (0.02)1.90 (0.28)
20.5-increase1.36 (0.07)1.38 (0.07)1.35 (0.07)0.99 (0.01)1.79 (0.06)
Se
10-increase0.51 (0.03)0.49 (0.02)0.73 (0.04)0.34 (0.04)1.60 (0.14)
10.25-increase0.62 (0.03)0.42 (0.02)0.64 (0.03)0.41 (0.05)1.85 (0.07)
10.5-increase0.61 (0.03)0.50 (0.03)0.68 (0.03)0.40 (0.03)2.00 (0.28)
20-increase1.19 (0.18)1.22 (0.07)1.12 (0.06)0.85 (0.13)2.20 (0.42)
20.25-increaseNANANA0.85 (0.05)2.10 (0.28)
20.5-increase1.25 (0.06)1.12 (0.06)1.18 (0.06)0.88 (0.02)1.90 (0.00)
Table 4. The results of analysis on inhibition in specific methane yield (SMY). Feeding regime expresses the N-increase rate in a feeding ratio. Degrees of freedom (DF). SMYt and SMYm are the theoretical and measured values of specific methane yield, respectively. Gas volumes are given under standard temperature and pressure conditions (0 °C, 101.325 kPa). Units are given in square brackets. Values of SMYt and SMYm are given as mean; the standard deviation is given in round brackets.
InoculumFeeding RegimeDFSMYt (L∙kgVS−1)SMYm (L∙kgVS−1)t-Valuep-Value
10-increase148304.65 (11.80)298.68 (4.44)1.700.05
10.25-increase182323.71 (18.17)302.41 (51.70)5.420.00 *
10.5-increase182333.36 (21.78)289.81 (55.09)9.530.00 *
20-increase141296.65 (10.57)264.50 (55.87)6.550.00 *
20.25-increase141313.72 (16.48)269.99 (46.99)10.290.00 *
20.5-increase141325.72 (22.40)257.87 (60.36)11.620.00 *
* Significant at p-value = 0.0001.
Table 5. The effect of total ammonia nitrogen (TAN) and free ammonia nitrogen (FAN) on the inhibition in specific methane yield: the results of the fitted model. Degrees of freedom (DF). The square-root transformed values of inhibition in specific methane yield (sqrt_Inhibition); the transformation was done for meeting the requirements of the model.
Dependent Variable EffectNumerator DFDenominator DFF-ValueR2p-Value
sqrt_InhibitionTAN130.719.080.200.0001
sqrt_InhibitionFAN116.515.110.150.0012

