Abstract
Although mud pumps are vital components of a drilling rig, their failures are frequent. The identification of technical condition of these high-pressure piston pumps is difficult. There are no reliable criteria for the assessment of mud pump condition. In this paper, faults of the pump valve module are identified by means of acoustic emission (AE) signals. The characteristics of these signals are extracted by wavelet packet signal processing. This method has been verified by experiments conducted on a NOV (National Oilwell Varco) -made triplex 14-P-220 mud pump (mounted in the drillship). The results show that the wavelet packet signal processing method can effectively extract the frequency band energy eigenvalues of the signals. Besides, some operational problems associated with high pressure piston mud pumps are presented. A non-invasive method for diagnosing the technical condition of such pumps is being developed at the Maritime University of Szczecin.
1. Introduction
The search for new gas and oil deposits in seas and oceans is carried out by specialized vessels equipped for drilling at great depths. On-board drilling equipment has to meet extremely strict and critical requirements. Drilling at great depths is feasible by latest generation ultra deepwater drillships. These authors are conducting research aimed to develop a non-invasive test method and construct a diagnostic system capable of identifying the condition of mud pumps on deepwater drillships.
There have been few attempts to use elastic waves to diagnose the condition of mud pumps. Most of the studies refers to pumps installed in land-based drilling rigs [1,2,3]. In the case of drillships, specific factors have to be taken into account in condition monitoring. For instance, the pumproom, with its relatively small surface area and structural integrity, houses a number of independently working devices. Many traditional systems monitoring the work of devices installed on ships are based mainly on the control of vibration processes. However, they determine symptoms related to certain problems occurring in the entire area of machine foundation. It is difficult to identify with certainty the specific place of origin, even more so to identify the element itself that generates increased level of vibrations. In their other works, these authors propose to directly monitor processes that result in early wear or damage. Further, the source originating these processes can be identified. High frequency elastic waves allow us to separate other signals, coming from nearby devices. Due to the relatively high frequency of the received AE elastic wave, we can be sure that it comes from the ‘close’ surrounding of the measuring sensor. Like in typical phenomena related to elastic wave propagation, the waves from other sources (farther from the sensor) will attenuate by themselves. Diagnostic methods using AE signals in shipboard conditions may significantly enhance diagnostic accuracy.
Major advantages of AE-based diagnostics include:
- Independence of the environment in which the measurement takes place;
- Higher sensitivity to the detection of damage (before an external symptom is visible), compared to traditional measurements (vibrations, pressures, temperature, etc.);
- Applicability for most machines, regardless of their technical condition;
- Ability to identify the AE signal source location in the tested object.
The drillship is a self-propelled vessel equipped with most advanced dynamic positioning (DP) systems (Figure 1). Its characteristic derrick and technologically advanced ancillary equipment are used in the drilling of wells in ocean floor rocks.
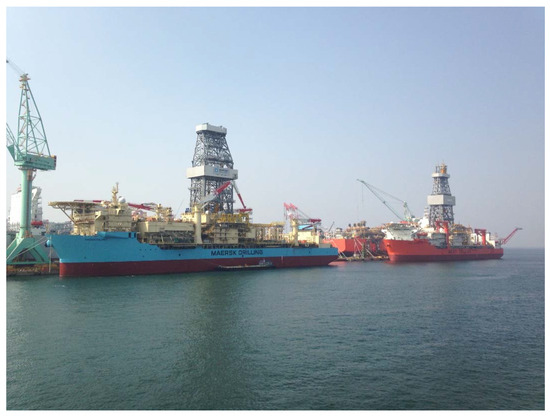
Figure 1.
An ultradeep water class drillship.
The present study took place on ultra deepwater class drillships, intended for drilling wells at depths to 3600 m and hole length of up to 12,000 m. Such vessels, equipped with the latest systems of dynamic positioning, are capable of keeping the vessel in place at different weather conditions (with waves up to 11 m and wind speed to 26 m per second). The ship’s position is maintained by six azimuth propellers, with a power of 5500 kW each.
2. An Analysis of Drillship Mud Pump Failures
Geological drilling on land and in the seabed is a highly advanced technological operation. Exploration in quest of oil and gas deposits takes place in increasingly deeper waters, which is possible thanks to latest drilling technologies. The process of drilling a hole in the ocean floor requires the use of special drilling fluids, which are primarily intended for taking away rock cuttings from under the drill bit and conveying them onto the surface. Other important functions include securing the well.
Drilling fluids are pumped from an oil rig down to the well by high pressure mud pumps, the main element of the high-pressure drilling fluid system, shown in Figure 2. It is the most important technical system on a drilling platform, often regarded as the ‘heart’ of the drilling process. Yet, there are no reliable diagnostic tools that would identify the technical condition of the pumps [4,5].
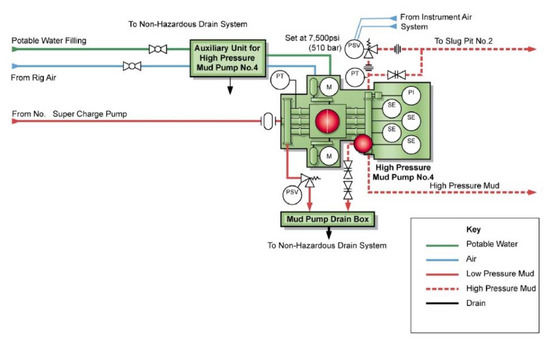
Figure 2.
The system of a mud pump installed on a drillship [4].
Mud pumps installed on drillships require operational supervision of machines carried out continuously or periodically. Regardless of the adopted maintenance system, there are no tools to predict a failure. These authors are working on developing a method and designing a diagnostic system aimed to detect an early stage of changes/disturbances in the operation of a machine. The drilling process will not be affected if repairs are planned and performed as soon as practicable, without emergency shutdown of the running machine.
To confirm the importance of the issue, we have analysed the number of failures associated with mud pumps on one of the deep-water drilling rigs over the past three years. It has been shown that the most common type of failure referred to suction-discharge valves of the said pumps, displayed in Figure 3. Our studies have also shown that the periods between repairs differ significantly from those recommended by the manufacturer. These differences are due to the use of varied chemical composition of mud, quality of operation, and the adopted strategy of maintenance [6,7].
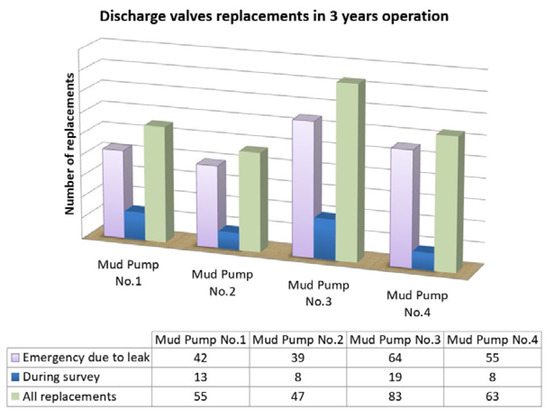
Figure 3.
Analysis of the replacements of mud pump discharge valves on drillships [6,7].
The actual damage versus manufacturer’s recommendations to the mud pumps is shown in Figure 4.
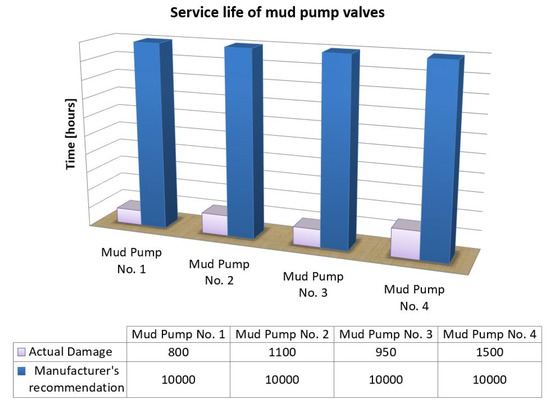
Figure 4.
The service life analysis of mud pump valves on drillships [6,7].
The pump on which this study focused is a three-piston single-acting pump, referred to as the triplex pump. The drilling mud pump can be divided into two subunits, ‘fluid end’ and ‘power end’, as shown in Figure 5.
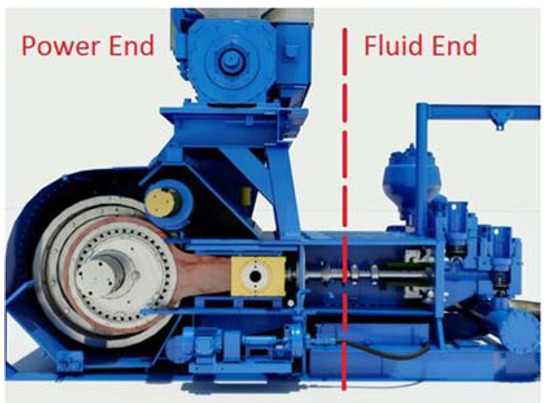
Figure 5.
The mud pump made by NOV, divided into two most important components [7].
The fluid end is that part of the pump where pumping of liquids takes place, using such elements as pistons, cylinder liners and valves. Because drilling mud contains chemically aggressive substances, the life cycle of these elements is vitally reduced. That is the because of their earlier wear and unpredictable breakdowns.
The power end module is responsible for changing the rotary motion of the crankshaft into the reciprocating motion of the pistons. The crankshaft is driven by gear transmission connected to two AC/DC motors. In order to reduce vibration and pressure pulsations, pulsation dampeners are employed on the suction and delivery sides of the pump.
Offshore drilling companies Rowan Companies (RDC), Ensco (ESV), Seadrill (SDRL), Diamond Offshore (DO), Noble Corporation (NE), Transocean (RIG), and Ocean Rig (ORIG) rent out rigs to their customers and charge a day rate for this service. The day rate covers the daily rental fee charged to oil drilling companies, but it only includes rig and labor costs—not the remaining costs related to the operation of the whole facility, such as equipment rent and chemicals. Figure 6 depicts the utilization and new contract day rate trends for the world’s ultra-deepwater drillship fleet [8,9]. For more cost-effective operation, and for personnel safety, it is important to seek methods of pump technical condition identification. The ideal solution would be to find diagnostic measures (descriptors) that would allow us to predict well in advance the technical condition of the vital elements of mud pumps.
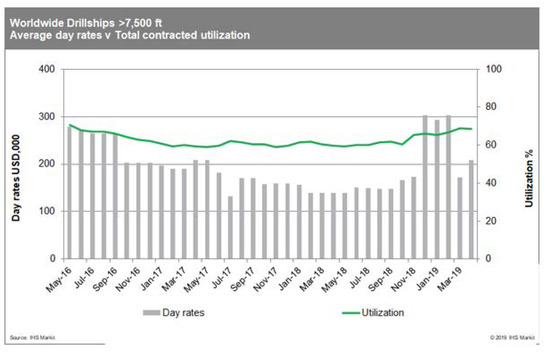
Figure 6.
Offshore rig day rates [8,9].
The authors propose to use the propagation of acoustic emission elastic waves, or more specifically, the generation of certain characteristic frequencies associated with a particular kind of machine fault. In a classical case, in terms of physics, acoustic emission is a phenomenon of spontaneous generation of elastic waves by regrouping the internal structure of solids (seldom liquids) and physical systems. Elastic waves are also excited by sources affected by a physical process, such as flow of a medium, friction or local, dynamic change in the structure of the material (e.g., hitting of a valve head).
Failures related with mud pumps, or more precisely with leaking valves in the fluid end, might often be avoided through the implementation of the proper maintenance strategy [6].
If a valve (see Figure 7) works more than 500 h at 100 cycles per minute, the spring will be subjected to 3,000,000 cycles. Given that, from a technical point of view, the spring should be replaced at each valve replacement. However, it is not the case for two seemingly mundane, yet existing in practice important reasons. In actual operations, one reason is minor: spare springs are not supplied with the valve as the recovery package (the valve and the spring are ordered as separate items). The other reason is the lack of users’ knowledge about the technical condition of the springs, thus the necessity of their replacement.
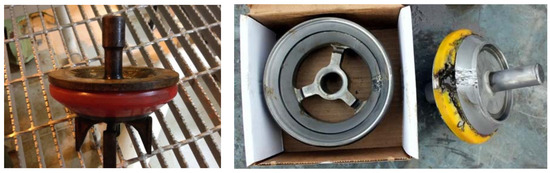
Figure 7.
A new valve head (left) and damaged seat and head of a mud pump valve (right) [4,6].
In operational practice, we should also consider other principles in order to maximize the life cycle of valves. First of all, when a valve is replaced, it is imperative that the valve seat should be replaced, too (and vice versa).
There are two sealing surfaces in the valve-seat interaction (see Figure 8). Where the function of one of them is impaired, the whole unit stops being tight (there is simultaneous erosive and abrasive impact of the working fluid on the working element).
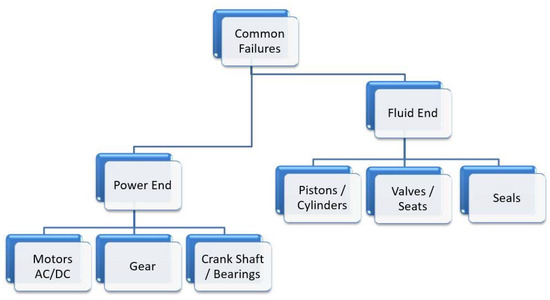
Figure 8.
A fault tree for mud pumps.
One of the surfaces is an elastomer valve insert. Its primary function is to make the valve tight when it is closed. Valve inserts may be repeatedly replaced before the whole valve head-seat unit is replaced. The actual observations show that inexperienced personnel are often not aware of that. The other sealing area is the interface of bearing surfaces (metal-metal). Two metal surfaces touch each other when the valve rests in the seat. When a new valve head and seat are mounted, both surfaces are perfectly smooth. On a flawless surface, destructive forces are evenly distributed.
The valve modules are those parts that, when damaged, must be sent ashore for repair. Their most common defect is erosion-cavitation wear. An important part of the module is its cover and cover sealing. The cover is tightened or closed in different ways, depending on manufacturer’s recommendations. The most important thing we should pay special attention to is hydraulic pressure of the press during the tightening of cover bolts. This pressure is very carefully specified by the manufacturer, and so is the module opening and closing procedure (while exchanging the valve, its seat or any other parts). Hasty and chaotic repair or failure to conform with the procedures may lead to grave consequences. It should be borne in mind that the pressure in the valve module reaches 515 bar. Leaks resulting from incorrect installation are cause by an insufficiently tightened valve cover. In this case, fastening the cover will not be a remedy: new seals will have to be mounted.
The gasket under the valve cover is also often neglected, while it should be checked during each valve cover removal.
3. Analysis of Typical Failures of Mud Pumps in the “Power End” and “Fluid End”
The most common problems related directly to mud pump breakdowns are shown in Figure 8. The fluid end subunit most often suffers from leaks. In the case of leaks related to the wear of piston-cylinder interface the symptom that indicates damage is the contamination of water cooling the cylinder liners (visible even if damage is minor), because working in the closed circuit the water returns to a cooling water tank. The problem relates to both discharge and suction valves. The wash-outs of this kind are not visible. They can be detected only in advanced stages of damage when it is quite difficult to maintain a constant discharge pressure. In this case, it is necessary to stop the pump and replace the valves. The problem however is to identify which valve is damaged or which of them starts to malfunction. Experienced users attempt to assess the condition of these valve “by the ear”. These methods are, however, inaccurate and unreliable and involve comparing acoustic effects from the particular pump subunits at 15-min intervals.
The power end module, if properly maintained, mainly by controlling the lubricating oil quality and frequency of replacement is the component least subject to damage. Theoretically, it is possible the overload electric motors causing a fracture of the crankshaft, while in practice there are safeguards preventing the pump from reaching critical parameters. The gear transmission conveying the drive from electric motors to the pistons is liable to damage mostly caused by the malfunctioning of the lubricating system. The systems used are mostly based on monitoring of parameters, e.g., too low pressure on the oil pump or filter blockage. When such symptoms occur, an emergency stop of the pump takes place.
4. Most Frequent External Factors Causing Mud Pumps Failures
External factors affecting the most vulnerable components such as valves include erosion, abrasion, corrosion, degradation caused by the chemical interaction of aggressive liquids and the temperature of the liquid pumped. Based on the visual check of worn out valve head-seat units we can find out which of the external factors affected its operational condition. An examined component may show that a few factors have had impact on its condition. As a rule, wear analysis leads to an observation that one type of wear was a primary cause of damage, the other are secondary consequences [4,6]. Table 1 classifies most frequent causes of mud pump component failures.

Table 1.
Main causes of mud pump component failures [4].
The causes of mud pump failures described in the table occur usually in combination with each other. For instance, quite often, the frequency of erosive wear depends on which base liquid is used and the associated temperature and chemicals used. Regardless of the cause of damage, from the operating point of it is essential to detect a fault early enough so that the drilling process will not be stopped. In other words, the perfect maintenance strategy would be “the condition forecasting/predicting”.
5. Application of Acoustic Emission for Mud Pump Diagnostics
It is difficult to locate the module where a fault (e.g., noticeable critical drop and fluctuations of pressure) has occurred in the mud pumping system. Classical vibration methods in this case prove useless for a number of reasons, e.g., the presence of large disturbances from other devices in the pump room [3,6]. At the same time, when a leak or other fault is detected, the whole drilling process has to be stopped. Consequently, the operational costs get considerably higher. Any malfunction or failure in the high-pressure system involves health and life risks of the operators.
These authors are developing a method of diagnosing mud pumps, i.e., their valves, as these are essential elements, whose failures or faults are hard to predict. The research is based on one of the most common types of pumps used on drillships (and land-based drilling rigs), triplex 14-P-220 mud pump made by NOV.
According to standard terminology of ASTM E1316-05 [10], acoustic emission (AE) is the class of phenomena whereby transient elastic waves are generated by the rapid release of energy from localized sources within a material, or the transient waves so generated. Acoustic emission is the recommended term for general use. Other terms that have been used in AE-related publications include stress wave emission, micro-seismic activity, and emission or acoustic emission with other qualifying modifiers. AE elastic wave is not confined to the audible domain, and the effective spectral range can extend to several or even tens of megahertz frequency range. The propagation of elastic waves in structural elements and in tested elements of mud pumps is subject to the phenomena of reflection and transformation of vibration modules at the phase boundaries of real objects. Therefore, analytical description of this phenomenon, the basis for measurements by AE method is very complex. It was assumed in the analyses that each of the propagation paths from the source to the point of observation is considered as a separate component in elastodynamic equations. In the AE source the function of amplitude changes in the stress field has a form of a unit/single peak, the sensor is placed in the pump body (housing of the valve unit, and the elastic wave propagates in a homogeneous medium. The basic equation describing the signal propagation path can have this form [11,12,13,14,15,16,17,18,19]:
where Gij (r, ‘t − t; r) denote Green’s functions for dislocation in directions x’i, y’i, z’i in point r’ at instant t, when these dislocations are caused by a local disturbance of stress field in point r at instant t, p refers to the density of the medium [kg/m3], vp the dilatational wave speed, vs the speed of shear wave, γi, γj—for i = 1, 2, 3, j = 1, 2, 3, source the receiver and receiver-source directional cosines, r the distance between AE source and sensor, δij, Cronecker delta, and δ(x), delta function equal to +∞ for x = 0 and equal to 0 for the other values of x.
In real physical systems, such as mud pump system components, energy dissipation always occurs and therefore the amplitude–frequency characteristic functions do not tend to infinity in their resonant states. The effect of frequency change caused by the change in the attenuation rate is important. Wear and tear, and the tribological processes in friction nodes can therefore cause changes in the characteristic frequencies of the process itself. It can then provide relevant diagnostic information. Any damage to the tested facility causes a change in the AE elastic wave signal.
6. The Experiment and the Results
The results of tests performed by the authors refer to mud pumps 14-P-220 of triplex type, mounted on an ultra-deep-water drillship. A series of similar comparative tests for the same type of pumps were conducted during drilling at two different land-based drilling rigs. The sensor was pressed to the determined measurement point with constant force value using a special magnetic grip made by the authors (Figure 9). An AE acquisition system (made at the Maritime University of Szczecin) and an AE sensor with operating frequency range of 20–300 kHz are used. To reduce the scattering of elastic waves, silicon grease, acting as coupling fluid was applied between the sensor and the pump housing. The acoustic emission signal makes it possible to use non-linear methods of signal analysis in diagnostic inference. The following material characteristics are associated with these methods [12,14,15,18,19]:
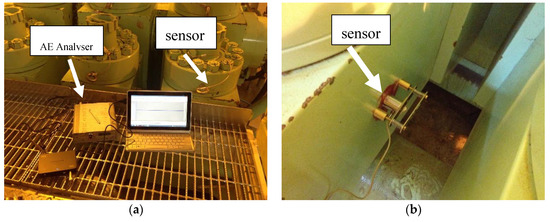
Figure 9.
(a) The measurement of the acoustic emission signal on the mud pump, (b) sensor location.
- ➢
- local deformation hysteresis and discrete ‘memory’ of the material,
- ➢
- downward shift of the frequency resonance band, in proportion to the resonance amplitude, contrary to the classical case, where the shift is proportional to the squared amplitude,
- ➢
- square dependence of the third harmonic amplitude, whereas using the classical theory of non-linearity this dependence should be raised to the third power,
- ➢
- the level of attenuation depends on the amplitude,
- ➢
- the phenomenon of ‘slow dynamics’, i.e., slow recovery of linear properties after the material was subjected to the impact leading to non-linearity.
These effects are associated with large non-linearity, characterizing mainly gases and highly plastic materials (elastomers). In solid substances with crystalline structure, such as metals, the phenomenon of high non-linearity is often associated with degradation, the occurrence of cracks, creep, and other above-molecular defects typical of mezzo-scale damage [11,14,15,16,18,19]. In such cases, local elasticity is different for stretching and compression, and related non-linear effects lead to increased high frequencies of the harmonics. Similar phenomena occur in the case of components of the mud pump valve unit. In the valve unit the two impacts are combined, as it consists of the metal and elastomer parts. The non-linear and non-stationary processes are particularly evident here. Non-linear superposition of waves leads to the exchange of energy between them. This may result in the waves characterized by other frequencies. From the diagnostic point of view, this gives the possibility to use information on frequency changes to the identification and location of damage. The advantage of this method, distinguishing it from other methods of determination of physical and chemical properties of solids and liquids, results from the basic principle of acoustic emission measurement. The source of the recorded signal is the energy generated by the heterogeneity of the examined medium due to external stimulation or normal operation of the object. Based on practical observations, it is assumed that AE signal generated by the pulse source has a form of attenuated sinusoids [10,16]. Electric voltage V1(t), expressed in volts, generated by AE converter during an AE event has this form [11]:
where Am: peak value of voltage recorded in an AE event [V], f0: frequency related to the maximum amplitude of the converter-medium system [Hz], t: time [s], and α1: attenuation coefficient for the examined converter-medium system [1/s].
The above formula can be modified to take into account the time of signal increase during AE event recording [10,16].
where A1, α2, β are parameters of signal shape during AE event.
The terms (1) and (2) describe the burst type emission. Such signals are integrable and differentiable by analytical methods, which is used further in defining descriptors of acoustic emission. As mentioned earlier, the method uses phenomena occurring during the propagation of acoustic emission (AE) elastic waves. Once the measuring points were selected, the source signal of AE elastic waves was recorded (Figure 10). The signal illustrates successive stages of pump operation, including signals picked up from particular elements of the pump. Figure 11 and Figure 12 present a comparative analysis of the signal from the correctly working, failure-free pump and (Figure 13) from a pump with an initial stage of elastomer insert damage. The signal is interesting from the operational and diagnostic perspective as the existing fault is not yet generating any external symptoms. This offers a possibility of “predicting” technical condition well in advance. The valve condition does not necessitate the suspension of the drilling process but scheduling a repair.
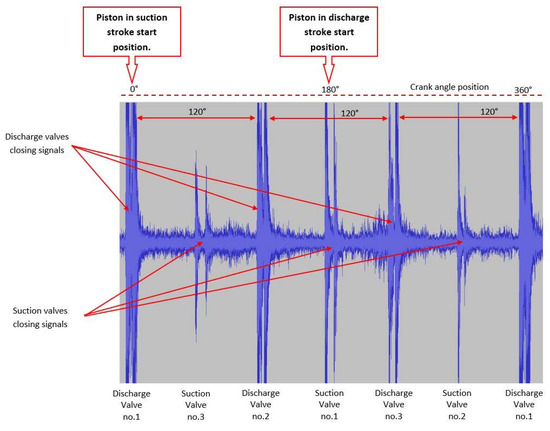
Figure 10.
AE signal source from the running pump valves, with indicated stages of valve operation.
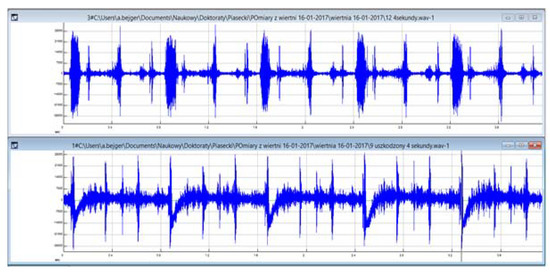
Figure 11.
Changed signal generated by a valve head-seat unit failure. The comparison of the signal source of AE elastic waves from properly working valve unit of a mud pump (up) and early condition of the valve unit failure (down).
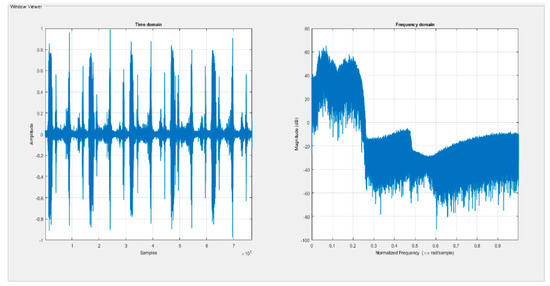
Figure 12.
Analysis of the signal from the correctly working mud pump valve. The amplitude-time signal (left) and magnitude (dB) as a function of frequency (right).
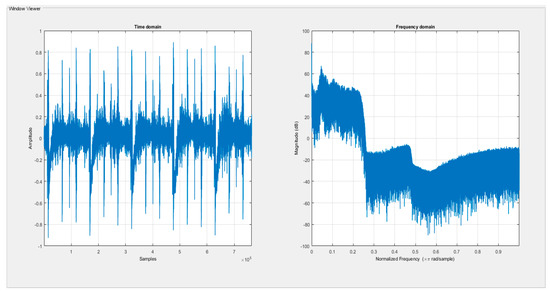
Figure 13.
Analysis of the signal derived from working mud pump with a damaged valve (no external symptoms could be observed by persons responsible for the pump operation). The amplitude-time signal (left) and magnitude (dB) as a function of frequency (right).
Applying the previously described reasoning for a fault of a mud pump valve module system, we can find a symptom that indicates extending damage. It can be stated that in selected narrow bands, mainly low-frequency bands, the ordinary time-frequency function should be sensitive to even minor damage of valves’ module. The most common forms of damage include abrasive wear, erosion, and cavitation wear. Therefore, in the analysis of feeding (pressing) the fluid to the valves, changes in the non-linear response of the system can be found. For better insight concerning the detected fault, the signals were subjected to wavelet decomposition (see Figure 14 and Figure 15) using the Haar wavelet [19,20,21,22,23,24]. At the seventh level of signal decomposition (a7), there is a clearly visible effect from a defective valve. From the diagnostic point of view, the most essential is that the detected fault is small enough not to generate any external symptoms in pump operation. It is possible to detect damaged valve condition early, or to put it differently, the valve condition can be predicted.
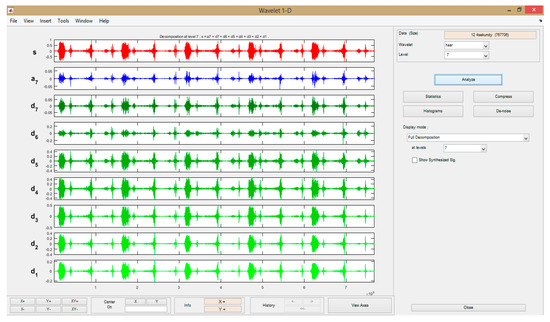
Figure 14.
The wavelet decomposition using the Haar function of a correctly working valve unit.
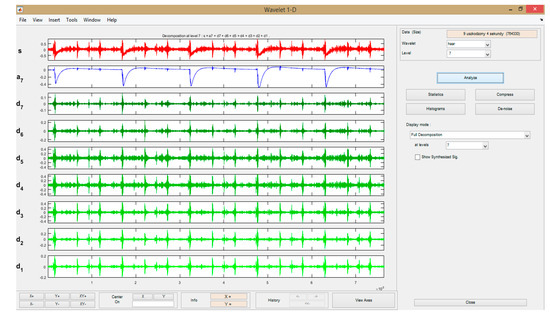
Figure 15.
The wavelet decomposition using the Haar function for early detected fault of the valve unit.
The decomposition method consists in decomposing the signal into a number of functions (levels) with decreasing frequencies in such a manner that each level of decomposition contains a high frequency detail and approximation formed after taking away high frequency details from the signal. After decomposition, for each time series a graph was obtained. Each of the details represented a signal component of different frequency: higher numeral of the detail corresponded to a lower frequency. In Figure 14 and Figure 15, a7 denotes final approximation, while d1 to d7 are high frequency components of the signal.
Frequency components of the signal obtained from the decomposition of the series x(t) are calculated by using the reverse discreet wavelet transformation of series Dj,k and wavelet transformation coefficients Sj,k, and are written as follows:
where N = 2p (N—number of data, p—number of frequency components); j = −p, −p + 1,…, −1 index of scale; k = 0, 1, …, 2j N − 1 index of displacement.
In addition to the AE analyser designed at the Maritime University of Szczecin, we used a professional portable measurement acoustic emission system, Pocket AE2 from MISTRAS (Physical Acoustics Corporation)—Figure 16.
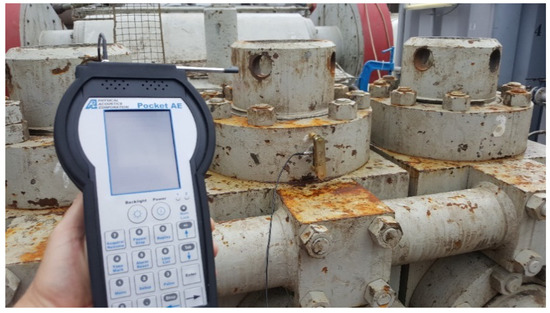
Figure 16.
Portable measurement system Pocket AE2 from MISTRAS.
Figure 17a shows frequencies characteristic of working mud pump valves. The analysis allows us to observe changes of power as a function of frequency (during the drilling process). Energy amplitudes of the acoustic emission are presented in Figure 17b.
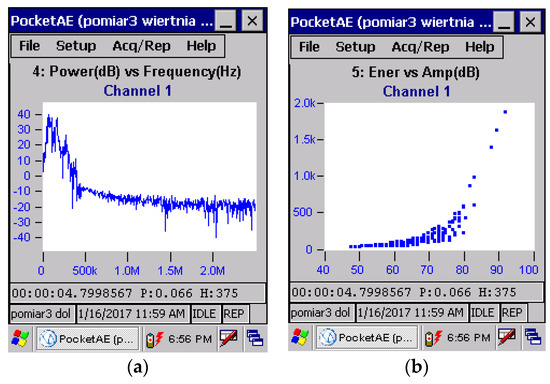
Figure 17.
Analysis of AE signal power as a function of frequency (a) and energy amplitude of a signal (b) from a correctly working pump valve.
In order to observe the frequency variations for valve failure, the time signal was mapped onto a two-dimensional plane, determined by the time-frequency coordinates. In the present case, we exploited the continuous wavelet transform using the Morlet wavelet [24,25,26,27] described by the formula:
The results of the conversion are presented in Figure 18, where the energy component of the signal emitted by the failure is visible in the form of wavelet coefficients (functions of scale and location), the values of which are extended in time, distributed on the time-scale plane, and their frequency has been reduced. The presented method allows for the observation of changes in the symptom we are looking for. Figure 18 shows the wavelet decomposition of an acoustic emission signal emitted by a new valve and a leaking valve.
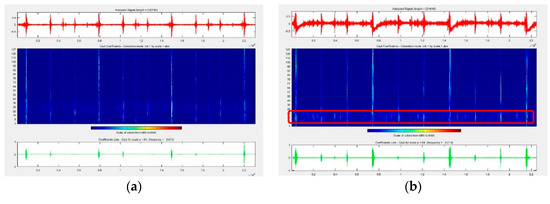
Figure 18.
Wavelet decomposition of the acoustic emission signal emitted by a new valve (a) and a valve with a leak (b).
In the wavelet decomposition, the signal from a damaged valve is visibly affected by low frequency components.
7. Conclusions
The article addresses common problems associated with failures of mud pumps installed on board the drillship Deep-Ship and the related research aiming at developing a method using acoustic emission elastic wave signals for diagnosing the condition of mud pump valves. The authors have analysed external factors that considerably affect the work of elements relevant to the drilling process, or putting it differently, the transition of a device from up state to down state. Some results are presented of the research seeking a reliable method for the identification of the technical condition of mud pumps. From the diagnostic point of view, the development of a condition monitoring method that would enable predicting the state of individual elements of the equipment under consideration before the commencement of drilling is extremely important. Currently, these authors carry out research related to mud pumps used on drillships and in land-based drilling installations. It seems that the acoustic emission signal is a good tool to be used for the identification of their technical condition.
Author Contributions
A.B., T.P. Conceptualization; A.B., T.P. writing—review, editing, layout formatting; A.B., T.P. performed the experiments; A.B. analyzed the data; A.B. supervision; A.B., T.P. methodology. All authors have read and agreed to the published version of the manuscript.
Funding
This research received no external funding.
Conflicts of Interest
The authors declare no conflict of interest.
References
- Deng, S.; Pei, J.; Wang, Y.; Liu, B. Research on drilling mud pump fault diagnosis based on fusion of acoustic emission and vibration technology. Insight Non-Destr. Test. Cond. Monit. 2017, 59, 415–423. [Google Scholar] [CrossRef]
- Hu, D.; Sun, Y.; Fu, J.; Li, J.; Zhang, E. Mud Pump System Fault Tree Analysis. In Proceedings of the 2014 Fourth International Conference on Instrumentation and Measurement, Computer, Communication and Control, Harbin, China, 18–20 September 2014. [Google Scholar]
- Deng, S.; Pei, J.; Wang, Y.; Lin, B. Research on fault diagnosis of mud pump fluid end based on acoustic emission. Adv. Mech. Eng. 2017, 9, 1–10. [Google Scholar] [CrossRef]
- Bejger, A.; Piasecki, T. Technical problems of mud pumps on ultra-deepwater drilling rigs. Sci. J. Marit. Univ. Szczec. 2013, 36, 13–17. [Google Scholar]
- Romagnoli, R.; Bosio, E. Evolution of the Drilling mud Pumping systems: Related safety standards and actual risk analysis upgrades in offshore. In Proceedings of the International offshore and polar engineering conference, Honolulu, HI, USA, 25–30 May 2003. [Google Scholar]
- Piasecki, T.; Bejger, A. The assessment of the operational suitability of mud pumps on deep water drillships depends on maintenance strategy. Sci. J. Marit. Univ. Szczec. 2016, 46, 49–53. [Google Scholar]
- Piasecki, T.; Bejger, A.; Lijewski, S. Problemy eksploatacyjne wysokociśnieniowych pomp płuczkowych stosowanych na statkach wiertniczych. Zeszyty Naukowe Akademii Morskiej w Gdyni 2014, 83, 203–210. (In Polish) [Google Scholar]
- Available online: https://seekingalpha.com/article/4273971-dayrate-and-utilization-trends-show-offshore-drilling-industry-clearly-improving-july-2019 (accessed on 5 January 2020).
- Available online: https://www.offshore-mag.com/rigs-vessels/article/14034933/offshore-drilling-rig-market-set-for-gradual-recovery (accessed on 3 January 2020).
- Acoustic Emission Standard Terminology ASTM E1316-05. Available online: https://www.astm.org/DATABASE.CART/HISTORICAL/E1316-05.html (accessed on 3 January 2020).
- Żółtkowski, B. Basic of Diagnostics of Machines; The University of ATR: Goszcz, Poland, 1996. [Google Scholar]
- Bejger, A. An analysis of chosen engine failures of the seismic research type ships. J. Pol. C. 2011, 6, 9–14. [Google Scholar]
- Bejger, A.; Drzewieniecki, J.B. The Use of Acoustic Emission to Diagnosis of Fuel Injection Pumps of Marine Diesel Engines. Energies 2019, 12, 4661. [Google Scholar] [CrossRef]
- Mobley, R. Maintenance Engineering Handbook, 7th ed.; The McGraw–Hill Companies: Milano, Italy, 2008; Available online: https://www.academia.edu/36703441/Maintenance_Engineering_Handbook_7th_Ed_Mc_GrawHill_2008_.pdf (accessed on 3 January 2020).
- Bejger, A.; Gawdzińska, K. Identification of structural defects of metal composite castings with the use of elastic waves. Arch. Metall. Mater. 2011, 56, 121–125. [Google Scholar] [CrossRef]
- Batko, W.; Dąbrowski, Z.; Kiciński, J. Zjawiska Nieliniowe w Diagnostyce Wibroakustycznej; Biblioteka Problemów Eksploatacji: Radom, UK, 2008. (In Polish) [Google Scholar]
- Weavers, M. Fundamentals of acoustic emission. In Proceedings of the 22nd European Conf. On AE Testing, Prague, Czech, 29–31 May 1996; Robert Gordon University: Aberdeen, UK, 2016; pp. 1–10. [Google Scholar]
- Bejger, A.; Chybowski, L.; Gawdzińska, K. Utilising elastic waves of acoustic emission to assess the condition of spray nozzles in a marine diesel engine. J. Mar. Eng. Technol. 2018, 17, 153–159. [Google Scholar] [CrossRef]
- A Reliable Acoustic EMISSION Based Technique for the Detection of a Small Leak in a Pipeline System. Energies 2019, 12, 1472. [CrossRef]
- Valve Leakage Detection in Industrial Pumps. Available online: www.sine.ni.com (accessed on 25 December 2019).
- Marhaug, A.; Barabadi, A.; Stagrum, E.; Karlsen, K.; Olsen, A.; Ayele, Y.Z. Criticality Analysis for Maintenance Purposes of Platform Supply Vessels in Remote Areas. J. Offshore Mech. Arct. Eng. 2017, 139, 031601. [Google Scholar] [CrossRef]
- Scalerandi, M.; Agostini, V.; Delsanto, P.P.; Van Den Abeele, K.; Johnson, P.A. Local interaction simulation approach to modeling nonclasical, nonlinear elastic behavior in solids. J. Acoust. Soc. Am. 2003, 116, 1–11. [Google Scholar]
- Holroyd, T. Machine & Systems Condition Monitoring Series; Acoustic Emission & Ultrasonics, Coxmoor Publishing Company’s: Oxford, UK, 2000. [Google Scholar]
- Wei, N.; Gu, J.X.; Gu, F.; Chen, Z.; Li, G.; Wang, T.; Ball, A.D. An Investigation into the Acoustic Emissions of Internal Combustion Engines with Modelling and Wavelet Package Analysis for Monitoring Lubrication Conditions. Energies 2019, 12, 640. [Google Scholar] [CrossRef]
- Puliafito, V.; Vergura, S.; Carpentieri, M. Fourier, Wavelet, and Hilbert-Huang Transforms for Studying Electrical Users in the Time and Frequency Domain. Energies 2017, 10, 188. [Google Scholar] [CrossRef]
- Zhang, Q.; Deng, W. An Adaptive Energy Management System for Electric Vehicles Based on Driving Cycle Identification and Wavelet Transform. Energies 2016, 9, 341. [Google Scholar] [CrossRef]
- Wavelet Toolbox For Use With Matlab. Available online: https://www.mathworks.com/help/matlab/ (accessed on 2 March 2020).


© 2020 by the authors. Licensee MDPI, Basel, Switzerland. This article is an open access article distributed under the terms and conditions of the Creative Commons Attribution (CC BY) license (http://creativecommons.org/licenses/by/4.0/).