Interaction of Electrical Energy Storage, Flexible Bioenergy Plants and System-friendly Renewables in Wind- or Solar PV-dominated Regions
Abstract
1. Introduction
- How can EESS and flexible bioenergy contribute to reduce challenges connected to the integration of large shares of vRES in wind or solar power-dominated regions?
- How can system-friendly wind and solar power contribute to reduce challenges connected to the integration of large shares of vRES in wind or solar power-dominated regions?
- What is the interaction of these balancing options?
2. Methodology
2.1. Step 1: Scenario Framework and Variable Renewable Energy Optimization
2.1.1. Scenario Development
2.1.2. Time Series Data for Wind Feed-in, Solar PV Feed-in and Power Consumption
2.2. Step 2: Development of the Prospective Bioenergy Power Plant Fleet
2.3. Step 3: Development of the Prospective Fleet of EESS
2.4. Step 4: Development of an Optimization Model for Scheduling the Fleet’s Operation
3. Scenario Analysis
3.1. Results of CLASSIC Scenarios
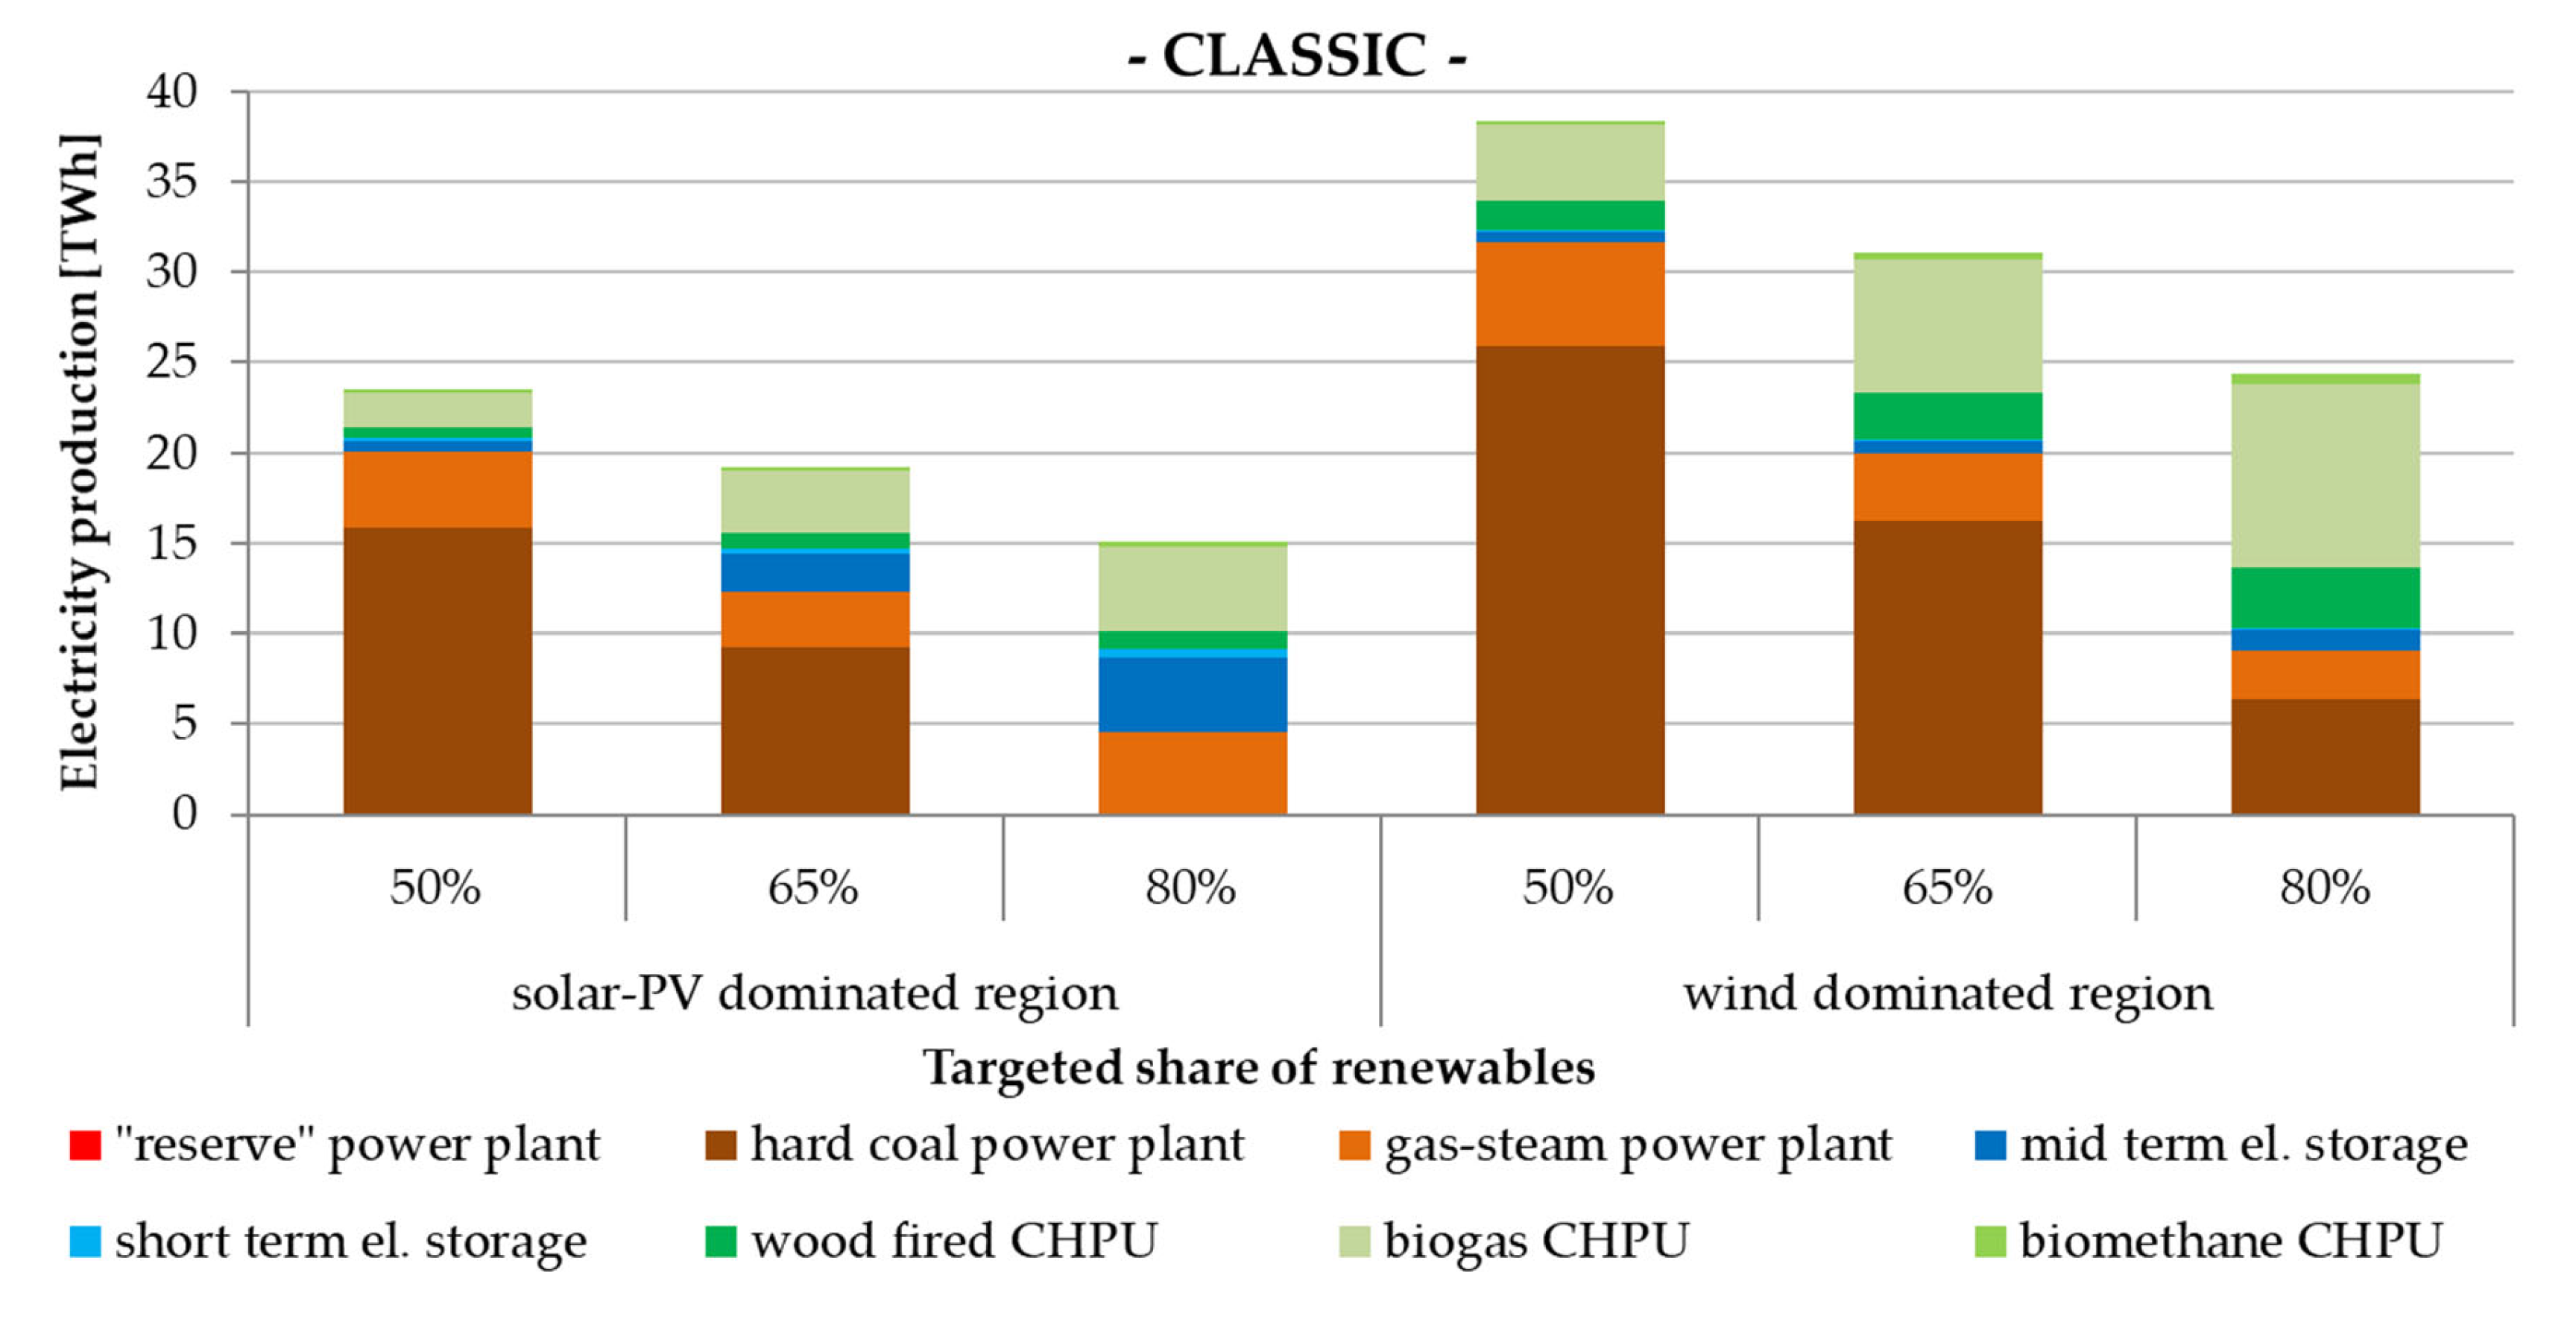
3.1.1. Electricity Production
3.1.2. Achieved share of renewables
3.1.3. Characteristic Figures Regarding Operation of the Different Plants and EESS
3.1.4. Excess Energy and Power
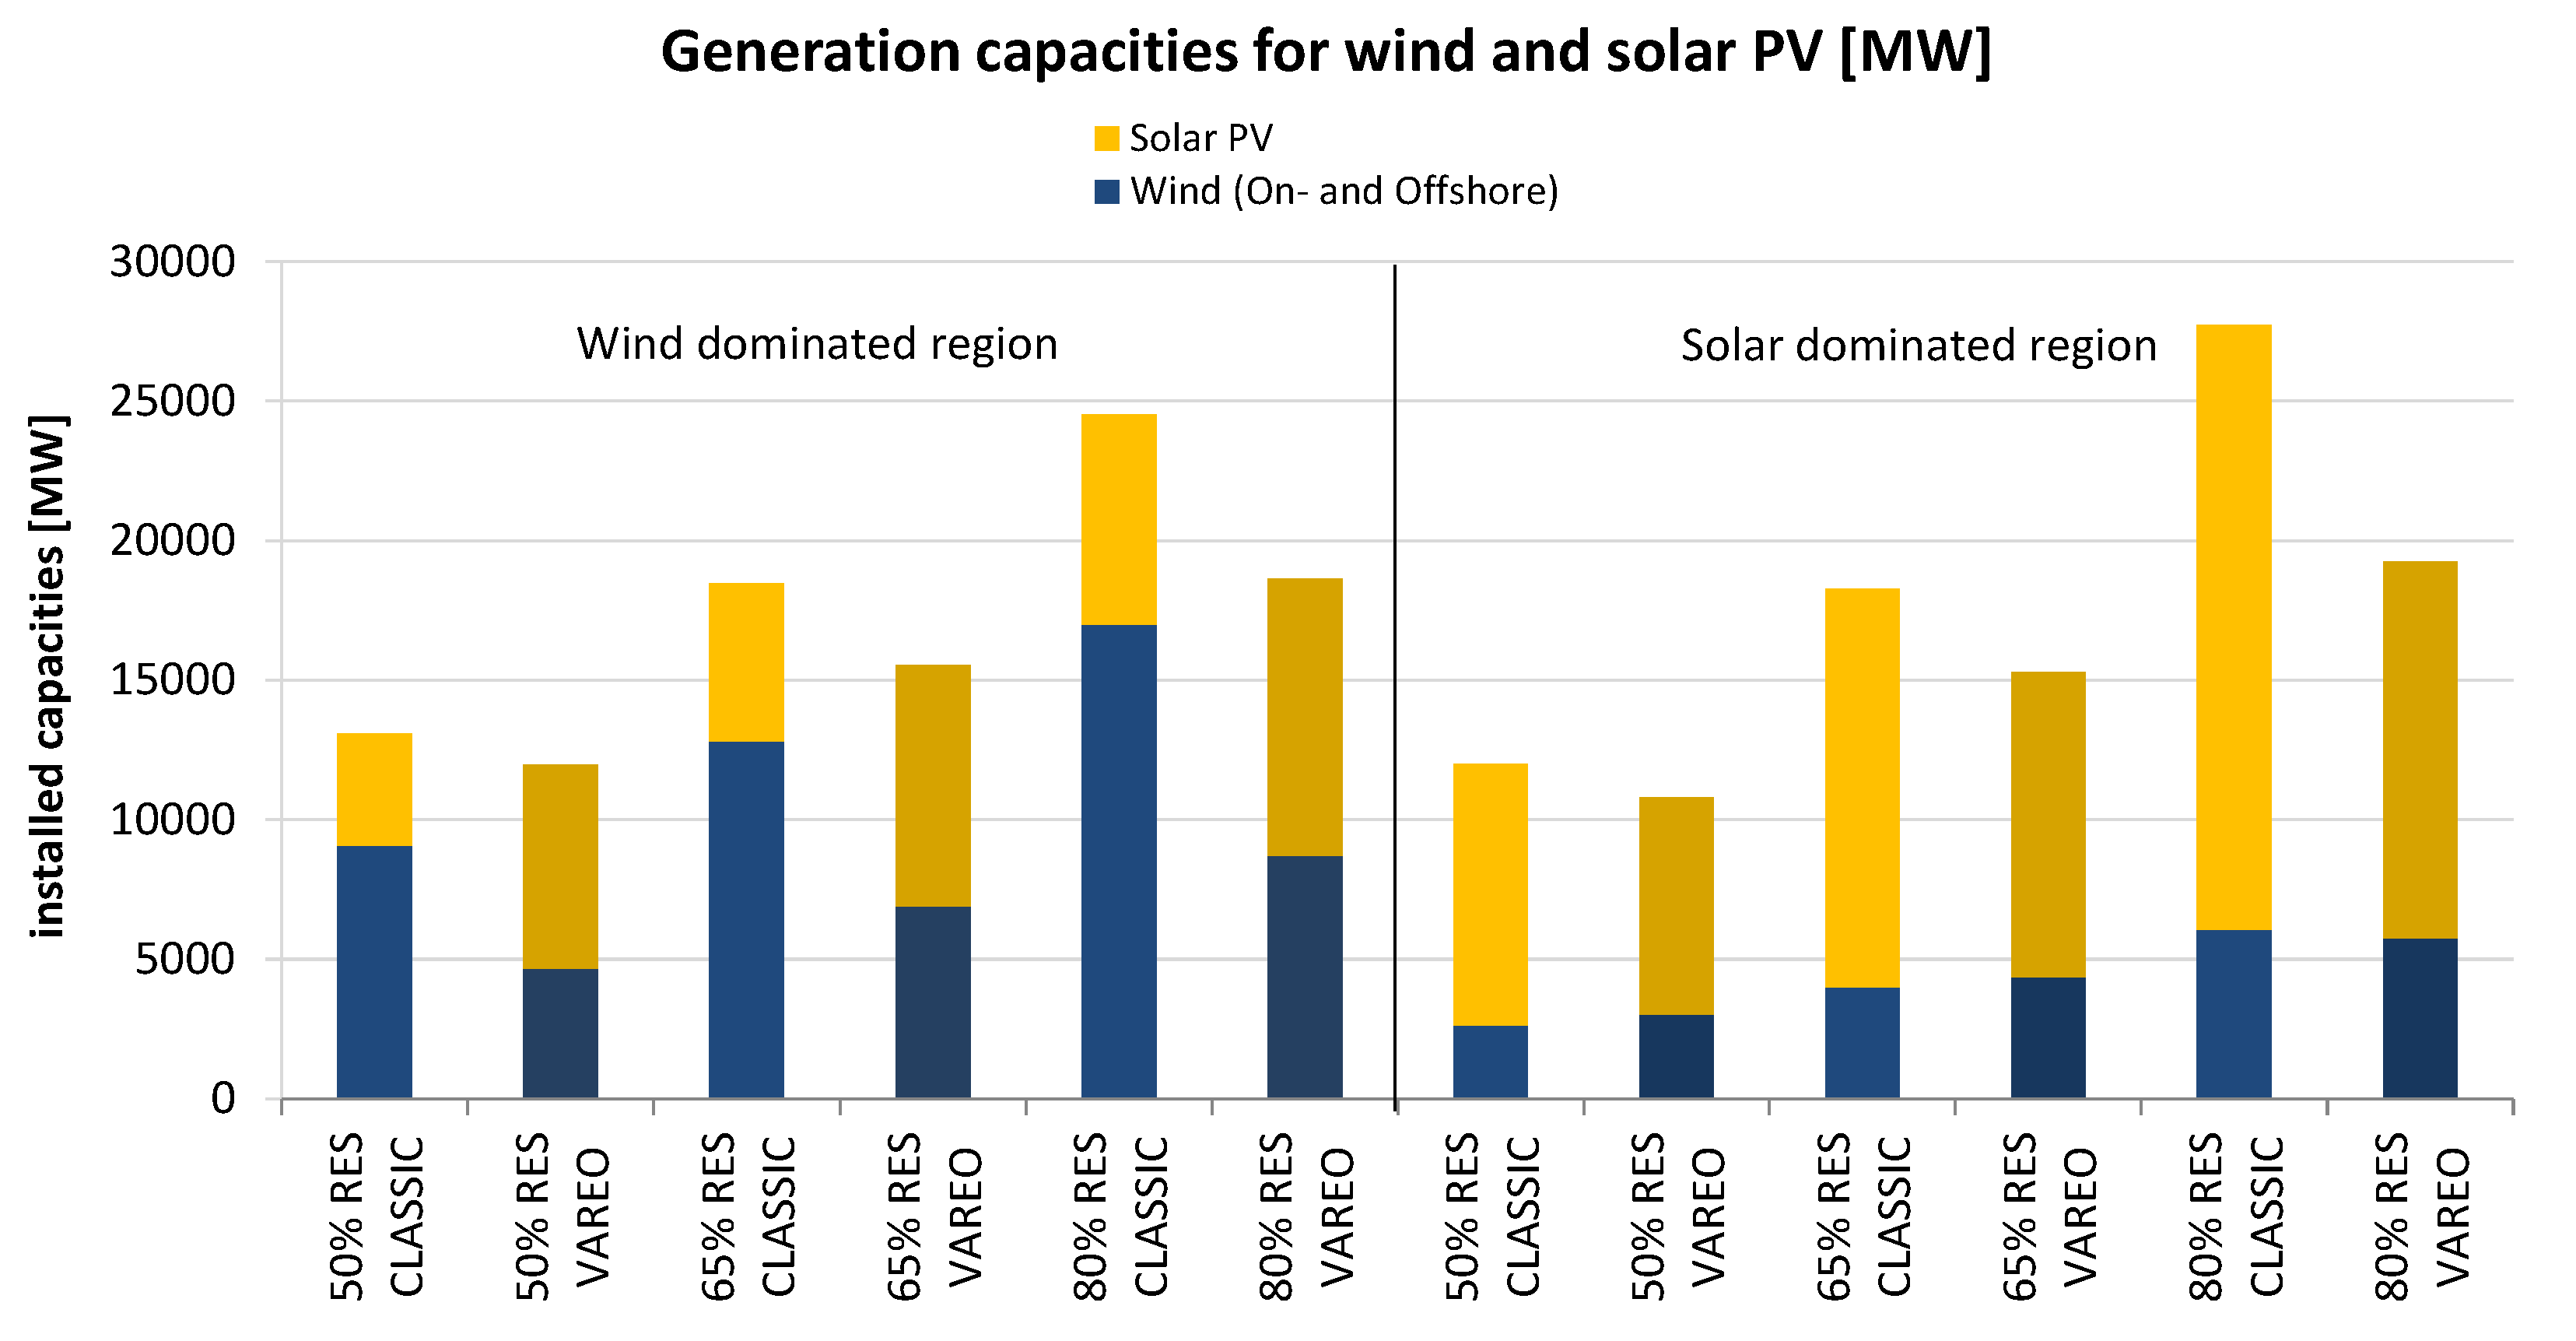
3.2. Results of the VAREO Scenarios
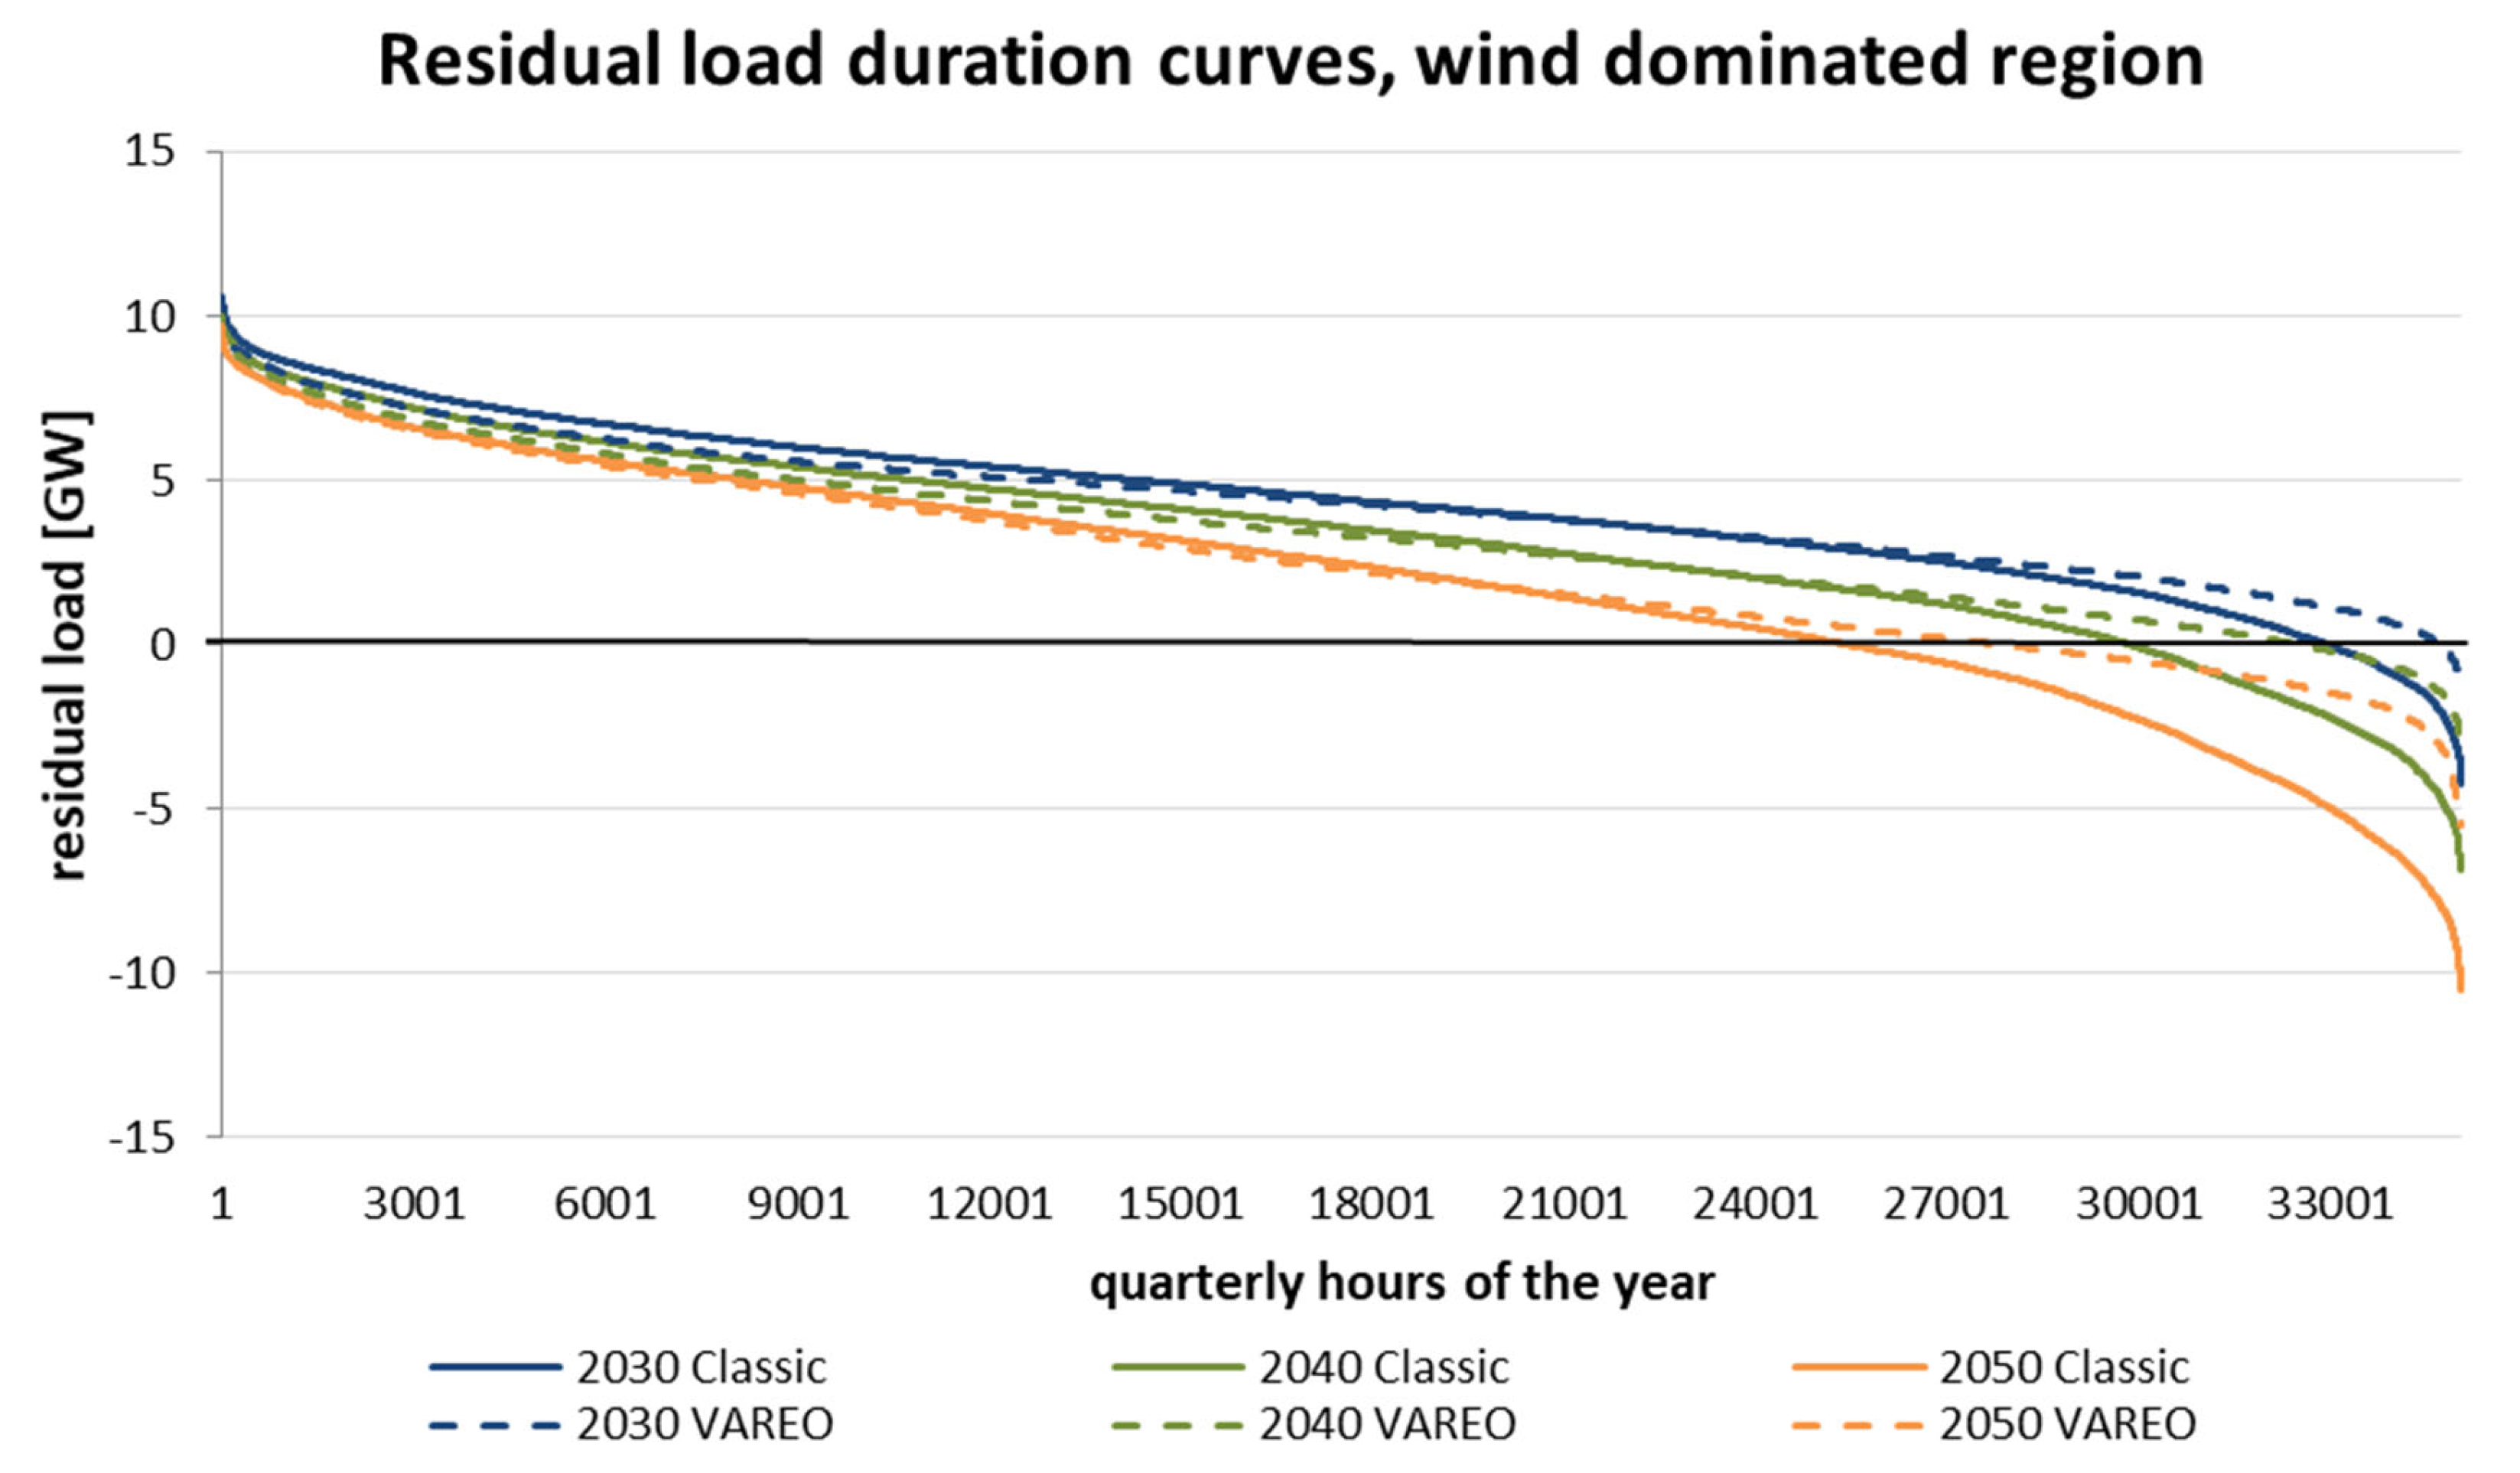
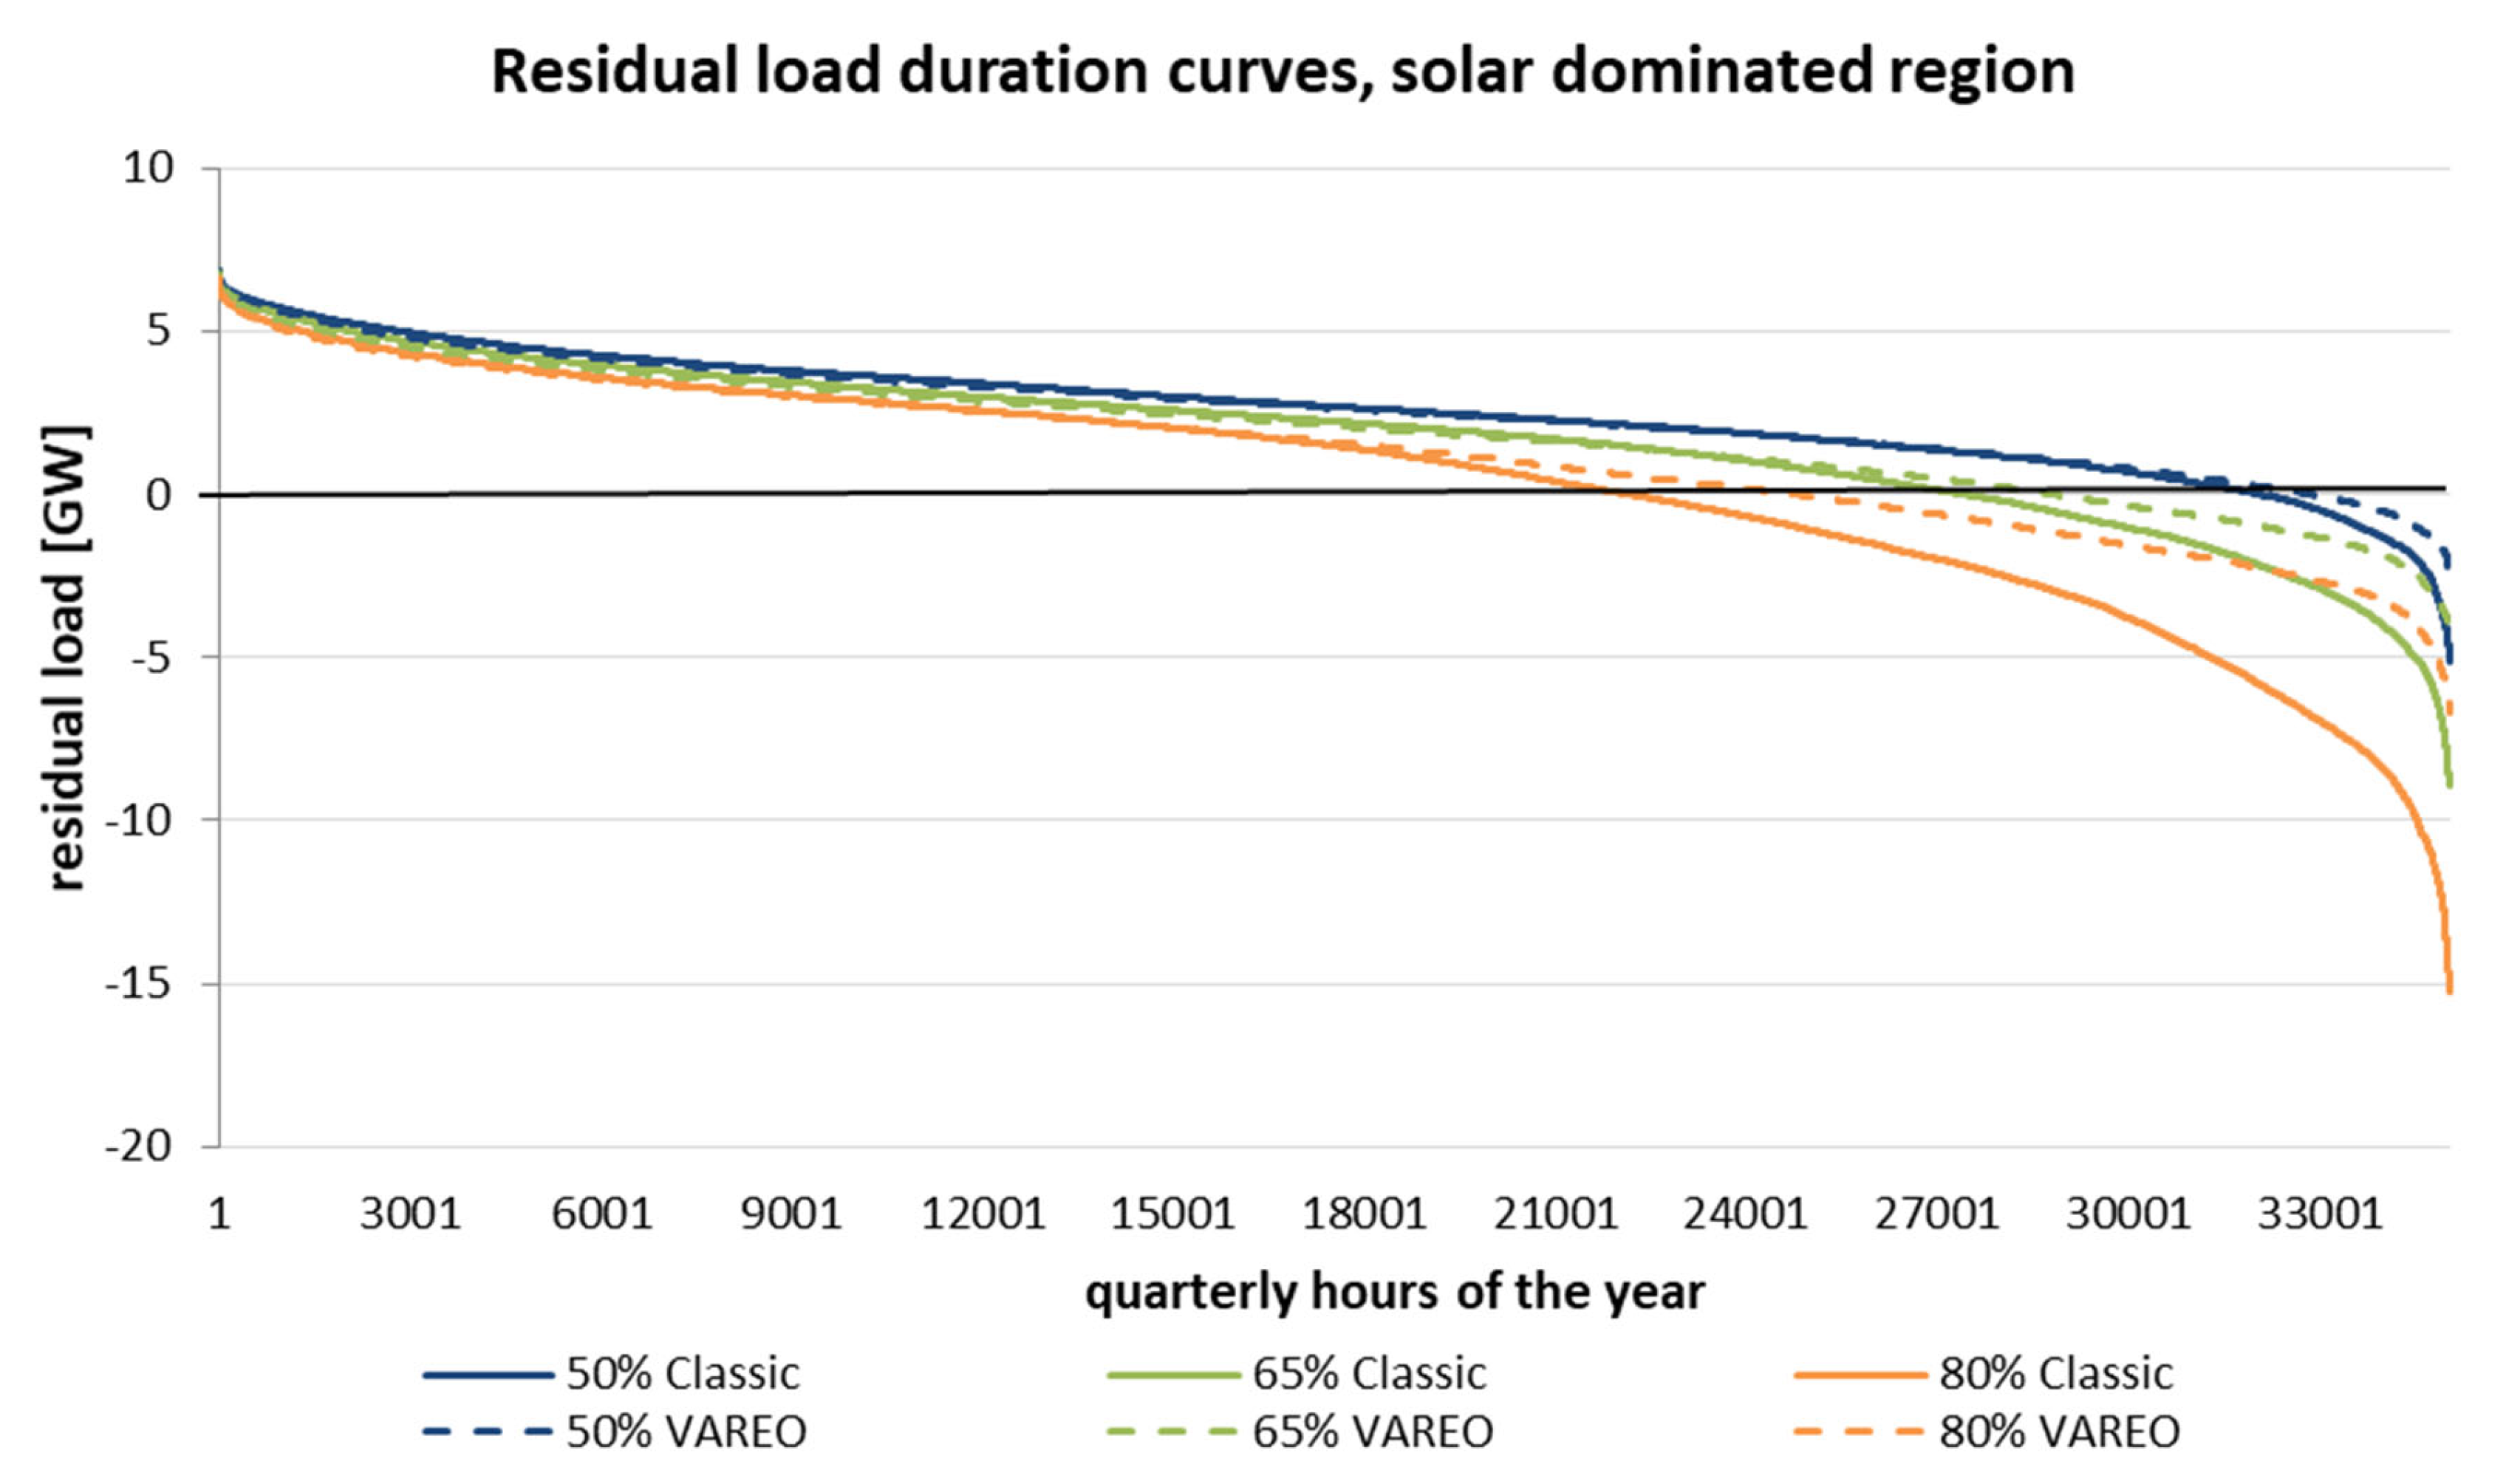
Resulting Residual Load
3.3. Interactions between Different Balancing Options
3.3.1. Results Regarding the Solar PV-Dominated Region
3.3.2. Results for the Wind-Dominated Region
3.3.3. Further Results for Both Regions
4. Conclusions
4.1. Balancing Options: EESS and Bioenergy
4.2. System-friendly Wind and Solar PV
4.3. Discussion and Future Work
Author Contributions
Funding
Acknowledgments
Conflicts of Interest
Appendix A
| Renewables Share | 50% Renewables | 50% Renewables | 65% Renewables | 65% Renewables | 80% Renewables | 80% Renewables |
|---|---|---|---|---|---|---|
| Szenario | CLASSIC | VAREO | CLASSIC | VAREO | CLASSIC | VAREO |
| Solar PV (south oriented) | 9363 | - | 14268 | - | 21655 | - |
| Solar PV (east oriented) | - | 4892 | - | 6611 | - | 8006 |
| Solar PV (west oriented) | - | 2892 | - | 4302 | - | 5503 |
| Wind onshore (1546 FLH) | - | - | - | - | - | - |
| Wind onshore (2300 FLH) | 2625 | - | 4001 | - | 6071 | - |
| Wind onshore (3500 FLH) | - | 3022 | - | 4383 | - | 5746 |
| Wind offshore (3800 FLH) | not available in solar dominated region | |||||
| bioenergy | flexible and non-flexible modelled separately | |||||
| hydro | 707 | 707 | 707 | 707 | 707 | 707 |
| other renewables | 137 | 137 | 137 | 137 | 137 | 137 |
| Renewables Share | 50% Renewables | 50% Renewables | 65% Renewables | 65% Renewables | 80% Renewables | 80% Renewables |
|---|---|---|---|---|---|---|
| Szenario | CLASSIC | VAREO | CLASSIC | VAREO | CLASSIC | VAREO |
| Solar PV (south oriented) | 4009 | 5 | 5660 | - | 7517 | - |
| Solar PV (east oriented) | - | 3953 | - | 4549 | - | 5106 |
| Solar PV (west oriented) | - | 3331 | - | 4089 | - | 4842 |
| Wind onshore (1546 FLH) | 7216 | - | 10189 | - | 13531 | - |
| Wind onshore (2300 FLH) | - | 45 | - | - | - | 25 |
| Wind onshore (3500 FLH) | - | 45 | - | 953 | - | 1213 |
| Wind offshore (3800 FLH) | 1847 | 4576 | 2609 | 5943 | 3465 | 7463 |
| bioenergy | flexible and non-flexible modelled separately | |||||
| hydro | 114 | 114 | 114 | 114 | 114 | 114 |
| other renewables | 330 | 330 | 330 | 330 | 330 | 330 |
| Dimension | Unit | 2013 | 50% RES | 65% RES | 80% RES |
|---|---|---|---|---|---|
| Prated | (kW) | 167 | 175 | 175 | 175 |
| Pinst | (kW) | 288 | 300 | 500 | 700 |
| Pmin | (1∙n−1) | 0.6 | 0.5 | 0.35 | 0.1 |
| mP+ | (1∙n−1∙min−1) | 0.20 | 0.20 | 0.40 | 0.60 |
| mP- | (1∙n−1∙min−1) | 0.50 | 0.50 | 0.75 | 1.00 |
| Cgs | (MWh) | n.a. | n.a. | n.a. | n.a. |
| FLH | (h) | 5080 | 5110 | 3066 | 2190 |
| QP | 1.72 | 1.71 | 2.86 | 4 | |
| SHRflx | (1/n) | 0 | 0.5 | 0.75 | 1 |
| Dimension | Unit | 2013 | 50% RES | 65% RES | 80% RES |
|---|---|---|---|---|---|
| Prated | (kW) | 331 | 330 | 330 | 330 |
| Pinst | (kW) | 434 | 700 | 1050 | 1400 |
| Pmin | (1∙n−1) | 0.6 | 0.5 | 0.4 | 0.3 |
| mP+ | (1∙n−1∙min−1) | 0.2 | 0.2 | 0.4 | 0.6 |
| mP– | (1∙n−1∙min−1) | 0.5 | 0.5 | 0.75 | 1 |
| Cgs | (MWh) | 1.32 | 2.64 | 3.96 | 5.28 |
| FLH | (h) | 6681 | 4132 | 2754 | 2066 |
| QP | 1.31 | 2.12 | 3.18 | 4.24 | |
| SHRflx | (1/n) | 0 | 0.5 | 0.75 | 1 |
| Dimension | Unit | 2013 | 50% RES | 65% RES | 80% RES |
|---|---|---|---|---|---|
| Prated | (kW) | 2497 | 2500 | 2500 | 2500 |
| Pinst | (kW) | 4599 | 4750 | 6000 | 7500 |
| Pmin | (1∙n−1) | 0.8 | 0.7 | 0.6 | 0.5 |
| mP+ | (1∙n−1∙min−1) | 0.07 | 0.1 | 0.2 | 0.4 |
| mP– | (1∙n−1∙min−1) | 0.07 | 0.1 | 0.2 | 0.4 |
| Cgs | (MWh) | 0 | 7.5 | 10 | 15 |
| FLH | (h) | 4756 | 4610 | 3650 | 2920 |
| QP | 1.84 | 1.9 | 2.4 | 3 | |
| SHRflx | (1/n) | 0 | 0.4 | 0.6 | 0.8 |
| AHP Input Data for Medium-Term Electric Energy Storage System for 2030 | ||||
| technical parameters | High-temperature-storage | Compressed-air-energy | Pump-hydro | redox-flow |
| Efficiency (%) | 80 | 69 | 80 | 82 |
| Self-discharge | 5 | 5 | 5 | 5 |
| Plant availability | 4 | 4 | 5 | 4 |
| Cyclebility | 3 | 4 | 4 | 3 |
| Lifespan (a) | 15 | 40 | 40 | 20 |
| Economic parameters | ||||
| Power-related cost (€/kW) | 5 | 23 | 15 | 1 |
| Capacity-related cost (€/kWh) | 1 | 1 | 0 | 0 |
| Value-added competitive | 5 | 5 | 5 | 5 |
| Operating cost (€/(kW∙a) | 45 | 14 | 12 | 6 |
| Starting cost (€/MW) | 2 | 15 | 2 | 1 |
| Environmental effects | ||||
| Land use | 5 | 4 | 1 | 4 |
| Environmental hazards | 2 | 4 | 3 | 3 |
| Operational emissions (kg CO2e/kW) | 0.139 | 0.251 | 0.139 | 0.122 |
| Infrastructure emwissions (kg CO2e/k) | 0 | 27 | 60 | 0.02 |
| Raw material criticality | 4 | 4 | 4 | 4 |
| Sustainability | 3 | 3 | 3 | 3 |
| Acceptance | 4 | 4 | 3 | 4 |
| AHP Input Data for Medium-Term Electric Energy Storage System for 2040 | ||||
| Technical parameters | High-temperature-storage | Compressed-air-energy | Pump-hydro | redox-flow |
| Efficiency (%) | 80 | 69 | 80 | 84 |
| Self-discharge | 5 | 5 | 5 | 5 |
| Plant availability | 4 | 4 | 5 | 4 |
| Cyclebility | 3 | 4 | 4 | 3 |
| Lifespan (a) | 15 | 40 | 40 | 20 |
| Economic parameters | ||||
| Power-related cost (€/kW) | 8 | 23 | 15 | 1 |
| Capacity-related cost (€/kWh) | 1 | 1 | 0 | 0 |
| Value-added competitive | 5 | 5 | 5 | 5 |
| Operating cost (€/(kW∙a) | 45 | 14 | 12 | 4 |
| Starting cost (€/MW) | 2 | 15 | 2 | 1 |
| Environmental effects | ||||
| Land use | 5 | 4 | 1 | 4 |
| Environmental hazards | 2 | 4 | 3 | 3 |
| Operational emissions (kg CO2e/kW) | 0.103 | 0.1852 | 0.103 | 0.079 |
| Infrastructure emissions (kg CO2e/kW) | 0 | 27 | 60 | 0.03 |
| Raw material criticality | 4 | 4 | 4 | 4 |
| Sustainability | 3 | 3 | 3 | 3 |
| Acceptance | 4 | 4 | 3 | 4 |
| AHP Input Data for Medium-Term Electric Energy Storage System for 2050 | ||||
| Technical parameters | High-temperature-storage | Compressed-air-energy | Pump-hydro | redox-flow |
| Efficiency (%) | 80 | 69 | 80 | 85 |
| Self-discharge | 5 | 5 | 5 | 5 |
| Plant availability | 4 | 4 | 5 | 4 |
| Cyclebility | 3 | 4 | 4 | 3 |
| Lifespan (a) | 15 | 40 | 40 | 20 |
| Economic parameters | ||||
| Power-related cost (€/kW) | 8 | 23 | 15 | 1 |
| Capacity-related cost (€/kWh) | 1 | 1 | 0 | 0 |
| Value-added competitive | 5 | 5 | 5 | 5 |
| Operating cost (€/(kW∙a) | 45 | 14 | 12 | 4 |
| Starting cost (€/MW) | 2 | 15 | 2 | 1 |
| Environmental effects | ||||
| Land use | 5 | 4 | 1 | 4 |
| Environmental hazards | 2 | 4 | 3 | 3 |
| Operational emissions (kg CO2e/kW) | 0.045 | 0.08 | 0.045 | 0.031 |
| Infrastructure emissions (kg CO2e/kW) | 0 | 27 | 60 | 0.03 |
| Raw material criticality | 4 | 4 | 4 | 4 |
| Sustainability | 3 | 3 | 3 | 3 |
| Acceptance | 4 | 4 | 3 | 4 |
| Technical Parameters | 50% RES Share | 65% RES Share | 80% RES share | ||||||
|---|---|---|---|---|---|---|---|---|---|
| Lead-Based | Lithium-Based | Nickel-Based | Lead-Based | Lithium-Based | Nickel-Based | Lead-Based | Lithium-Based | Nickel-Based | |
| Efficiency (%) | 75 | 90 | 70 | 75 | 90 | 70 | 80 | 95 | 76 |
| Self-discharge | 4 | 4 | 1 | 4 | 4 | 1 | 4 | 4 | 1 |
| Plant availability | 4 | 5 | 5 | 4 | 5 | 5 | 4 | 5 | 5 |
| Cyclebility | 2 | 3 | 2 | 2 | 3 | 2 | 2 | 3 | 2 |
| Lifespan (a) | 15 | 20 | 10 | 15 | 20 | 10 | 15 | 20 | 10 |
| Economic parameters | |||||||||
| Power-related cost (€/kW) | 52 | 118 | 97 | 105.25 | 4.8 | 64 | 122.75 | 5.62 | 228.9 |
| Capacity-related cost (€/kWh) | 104 | 26 | 123 | 210.5 | 53.33 | 250 | 245.5 | 62.44 | 291.96 |
| Value-added competitive | 5 | 5 | 5 | 5 | 5 | 5 | 5 | 5 | 5 |
| Operating cost (€/(kW∙a) | 22 | 19 | 22 | 22 | 19 | 22 | 22 | 19 | 22 |
| Starting cost (€/MW) | 1 | 1 | 1 | 1 | 1 | 1 | 1 | 1 | 1 |
| Environmental effects | |||||||||
| Land use | 5 | 5 | 5 | 5 | 5 | 5 | 5 | 5 | 5 |
| Environmental hazards | 3 | 3 | 2 | 3 | 3 | 2 | 3 | 3 | 2 |
| Operational emissions (kg CO2e/kW) | 0.1859 | 0.062 | 0.239 | 0.0137 | 0.0458 | 0.1767 | 0.0593 | 0.0198 | 0.0763 |
| Infrastructure emissions (kg CO2e/kW) | 2 | 5 | 3 | 4.16 | 10.03 | 5,45 | 4.85 | 11.,7 | 6.36 |
| Raw material criticality | 5 | 3 | 3 | 5 | 3 | 3 | 5 | 3 | 3 |
| Sustainability | 5 | 3 | 2 | 5 | 4 | 2 | 5 | 4 | 2 |
| Acceptance | 5 | 4 | 3 | 5 | 4 | 3 | 5 | 4 | 3 |
| Rank | 1 | 2 | 3 | 4 | 5 |
|---|---|---|---|---|---|
| Self-discharge (%/month) | >20 | 10–20 | 5–10 | 1–5 | <1 |
| Plant availability | very low | low | medium | high | very high |
| Cyclebility | <1000 | 1000–5000 | 5000–10,000 | 10,000–30,000 | >30,000 |
| Value-added competitive | very high | high | medium | low | None |
| Land use | very high | high | medium | low | very low |
| Environmental hazards | very high | high | medium | low | very low |
| Raw material criticality | very high | high | medium | low | very low |
| Sustainability | very low | low | medium | high | very high |
| Acceptance | very low | low | medium | high | very high |
| Environmental Effects | Global | Local | Technical Parameters | Global | Local | Economic Parameters | Global | Local |
|---|---|---|---|---|---|---|---|---|
| 10.48% | 63.70% | 25.82% | ||||||
| Land use | 0.35% | 3.36% | Efficiency | 21.32% | 33.47% | Power-related cost | 9.07% | 35.13% |
| Environmental hazards | 0.80% | 7.68% | Self-discharge | 3.06% | 4.81% | Capacity-related cost | 9.07% | 35.13% |
| Operational emissions | 1.55% | 14.76% | Plant availability | 7.26% | 11.40% | Value-added competitive | 0.65% | 2.52% |
| Infrastructure emissions | 3.60% | 34.34% | Cyclebility | 21.86% | 34.31% | Operating cost | 2.90% | 11.24% |
| Raw material criticality | 2.25% | 21.46% | Lifespan | 10.20% | 16.01% | Starting cost | 4.13% | 15.98% |
| Sustainability | 1.46% | 13.91% | ||||||
| Acceptance | 0.47% | 4.49% |
| EESS Type | 50% RES Share | 65% RES Share | 80% RES Share | |||
|---|---|---|---|---|---|---|
| Solar Region (MW) | Wind Region (MW) | Solar Region (MW) | Wind Region (MW) | Solar Region (MW) | Wind Region (MW) | |
| Short-term | ||||||
| Lead-based | 434 | 186 | 601 | 205 | 884 | 269 |
| Lithium-based | 504 | 216 | 936 | 320 | 1446 | 440 |
| Nickel-based | 358 | 153 | 520 | 178 | 779 | 237 |
| Medium-term | ||||||
| High-temperature | 1146 | 1059 | 1990 | 1605 | 3456 | 2309 |
| Compressed-air | 1126 | 1040 | 2112 | 1704 | 3670 | 2452 |
| Pump-hydro | 1517 | 1401 | 2671 | 2155 | 4641 | 3101 |
| Redox-flow | 1898 | 1753 | 3576 | 2884 | 6233 | 4164 |
| Characteristics | Flexible Bioenergy Plants | Electric Energy Storage | Hard Coal and chp Power Plants | Reserve Power Plant |
|---|---|---|---|---|
| Installed power | X | X | X | |
| Installed storage capacity | (X) | X | ||
| Efficiency factor | X | X | ||
| Part-load range | X | X | X | |
| Ramp rates | X | X | X | |
| Differentiation between cold and hot start | X | |||
| Limitation of daily number of starts | X | |||
| Minimum idle time and minimum operation time | X | |||
| Probability of default | X | |||
| Reversible self-discharge | (X) | X | ||
| Irreversible self-discharge | X |
References
- BMUB. Klimaschutzplan 2050—Klimaschutzpolitische Grundsätze und Ziele der Bundesregierung. Available online: http://www.bmub.bund.de (accessed on 4 September 2017).
- Kyritsis, E.; Andersson, J.; Serletis, A. Electricity prices, large-scale renewable integration, and policy implications. Energy Policy 2017, 101, 550–560. [Google Scholar] [CrossRef]
- Child, M.; Kemfert, C.; Bogdanov, D.; Breyer, C. Flexible electricity generation, grid exchange and storage for the transition to a 100% renewable energy system in Europe. Renew. Energy 2019, 139, 80–101. [Google Scholar] [CrossRef]
- Schaber, K.; Steinke, F.; Hamacher, T. Transmission grid extensions for the integration of variable renewable energies in Europe: Who benefits where? Energy Policy 2012, 43, 123–135. [Google Scholar] [CrossRef]
- Söder, L.; Lund, P.D.; Koduvere, H.; Bolkesjø, T.F.; Rossebø, G.H.; Rosenlund-Soysal, E.; Skytte, K.J.; Blumberga, D. A review of demand side flexibility potential in Northern Europe. Renew. Sustain. Energy Rev. 2018, 91, 654–664. [Google Scholar] [CrossRef]
- Tafarte, P.; Das, S.; Eichhorn, M.; Thrän, D. Small adaptations, big impacts: Options for an optimized mix of variable renewable energy sources. Energy 2014, 72, 80–92. [Google Scholar] [CrossRef]
- Hirth, L.; Müller, S. System-friendly wind power: How advanced wind turbine design can increase the economic value of electricity generated through wind power. Energy Econ. 2016, 56, 51–63. [Google Scholar] [CrossRef]
- Luo, X.; Wang, J.; Dooner, M.; Clarke, J. Overview of current development in electrical energy storage technologies and the application potential in power system operation. Appl. Energy 2015, 137, 511–536. [Google Scholar] [CrossRef]
- Beaudin, M.; Zareipour, H.; Schellenberglabe, A.; Rosehart, W. Energy storage for mitigating the variability of renewable electricity sources: An updated review. Energy Sustain. Dev. 2010, 14, 302–314. [Google Scholar] [CrossRef]
- Goodenough, J.B. Electrochemical energy storage in a sustainable modern society. Energy Environ. Sci. 2013, 7, 14. [Google Scholar] [CrossRef]
- Hadjipaschalis, I.; Poullikkas, A.; Efthimiou, V. Overview of current and future energy storage technologies for electric power applications. Renew. Sustain. Energy Rev. 2009, 13, 1513–1522. [Google Scholar] [CrossRef]
- van Hout, M.; Özdemir, Ö.; Koutstaal, P. Large-Scale Balancing with Norwegian Hydro Power in the Future European Electricity Market. ECN-E-17-043; Stichting Energieonderzoek Centrum Nederland (ECN): Petten, The Netherlands, 2017. [Google Scholar]
- Thrän, D. Smart Bioenergy: Technologies and Concepts for a More Flexible Bioenergy Provision in Future Energy Systems; Springer: Cham, Switzerland, 2015. [Google Scholar]
- Lauer, M.; Thrän, D. Flexible Biogas in Future Energy Systems—Sleeping Beauty for a Cheaper Power Generation. Energies 2018, 11, 761. [Google Scholar] [CrossRef]
- Trieb, F.; Fichter, T.; Moser, M. Concentrating solar power in a sustainable future electricity mix. Sustain. Sci. 2014, 9, 47–60. [Google Scholar] [CrossRef]
- Schill, W.-P. Residual Load and Storage Requirements for Renewable Integration in Germany; German Institute for Economic Research—DIW: Berlin, Germany, 2013. [Google Scholar]
- Heide, D.; Greiner, M.; von Bremen, L.; Hoffmann, C. Reduced Storage and Balancing Needs in a Fully Renewable European Power System with Excess Wind and Solar Power Generation. Renew. Energy 2011, 36, 2515–2523. [Google Scholar] [CrossRef]
- Rasmussen, M.G.; Andresen, G.B.; Greiner, M. Storage and balancing synergies in a fully or highly renewable pan-European power system. Energy Policy 2012, 51, 642–651. [Google Scholar] [CrossRef]
- NEP. Netzentwicklungsplan Strom 2012: 2.Überarbeiteter Entwurf der Übertragungsnetzbetreiber. 50Hertz, Amprion, TenneTTSO, TransnetBW. 2012. Available online: https://www.netzentwicklungsplan.de/sites/default/files/nep_2012_2_entwurf_teil_1_kap_1_bis_8.pdf (accessed on 25 February 2020).
- Nitsch, J.; Pregger, T.; Naegler, T.; Heide, D.; de Tena, D.L.; Trieb, F.; Scholz, Y.; Nienhaus, K.; Gerhard, N.; Sterner, M.; et al. Langfristszenarien und Strategien Für den Ausbau der Erneuerbaren Energien in Deutschland bei Berücksichtigung der Entwicklung in Europa und Global; Deutsches Zentrum für Luft- und Raumfahrt (DLR): Stuttgart/Kassel/Teltow, Germany, 2012. [Google Scholar]
- Tafarte, P.; Eichhorn, M.; Thrän, D. Capacity Expansion Pathways for a Wind and Solar Based Power Supply and the Impact of Advanced Technology—A Case Study for Germany. Energies 2019, 12, 324. [Google Scholar] [CrossRef]
- IEA International Energy Agency. The Power of Transformation: Wind, Sun and the Economics of Flexible Power Systems; OECD Publishing: Paris, France, 2014. [Google Scholar]
- Hartner, M.; Ortner, A.; Hiesl, A.; Haas, R. East to west—The optimal tilt angle and orientation of photovoltaic panels from an electricity system perspective. Appl. Energy 2015, 160, 94–107. [Google Scholar] [CrossRef]
- Johansson, V.; Thorson, L.; Goop, J.; Göransson, L.; Odenberger, M.; Reichenberg, L.; Taljegard, M.; Johnsson, F. Value of wind power—Implications from specific power. Energy 2017, 126, 352–360. [Google Scholar] [CrossRef]
- Scheftelowitz, M.; Rensberg, N.; Denysenko, V.; Daniel-Gromke, J.; Stinner, W.; Hillebrand, K.; Naumann, K.; Peetz, D.; Hennig, C.; Thrän, D. Stromerzeugung aus Biomasse: Vorhaben IIa Biomasse. Zwischenbericht Mai 2015. Leipzig. 2015. Available online: https://www.dbfz.de/fileadmin/eeg_monitoring/berichte/01_Monitoring_ZB_Mai_2015.pdf (accessed on 5 November 2019).
- Saaty, T.L. Decisions making with the analytic hierachy process. Int. J. Serv. Sci. 2008, 01, 83–98. [Google Scholar]
- Nick, M.; Cherkaoui, R.; Paolone, M. Optimal Allocation of Dispersed Energy Storage Systems in Active Distribution Networks for Energy Balance and Grid Support. IEEE Trans. Power Syst. 2014, 29, 2300–2310. [Google Scholar] [CrossRef]
- Daim, T.U.; Li, X.; Kim, J.; Simms, S. Evaluation of energy storage technologies for integration with renewable electricity: Quantifying expert opinions. Environ. Innov. Soc. Trans. 2012, 3, 29–49. [Google Scholar] [CrossRef]
- Kanngießer, A. Entwicklung Eines Generischen Modells zur Einsatzoptimierung von Energiespeichern für die Techno-Ökonomische Bewertung Stationärer Speicheranwendungen; Karl Maria Laufen: Oberhausen, Germany, 2014. [Google Scholar]
- Cludius, J.; Hermann, H.; Matthes, F.C.; Graichen, V. The merit order effect of wind and photovoltaic electricity generation in Germany 2008–2016: Estimation and distributional implications. Energy Econ. 2014, 44, 302–313. [Google Scholar] [CrossRef]
- Bloess, A.; Schill, W.-P.; Zerrahn, A. Power-to-heat for renewable energy integration: A review of technologies, modeling approaches, and flexibility potentials. Appl. Energy 2018, 212, 1611–1626. [Google Scholar] [CrossRef]
- Buttler, A.; Spliethoff, H. Current status of water electrolysis for energy storage, grid balancing and sector coupling via power-to-gas and power-to-liquids: A review. Renew. Sustain. Energy Rev. 2018, 82, 2440–2454. [Google Scholar] [CrossRef]
- Lund, H. Large-scale integration of optimal combinations of PV, wind and wave power into the electricity supply. Renew. Energy 2006, 31, 503–515. [Google Scholar] [CrossRef]
- Lund, P.D.; Lindgren, J.; Mikkola, J.; Salpakari, J. Review of energy system flexibility measures to enable high levels of variable renewable electricity. Renew. Sustain. Energy Rev. 2015, 45, 785–807. [Google Scholar] [CrossRef]
- Ministerium für Umwelt, Klima und Energiewirtschaft, Baden-Württemberg. Photovoltaik und Batteriespeicher: Technologie, Integration, Wirtschaftlichkeit, 2000th ed.; Stuttgart, Germany, 2017; Available online: https://um.baden-wuerttemberg.de/fileadmin/redaktion/m-um/intern/Dateien/Dokumente/2_Presse_und_Service/Publikationen/Energie/Photovoltaik-und-Batteriespeicher.pdf (accessed on 25 February 2020).
- Østergaard, P.A. Comparing electricity, heat and biogas storages’ impacts on renewable energy integration. Energy 2012, 37, 255–262. [Google Scholar] [CrossRef]
- Schill, W.-P. Residual load, renewable surplus generation and storage requirements in Germany. Energy Policy 2014, 73, 65–79. [Google Scholar] [CrossRef]
- Millinger, M.; Tafarte, P.; Dotzauer, M.; Oehmichen, K.; Kanngießer, A.; Meyer, B.; Anna, G.; Anne, H. BalanceE—Synergien, Wechselwirkungen und Konkurrenzen beim Ausgleich fluktuierender erneuerbarer Energien im Stromsektor durch erneuerbare Optionen: Endbericht; Helmholtz Zentrum für Umweltforschung UFZ: Leipzig, Germany, 2017. [Google Scholar]
- Sabihuddin, S.; Kiprakis, A.; Mueller, M. A Numerical and Graphical Review of Energy Storage Technologies. Energies 2015, 8, 172–216. [Google Scholar] [CrossRef]
- Fraunhofer UMSICHT, Fraunhofer IWES. Metastudie “Energiespeicher”. Studie im Auftrag des Bundesministeriums für Wirtschaft und Energie (BMWi). Oberhausen, Kassel, 2014. Available online: https://doi.org/10.24406/UMSICHT-N-484739 (accessed on 25 February 2020).
- Durand, J.-M.; Duarte, M.J.; Clerens, P. European Energy Storage Technology Development Roadmap towards 2030. 2013. Available online: http://ease-storage.eu/wp-content/uploads/2015/10/EASE-EERA-recommendations-Roadmap-LR.pdf (accessed on 25 February 2020).
- Nair, N.-K.C.; Garimella, N. Battery energy storage systems: Assessment for small-scale renewable energy integration. Energy Build. 2010, 42, 2124–2130. [Google Scholar] [CrossRef]
- Battke, B.; Schmidt, T.S.; Grosspietsch, D.; Hoffmann, V.H. A review and probabilistic model of lifecycle costs of stationary batteries in multiple applications. Renew. Sustain. Energy Rev. 2013, 25, 240–250. [Google Scholar] [CrossRef]
- Stürzl, P. A Systematic and Numerical Review of Electrical Energy Storage: A Focus on Performance Parameters. Master’s Thesis, Hochschule RheinMain University of Applied Sciences, Wiesbaden Rüsselsheim Geisenheim, Germany, 2015. [Google Scholar]



| Target Share of Renewables | vRES Mix Exogenously Defined | vRES Mix Endogenously Optimized | |
|---|---|---|---|
| Solar PV-dominated region | 50% | CLASSIC | VAREO |
| 65% | CLASSIC | VAREO | |
| 80% | CLASSIC | VAREO | |
| Wind-dominated region | 50% | CLASSIC | VAREO |
| 65% | CLASSIC | VAREO | |
| 80% | CLASSIC | VAREO |
| Environmental Effects | Global 10.5% | Local | Technical Parameters | Global 63.7% | Local | Economic Parameters | Global 25.8% | Local |
|---|---|---|---|---|---|---|---|---|
| Land use | 0.4% | 3.4% | Efficiency | 20.5% | 32.2% | Power-related cost | 10.7% | 41.4% |
| Environmental hazards | 0.8% | 7.7% | Self-discharge | 2.2% | 3.4% | Capacity-related cost | 5.7% | 22.0% |
| Operational emissions | 1.6% | 14.8% | Plant availability | 6.4% | 10.0% | Value-added competitive | 0.6% | 2.4% |
| Infrastructure emissions | 3.6% | 34.3% | Cyclebility | 25.8% | 40.4% | Operating cost | 2.4% | 9.2% |
| Raw material criticality | 2.3% | 21.5% | Lifespan | 8.9% | 13.9% | Starting cost | 6.4% | 25.0% |
| Sustainability | 1.5% | 13.9% | ||||||
| Acceptance | 0.5% | 4.5% | ||||||
| Region | Renewables Share | Annual Excess Energy (TWh/a) | Maximum Excess Power (GW) |
|---|---|---|---|
| Solar PV-dominated region | 50% | 0 | 0.3 |
| 65% | 0.3 | 9.5 | |
| 80% | 4.9 | 18.2 | |
| Wind-dominated region | 50% | 0.1 | 3.4 |
| 65% | 1.5 | 6.6 | |
| 80% | 5.4 | 10.5 |
| Region | Renewables Share | Annual Negative Residual Load in CLASSIC Scenarios (TWh/a) | Annual Negative Residual Load in VAREO Scenarios (TWh/a) | Percentage of Reduction in VAREO Sceanrios (%) |
|---|---|---|---|---|
| Solar PV-dominated region | 50% | 0.9 | 0.3 | −59.9 |
| 65% | 4.0 | 1.7 | −56.2 | |
| 80% | 11.8 | 4.4 | −62.9 | |
| Wind-dominated region | 50% | 0.58 | 0.03 | −94.2 |
| 65% | 2.6 | 0.46 | −82.4 | |
| 80% | 7.2 | 2.1 | −71.4 |
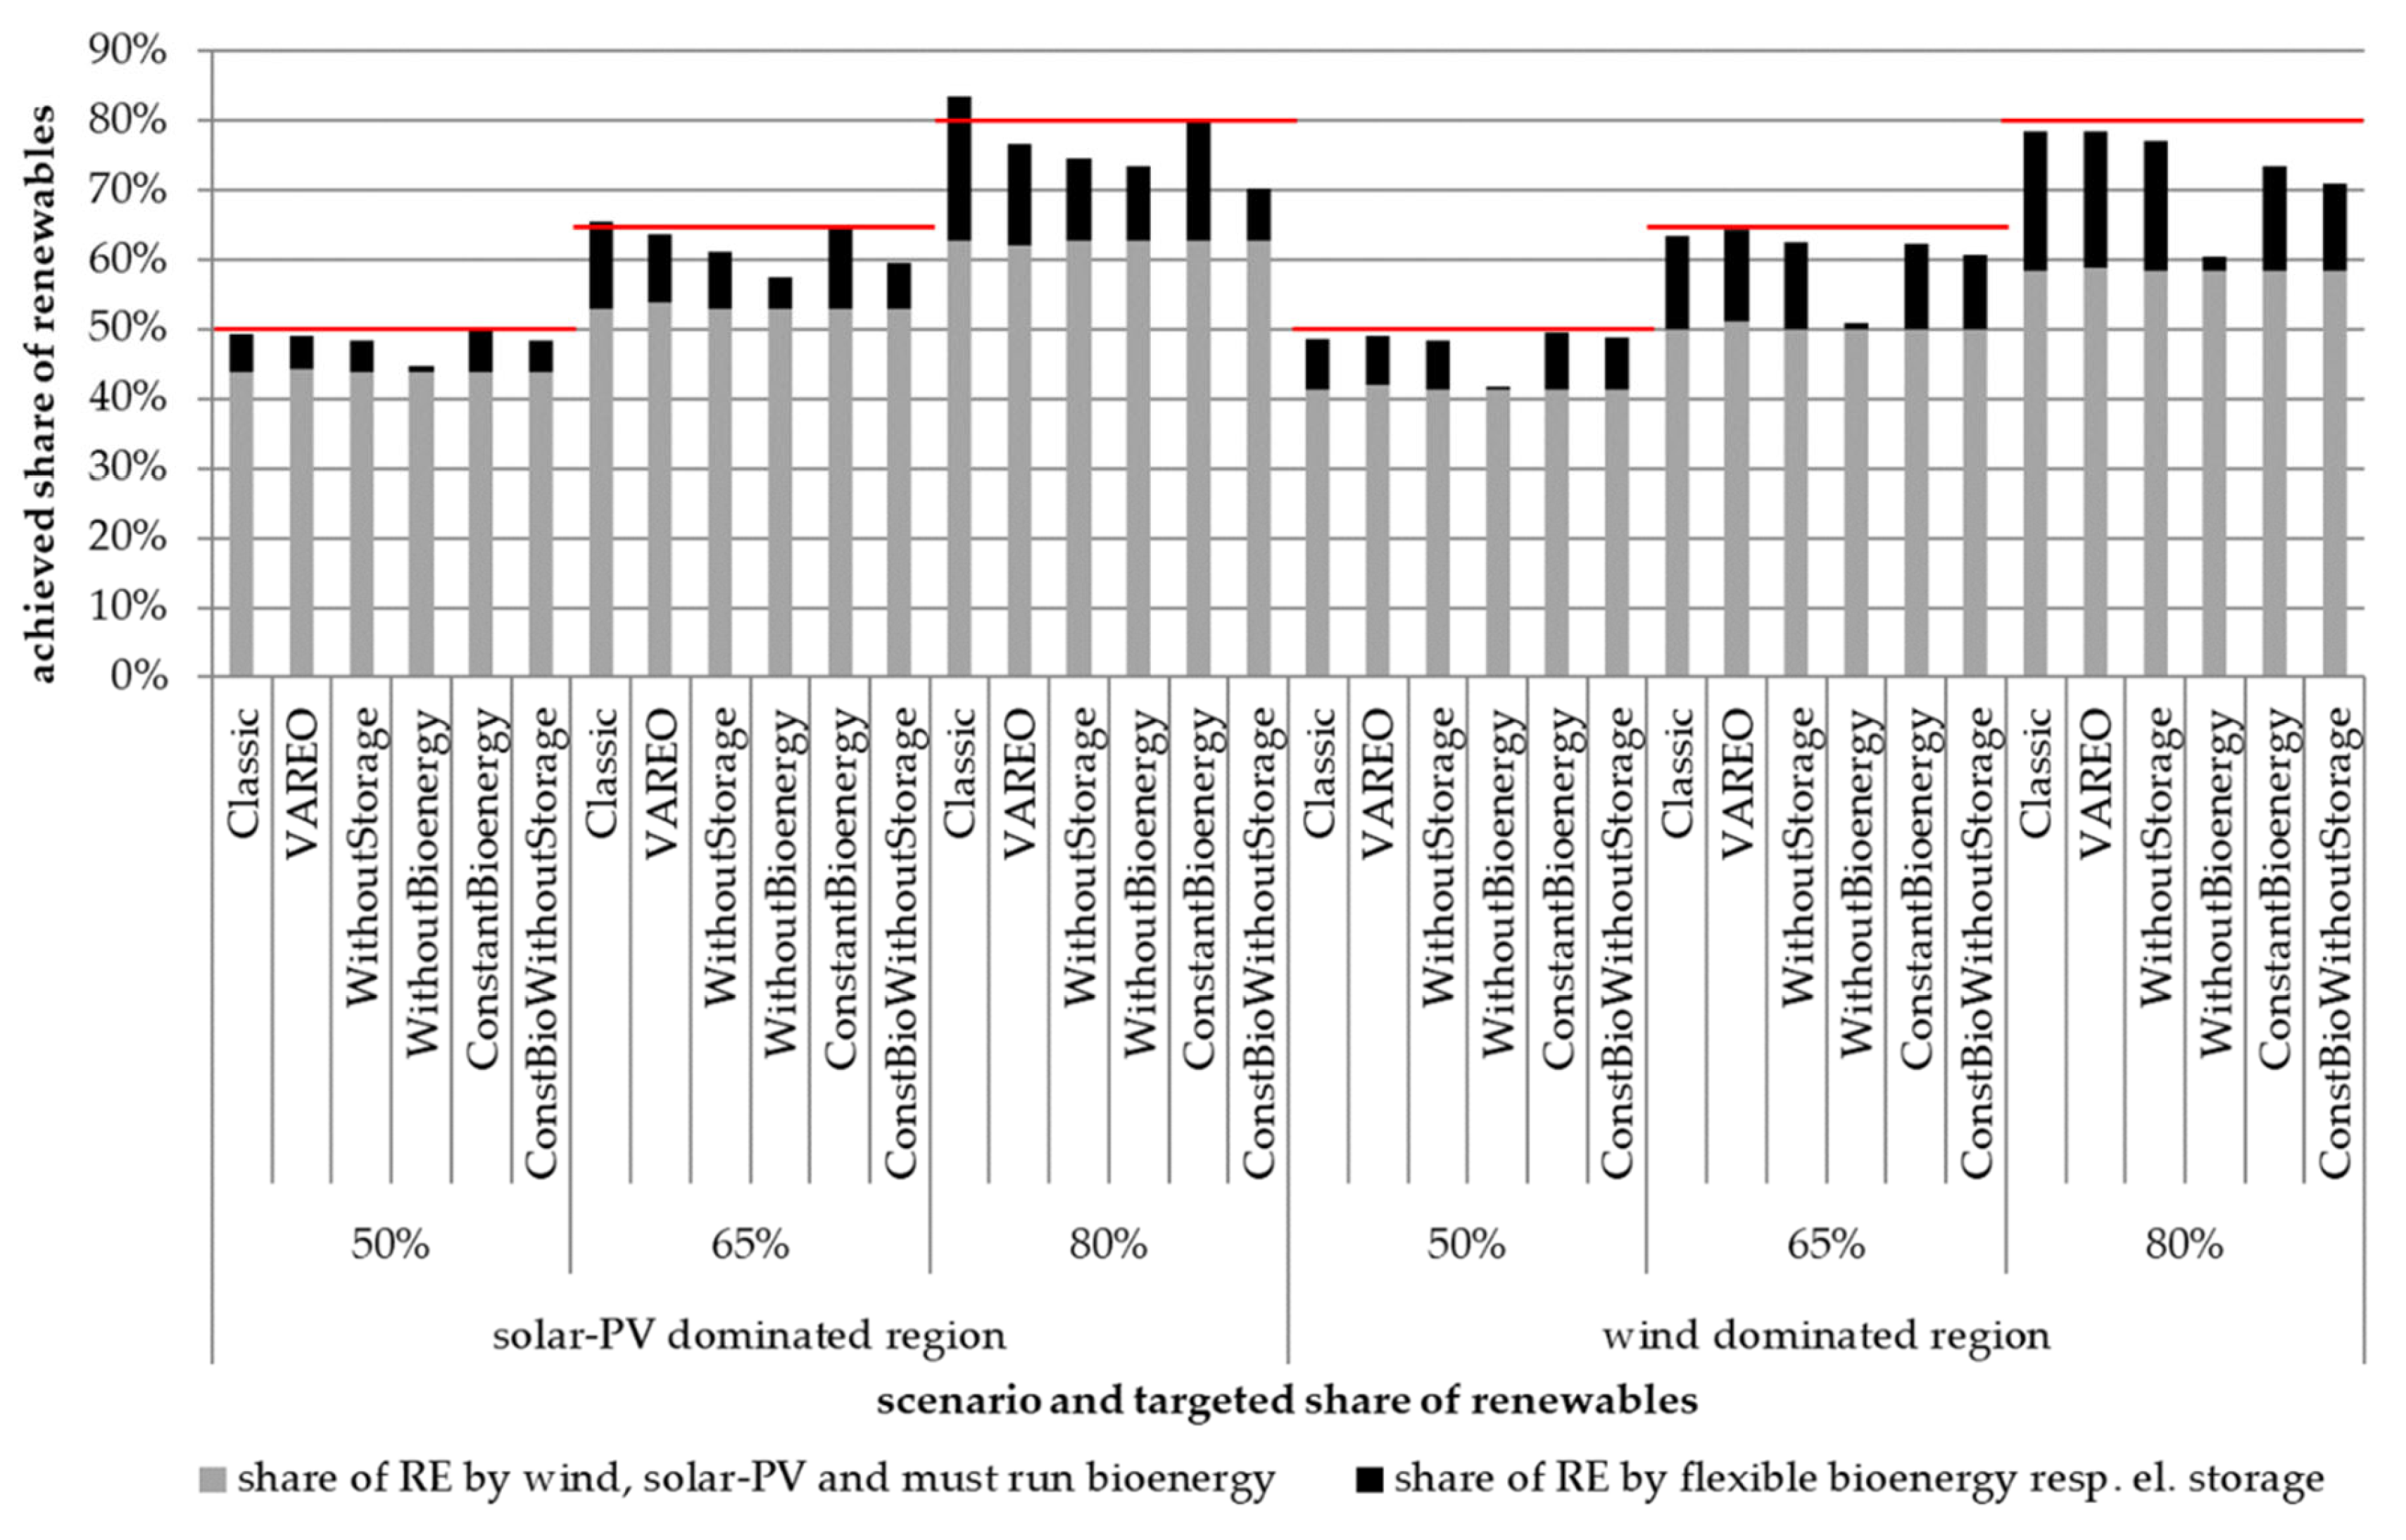
| Scenario Name | Scenario Description |
|---|---|
| “WithoutStorage” | No EESS in the fleet |
| “WithoutBioenergy” | No flexible bioenergy power plants in the fleet |
| “ConstantBioenergy” | Bioenergy power plants with constant feed-in instead of flexible operation ability |
| “ConstBioWithoutStorage” | Bioenergy power plants with constant feed-in instead of flexible operation ability and no EESS in the fleet |
© 2020 by the authors. Licensee MDPI, Basel, Switzerland. This article is an open access article distributed under the terms and conditions of the Creative Commons Attribution (CC BY) license (http://creativecommons.org/licenses/by/4.0/).
Share and Cite
Tafarte, P.; Kanngießer, A.; Dotzauer, M.; Meyer, B.; Grevé, A.; Millinger, M. Interaction of Electrical Energy Storage, Flexible Bioenergy Plants and System-friendly Renewables in Wind- or Solar PV-dominated Regions. Energies 2020, 13, 1133. https://doi.org/10.3390/en13051133
Tafarte P, Kanngießer A, Dotzauer M, Meyer B, Grevé A, Millinger M. Interaction of Electrical Energy Storage, Flexible Bioenergy Plants and System-friendly Renewables in Wind- or Solar PV-dominated Regions. Energies. 2020; 13(5):1133. https://doi.org/10.3390/en13051133
Chicago/Turabian StyleTafarte, Philip, Annedore Kanngießer, Martin Dotzauer, Benedikt Meyer, Anna Grevé, and Markus Millinger. 2020. "Interaction of Electrical Energy Storage, Flexible Bioenergy Plants and System-friendly Renewables in Wind- or Solar PV-dominated Regions" Energies 13, no. 5: 1133. https://doi.org/10.3390/en13051133
APA StyleTafarte, P., Kanngießer, A., Dotzauer, M., Meyer, B., Grevé, A., & Millinger, M. (2020). Interaction of Electrical Energy Storage, Flexible Bioenergy Plants and System-friendly Renewables in Wind- or Solar PV-dominated Regions. Energies, 13(5), 1133. https://doi.org/10.3390/en13051133


