Article

Lignocellulosic Ethanol in a Greenhouse Gas Emission Reduction Obligation System—A Case Study of Swedish Sawdust Based-Ethanol Production

Environmental and Energy Systems Studies, Department of Technology and Society, Lund University, P.O. Box 118, SE-221 00 Lund, Sweden
*
Author to whom correspondence should be addressed.
Energies 2020, 13(5), 1048; https://doi.org/10.3390/en13051048
Submission received: 21 January 2020 / Revised: 23 February 2020 / Accepted: 23 February 2020 / Published: 26 February 2020

Abstract

:
A greenhouse gas (GHG) emission reduction obligation system has been implemented in the Swedish road transport sector to promote the use of biofuels. For transportation fuel suppliers to fulfil this obligation, the volume of biofuel required decreases with decreasing life cycle GHG emission for the biofuel, linking lower GHG emission to higher economic value. The aim of this study was to investigate how the economic competitiveness of a Swedish emerging lignocellulosic-based ethanol production system would be influenced by the reduction obligation. The life cycle GHG emission for sawdust-based ethanol was calculated by applying the method advocated in the EU Renewable Energy Directive (RED II). The saving in GHG emissions, compared with fossil liquid transportation fuels, was 93% for a potential commercial production system in southern Sweden. This, in turn, will increase the competitiveness of sawdust-based ethanol compared to the mainly crop-based ethanol currently used in the Swedish biofuel system, which has an average GHG emission saving of 68%, and will allow for an almost 40% higher price of sawdust-based ethanol, compared to the current price of ethanol at point of import. In a future developed, large-scale market of advanced ethanol, today’s GHG emission reduction obligation system in Sweden seems to afford sufficient economic advantage to make lignocellulosic ethanol economically viable. However, in a short-term perspective, emerging lignocellulosic-based ethanol production systems are burdened with economic risks and therefore need additional economic incentives to make a market introduction possible.

1. Introduction

In 2018, the Swedish Government imposed an obligation on the road transportation sector to reduce the greenhouse gas (GHG) emissions from fossil fuels. This reduction obligation means that fuel suppliers in Sweden are required to blend biofuels into fossil fuels to achieve an overall reduction in GHG emission for the fuel blend compared to a fossil fuel comparator. The target for the reduction obligation is increased annually following a predetermined GHG reduction trajectory. The lower the GHG emission of the biofuel, the lower the amount needed to achieve the required overall reduction in emission. This creates an economic advantage for biofuels with low life cycle GHG emissions. An apparent question is, therefore, whether this increased economic advantage is a sufficiently effective incentive to promote the large-scale commercial production of emerging advanced biofuels with low GHG emissions.
The overall objective of this study was to evaluate the economic consequences of GHG emissions from lignocellulosic ethanol in a reduction obligation system. The life cycle assessment-based calculation method defined in the EU renewable energy directive (RED II) was applied as this calculation method is required in the Swedish reduction obligation system, to the case of ethanol produced from sawdust in a potential commercial ethanol plant in Sweden. Sawdust is seen as a promising feedstock for the production of liquid biofuels in Sweden, compared with different lignocellulosic feedstocks, due to its physical proporties, e.g., a homogenus feedstock with no, or low, impurities, low costs, and abundant volymes in the sawmill sector [1]. The risk for increased GHG emissions due to changes in various factors during the planning process, or after the start of operation, such as production system design, selection of inputs in the process, availability of feedstock, or interpretation of the GHG calculation methodology, are evaluated. The resulting life cycle GHG emission for sawdust-based ethanol is compared with statistics on the average cost and GHG emissions of the ethanol currently used to achieve the Swedish reduction obligation target. Finally, the results are discussed in a broader perspective including previous studies of economy and GHG performance of various lignocellulosic-based ethanol production systems.

2. Background

2.1. Biofuel Policy in the EU and Sweden

EU member states must require fuel suppliers to supply at least 14% renewable fuels in road and rail transport by 2030, where the amount of advanced biofuels should correspond to 3.5% (percentage points) [2]. The average EU energy use for road transport during the period 2006–2017 was 12,500 PJ year−1, with no sign of decline [3]. The average share of renewable fuels (including the double counting allowed for some fuels) was 7.1% in 2016 [4]. An increase to 14% means that the market demand for renewable transport fuels within the EU will approximately double in the coming decade (excluding potential consequences of double counting). All biofuels must fulfil the sustainability criteria set out in RED II, including a GHG emission saving of at least 65% compared to the fossil fuel comparator of 94 g CO2-equivalents (CO2-eq)/MJ, which means a maximum allowed GHG emission of 33 g CO2-eq/MJ [2]. The specified method of calculating biofuel GHG emission is based on an life cycle assessment (LCA) methodology with standardized procedures for system boundaries, functional unit and allocation (see Section 4.1. for a detailed description of this calculation method according to RED II).
Sweden had the highest share of biofuels in domestic road transport in the EU in 2018, with 23% on energy basis (30% including the double counting allowed for some fuels) [5]. The national target set for 2030 is a 70% reduction in GHG emission from domestic transport, compared to 2010 levels. One tool used to bring about this transition is the Swedish GHG emission reduction obligation in road transport, introduced in 2018, which requires fuel suppliers to reduce the GHG emission of petrol and diesel by blending it with biofuels [6]. The calculated reduction in GHG emissions is based on the volume of biofuel utilized in combination with the life cycle GHG emission of the biofuel. Under the GHG reduction obligation system, suppliers of petrol and diesel will need a lower amount of biofuel if it has a low life cycle GHG emission, to achieve an equivalent total emission reduction, compared with a biofuel with a higher life cycle GHG emission. The reduction obligation targets for 2020 are 4.2% for petrol and 21% for diesel (compared to 2010). The reduction levels suggested by the Swedish Energy Agency for 2030 (not yet adopted by the Swedish Parliament) are 28% for petrol and 66% for diesel [6].

2.2. Current Production and Use of Fuel Ethanol in the EU and Sweden

In Sweden, 5.3% (vol) ethanol was used for low blend in petrol in 2018, corresponding to 3.2 PJ. For the reduction obligation to be achieved in 2030, the estimated amount of ethanol required is roughly twice that, i.e., 6.8 PJ [7]. During the period from 2011–2018, over 95% of the ethanol used for domestic transport was produced from agricultural crops, and was mainly imported from other EU countries. During the same period, the average ethanol GHG emission has decreased from 37 g CO2-eq/MJ to 30 g CO2-eq/MJ. To achieve the target GHG emission reduction of 70% in the transport sector by 2030, the expected average emission from ethanol is 15 g CO2-eq/MJ [6]. Thus, a shift towards ethanol with lower life cycle GHG emissions is necessary [6].
Default values of ethanol GHG emissions in the RED II for plants using process heat from biomass fuels are 30–31 g CO2-eq/MJ when using crops such as corn and other cereals as ethanol feedstock, and 16 CO2-eq/MJ when wheat straw is used [2]. Straw is an example of a feedstock for so-called “advanced biofuels”, as defined in the EU RED II Annex IX, including lignocellulosic waste and residues from forestry and forest-based industries, such as sawdust [2]. The main reason why ethanol based on lignocellulosic residues is calculated to have lower life cycle GHG emissions than ethanol based on cereals, is due to lower GHG emissions from the production of the biomass feedstock (see e.g., [8]). All GHG emissions from the cultivation phase of cerelas are included in the GHG calculation of crop-based ethanol, whereas only the GHG emissions from the recovery of the lignocellulosic residues, and not from the up-stream primary biomass production, are included regarding lignocellulosic residue-based ethanol. The European fuel ethanol use in 2017 was 115 PJ, of which almost 90% was produced within the EU [9]. The GHG emission from EU-produced ethanol, most of which is crop-based, decreased from 42 to 24 g CO2-eq/MJ between 2011 and 2018 [9]. This decrease is not the result of a shift from crops to advanced feedstock, but mainly due to measures permitted in the RED II calculation method, the allocation of emissions to by-products (animal feed), and increasing capture and use of the biogenic CO2 produced during fermentation, allowing this to be subtracted from the life cycle GHG emissions [2,9]. Advanced ethanol represented less than 4% of the total European ethanol production in 2018 [9].

2.3. Advanced Ethanol Production

The link between GHG emissions and the economic value of a biofuel created through the reduction obligation system will afford an economic advantage to low-emission biofuels [6]. Lignocellulosic ethanol typically has low life cycle GHG emissions, from the default value of 16 g CO2-eq/MJ for straw given in RED II, to around 10 g CO2-eq/MJ for sawdust-based ethanol production, recently demonstrated on pilot scale in Finland [2,10].
Sweden has a long-standing tradition of research into lignocellulose-based ethanol production [11,12,13], but has not yet a commercial large-scale plant dedicated to the production of advanced ethanol as transportation fuel. A large proportion of the fuel production cost of a crop-based biofuel is the cost of the biomass feedstock, while the production of advanced biofuels requires installations with higher investment costs [6,14]. Globally, advanced ethanol production has stagnated, mainly due to technical difficulties and high production costs [15], and advanced ethanol made up less than 2% of the ethanol used in Sweden in 2018 [5]. The considerable financial risk means that long-term stable political incentives will be required for this type of ethanol production to be commercialized [6]. The current GHG reduction obligation system in Sweden may be such a long-term stable incentive, promoting the production and use of biofuels with low GHG emissions, and having predetermined reduction targets until 2030.

3. The Case Study: Ethanol from Sawdust

To examine the economic advantage of advanced ethanol production in the Swedish reduction obligation system, the case of ethanol production from sawdust was investigated. This case is based on recent data provided in the scientific literature [16,17] and by construction planners for commercial ethanol plants in Sweden with the capacity to process 200,000 ton (dry matter, DM) of sawdust per year [18].

3.1. Raw Material Availability—Sawdust from Sawmills in a Forest Dense Region

The current production of sawdust in Swedish sawmills is approximately 1.9 million ton DM per year, which in terms of energy represents some 35 PJ [19]. The region with the highest density of forest, in form of conifers, and sawmills, is found in southern Sweden between latitude 56.5–58 °N and longitude 13.5–16.5 °E. This region amounts to 2.1 million hectares of which 70% is covered by forest [20]. The annual forest increment is equivalent to 14 million m3, while annual felling amounts to 12 million m3 [20]. There are currently 34 sawmills in operation in the region, producing approximately 4 million m3 sawn timber per year, which is equivalent to roughly 8.7 million m3 of roundwood [19]. For comparison, this represents 22% of the total sawn timber production in Sweden.
Based on the generation of, on average, 48 kg sawdust (DM) per m3 of roundwood [21,22], the total annual production of sawdust in sawmills in this forest region is approximately 420,000 ton DM, equivalent to roughly twice the amount needed as feedstock for one ethanol plant of the size assumed in this study.
The theoretical transportation distance of sawdust from existing sawmills in the studied forest region to an ethanol plant with an optimal localization is calculated to be 56 km. This calculation is based on the following assumptions: (i) the supply of sawdust is evenly distributed over the region (based on the actual location of the 34 sawmills), (ii) the sawdust recovery area is circular and the ethanol plant is located at the centre, and (iii) the practical transportation distance is 20% longer than the theoretical linear distance [23]. It was also assumed that all the sawdust produced would be allocated to the ethanol plant. However, only part of the sawdust generated will be commercially available as feedstock for the ethanol plant since sawdust is also used for other purposes, such as the production of pellets, district heating, etc. In the base case in the current study, it is assumed that two thirds of the sawdust produced in the region will be available as feedstock for the ethanol plant, giving an average one-way transportation distance of 70 km. If, on the other hand, only one third of the sawdust is available, the transportation distance will increase to 100 km, which is applied in one of the alternative assessments.

3.2. The Ethanol Plant

The process design was determined by data from [16,17,18,24]. The annual sawdust input and product outputs of the ethanol production plant are illustrated in Figure 1. Detailed information on inputs of material and utilities is presented in Appendix A.
The process for lignocellulosic ethanol production is based on previously published research on pilot and demonstration scale (see e.g., [16,17,25]) and is briefly summarized here. The process consists of acid-catalysed steam pre-treatment followed by liquid/solid phase separation. The cellulose- and lignin-containing solid phase is treated by simultaneous saccharification (hydrolysis) and fermentation (SSF). The ethanol produced is recovered through distillation, and the remaining lignin-rich solids are dried and pelletized. The liquid phase from pre-treatment is treated by anaerobic digestion, where the biogas containing methane and carbon dioxide is recovered in the gas phase; further upgrading is not included.

3.3. Alternative Cases

We considered six different alternative cases in the case study, in addition to the base case, which was based on the data presented in Section 3.2. The impact on ethanol GHG emissions of factors that could change during the planning process, as a consequence of a change in feedstock availability, or that are the result of alternatives in the calculation method, were evaluated. The alternative cases (A–F) are summarized in Table 1, and explained below.
Alternative A: The enzyme cocktails added for cellulose hydrolysis have been reported to contribute with a large share of the GHG emissions for wood based ethanol. These emissions are both linked to the required enzyme dose and an impact of the carbon source and energy use during enzyme production [26,27,28]. For the base case, data representing low emissions for a future European cellulose enzyme production are chosen based on [27], and an enzyme dose in the lower range (0.4 g enzyme protein per MJ ethanol produced) suggested in the same study, corresponding to 2.7 kg enzyme protein per t DM sawdust added. The emission data are based on enzyme production with sugar beet molasses as carbon source, and with biogas as energy source for electricity, heating and cooling, giving a carbon footprint of 6 kg CO2-eq/kg enzyme protein [27]. As an alternative, published data for commercially available enzymes, with an enzyme dose corresponding to 30.4 kg enzyme formula per t DM sawdust added, and a carbon footprint of 5.5 kg CO2-eq/kg enzyme formula are evaluated [29] (N.B. Alternative A data are given in weight enzyme formula, while the base case data are given per weight enzyme protein).
Alternative B: In the base case, the carbon footprint of the electricity mix is based on Swedish national emissions, in line with the RED II methodology [2,30,31]. To illustrate the impact of higher GHG emissions for electricity, the Nordic electricity mix was evaluated [32].
Alternative C: The fuel for the generation of process steam is assumed to be wood chips in the base case. The largest quantity of product from the ethanol plant is lignin pellets (Figure 1). Therefore, the use of internally produced lignin pellets for steam production is evaluated.
Alternative D: The proportion of sawdust in the province available to the ethanol plant is decreased from two thirds to one third, increasing the one-way transport distance from 70 km to 100 km, as described in Section 3.1.
Alternative E: The impact of changing the type of transportation fuel from the current Swedish average diesel blend (77% fossil diesel and 23% biodiesel) to biodiesel (Hydrotreated Vegetable Oil, HVO100) is evaluated [5].
Alternative F: The average share of CO2 capture from fermentation in European ethanol production was 18% in 2018 [9]. The possibility of CO2 capture was evaluated, assuming that 30% of the CO2 from the fermentation process (equal to 14,100 t/y, Figure 1) is recovered for further use, replacing fossil CO2.

4. Methods and Data Inventory

4.1. Revised Renewable Energy Directive (RED II)

As described in previous sections, the life cycle-based GHG emission calculations were performed according to the revised European Union’s Renewable Energy Directive, RED II [2], which is to be implemented in national legislation after 2020. The reason why this specific methodology was utilized is that the Swedish GHG reduction obligation system is built upon the GHG performance of the blend in biofuels according to the calculation method defined in the EU RED.
According to the RED II [2], the GHG performance was calculated as global warming potential with a 100-year time frame including emissions of CO2, CH4 and N2O, were 1 g of CH4 and 1 g N2O were valued 25 and 298 g CO2-eq, respectively. The emissions of the intermediate and final products were expressed in g CO2-eq, and the functional unit (FU) to which environmental impact is related was 1 MJ (lower heating value, LHV) of ethanol. According to the RED II, the default value for “the fossil fuel comparator E F ( t ) was 94 g CO2-eq/MJ” (petrol and diesel) [2]. The equation used to calculate the total life cycle emission from the produced fuel is given in RED II [2] as follows:
E =   e e c + e l + e p + e t d + e u e s c a e c c s e c c r ,
where “ E is the total emissions from the use of the fuel, e e c is emissions from the extraction or cultivation of raw materials, e l is annualised emissions from carbon stock changes caused by land-use change, e p   is emissions from processing, e t d is emissions from transport and distribution, e u is emissions from the fuel in use, e s c a is emission savings from soil carbon accumulation via improved agricultural management, e c c s , is emission savings from CO2 capture and geological storage, e c c r is emission savings from CO2 capture and replacement”.
In the present assessment, “emissions from carbon stock changes caused by land-use change” was not relevant since the sawdust was defined as “advanced feedstock” and set to zero, according to RED II [2]. The EU RED also state that the “emissions from the fuel in use shall be taken to be zero for biofuels and bioliquids” [2], and therefore were not included. Furthermore, “emission savings from soil carbon accumulation via improved agricultural management”, as well as “emission savings from CO2 capture and geological storage” [2], were not relevant in this study. “Emission savings from CO2 capture and replacement” [2], were set to be zero in the base case, but were included in Alternative F (the CO2 capture case). These emission savings shall, according to RED II [2], “be related directly to the production of biofuel or bioliquid they are attributed to, and shall be limited to emissions avoided through the capture of CO2 of which the carbon originates from biomass and which is used to replace fossil-derived CO2 in commercial products and services”. Thus, the parameters in the RED II calculation methodology that were included in following life cycle GHG emission analysis (base case) are “ e e c ”, which includes the production of chemicals and enzymes used in the ethanol process (and no up-stream primary biomass production activites since sawdust is seen as a residue), “ e p ”, covering the production of the electricity and heat needed for the ethanol process, and “ e t d ” which includes the transport operations for the sawdust from sawmills to the ethanol plant, the transport of the ethanol to the depot and the distribution of the ethanol to the filling stations.

4.2. LCA Data Inventory

It is assumed that sawdust (50% DM) [33] from the sawmill is transported via road by truck (40 ton total weight) with a load capacity of 26 tons. Data on diesel use during transport and the properties of the truck were based on [34]. The total fuel use for transport, including the empty return of the truck, was calculated to be 0.12 MJ/kg DM sawdust in the base case, for a transport distance of 70 km, and 0.17 MJ/kg DM sawdust in Alternative D where the transport distance was 100 km. The fuel consumption for transporting the ethanol produced 150 km to a depot, and then a further 150 km to a filling station, based on assumed distances in [35], was calculated to be 0.26 MJ/kg ethanol, including the empty return of a truck for liquids. Electricity use at the depot and at the filling station were assumed to be 0.84 kJ electricity/MJ ethanol and 34 kJ electricity/MJ ethanol, respectively [35]. It was assumed that the heat required for steam production in the base case was generated from forest residues (branches and tops) in a stand-alone wood chip boiler with a conversion efficiency of 95%. It was assumed that the electricity was generated externally and was the Swedish electricity mixture.
The contributions of the chemicals and utilities used in the ethanol process to GHG emission are given in Table 2.
In Alternative C, where a fraction of the lignin pellets is used for internal steam production, 47% of the produced lignin pellets was required for heat production, leaving 805 TJ lignin pellets per year as a co-product. This change in the amount of co-product changes the proportion of GHG emissions allocated to ethanol, according to the RED II calculation methodology. In Alternative F, an additional 134 kWh/t CO2 recovered was assumed to be needed for the compression of CO2 [39].

4.3. The Swedish GHG Reduction Obligation System and Economic Background Data

The life cycle GHG emissions calculated in the current study were used as input values for the economic assessment of sawdust-based ethanol. Results are presented for the base case, and for the alternatives that give the highest and lowest emissions.
The fuel price at the filling station when the fossil fuel supplier complies with the reduction obligation by blending ethanol with current GHG emission, and price is given in Table 3. The reduction obligation for 2020 of 4.2% was used [6], allowing an emission of 89.4 g CO2-eq/MJ for petrol. With the current average ethanol GHG emission, this required a blend-in of 9.2% (vol) ethanol, giving a petrol price of 19.7 GJ−1 (excl. taxes), based on the data in Table 3. This price per energy unit was kept constant, and the lower volume needed for ethanol with lower GHG emissions was recalculated to give an ethanol price at the filling station. The cost for domestic storage and distribution (including labour and capital costs) and net margins (including profit) were taken from an inventory by the Swedish Energy Agency for E85 in 2018 [40], and were assumed to be the same for sawdust-based ethanol. The values used and the references are presented in Table 3.

5. Results and Discussion

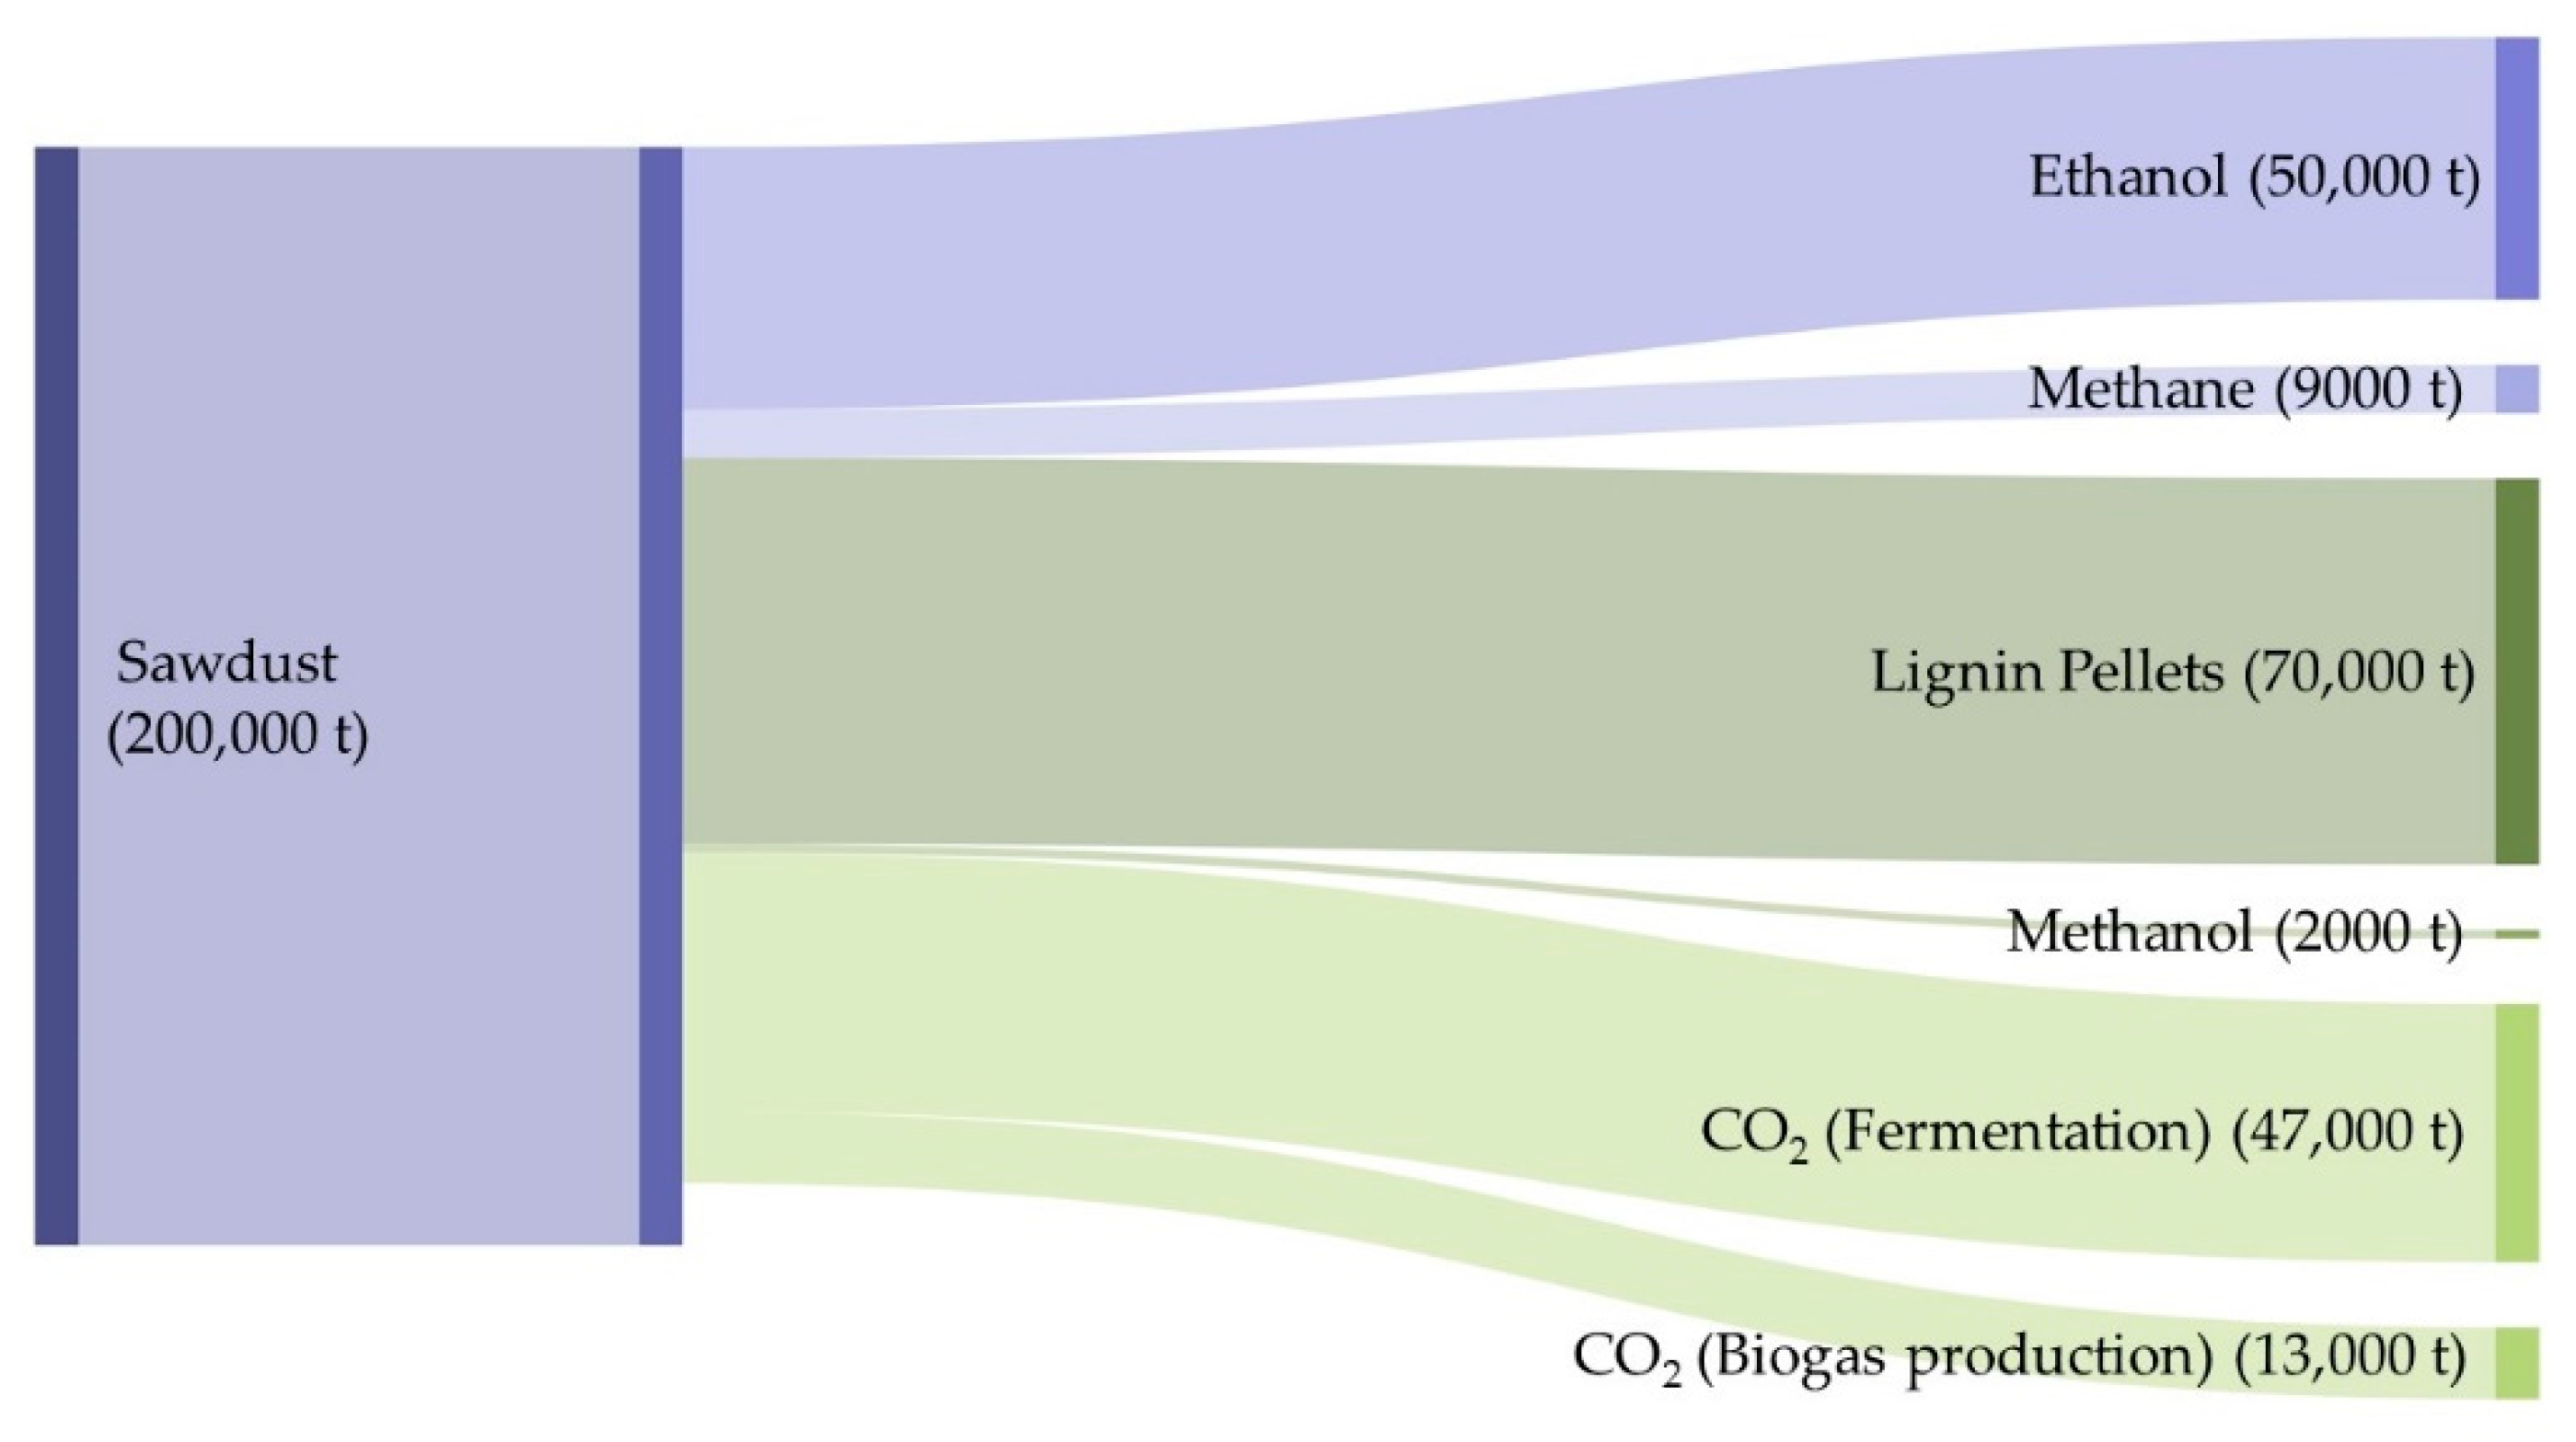
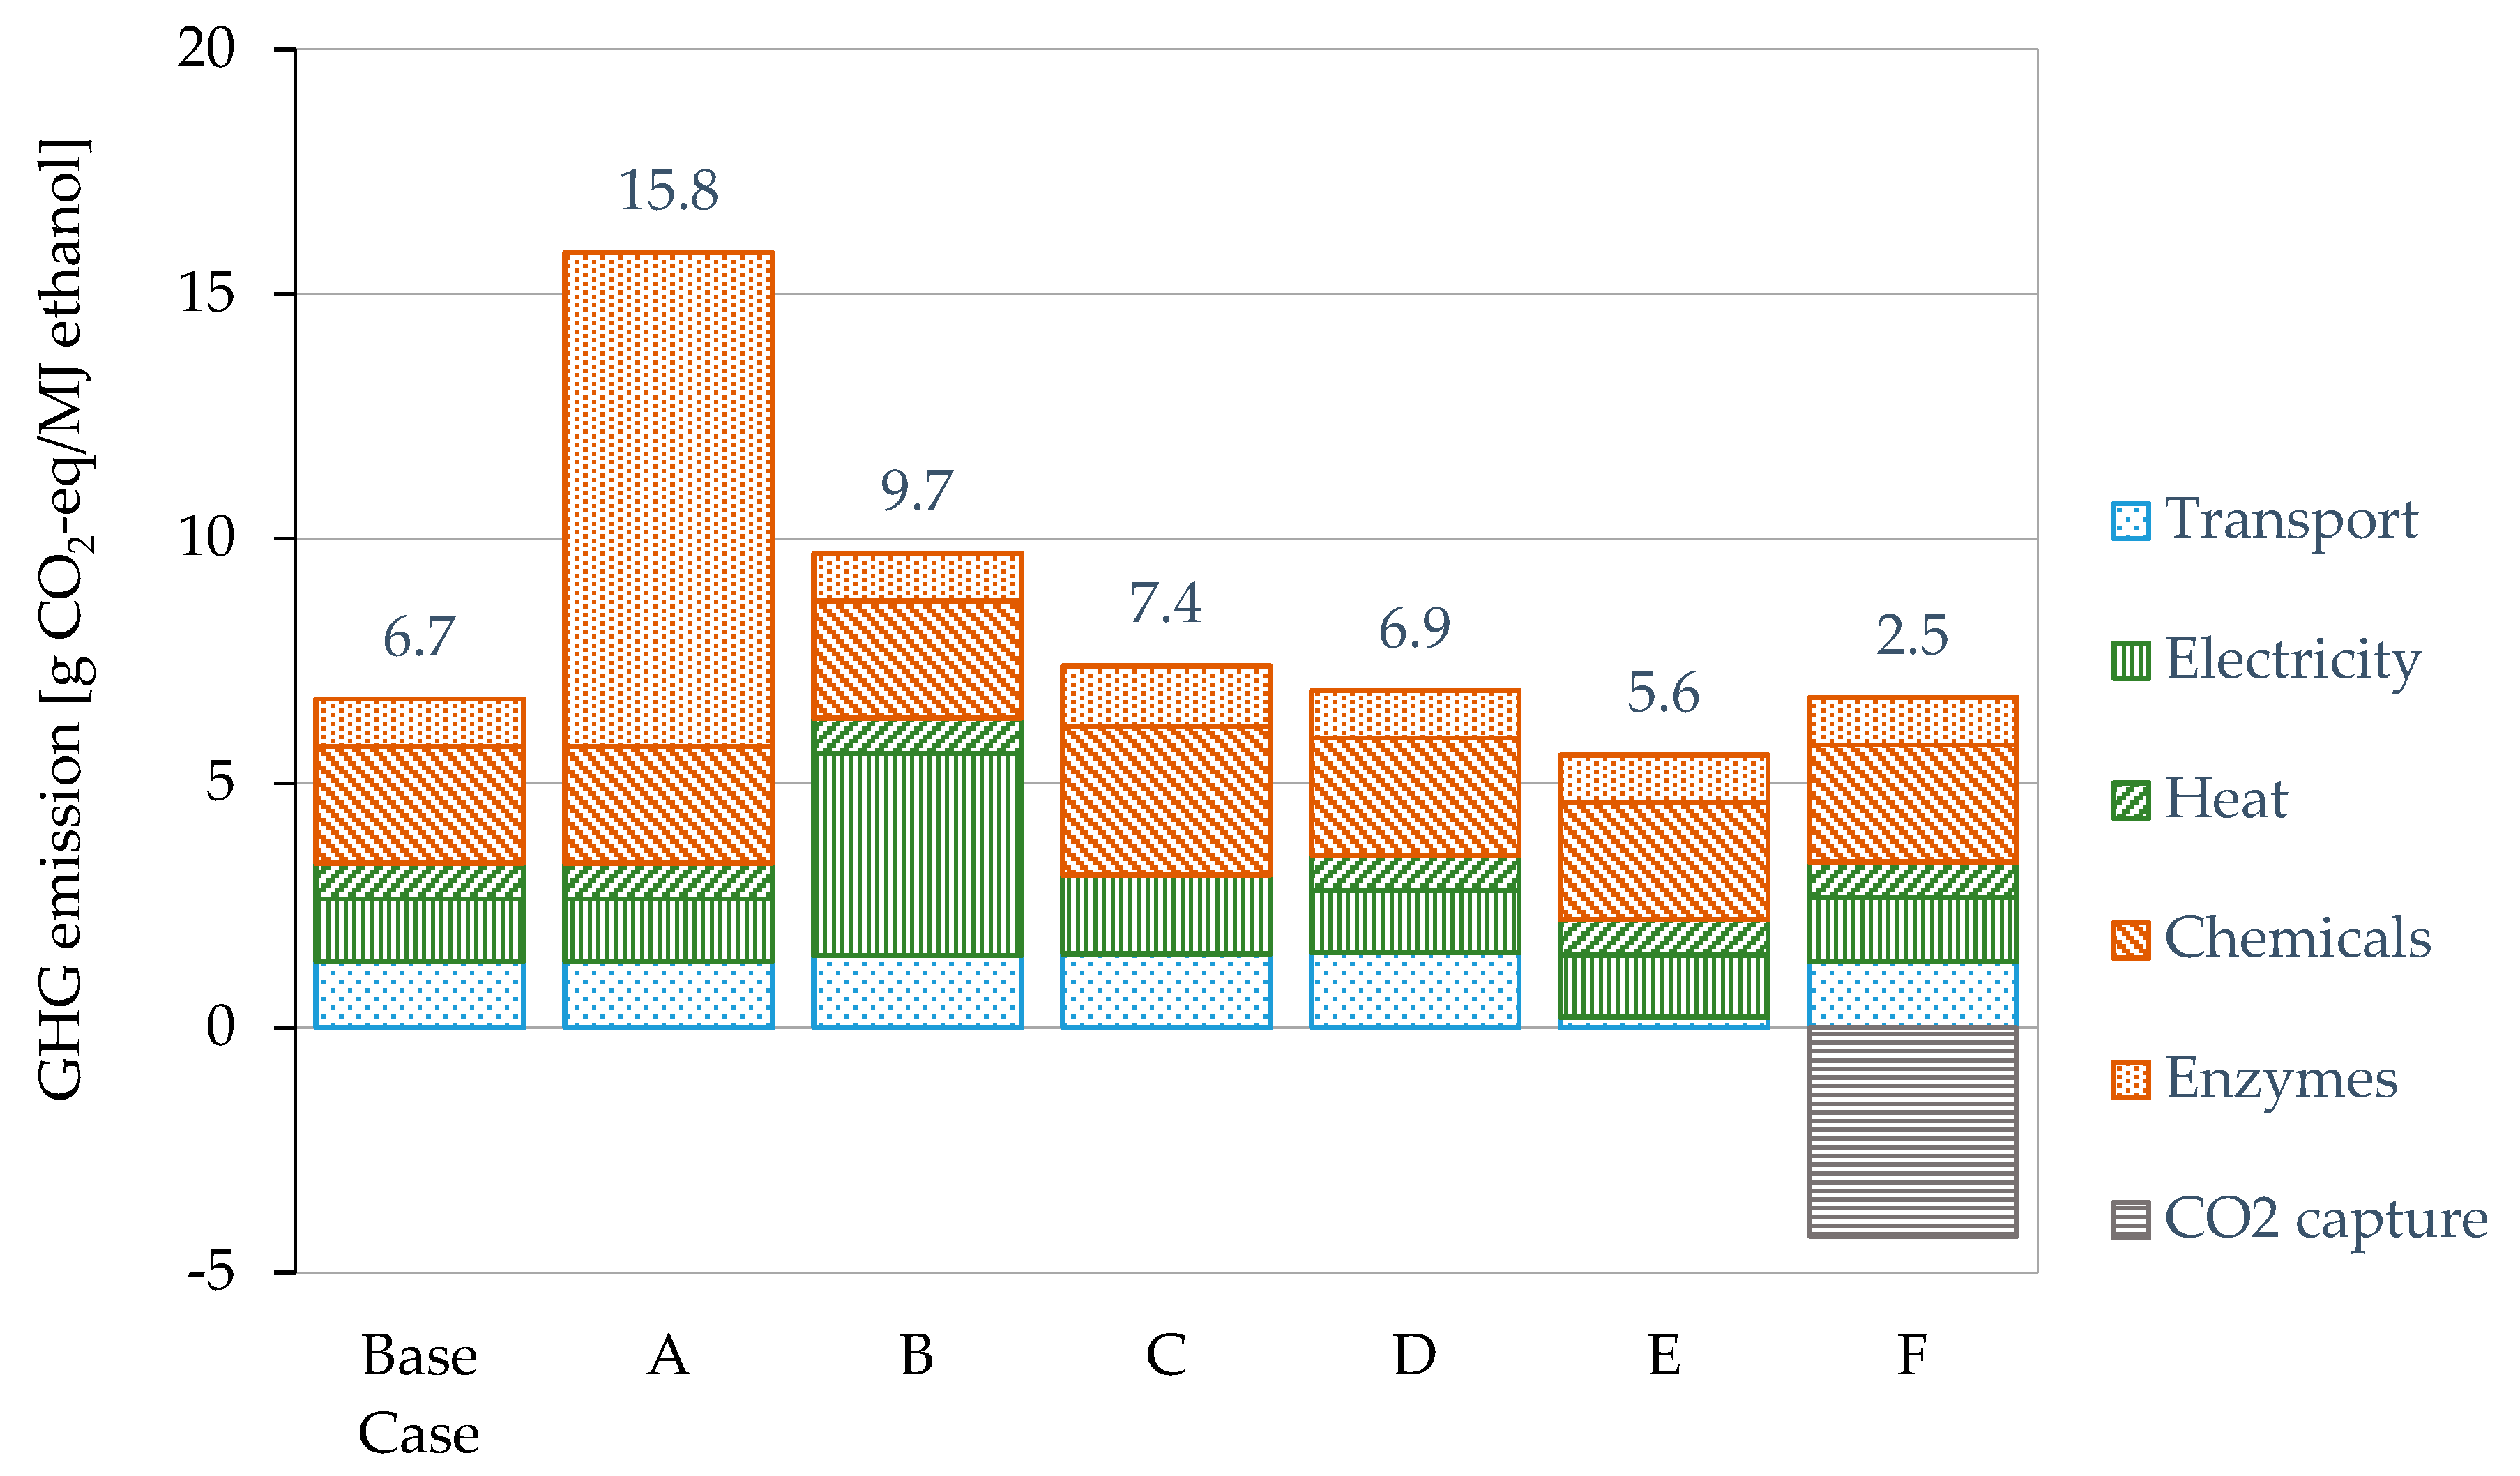
5.1. Ethanol Production and GHG Performance

A commercial sawdust-based ethanol plant of the scale evaluated in the current study would use roughly half of the sawdust generated in sawmills located in a forest region in southern Sweden having a high sawmill density, and some 10% of the total Swedish sawdust potential. The 63 million L of ethanol produced corresponds to 1.3 PJ, or 19%, of the ethanol demand required to fulfil the proposed reduction obligation in 2030 [7,45]. The theoretical maximum ethanol production potential from sawdust in Sweden is consequently twice the national demand expected in 2030.
The ethanol produced from sawdust will have a life cycle GHG emission of 6.7 g CO2-eq/MJ in the base case (see Figure 2), which is equivalent to a GHG emission reduction of 93% compared to the fossil fuel reference value of 94 g CO2-eq/MJ given in RED II. The emission from sawdust-based ethanol is less than one fourth of the life cycle emission of 30 g CO2-eq/MJ from the ethanol currently used in Sweden.
The results of the alternative calculations presented in Figure 2 show that the GHG emission could have varied from 2.5 to 15.8 g CO2-eq/MJ, depending on system design and calculation assumptions. For example, changes in the type and dosage of enzymes may have more than doubled the GHG emissions, whereas changes in the electricity mix may have increased the emission by almost 50%. This clearly shows the importance of using enzymes with low carbon footprint in combination with low enzyme dosage, together with electricity having low GHG emissions. On the other hand, capture of biogenic CO2, which was used to replace fossil-derived CO2, may have reduced the life cycle GHG emissions by more than 50%. A change in transportation distance had a minor impact, whereas the replacement of diesel fuel by biodiesel (100% HVO) led to a reduction in GHG emission of approximately 15%. Finally, the use of lignin pellets for the internal generation of process heat, instead of an external supply of heat based on wood chips, led to a somewhat poorer GHG performance (approximately 10% higher life cycle GHG emissions). This is due to the calculation methodology in RED II and the allocation rules regarding co-products.
The results presented in Figure 2 regarding the GHG emissions for sawdust-based ethanol can be compared with previous studies of other lignocellulosic ethanol production systems. Becker et al. [46] analysed the GHG emissions of ethanol production from wood chips from logging residues (tops and branches after final felling), short-rotation coppice willow, and straw, also according to the EU RED calculation method. The GHG emissions presented for logging residue- and straw-based ethanol were 5.4 and 5.2 g CO2-eq/MJ, respectively [46], which was similar to the base case result for sawdust-based ethanol shown in Figure 2. Both logging residues and straw are defined as biomass residues, similar to sawdust, thus no upstream GHG emissions from the primary biomass production (round wood production and cereal cultivation, respectivley) are included. However, when a dedicated energy crop such as short-rotation coppice willow was used as feedstock, the GHG emissions were somewhat higher, 16.1 g CO2-eq/MJ, due to the inclusion of the GHG emission during the cultivation phase [46]. A conclusion is therefore that the economic competitiviness for willow-based ethanol systems will be somewhat reduced in a GHG reduction obligation system, compared with lignocellulosic waste-based ethanol systems (see Section 5.2).
In a study by Lantz et al. [47], the GHG emissions of both straw- and grain-based ethanol were calculated (winter wheat) based on the EU RED calulation method. Their results showed somewhat higher GHG emissions for straw-based ethanol, or 11 g CO2-eq/MJ, which can be explained by higher GHG emissions from the electricity in use which was based on Nordic electricity mix. This system is reflected in Alternative B in Figure 2, which is also based on Nordic electricity mix instead of Swedish electricity mix. The Swedish national regulations of the EU RED about the GHG calculation method were revised in 2018, including a change from the requirement of using Nordic electricity mix to the requirement of using Swedish electricity mix [31].
The RED calculation method applied in EU legislation (Section 4.1) is a simplified LCA approach, based on the ISO standard of LCA [48,49]. Several previous studies assessing the GHG emissions of biomass-based ethanol systems have applied somewhat altered calcualtion methods, e.g., including indirect effects of the production system by expanding the system boundaries, substituion effects from by-products etc (see e.g., [29,38,47,50,51]). Depending on the aim of the study, and the life cycle GHG calculation approach, the results will differ, which can lead to different conclusions when comparing the GHG performance of ethanol production systems. However, since the EU RED calculation method is applied in EU regulations and in national policy instruments, such as the Swedish GHG reduction obligation system, this method will be applied by all actors within the biofuel sector in EU, and will be the basis of comparison of economic consequences for various biofuels.

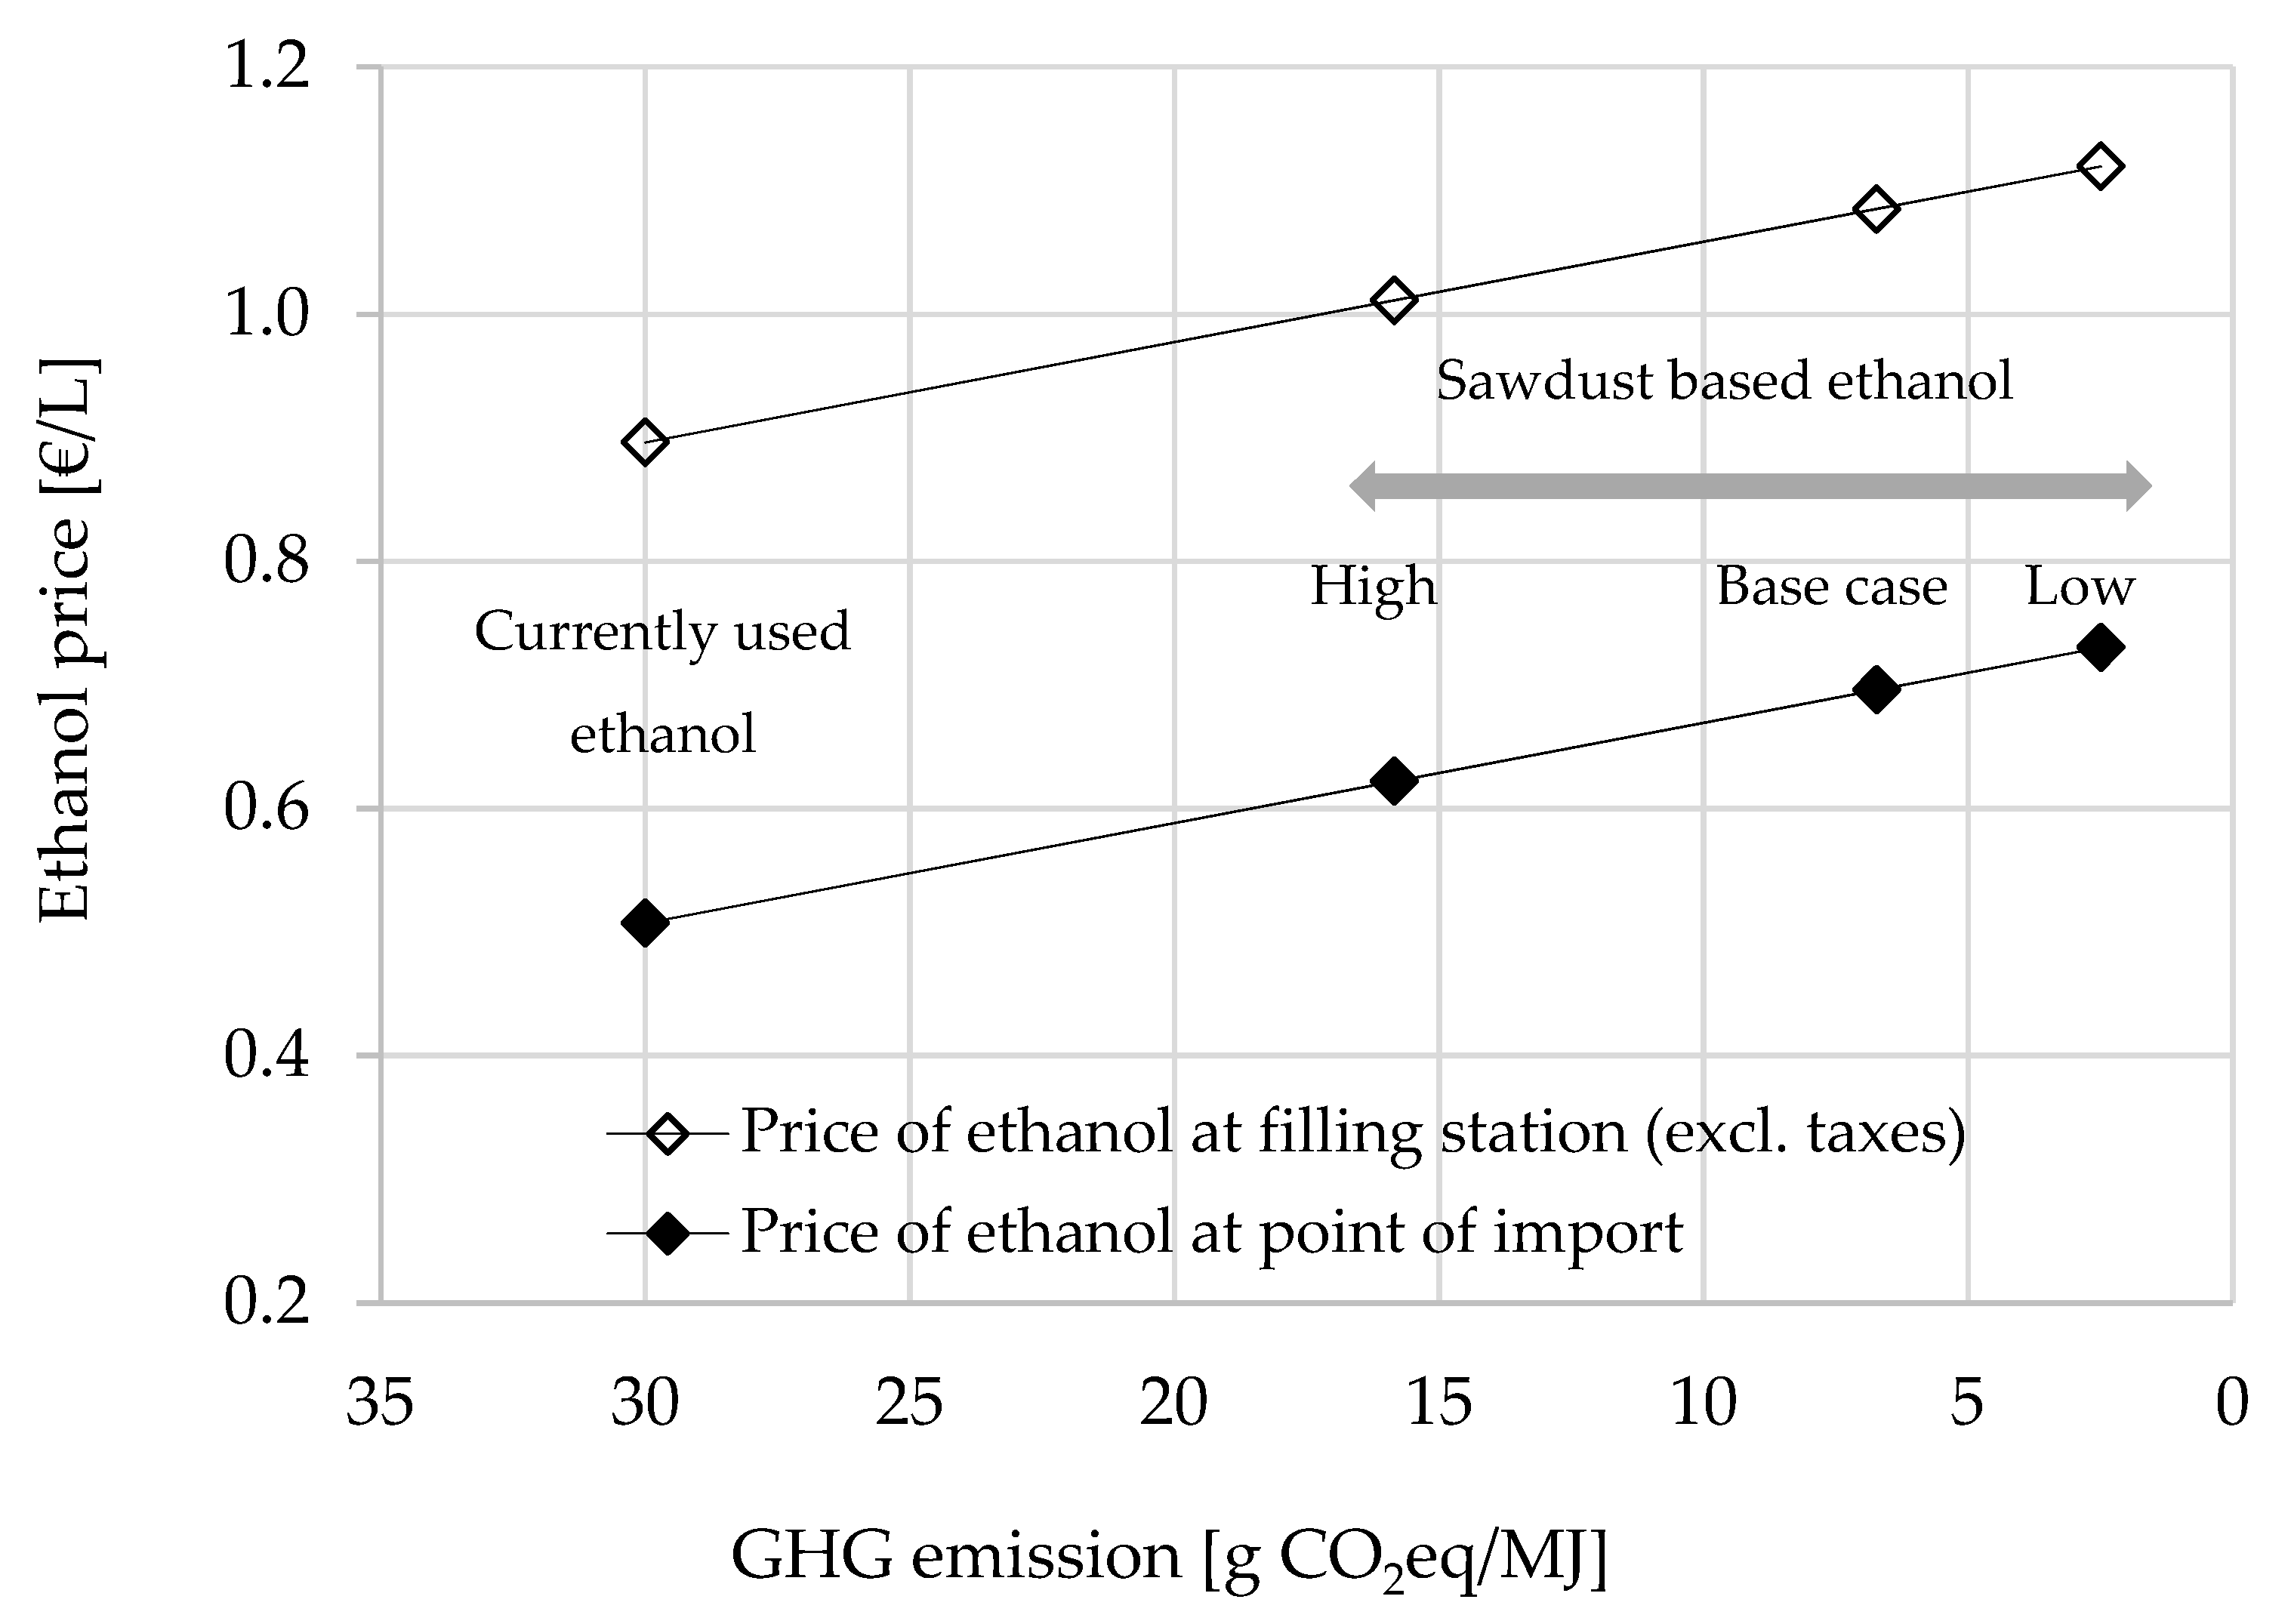
5.2. Economic Consequences of GHG Performance

The GHG emission from the production of sawdust-based ethanol in the base case was used together with the alternatives that gave the highest (A) and lowest (F) GHG emissions in an economic assessment. These values are given in Table 4, together with the average GHG emission for fuel ethanol currently used in Sweden. The blend-in demand required to fulfil the 2020 reduction obligation is also given, together with the calculated prices of sawdust-based ethanol.
The price of ethanol at the point of import is shown in Figure 3. The cost of storage, distribution and net margin for sawdust-based ethanol was assumed to be the same as for ethanol currently used in Sweden (2018). The resulting comparable, GHG-adjusted, price of sawdust-based ethanol in the base case was equivalent to 0.70 €/L. In other words, the price of sawdust-based ethanol can theoretically be 37% higher than the current price of crop-based ethanol (0.51 €/L) for the fuel supplier whithout leading to an increased fuel price to the customer, due to the lower GHG emissions for the sawdust-based ethanol (6.7 g CO2-eq/MJ) compared to the currently used crop-based ethanol (30 g CO2-eq/MJ). Process improvement such as CO2 capture (Low, Table 4) would reduce the GHG emission to below 3 g CO2-eq/MJ, and allow for a 44% higher sawdust-based ethanol price. If, on the other hand, the life cycle emission was above 15 g CO2-eq/MJ, exemplified here by increased emissions related to the use of enzymes (High, Table 4), the GHG-adjusted sawdust-based ethanol price would be only 22% higher than that of ethanol currently used in Sweden.
The GHG adjusted ethanol price presented in Figure 3 for sawdust-based ethanol can be compared with other lignocellulosic ethanol production systems, which are described in Section 5.1. For example, ethanol based on logging residues and straw has been shown to have similar life cycle GHG emissions as sawdust-based ethanol [46]. Therefore, the price advantage compared to the currently used crop based ethanol would be similar for ethanol from these feedstocks in the Swedish GHG reduction obligation system. Regarding short-rotation coppice willow-based ethanol [46], the GHG emissions are comparable with the alternative “High” in Figure 3, thus equivalent to a possible 22% higher price compared to the ethanol currently used in Sweden.
The sort of findings presented in this paper will be increasingly valuable from the perspective of a commercial operator planning to invest in advanced ethanol production, when new economic policy instruments based on biofuel life cycle GHG emissions are introduced. These findings will also be increasingly valuable for policy makers in designing similar policy tools, thereby striving to promote advanced biofuels with low GHG emissions. The overall aim of this study was to show that the introduction of a GHG emission reduction obligation system will favour lignocellulosic ethanol. The results show that this policy instrument will allow for a significantly higher increase in the price of lignocellulosic ethanol, compared with the price of biofuels currently used with higher GHG emission. The next question would then be, whether the level of this potential price increase is enough to stimulate the large-scale commercial introduction of lignocellulosic ethanol production systems.
Several previous studies have shown that lignocellulosic ethanol production systems require economic support to be competitive with existing crop-based ethanol production systems, and especially so compared to fossil liquid fuels [15,52,53,54]. The estimated production cost in the large-scale commercial production of lignocellulosic ethanol has been reported to be up to 30% higher than the production cost using existing wheat-based ethanol production in Sweden [47,51]. The production cost of wheat-based ethanol is in the same range as the current price of ethanol at point of import [47,51] (see Figure 3), thus indicating that future sawdust-based ethanol on a developed market could theoretically be competitive under the existing reduction obligation system as long as the life cycle GHG emission is limited to 10 g CO2-eq/MJ or below.
A recent summary of the costs of producing advanced ethanol (i.e., from agricultural residues and woody biomass) found them to be in the range of 0.51–1.2 /L [15]. In a techno-economic assessment focusing on woody biomass [16], it was concluded that the minimum ethanol selling price, ensuring profitable production, varied between 0.55 and 1.1 €/L ethanol. The lower minimum ethanol selling price refers to the cheapest white wood feedstock (no bark) available today, such as sawdust, while the higher price refers to feedstock with a high fraction of bark (80%), such as hog fuel. The production of ethanol from logging residues was found to have a minimum ethanol selling price of around 0.70–1.1 €/L. Thus, these results indicate that economic viability is possible with sawdust-based ethanol in a future developed market with large-scale production through the reduction obligation system, allowing a price of around 0.70 €/L in the base case, compared to current crop-based ethanol having a selling price of around 0.50 €/L. These results also indicate that ethanol systems based on logging residues need a somewhat higher selling price than sawdust-based ethanol, even though the two systems have similar GHG performance (see Section 5.1.), due to a slightly higher production cost for logging residue-based ethanol.
However, the comparisons above are based on the assumption of a developed commercial market of advanced ethanol including a large-scale production of e.g., sawdust-based ethanol production at several production sites. The production cost is normally higher for the initial commercial production plants implementing an emerging technology. This is due to remaining technological risks, not fully optimised production systems, unforeseen events, etc [51,55]. Thus, investments in emerging technologies requires a risk compensation in form of, for example, higher selling prices, investment subsidies reducing the capital costs, etc. Furthermore, the above comparisons are based on the assumption of an optimised ethanol production system from a GHG perspective, leading to very high GHG savings compared with fossil fuels. As shown in this study, a less optimized sawdust based ethanol production system, with an emission of 15 g CO2-eq/MJ (Figure 3), will give an important contribution to the shift towards biofuels with low GHG emissions required for 2030, but the price advantage created through the reduction obligation system might be too low to promote such a production.
To ensure that a specific lignocellulosic ethanol production system will be sufficiently profitable and competitive in a future commercial market including a reduction obligation system, specific local conditions and actual system designs must be taken into account. For example, the alternatives presented in this paper (see Figure 2) show that the GHG emissions could be both decreased, for example, by CO2 capture and use, or increased, for example, by uncertainties related to the type and dosage of enzymes used. This also apply to other lignocellulosic-based ethanol production system discussed in this paper. As shown in Figure 3, this will affect the GHG-adjusted price of sawdust-based ethanol (as for alternative lignocellulosic-based ethanol). In addition, the current market price of ethanol, which is mainly imported crop-based ethanol, may also change over time, affecting the future economic viability of lignocellulosic ethanol. To conclude, the Swedish reduction obligation system appears to be sufficient to promote the commercial production of primarily sawdust-based ethanol, among various lignocellulosic-based ethanol systems, under future conditions in a large-scale developed market of advanced ethanol. The reduction obligation system is also a long-term political tool with a suggested reduction target for 2030, which is another important prerequisite if investors are to minimize financial risks. However, in a short-term perspective, additional economic incentives are needed for the implementation of these emerging production systems.

6. Conclusions

The main conclusions of the study presented in this paper can be summarized as follows.
  • Sawdust-based ethanol can be produced with low life cycle GHG emission, leading to a GHG emission saving of 93% compared with fossil liquid transportation fuels, but it may vary between 83% and 97%.
  • This, in turn, will increase the economic competitiveness of sawdust-based ethanol in the road transport sector under the Swedish GHG reduction obligation system, which promotes biofuels with low GHG emissions.
  • Based on the current price of ethanol at point of import, and estimated future production costs of lignocellulosic ethanol in a large-scale developed market of advanced ethanol, calculations indicate that sawdust-based ethanol could become economically viable, and potentially also other lignocellulosic waste-based ethanol systems.
  • However, in a short-term perspective, emerging sawdust-based ethanol production systems, as well as other lignocellulosic-based ethanol systems, are burdened with higher costs and economic risks and therefore need additional economic incentives to make a market introduction possible.
  • The current GHG emission reduction obligation system in Sweden is a long-term stable political incentive, and seems to have the potential to promote future investments in lignocellulosic ethanol production systems in a developed, large-scale market.

Author Contributions

S.H. performed the life cycle assessment (LCA) of the ethanol production systems and collected most of the data required for this. L.B. performed the economic assessment, including data collection. L.B. also contributed to the LCA regarding data collection and calculations, and collected data for and wrote the background description. P.B. performed the regional and national analysis, and collected the necessary data. P.B. also provided some data used in the background description, LCA and economic assessment. L.B. and P.B. developed the outline of the study. All authors contributed to the writing and editing of the original manuscript. All authors have read and agreed to the published version of the manuscript.

Funding

This research was funded by the Swedish Energy Agency, grant number 41251-1.

Acknowledgments

The authors gratefully acknowledge SEKAB for their valuable input in the study. The authors also gratefully acknowledge two anonymous reviewers for their constructive comments.

Conflicts of Interest

The authors declare no conflicts of interest.

Appendix A

Table A1. Detailed description of material input per year based on data from [16,17,18,27].
UtilitiesInputFlowUnit
FeedstockSawdust (DM)200,000t
ChemicalsSulphur dioxide (liquid)2000t
Sodium hydroxide (50% wt.)6100t
Sulphuric acid (50% wt.)960t
Antifoam3200t
Trace minerals0.2t
Urea (40% wt.)12t
Enzyme protein530t
Table A2. Detailed description of utilities required per year [16,17,18].
UtilitiesInputFlowUnit
EnergyElectricity 89,600MWh
Steam (16 bar)350,000t
WaterProcess water883,000t
Boiler feed water (3 bar) 97,000t
Table A3. Detailed description of product output per year [16,17,18].
UtilitiesOutputFlowUnit
ProductsEthanol50,000t
Methanol1600t
Biogas from biogas generation (65% vol. CH4/35% vol. CO2)22,000t
Dried lignin (10% moisture)78,000t
CO2 from fermentation47,000t

References

  1. Börjesson, P. Potential för Ökad Tillförsel Och Avsättning av Inhemsk Biomassa i en Växande Svensk Bioekonomi. Report No 97; Environmental and Energy Systems Studies, Lund University: Lund, Sweden, 2016. [Google Scholar]
  2. European Union Directive (EU) 2018/2001 of the European Parliament and of the Council of 11 December 2018 on the Promotion of the Use of Energy from Renewable Sources. Available online: https://eur-lex.europa.eu/legal-content/EN/TXT/PDF/?uri=CELEX:32018L2001&from=EN2018 (accessed on 11 December 2018).
  3. EEA Final Energy Consumption by Mode of Transport. European Energy Agency. Available online: https://www.eea.europa.eu/data-and-maps/indicators/transport-final-energy-consumption-by-mode/assessment-9 (accessed on 4 October 2019).
  4. Eurostat Share of Energy from Renewable Sources. Available online: https://ec.europa.eu/eurostat/statistics-explained/index.php/Renewable_energy_statistics (accessed on 7 October 2019).
  5. Drivmedel 2018. ER 2019:14; Swedish Energy Agency: Estone, Sweden, 2019.
  6. Andrén, R.; Westerberg, N. Kontrollstation 2019 för Reduktionsplikten. Reduktionspliktens Utveckling 2021–2030. Energimyndigheten; The Swedish Energy Agency: Eskilstuna, Sweden, 2019. [Google Scholar]
  7. Komplettering Till Kontrollstation 2019 för Reduktionsplikten; Swedish Energy Agency: Estone, Sweden, 2019.
  8. Börjesson, P.; Ahlgren, S.; Berndes, G. The climate benefit of Swedish ethanol: Present and prospective performance. Wiley Interdiscip. Rev. Energy Environ. 2012, 1, 81–97. [Google Scholar] [CrossRef]
  9. ePURE European Renewable Ethanol—Key Figures 2018. Available online: https://epure.org/media/1920/190828-def-data-statistics-2018-infographic.pdf (accessed on 13 November 2019).
  10. St1 Cellunolix®. Available online: https://www.st1.eu/ (accessed on 3 December 2019).
  11. Galbe, M.; Zacchi, G. A review of the production of ethanol from softwood. Appl. Microbiol. Biotechnol. 2002, 59, 618–628. [Google Scholar] [CrossRef] [PubMed]
  12. Hahn-Hagerdal, B.; Karhumaa, K.; Fonseca, C.; Spencer-Martins, I.; Gorwa-Grauslund, M.F. Towards industrial pentose-fermenting yeast strains. Appl. Microbiol. Biotechnol. 2007, 74, 937–953. [Google Scholar] [CrossRef] [PubMed]
  13. Taherzadeh, M.J.; Karimi, K. Acid-based hydrolysis processes for ethanol from lignocellulosic materials: A review. Bioresources 2007, 2, 472–499. [Google Scholar]
  14. Kang, Q.; Appels, L.; Tan, T.; Dewil, R. Bioethanol from lignocellulosic biomass: Current findings determine research priorities. Sci. World J. 2014, 2014, 13. [Google Scholar] [CrossRef]
  15. Padella, M.; O’Connell, A.; Prussi, M. What is still limiting the deployment of cellulosic ethanol? Analysis of the current status of the sector. Appl. Sci. 2019, 9, 4523. [Google Scholar] [CrossRef] [Green Version]
  16. Frankó, B.; Galbe, M.; Wallberg, O. Bioethanol production from forestry residues: A comparative techno-economic analysis. Appl. Energy 2016, 184, 727–736. [Google Scholar] [CrossRef]
  17. Joelsson, E.; Wallberg, O.; Börjesson, P. Integration potential, resource efficiency and cost of forest-fuel-based biorefineries. Comput. Chem. Eng. 2015, 82, 240–258. [Google Scholar] [CrossRef]
  18. Alwarsdotter, Y. Personal Communication; SEKAB: Örnsköldsvik, Sweden, 2019. [Google Scholar]
  19. Swedish Forestry Industries Skogsindustrierna. Available online: https://www.skogsindustrierna.se (accessed on 30 November 2019).
  20. Swedish Forest Agency Skogsstyrelsen—Statistik. Available online: https://www.skogsstyrelsen.se/statistik/ (accessed on 30 November 2019).
  21. Sågverk, Branschfakta Nr 1, Stockholm; Swedish Environmental Protection Agency: Stockholm, Sweden, 2010.
  22. Ringman, M. Trädbränslesortiment: Definitioner Och Egenskaper; Sveriges Lantbruksuniversitet, Institutionen för Virkeslära: Uppsala, Sweden, 1996. [Google Scholar]
  23. Börjesson, P.; Gustavsson, L. Regional production and utilization of biomass in Sweden. Energy 1996, 21, 747–764. [Google Scholar] [CrossRef]
  24. Joelsson, J.; Di Fulvio, F.; De La Fuente, T.; Bergström, D.; Athanassiadis, D. Integrated supply of stemwood and residual biomass to forest-based biorefineries. Int. J. For. Eng. 2016, 27, 115–138. [Google Scholar] [CrossRef] [Green Version]
  25. Sassner, P.; Galbe, M.; Zacchi, G. Techno-economic evaluation of bioethanol production from three different lignocellulosic materials. Biomass Bioenergy 2008, 32, 422–430. [Google Scholar] [CrossRef]
  26. Dunn, J.B.; Mueller, S.; Wang, M.; Han, J. Energy consumption and greenhouse gas emissions from enzyme and yeast manufacture for corn and cellulosic ethanol production. Biotechnol. Lett. 2012, 34, 2259–2263. [Google Scholar] [CrossRef] [PubMed]
  27. Gilpin, G.S.; Andrae, A.S. Comparative attributional life cycle assessment of European cellulase enzyme production for use in second-generation lignocellulosic bioethanol production. Int. J. Life Cycle Assess. 2017, 22, 1034–1053. [Google Scholar] [CrossRef]
  28. Slade, R.; Bauen, A.; Shah, N. The greenhouse gas emissions performance of cellulosic ethanol supply chains in Europe. Biotechnol. Biofuels 2009, 2, 15. [Google Scholar] [CrossRef] [PubMed] [Green Version]
  29. Olofsson, J.; Barta, Z.; Börjesson, P.; Wallberg, O. Integrating enzyme fermentation in lignocellulosic ethanol production: Life-cycle assessment and techno-economic analysis. Biotechnol. Biofuels 2017, 10, 51. [Google Scholar] [CrossRef] [Green Version]
  30. Moro, A.; Lonza, L. Electricity carbon intensity in European Member States: Impacts on GHG emissions of electric vehicles. Transp. Res. Part D Transp. Environ. 2018, 64, 5–14. [Google Scholar] [CrossRef]
  31. Swedish Energy Agency Nya Regler för Hållbarhetskriterier för Biodrivmedel Och Flytande Biobärnslen. Available online: https://www.energimyndigheten.se/ (accessed on 6 February 2020).
  32. Vägledning Till Regelverket Om Hållbarhetskriterier för Biodrivmedel Och Flytande Biobränslen. ER 2012:27; Swedish Energy Agency: Estone, Sweden, 2012.
  33. Eriksson, E.; Gillespie, A.R.; Gustavsson, L.; Langvall, O.; Olsson, M.; Sathre, R.; Stendahl, J. Integrated carbon analysis of forest management practices and wood substitution. Can. J. For. Res. 2007, 37, 671–681. [Google Scholar] [CrossRef]
  34. Volvo Emissions from Volvo’s Trucks. Available online: www.volvotrucks.com (accessed on 31 October 2019).
  35. BioGrace BioGrace Version 4d. Available online: https://www.biograce.net/content/ghgcalculationtools/standardvalues (accessed on 30 November 2019).
  36. Ecoinvent Ecoinvent 3.5. Available online: https://www.ecoinvent.org/home.html (accessed on 26 November 2019).
  37. Dunn, J.B.; Adom, F.; Sather, N.; Han, J.; Snyder, S.; He, C.; Gong, J.; Yue, D.; You, F. Life-Cycle Analysis of Bioproducts and their Conventional Counterparts in GREET; Argonne National Lab.: Argonne, IL, USA, 2015. [Google Scholar]
  38. Börjesson, P.; Tufvesson, L.; Lantz, M. Life Cycle Assessment of Biofuels in Sweden; Lund University: Lund, Sweden, 2010. [Google Scholar]
  39. El-Suleiman, A.; Anosike, N.; Pilidis, P. A preliminary assessment of the initial compression power requirement in CO2 pipeline Carbon Capture and Storage (CCS) technologies. Technologies 2016, 4, 15. [Google Scholar] [CrossRef] [Green Version]
  40. Övervakningsrapport Avseende Skattebefrielse för Flytande Biodrivmedel Under 2018. Report Nr 2019-002678; Swedish Energy Agency: Estone, Sweden, 2019.
  41. European Union Fuel Quality Directive 2009/30/ECof the European Parliament and of the Council of 23 April 2009 Amending Directive 98/70/EC as Regards the Specification of Petrol, Diesel and Gas-Oil and Introducing a Mechanism to Monitor and Reduce Greenhouse Gas Emissions and Amending Council Directive 1999/32/EC as Regards the Specification of Fuel Used by Inland Waterway Vessels and Repealing Directive 93/12/EEC. Available online: https://eur-lex.europa.eu/LexUriServ/LexUriServ.do?uri=OJ:L:2009:140:0088:0113:EN:PDF (accessed on 23 April 2009).
  42. European Union Council Directive (EU) 2015/652 of 20 April 2015 Laying Down Calculation Methods and Reporting Requirements Pursuant to Directive 98/70/EC of the European Parliament and of the Council Relating to the Quality of Petrol and Diesel Fuels. Available online: https://eur-lex.europa.eu/legal-content/EN/TXT/PDF/?uri=CELEX:32015L0652&from=EN2015 (accessed on 20 April 2015).
  43. Swedish Tax Agency Skattesatser och Växelkurser. The Swedish Tax Agency. Available online: https://www.skatteverket.se/foretagochorganisationer/skatter/punktskatter/energiskatter/skattesatserochvaxelkurser.4.77dbcb041438070e0395e96.html (accessed on 13 November 2019).
  44. SPBI Utveckling av Försäljningspris för Bensin, Dieselbränsle Och Etanol. Available online: https://spbi.se/statistik/priser/ (accessed on 4 October 2019).
  45. Scenarier Över Sveriges Energisystem 2018; Swedish Energy Agency: Estone, Sweden, 2019.
  46. Becker, N.; Björnsson, L.; Börjesson, P. Greenhouse Gas Savings for Swedish Emerging Lignocellulose-Based Biofuels-Using the EU Renewable Energy Directive Calculation Methodology. Report No 104; Environmental and Energy Systems Studies, Lund Univeristy: Lund, Sweden, 2017. [Google Scholar]
  47. Lantz, M.; Prade, T.; Ahlgren, S.; Björnsson, L. Biogas and ethanol from wheat grain or straw: Is there a trade-off between climate impact, avoidance of iLUC and production cost? Energies 2018, 11, 2633. [Google Scholar] [CrossRef] [Green Version]
  48. ISO, 14044: 2006. Environmental Management-Life Cycle Assessment-Requirements and Guidelines; European Committee for Standardization: Brussels, Belgium, 2006. [Google Scholar]
  49. Camia, A.; Robert, N.; Jonsson, R.; Pilli, R.; García-Condado, S.; López-Lozano, R.; Van der Velde, M.; Ronzon, T.; Gurría, P.; M’barek, R. Biomass Production, Supply, Uses and Flows in the European Union. First Results from an Integrated Assessment; Publications Office of the European Union: Luxembourg, 2018. [Google Scholar]
  50. Soam, S.; Kapoor, M.; Kumar, R.; Borjesson, P.; Gupta, R.P.; Tuli, D.K. Global warming potential and energy analysis of second generation ethanol production from rice straw in India. Appl. Energy 2016, 184, 353–364. [Google Scholar] [CrossRef]
  51. Börjesson, P.; Lundgren, J.; Ahlgren, S.; Nyström, I. Sustainable Transportation Biofuels Today and in the Future: Summary; The Swedish Knowledge Centre for Renewable Transportation Fuels: Göteborg, Sweden, 2016. [Google Scholar]
  52. Zhao, L.; Zhang, X.; Xu, J.; Ou, X.; Chang, S.; Wu, M. Techno-economic analysis of bioethanol production from lignocellulosic biomass in China: Dilute-acid pretreatment and enzymatic hydrolysis of corn stover. Energies 2015, 8, 4096–4117. [Google Scholar] [CrossRef]
  53. Stephen, J.D.; Mabee, W.E.; Saddler, J.N. Will second-generation ethanol be able to compete with first-generation ethanol? Opportunities for cost reduction. Biofuels Bioprod. Biorefining 2012, 6, 159–176. [Google Scholar] [CrossRef]
  54. Stephen, J.D.; Mabee, W.E.; Saddler, J.N. The ability of cellulosic ethanol to compete for feedstock and investment with other forest bioenergy options. Ind. Biotechnol. 2014, 10, 115–125. [Google Scholar] [CrossRef]
  55. Swedish Parliament Fossilfria drivmedel för att minska transportsektorns klimatpåverkan; Report 2017/18:RFR13; Traffic Committee: Stockholm, Sweden, 2018.
Figure 1. Annual feedstock input and ethanol and co-product outputs (DM) at the studied ethanol production plant [ton/year].
Energies 13 01048 g001
Figure 2. GHG emissions [g CO2-eq/MJ Ethanol] for the different alternatives. Net values shown above bars.
Energies 13 01048 g002
Figure 3. The relation between GHG emission and GHG-adjusted ethanol price in the Swedish reduction obligation system based on current fuel prices (2018), and assuming the same average GHG emission as for fuel ethanol used in Sweden in 2018.
Energies 13 01048 g003
Table 1. Overview of the alternative cases studied.
FactorBase CaseAlternativeChange
EnzymeBest available technologyAPublished data on commercial enzymes
Power productionSwedish electricity mixBNordic electricity mix
Heat productionStand-alone wood chip boilerCInternal use of lignin pellets
Feedstock availability2/3 (70 km transport distance)D1/3 (100 km transport distance)
Transportation fuelSwedish diesel blendEBiodiesel, HVO100
CO2 captureNo captureF30% capture and use
Table 2. Input of chemicals, nutrients and enzymes in the production process.
Input[kg CO2-eq/kg]Reference
Sulphur dioxide0.36[36]
Sodium hydroxide 0.95[36]
Sulphuric acid0.09[36]
Antifoam1.33[29]
Trace minerals0.44[37]
Urea 2.63[36]
Enzymes: low carbon footprint6.05 a[27]
Enzymes: Alternative A 5.50 a[29]
[g CO2-eq/MJ]
Swedish electricity mix13.1[30]
Nordic electricity mix34.9[32]
Heat (wood chip boiler)3.4 b[38]
Diesel (77% diesel/23% biodiesel)77.2[5]
HVO1008.8[5]
a The emissions from enzyme production in the base case is based on future production data with renewable energy and sugar beet molasses as carbon source, and is given per kg enzyme protein. The Alternative A data are given for the commercial product Cellic® Ctec 3 (Novozymes) and per kg enzyme formula; b Per MJ wood chips.
Table 3. Data used for economic calculations in the production of sawdust-based ethanol.
ParameterUnitValueReference
Fossil petrol comparatorg CO2-eq/MJ93.3[41]
LHV petrol aMJ/L32.2[42]
Tax (energy and CO2) b/L0.64[43]
Petrol price c/L0.59[44]
Current GHG emission from ethanol (2018) dg CO2-eq/MJ30[6]
Current ethanol price at filling station (excl. taxes) c/L0.896[44]
Cost of domestic storage and distribution of ethanol e /L0.017[40]
Cost ethanol net margin (including profit)/L0.372[40]
Exchange rateSEK/10.33[43]
a Petrol typically used in Sweden differs somewhat from the European average (32.0 MJ/L); b Tax levied on both petrol and ethanol within the reduction obligation since 1 July 2019. The current tax is per L fuel, not per energy unit, which gives the impact that renewable ethanol is taxed higher than fossil petrol per energy unit; c Average price July-October 2019 to costumer at manned filling stations, excluding Value Added Tax (VAT) (25%) and tax; d Average GHG emission from ethanol used as biofuel in Sweden in 2018; e Including labour and capital costs.
Table 4. Blend-in demand and price of ethanol in the Swedish reduction obligation system 2020.
ParameterUnitFuel EthanolSawdust-Based Ethanol
Average Sweden, 2018HighBase CaseLow
Ethanol GHG emissiong CO2-eq/MJ3015.86.72.5
Ethanol blend-in% energy6.25.14.54.3
% volume9.27.66.86.5
Energy (Lower Heating Value) fuel blendMJ/L31.231.431.431.5
Price of fuel to customer (excl. taxes) a/GJ19.7
Price of fuel to customer (excl. taxes)/L0.6150.6190.6200.621
Price of ethanol at filling station (incl. distribution and margin, etc.)/L0.901.011.091.12
Price of ethanol at the point of import /L0.510.620.700.73
a Based on current ethanol and petrol price (2019) and current (2018) GHG emissions for fuel ethanol used in Sweden. Used as a reference value for the sawdust-based ethanol calculations.

