1. Introduction
Multi-fractured shale gas/oil wells with high water recoveries after hydraulic fracturing are normally low-productivity wells, while those with 10% to 40% water recoveries are normally high-productivity wells. The water loss into the formation does not hinder the gas/oil flow into the wellbore. Ehlig-Economides and Economides [
1] attributed this effect to the, “water as proppant”. Some shale gas and oil wells undergo month-long shut-in times after multi-stage hydraulic fracturing well stimulation. Such shut-in episodes increase the gas and oil flow rate. The mechanism behind it is not well understood.
Makhanov et al. [
2] investigated spontaneous imbibition in shale formations at the lab scale and found the rate of fluid imbibition to be a function of the type and concentration of salts, surfactants, and viscosifiers. Anionic surfactant was shown to impede imbibition rate and the effect becomes pronounced with the addition of salt, such as KCl, to the surfactant solution. A suggested approach to predict field observations from lab data indicated that low fracturing fluid recovery after shut-in period is in part due to spontaneous imbibition of water into the shale matrix—a phenomenon which depends on fluid/shale properties, fracture-matrix interface, and soaking time. They observed that for clay-rich organic shales, considerable spontaneous imbibition could occur for viscous solution—the explanation being the preferential adsorption of water molecules by clay particles. A similar observation was made by Zolfaghari et al. [
3] when they studied the role of clays on water sorption behavior of gas shale samples.
Fakcharoenphol et al. [
4] conducted numerical experiments to explore the consequences of long shut-in times on initial gas production rate and water load recovery in shale gas reservoirs. Their simulations supported some field observations of increased gas and oil rates after long shut-in periods. Osmotic pressure, capillary pressure, matrix wettability, and relative permeability were identified as key parameters affecting such increase in production after shut-in. They concluded that the observed lower flowrates immediately after fracturing is due to the fracture network being saturated with water which obstructs gas or oil flow. During shut-in, the injected water moves into the shale matrix—a mechanism controlled by gravity, capillary and/or osmotic pressure. A reduction in water saturation within the fractures allows higher gas flowrates. This increase in flowrate occurs for only a short period and is pore connectivity dependent.
Noe and Crafton [
5] evaluated the effect of early production schedule on well productivity in over 270 wells. They analyzed the impacts of the period between multistage fracture stimulation and first production and well shut-in after first production on well productivity. Their results and conclusions were contrary to the conclusions reached by Fakcharoenphol et al. [
4], as described above, and by other researchers [
6]. Relying on hourly/daily rates and pressures data, they found that delay in first production and subsequent shut-ins are in fact detrimental, contrary to the perceived benefits derived from these management procedures. There was, however, a view in that, with regards to shut-in, the effects are usually, but not always, harmful. Damage arising from shut-in accumulates for each subsequent shut-in episode and in the long term provides poor reservoir-wellbore connectivity. However, there is no relationship between shut-in time and severity of the resulting damage. It is of their view that, the damage arising from the delays and shut-in could be mitigated by use of adequate concentration of an interfacial tension modifier fluid to minimize the influence of pressure-related energy consumed in interfacial tension and fluid/solid contact angles.
Javadpour et al. [
7] presented experimentally obtained permeabilities of 152 samples from nine shale gas reservoirs with pore-size distribution of several shale samples at 60,000-psi mercury injection pressure. This tends not to support the hypothesis of imbibition as a dominating mechanism of soaking. Wu et al. [
8] showed extremely slow processes of fluid flow in shale. The time required to seep through matrix with 10
−9 m
2 permeability for 1 cm distance is more than 100 years.
McClure and Zoback [
9] observed an increase in Initial Shut-In Pressure (ISIP) from the toe to heal of five Barnett shale wells during multistage hydraulic fracturing treatment. For wells experiencing greater shut-in times, the increasing trend was minimal. Using calculations and numerical simulations, they concluded that stress shadowing could be a cause for the observed trends, but cannot be the only factor, or else there would have been an observed plateau after some stages of fracturing. Heterogeneity in formation properties and variations in operational parameters, such as proppant schedule, could be contributing factors.
Sinha et al. [
10] proposed shut-in practices for dry gas shale reservoirs based on a study of wells in Marcellus shale. They postulated that an increase of water saturation in the shale matrix during shut-in causes permeability impairment and ultimately reduction in gas rates. The study also showed that the length of time of shut-in, and period in the life of the well in which the shut-in is planned, is critical to well productivity. They concluded that later shut-in has less impact than early shut-in on well productivity.
Clay minerals in shale samples preferentially imbibe water—an observation corroborated by Makhanov et al. [
2] creating microfractures and a mechanism, which increases porosity and permeability and effectively enhances gas flow rates. To support this hypothesis, Gupta et al. [
11] conducted laboratory experiments to measure the strain and stress induced by water imbibition in gas shale. Their results showed an increase in the porosity of the shale samples and a reduction in water imbibition rate when stress is applied to the shale samples.
In summary, different hypotheses/theories have been proposed to interpret the phenomena of increased productivity of multi-fractured wells in shale gas/oil reservoirs due to well shut-in. They include the matrix imbibition, stress shadow, and micro-fracture imbibition. These hypotheses/theories are conflicting and not thorough enough to be applied to analysis of the behavior of fractured shale gas/oil wells.
On the basis of laboratory observation, this paper presents a theory of dynamic post-frac cracking of shale rocks and its effect on productivity of shale gas/oil wells. The result presented in this paper demonstrates that the cracking of shale rocks during the “soaking” period is responsible for further stimulation of shale rocks in the fractured regions and thus for increasing well productivity. The optimum shut-in time can be determined using real time well pressure observed during the shut-in period. A data-driven approach to finding the optimum shut-in time has been developed for field applications.
2. Laboratory Observations
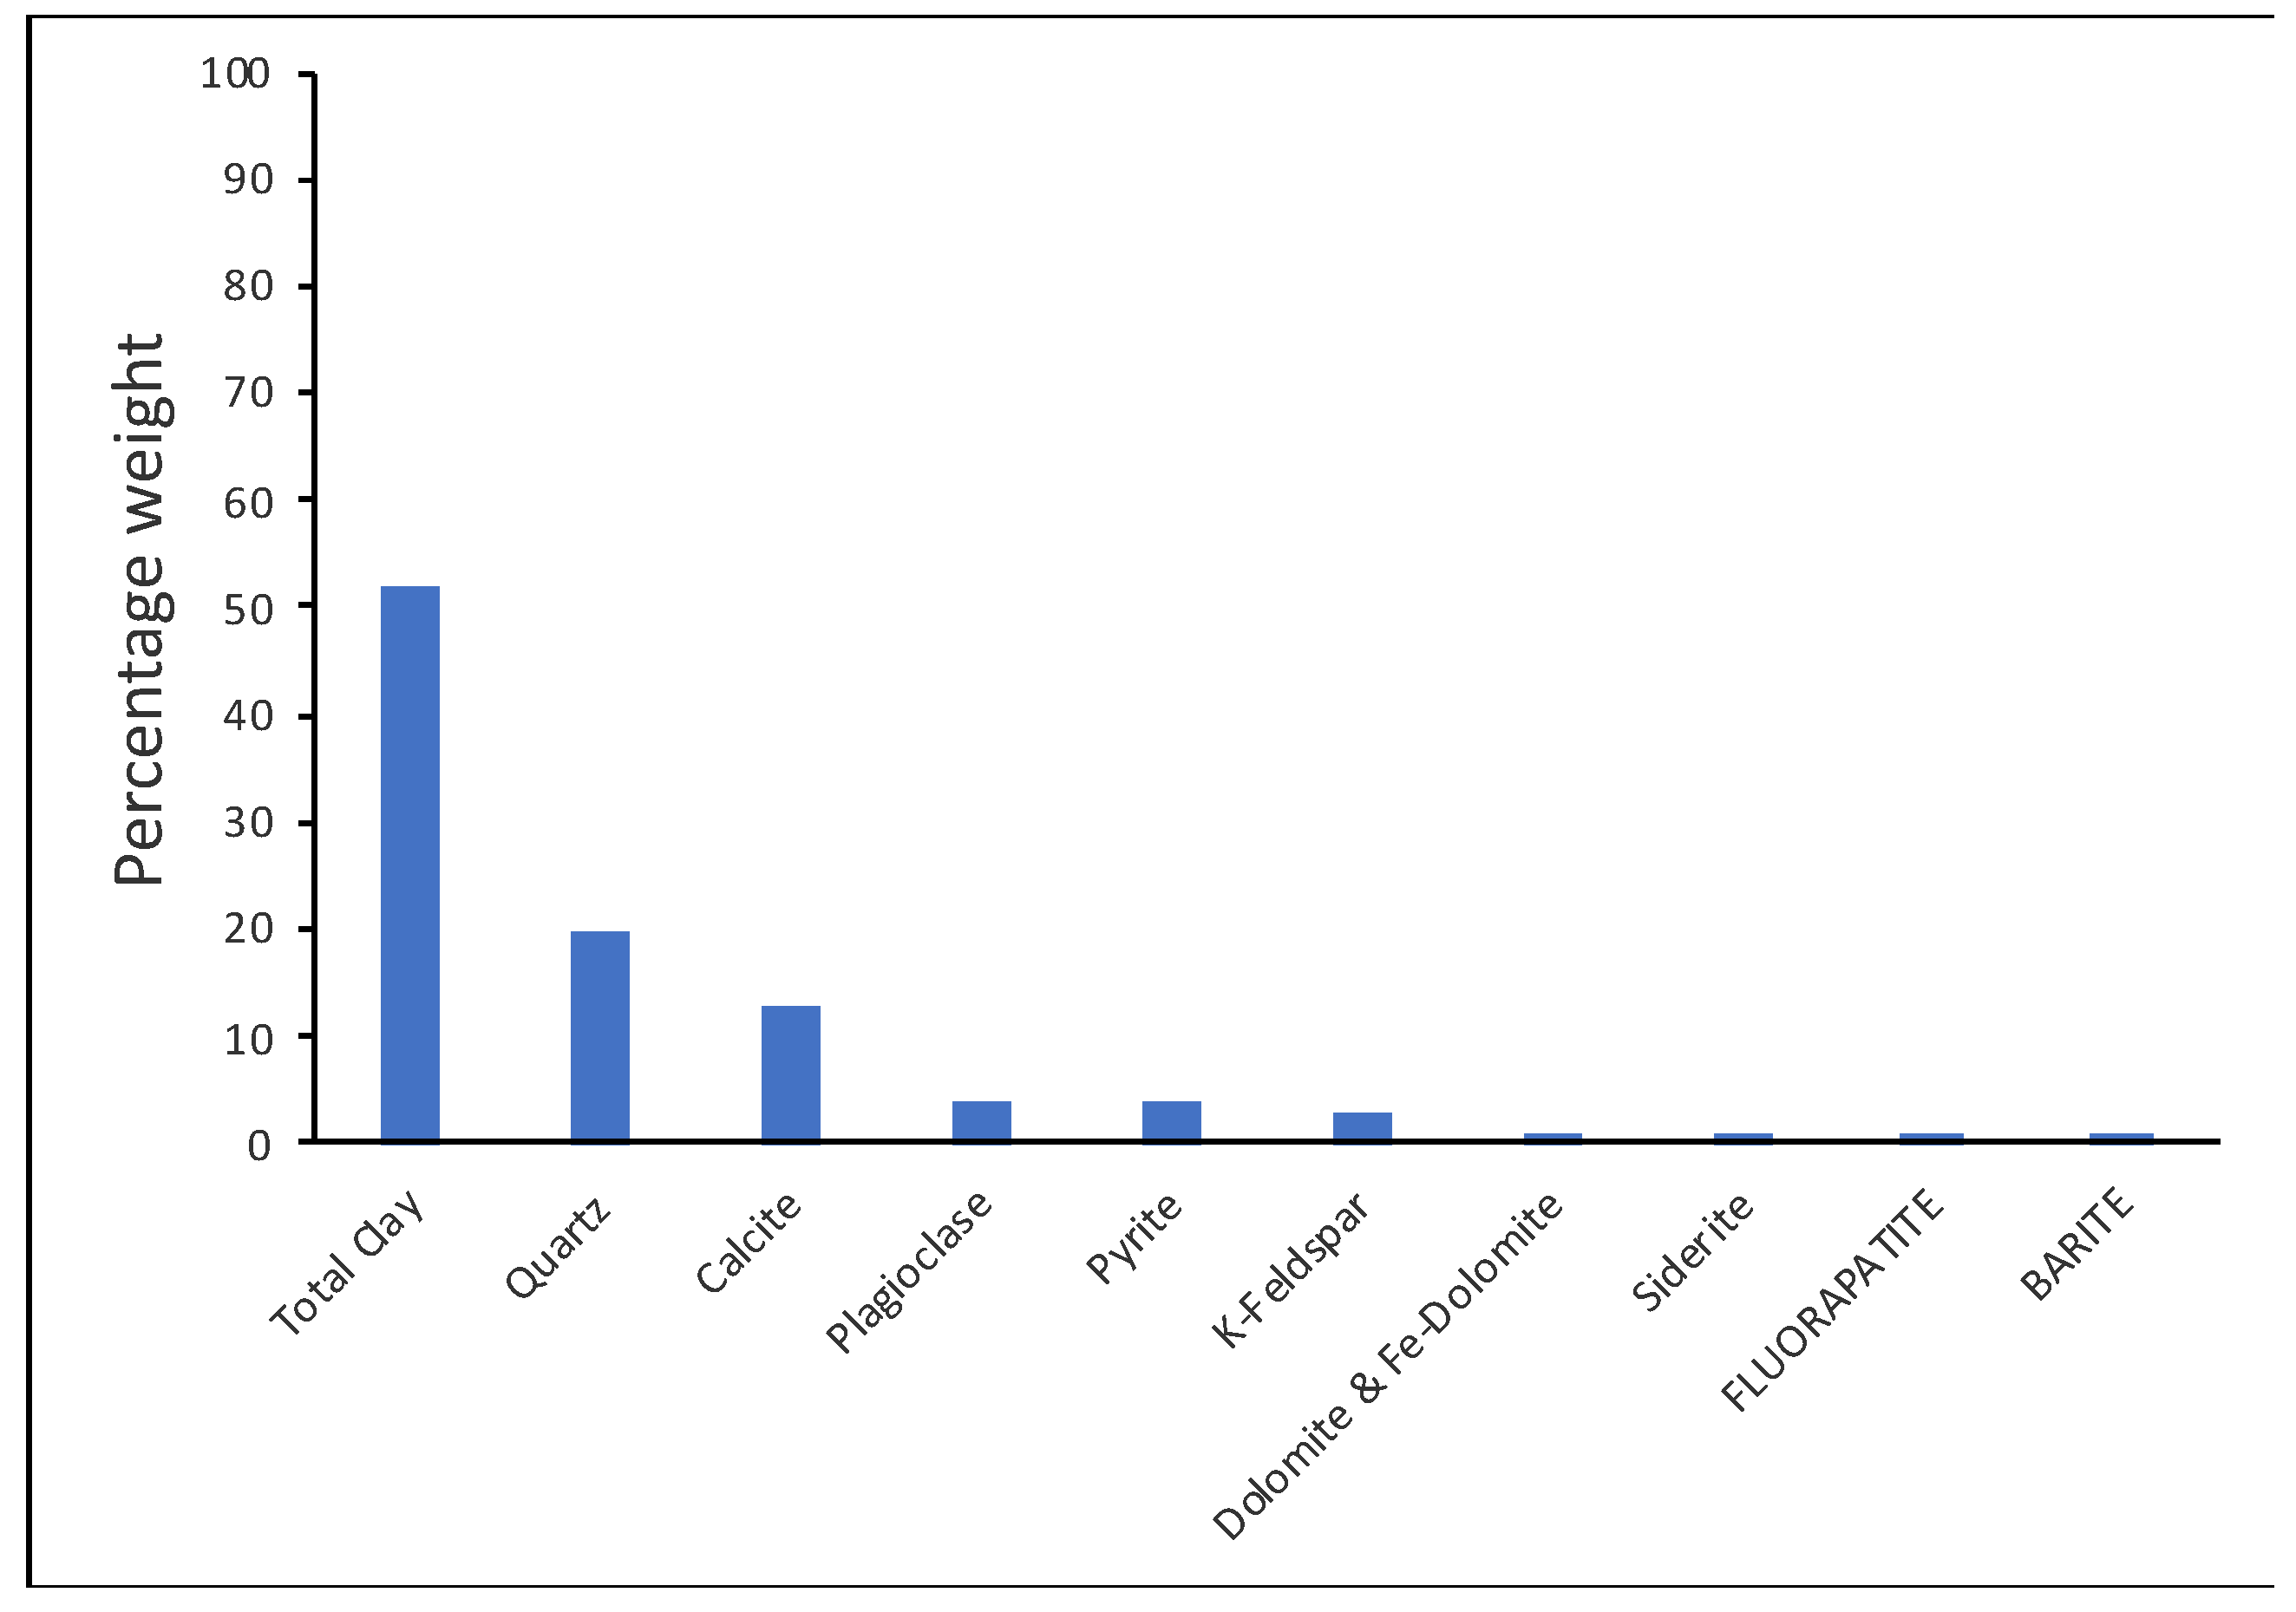
Clay-rich cores from the producing interval of a well in Louisiana were tested in our laboratory for its reactions to water and ceramic proppants. The tested cores were cut from larger core samples drilled by conventional means and well preserved at room conditions against absorption of moisture—they were wrapped in transparent plastic stretch films and kept in large zip lock bags. The cores were used for the experiments in their original state; thus, they were neither oven dried nor saturated with any fluid. The core characteristics and mineralogy are shown in
Table 1 and
Figure 1 respectively, indicating that the core is from a high-clay content shale. This is confirmed by the recent work by Borrok et al. [
12].
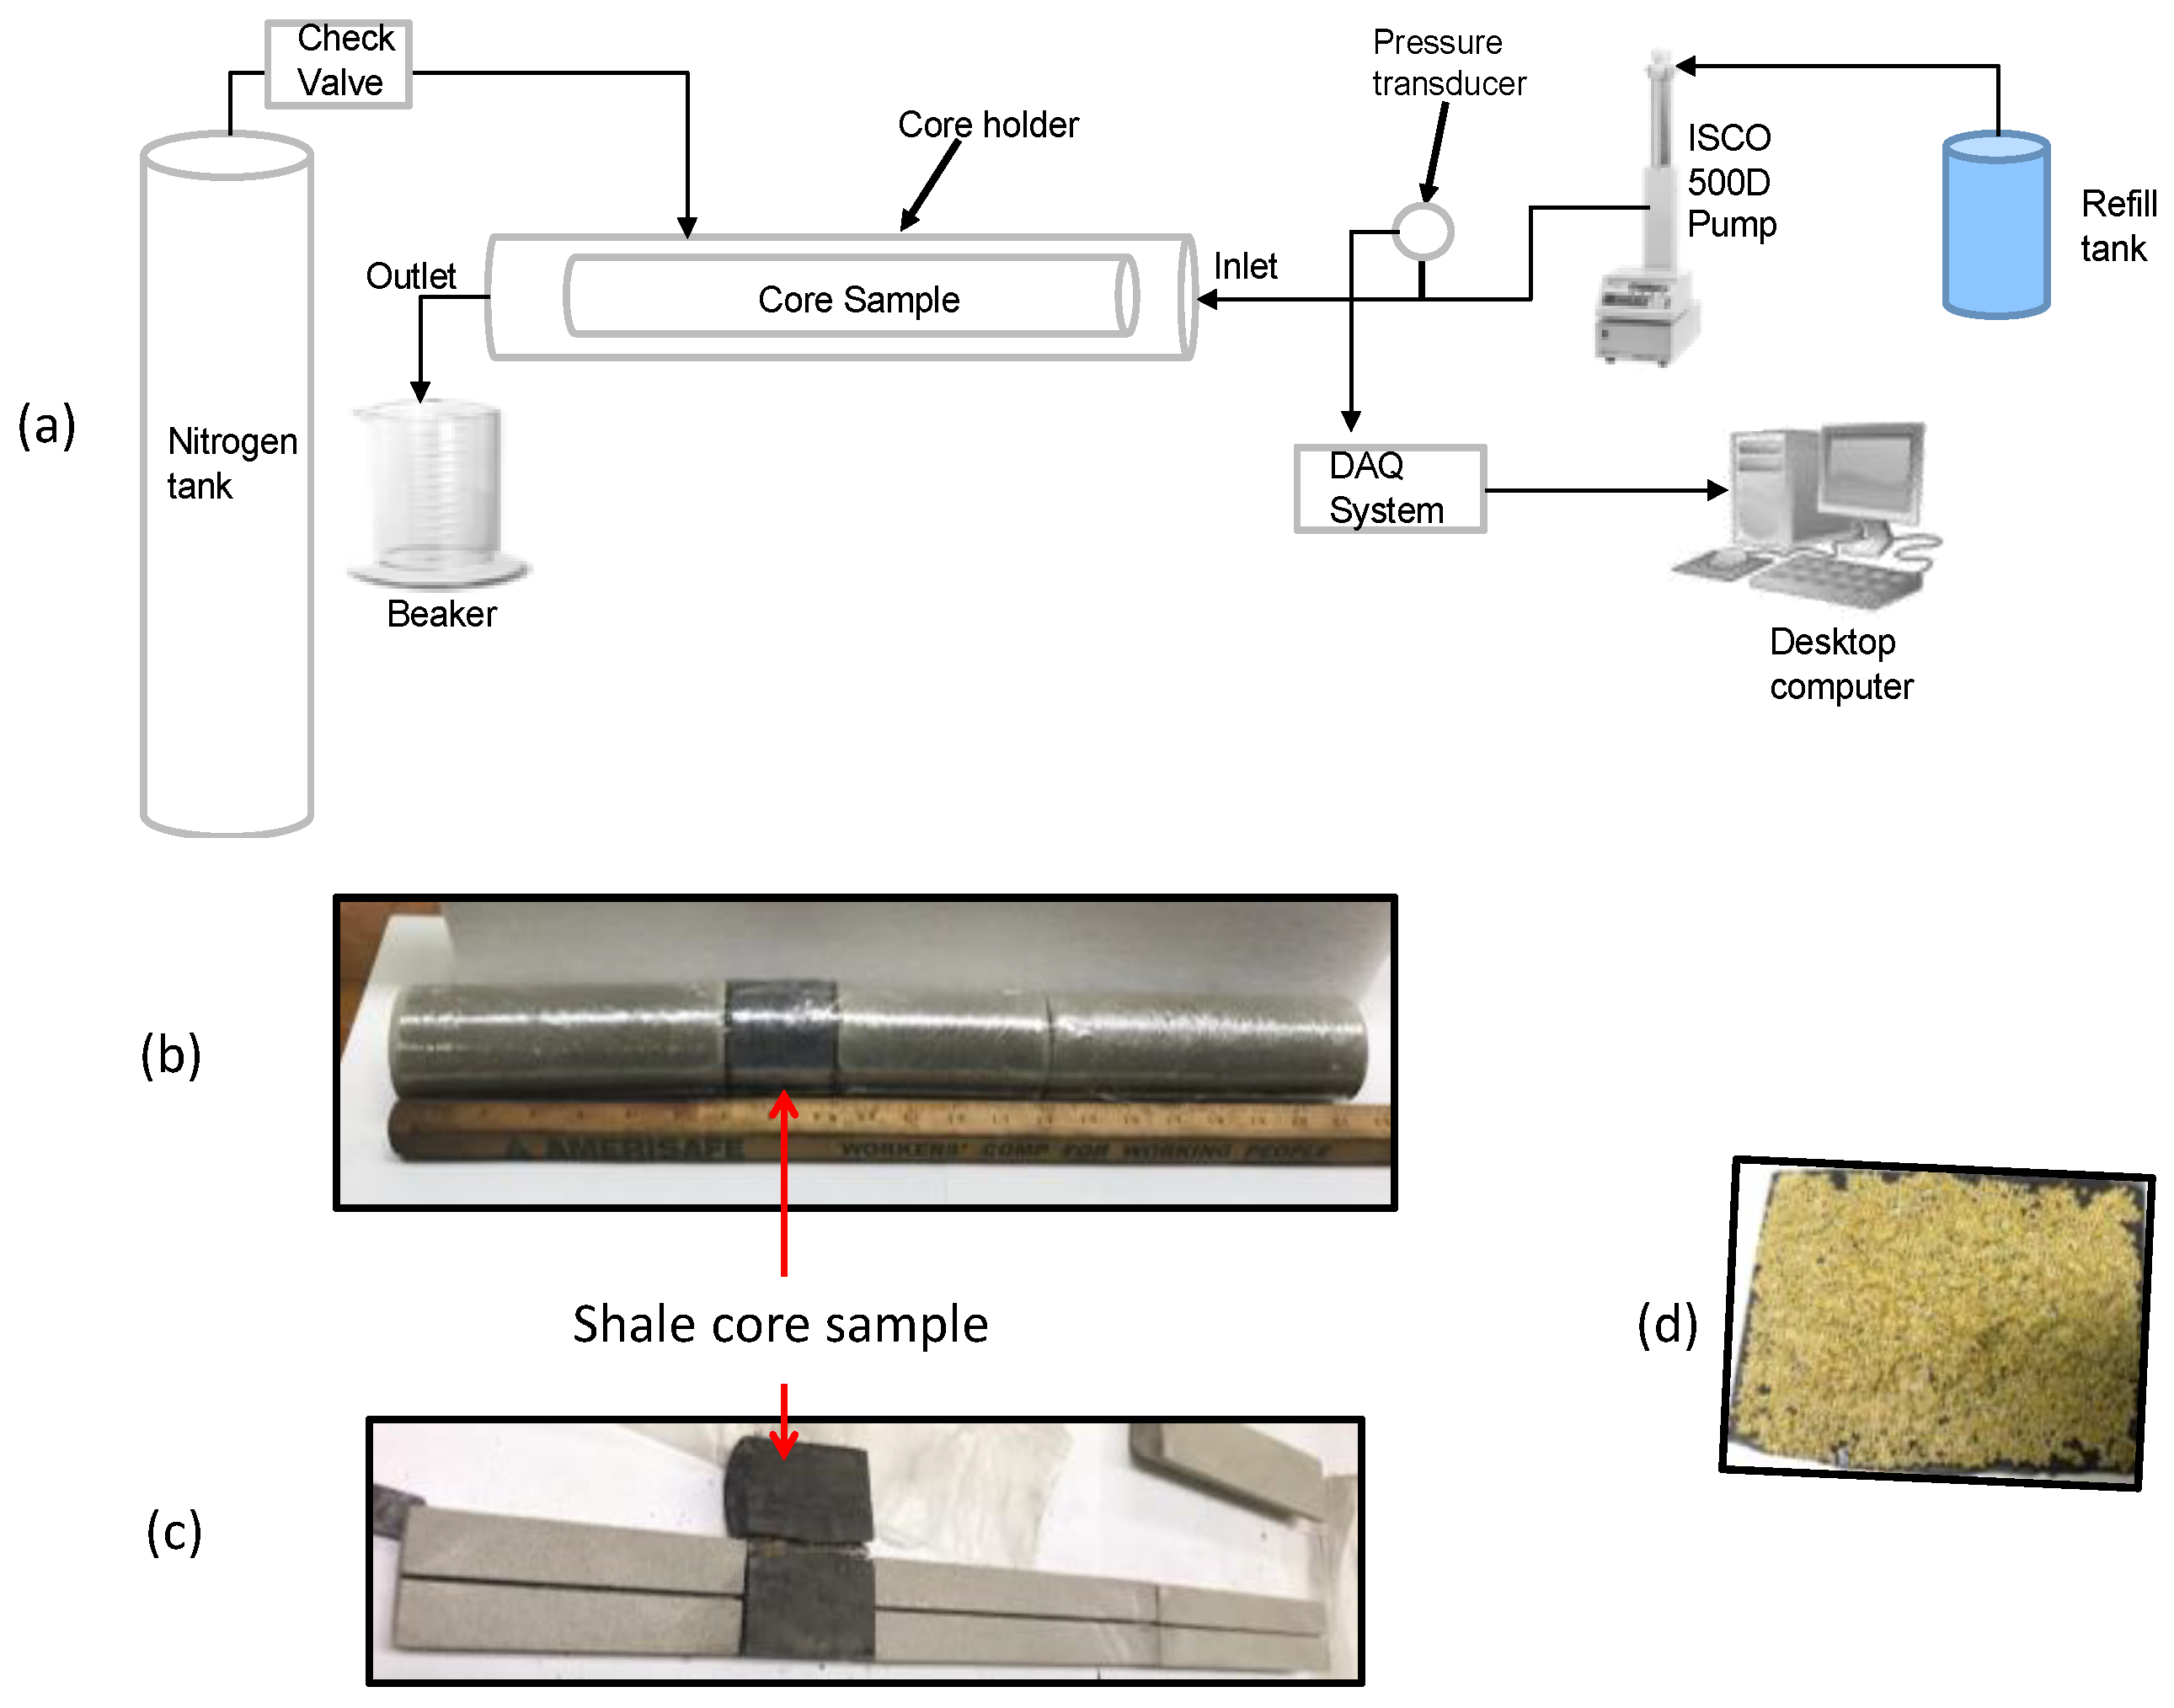
Figure 2 shows the experimental design where
Figure 2a presents a flow sketch,
Figure 2b displays the core sample placed in the core holder,
Figure 2c illustrates the splitted shale core sample simulating hydraulic fractured shale, and
Figure 2d demonstrates 20/40 ceramic proppant placed between the splitted core parts to simulate a hydraulic fracture. Test 1 was carried out with a proppant density of 0.2 lbm/ft
2 under 500 psi and 1000 psi confining pressures at water injection rates of 5 cc/min, 15 cc/min, and 30 cc/min. Test 2 was performed with a proppant density of 0.11 lbm/ft
2 under 1000 psi confining pressure at a water injection rate 30 cc/min. These experimental parameter values were selected to test fracture conductivity and proppant embedment, not specifically for fluid soaking, as soaking test does not require flowing fluids.
Both of the tests were run for 10 hours.
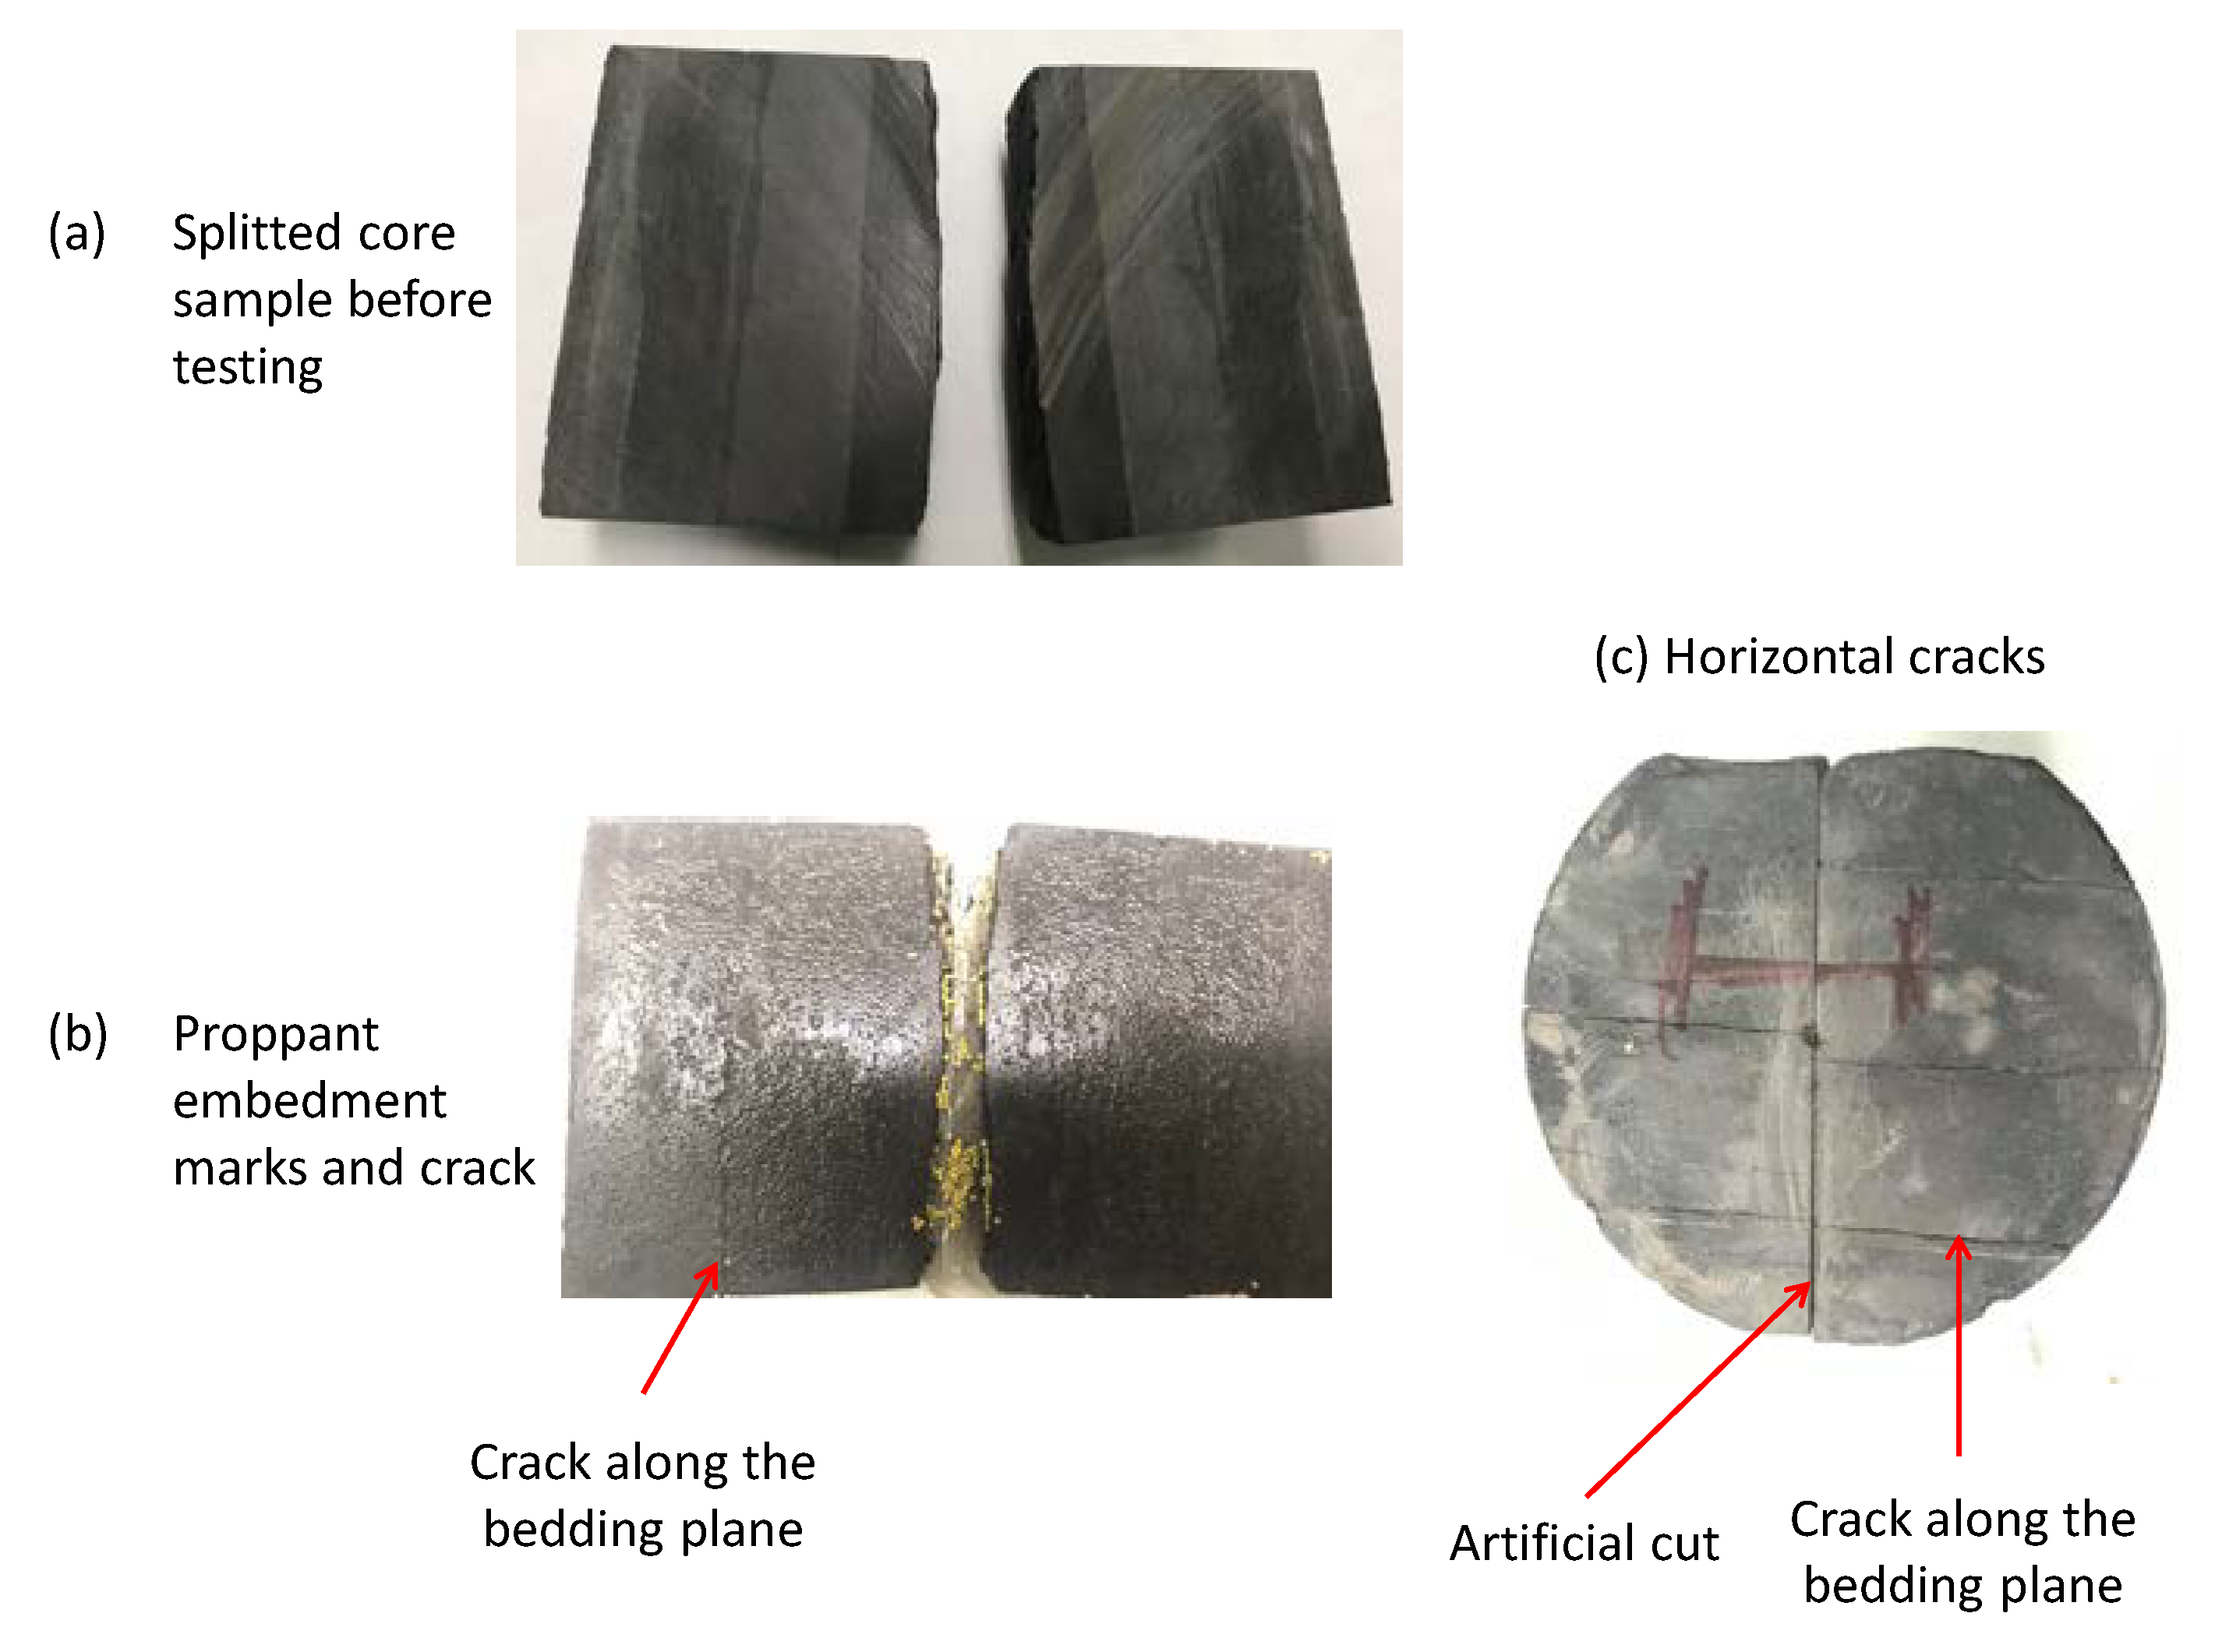
Figure 3 presents result of Test 2 where
Figure 3a illustrates a splitted core parts before testing,
Figure 3b displays the proppant embedment marks and a crack after testing, and
Figure 3c shows four cracks along the bedding plane after testing (two cracks per inch of diameter).
The shale core sample was found relatively dry except the wet cracks. It is believed that water imbibed into the shale core in form of cracks, not seepage into the matrix. Therefore the term “soaking” is misleading. However, this term is still used in this work because it has been commonly adopted by researchers to interpret the loss of fracturing fluid into shale gas/oil formations. The fluid soaking owing to loss of fluid into cracks in shale is also evidenced in drilling operations. Aston et al. [
13] proposed a treatment for wellbore strengthening in shale using nanoparticles to seal near wellbore cracks. The mechanism was revisited by Contreras et al. [
14].
3. Mathematical Model
This section presents an analytical model to describe the propagation of cracks in shale gas/oil formations during the soaking process in multi-stage fractured horizontal wells. Potential applications of the model and data requirement are also discussed.
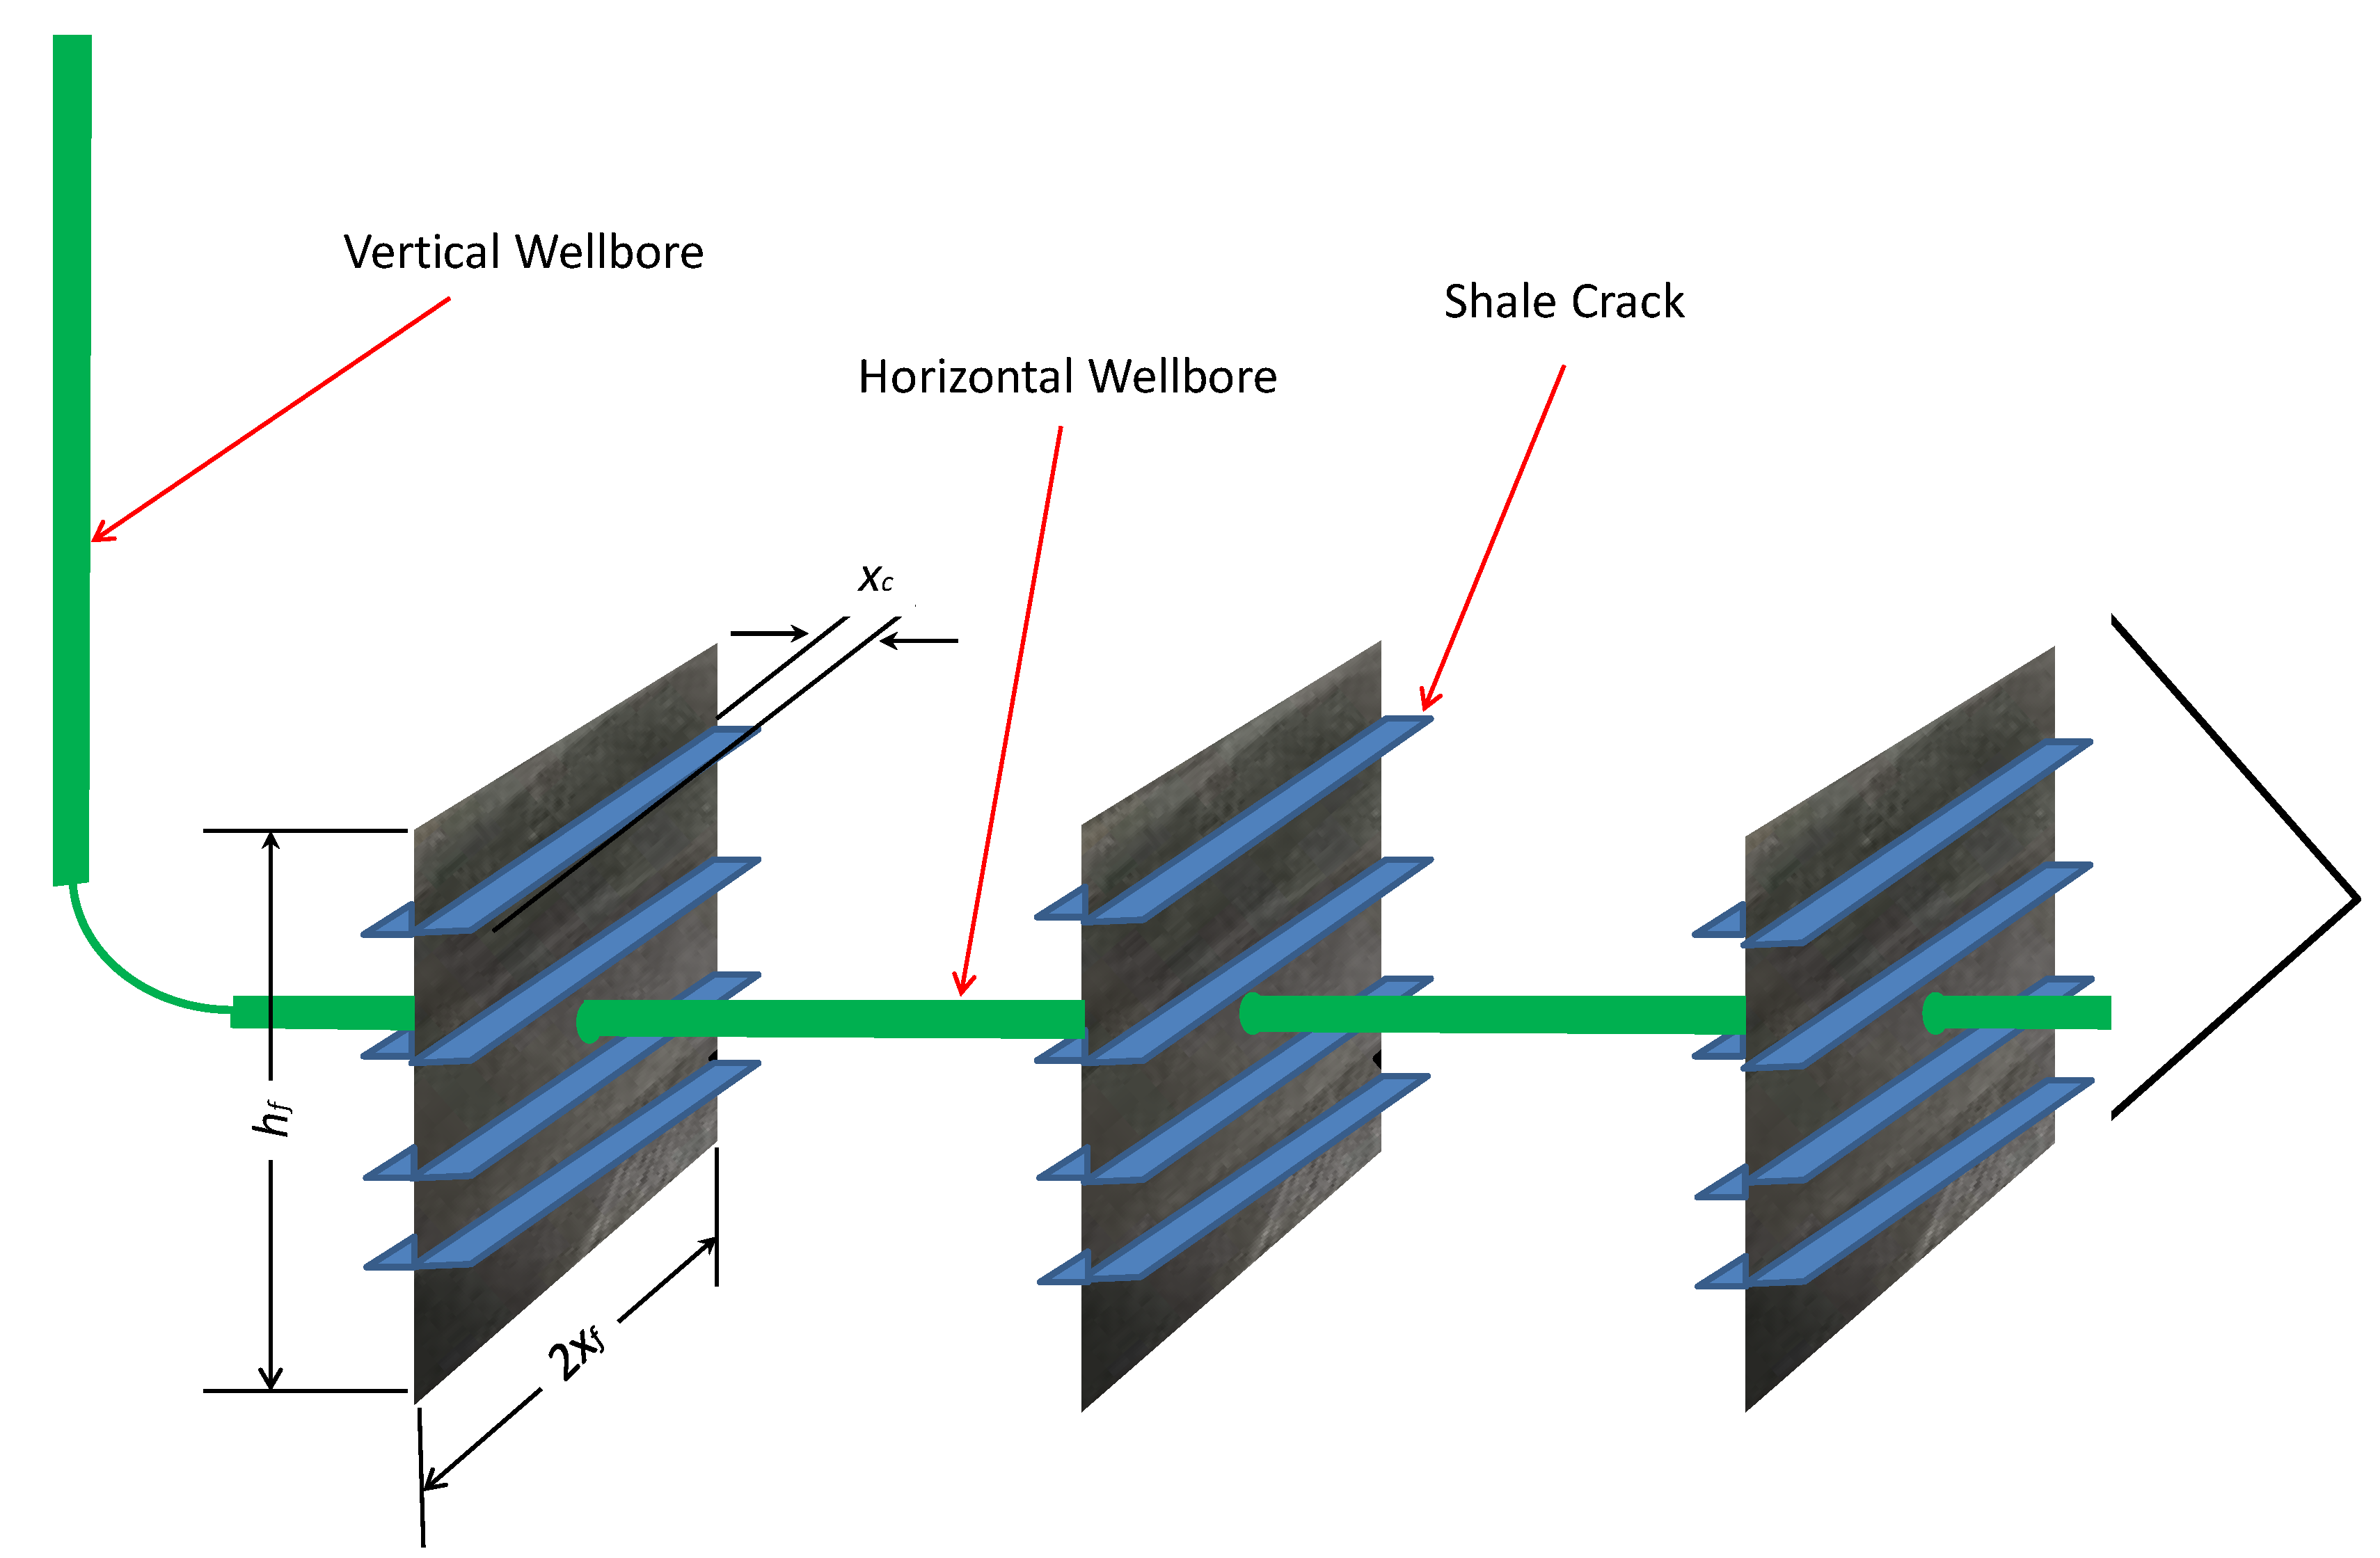
Crack Propagation Model. A mathematic model for crack propagation was developed on the basis of assumed system configuration of hydraulic fractures and shale cracks in multi-stage fractured horizontal wells shown in
Figure 4, where only three fractures and a few shale racks are illustrated. On the principle of force balance between capillary pressure and frictional pressure in a crack, the following Equation is derived in
Appendix A for describing crack penetration depth:
where
xc is crack depth in ft,
Vc is crack volume (fluid loss to the shale formation) in ft
3,
nf is number of hydraulic fractures,
nc is number of cracks,
σ is interfacial tension in dyne/cm,
θ is contact angle in degree,
Sw is water saturation in shale (fraction),
m is saturation exponent,
μ is viscosity of fracturing fluid in cp,
qc is volumetric flow rate of fracturing fluid in crack in ft/day, and
Lc is crack length in ft (assumed to be equal to fracture length). The dynamic crack width is expressed by
where
wc is the dynamic crack width in inch.
3.1. Potential Applications
The crack propagation model can be applied to identification of the optimum soaking time for maximizing well productivity. The shale cracks developed in soaking process provide flow paths for gas/oil to flow from shale matrix to hydraulic fractures, which is expected to improve well inflow performance, while the loss of fracturing fluid into the cracks also results in the partial closure of hydraulic fractures, which reduces well inflow performance. There exists an optimum soaking time at which the adequate depth of crack is achieved while the hydraulic fractures are still open enough for effectively transporting gas and oil. The reduction in hydraulic fracture width is predicted by (see
Appendix A for derivation):
where Δ
wf is reduction in fracture width.
A term called fold of increase (
FoI) is used in this study to evaluate well productivity improvement owing to water soaking. The
FoI is defined as
Mathematical expression of the FoI is (see
Appendix B for derivation):
Plotting the FoI in real soaking time will allow identifying the time when the FoI is maximal. This is the time expected to start the flowback process and well production.
3.2. Data Requirement
In order to apply the mathematical model to identification of the optimum soaking time, data for model parameters are required. The most crucial data are the real-time well shut-in pressure. If positive well head pressure is not observed, the real-time bottom hole pressure needs to be obtained. Unfortunately, this data set is not measured and recorded real-time in today’s industry. Suppose this data set is continuously measured, the dynamic crack volume (fluid loss to the shale formation)
Vc in Equations (1)–(2) can be calculated by (see derivation in
Appendix A):
where
cf (psi
-1) is compressibility of fracturing fluid,
Vf (ft
3) is total pumped volume of fracturing fluid in the fractures and wellbore,
psi (psi) is the initial shut-in pressure, and
p (psi) the shut-in pressure at soaking time. The dynamic flow rate in crack
qc in Equations (1) and (2) can be calculated by (see derivation in
Appendix A):
where the dynamic rate of pressure decline
dp/dt can be numerically calculated using the real-time pressure data
p.
The analytical crack model assumes that all cracks initiate on the first day of soaking. The number of cracks may be estimated on the basis of soaking test in laboratory with real shale cores from the fractured interval and well logs that identify vertical heterogeneity in the interval. This requires additional studies.
4. Case Analysis
This section illustrates how to use the shale crack model and shut-in pressure data to identify the optimum soaking time in a shale play. Shut-in well pressure has seldom been measured during the water-soaking period. Kholy et al. [
15] measured shut-in pressure for five hours after fracturing treatment to predict hydraulic fracture closure pressure. They found that the shut-in pressure declines linearly with time after a transition period beyond fracture closure. The shut-in time is too short to analyze soaking processes that commonly last a few weeks. Makhanov et al. [
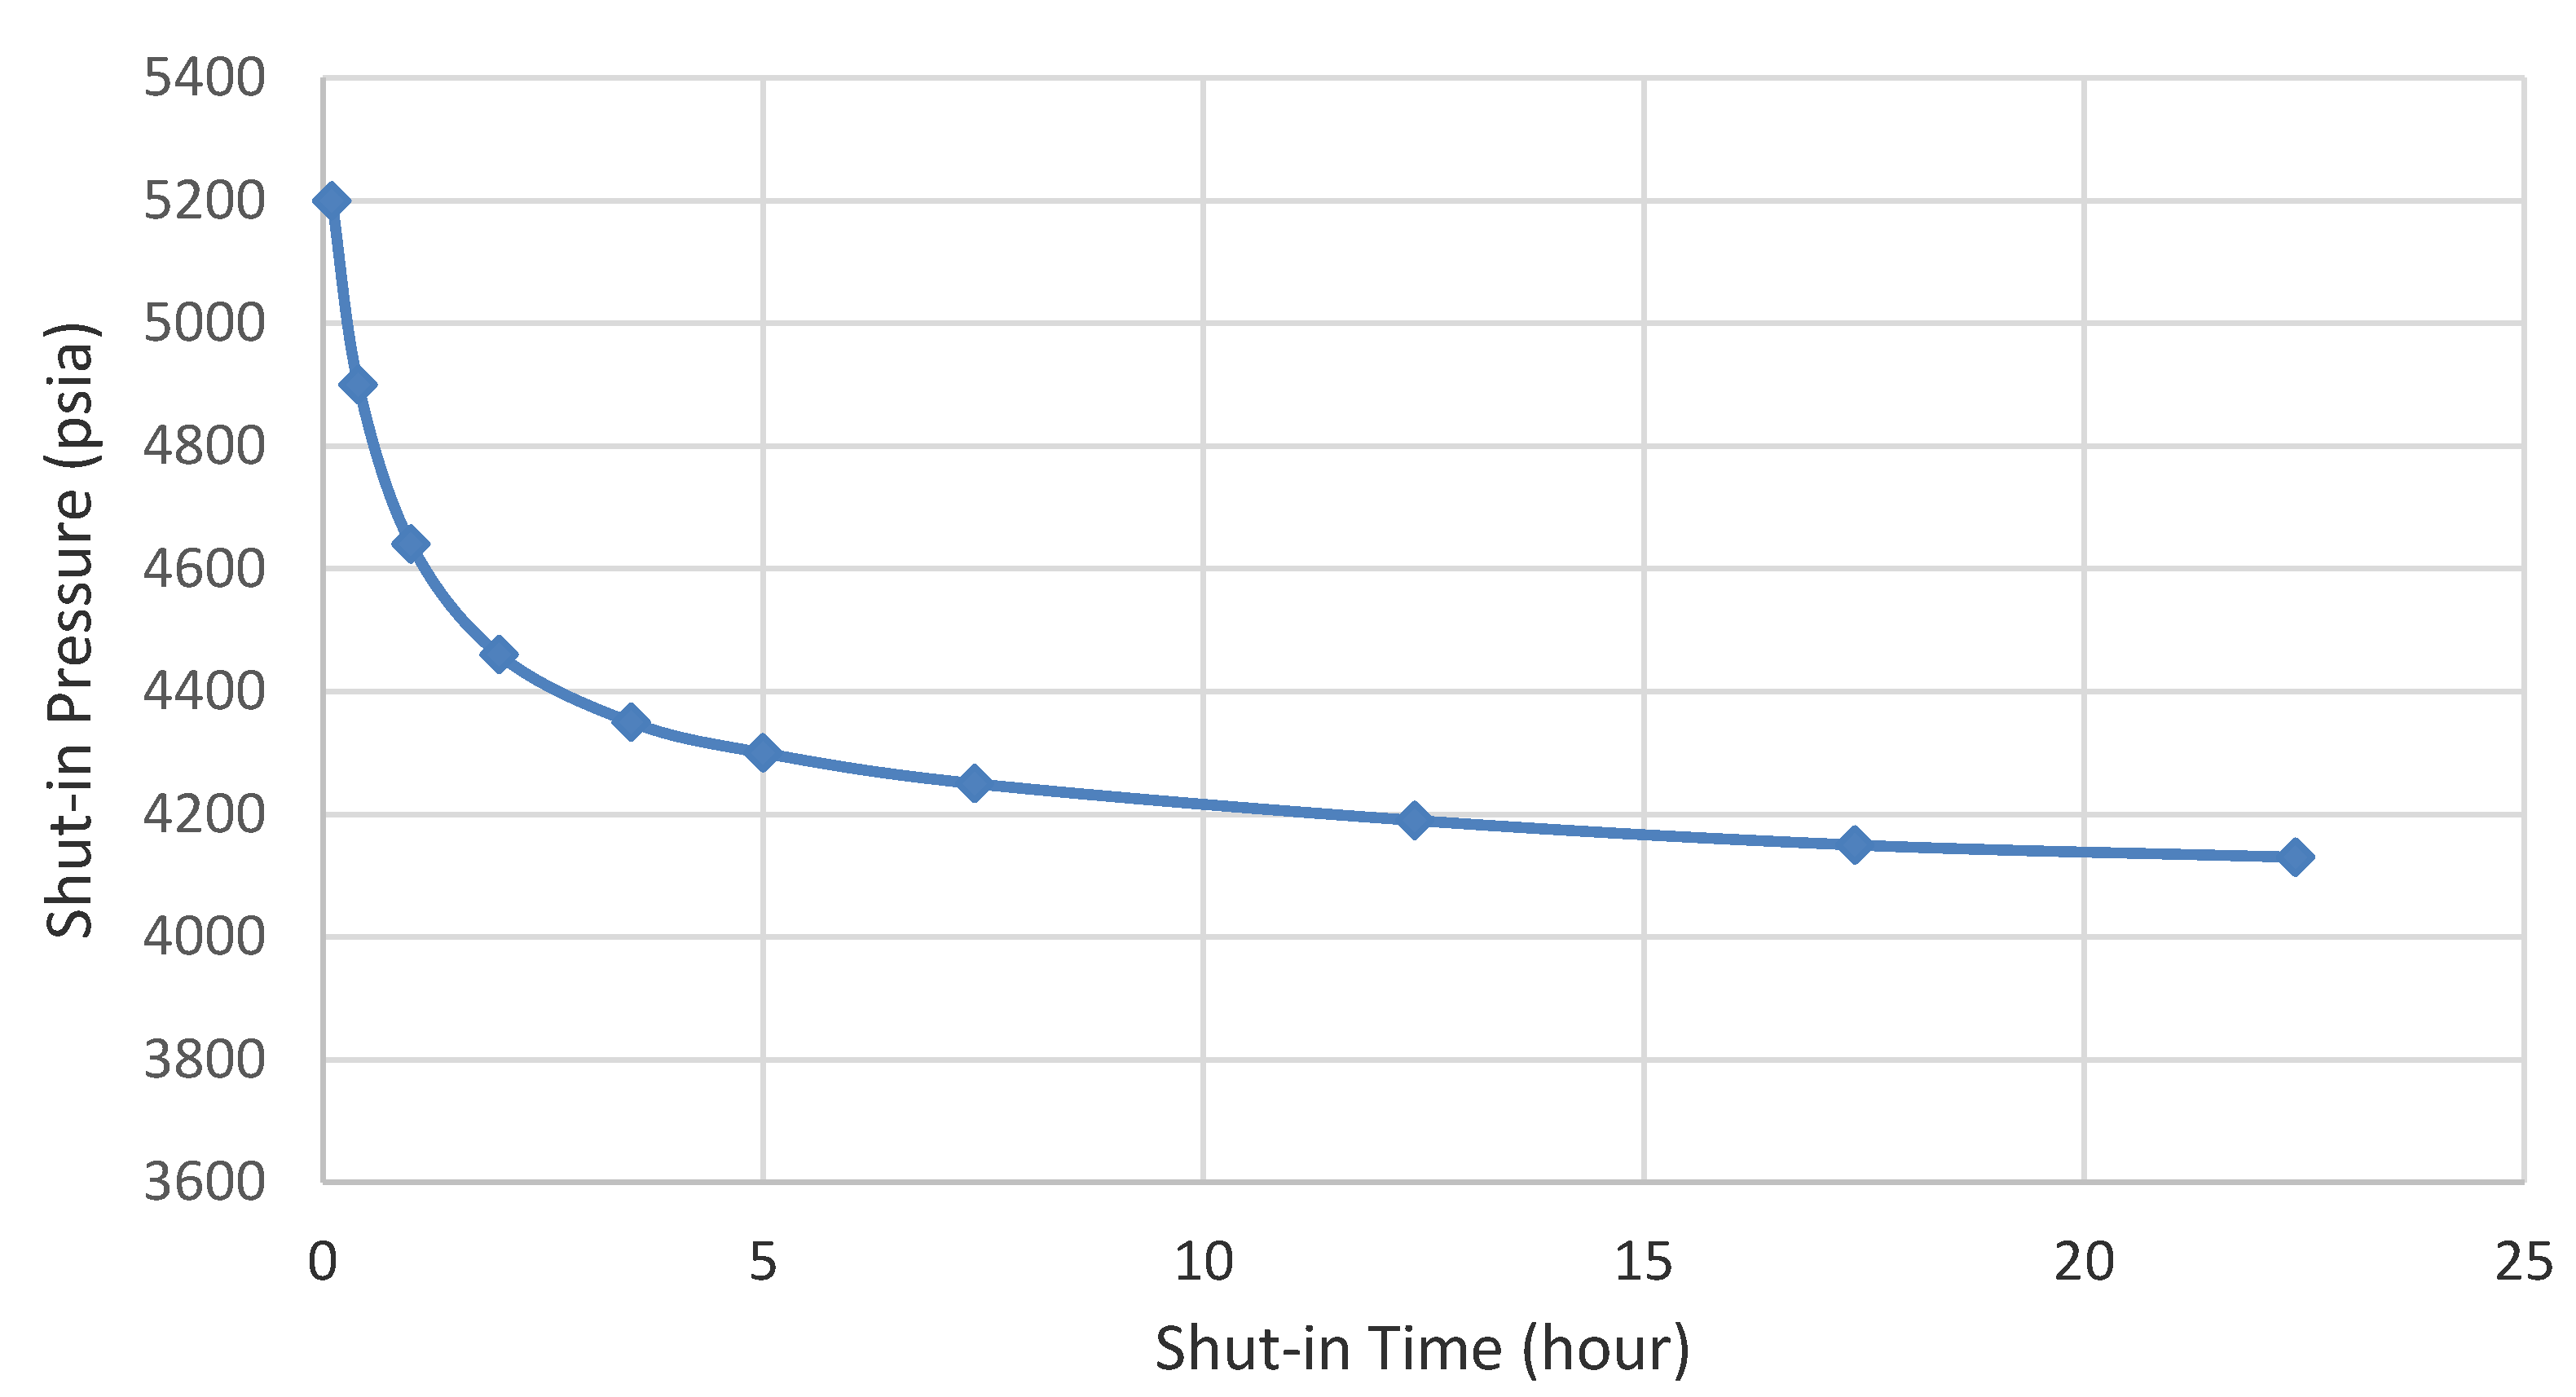
2] recorded shut-in pressure for 25 hours to estimate water loss during shut-in periods. They provided the best data set available for analyzing the soaking behavior in this section. The data reported in Makhanov et al.’s [
2] paper are presented in
Figure 5. Because the data were measured for only one day, the following correction was established to extrapolate to long shut-in time:
where the shut-in bottom hole
p is in psia and the shut-in time
t is in hour.
Table 2 presents data used in the analysis of shut-in pressure.
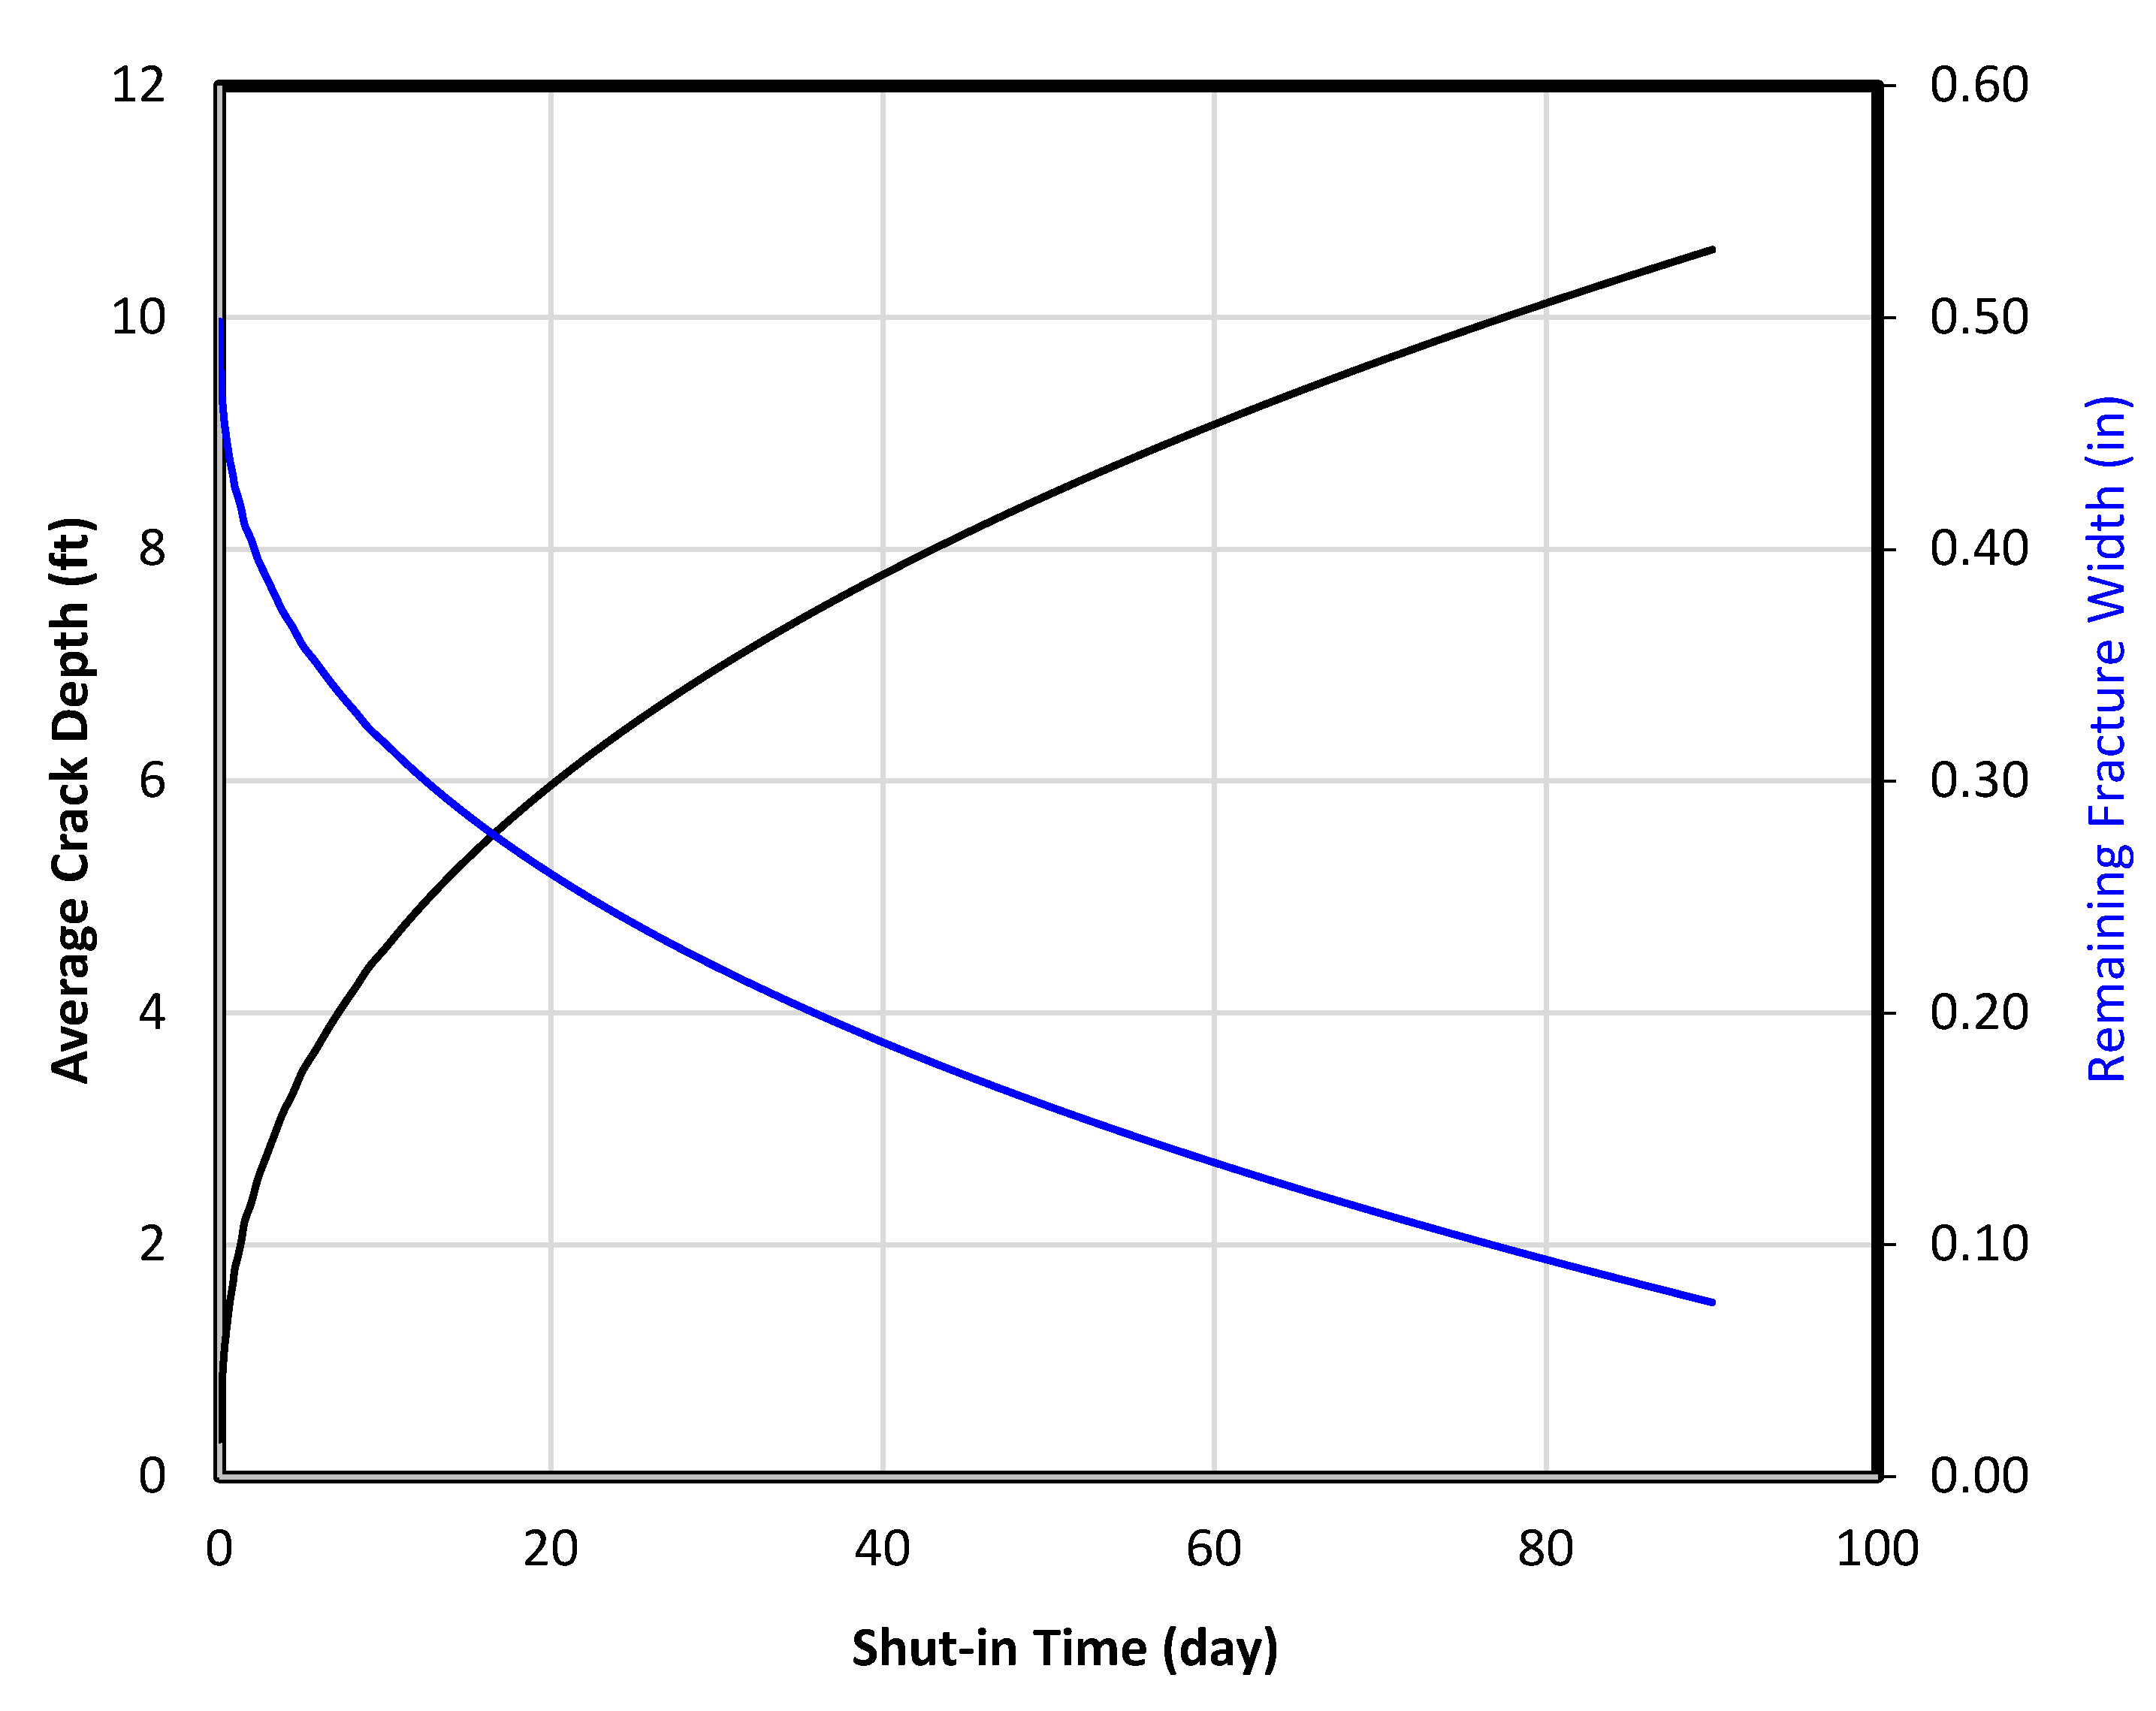
Figure 6 shows model-calculated crack penetration depth and the remaining fracture width. It indicates that shale crack propagates fast in the beginning and slows down due to flow friction. The hydraulic fracture width drops fast in the beginning and slows down due to the slow growth of cracks. It is understood that the supporting effect of proppant was not considered in the calculations. It is expected that early supporting of proppant should slow down the closure of fractures and thus the soaking process. Nevertheless, the effect of proppant can be reflected in the real shut-in pressure profile.
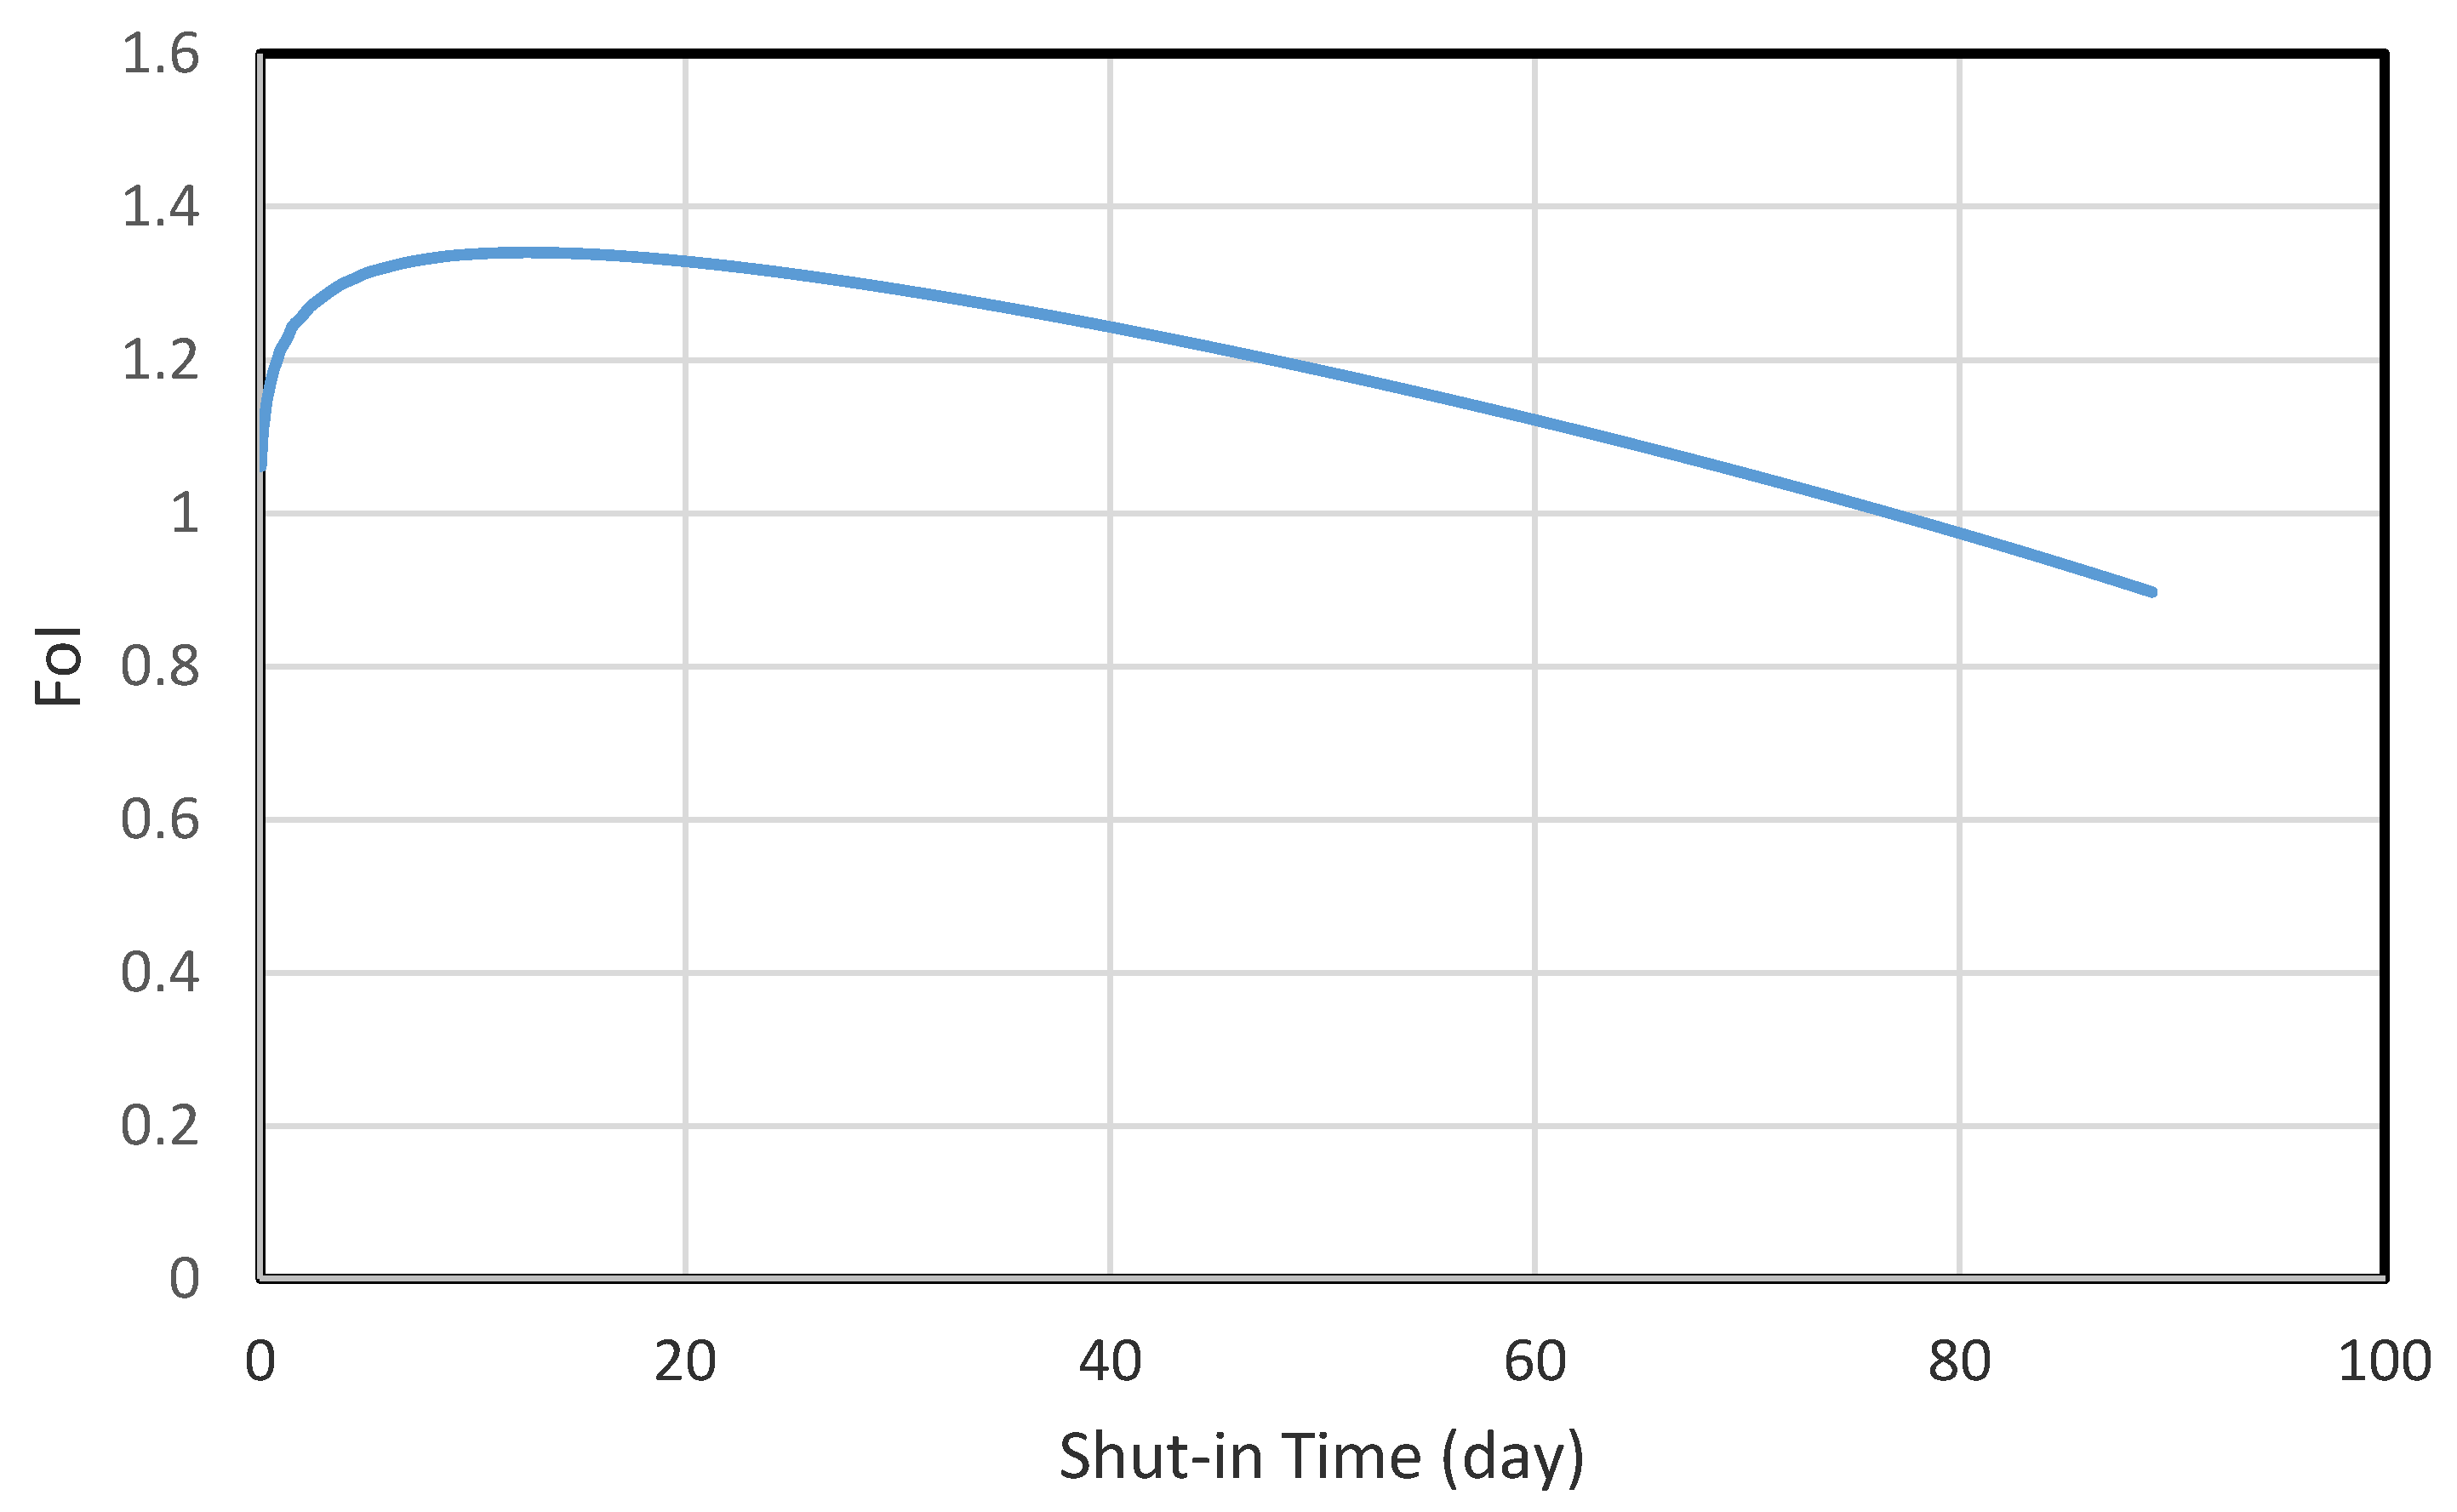
Figure 7 presents model-calculated fold of increase in well productivity due to fluid soaking. It suggests that the optimum soaking time is about 10 days. An
FoI value of 1.34 is expected if the well is put on flowback and production after 10 days of soaking. Again, it is understood that the supporting effect of proppant was not considered in the calculations. This
FoI value is expected if the adequate proppant is in place. However, the effect of proppant can be reflected in the real shut-in pressure profile.
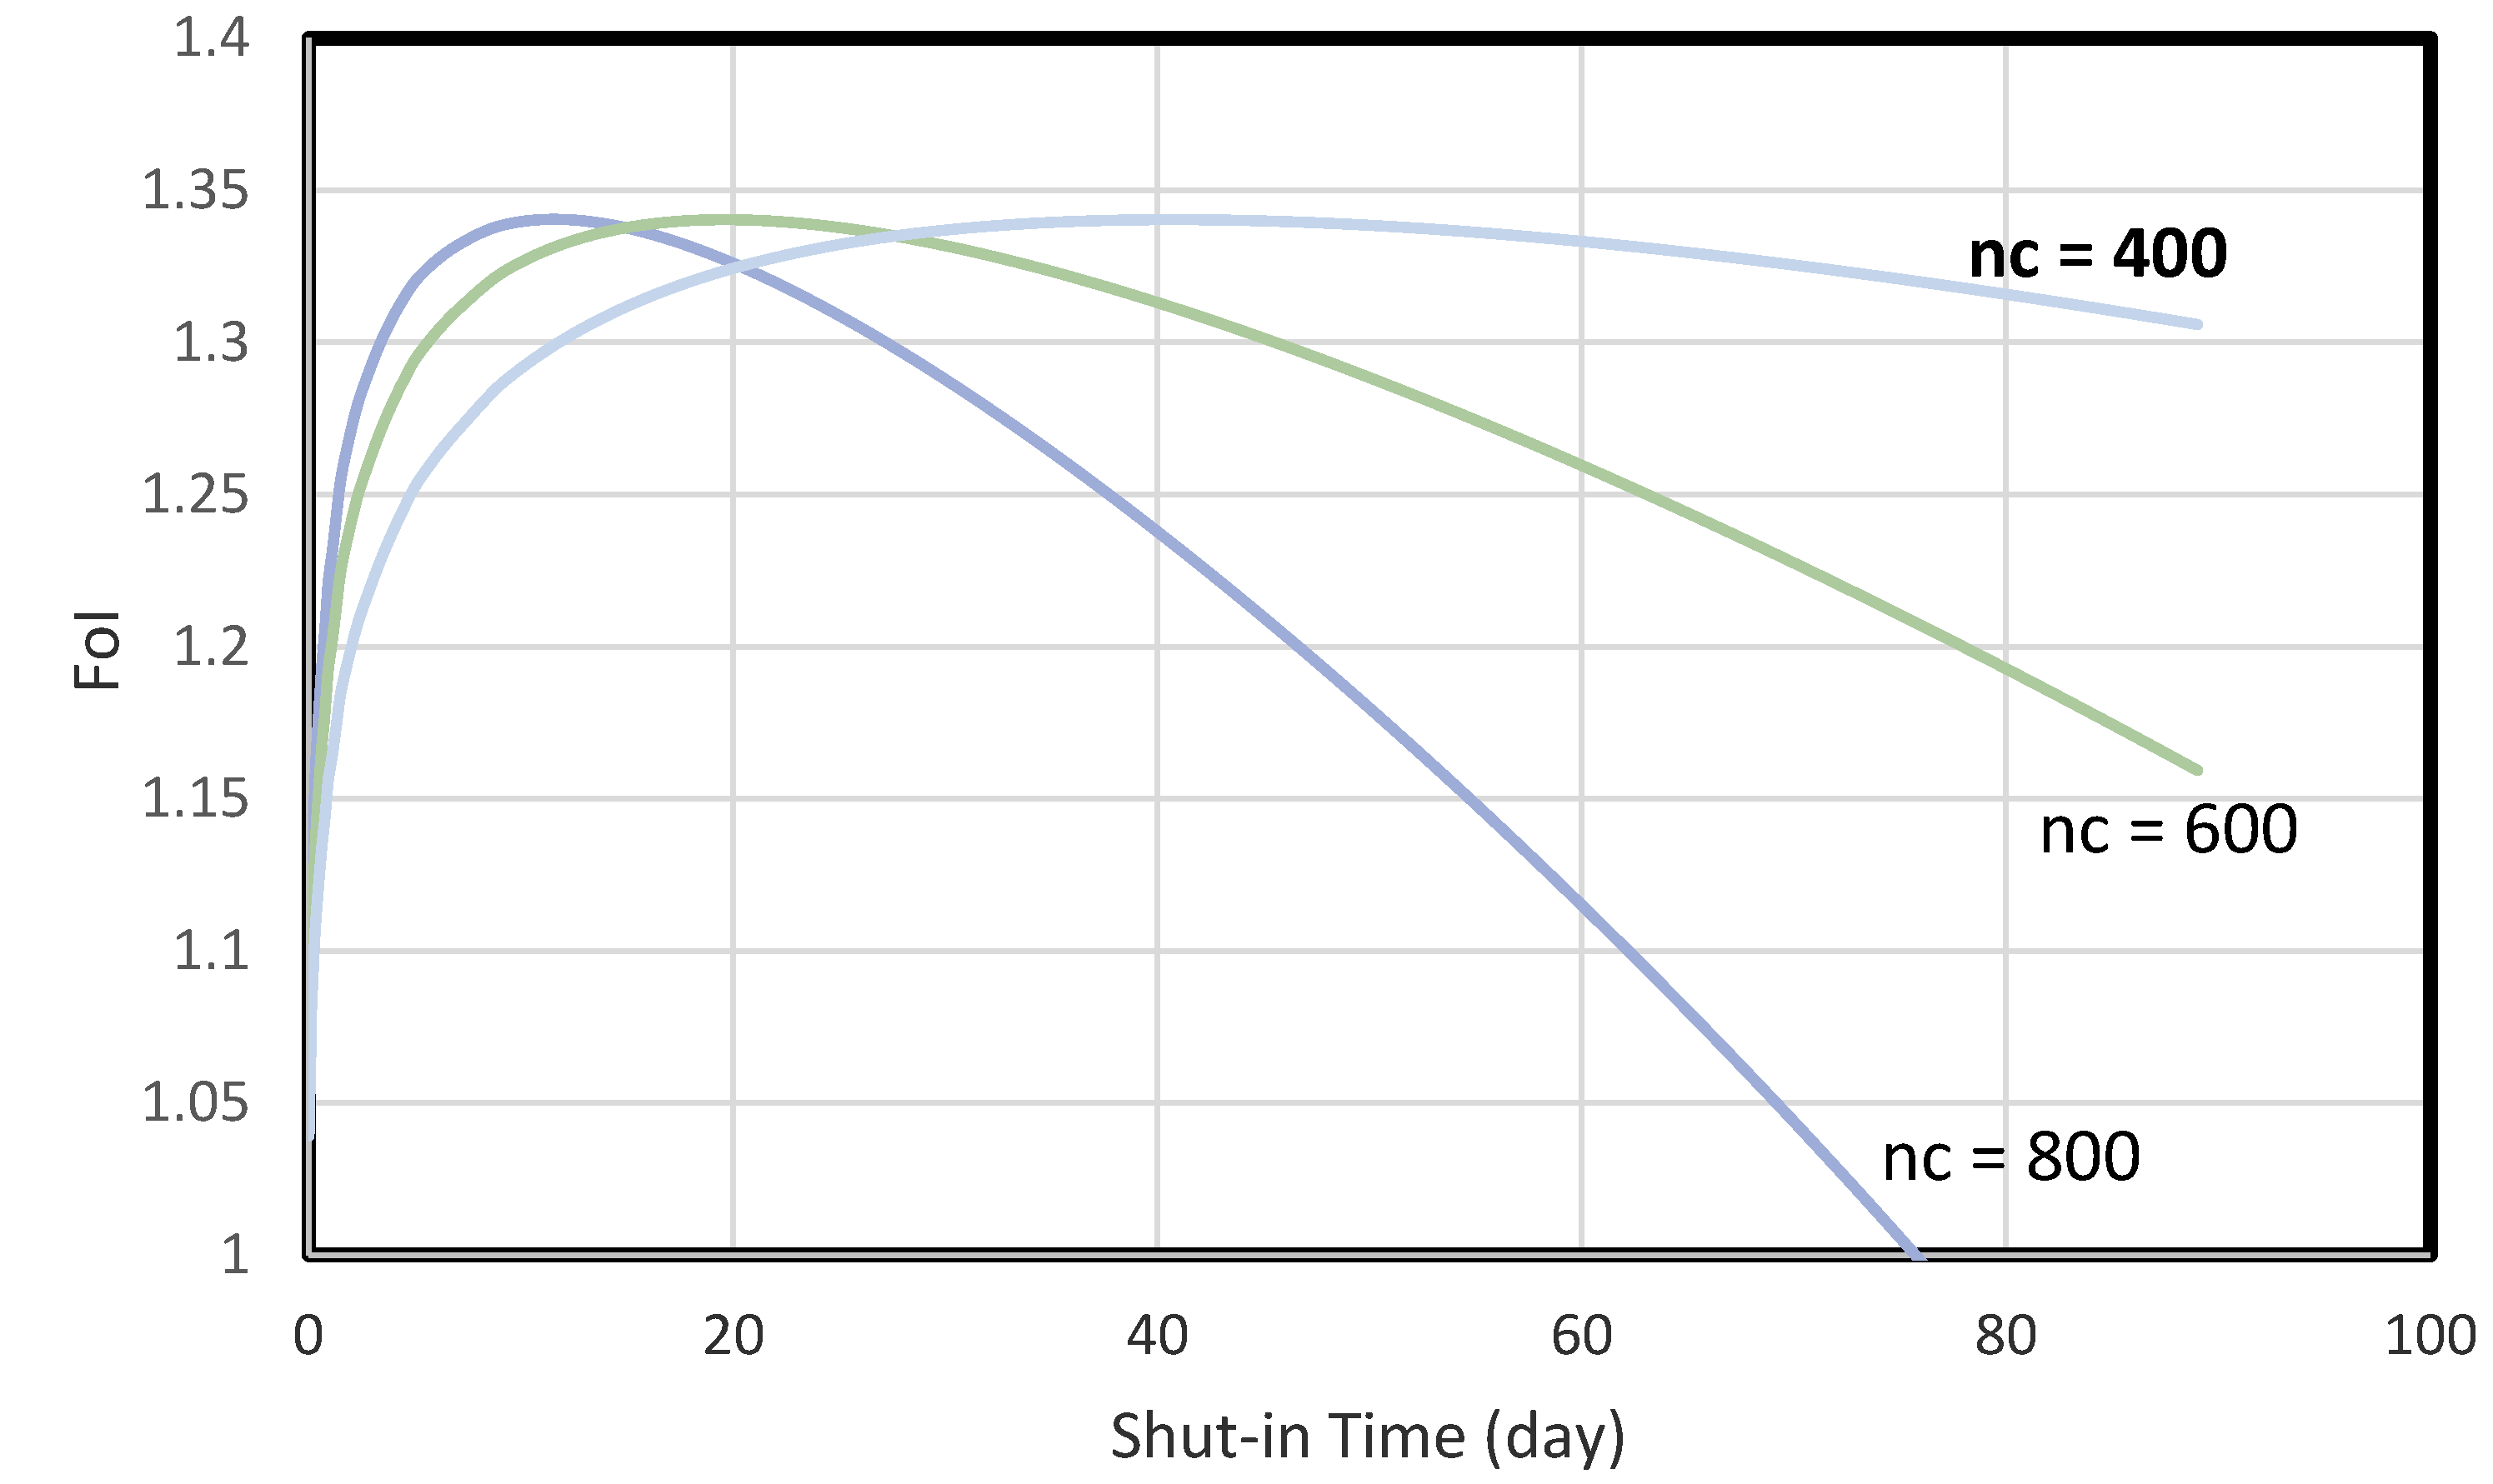
Figure 8 provides a comparison of the model-calculated folds of increase in well productivity for three scenarios having 400, 600, and 800 cracks per fracture. It shows that if the number of cracks per fracture drops to 600 and 400, the optimum soaking time will be delayed to 21 days and 42 days, respectively.
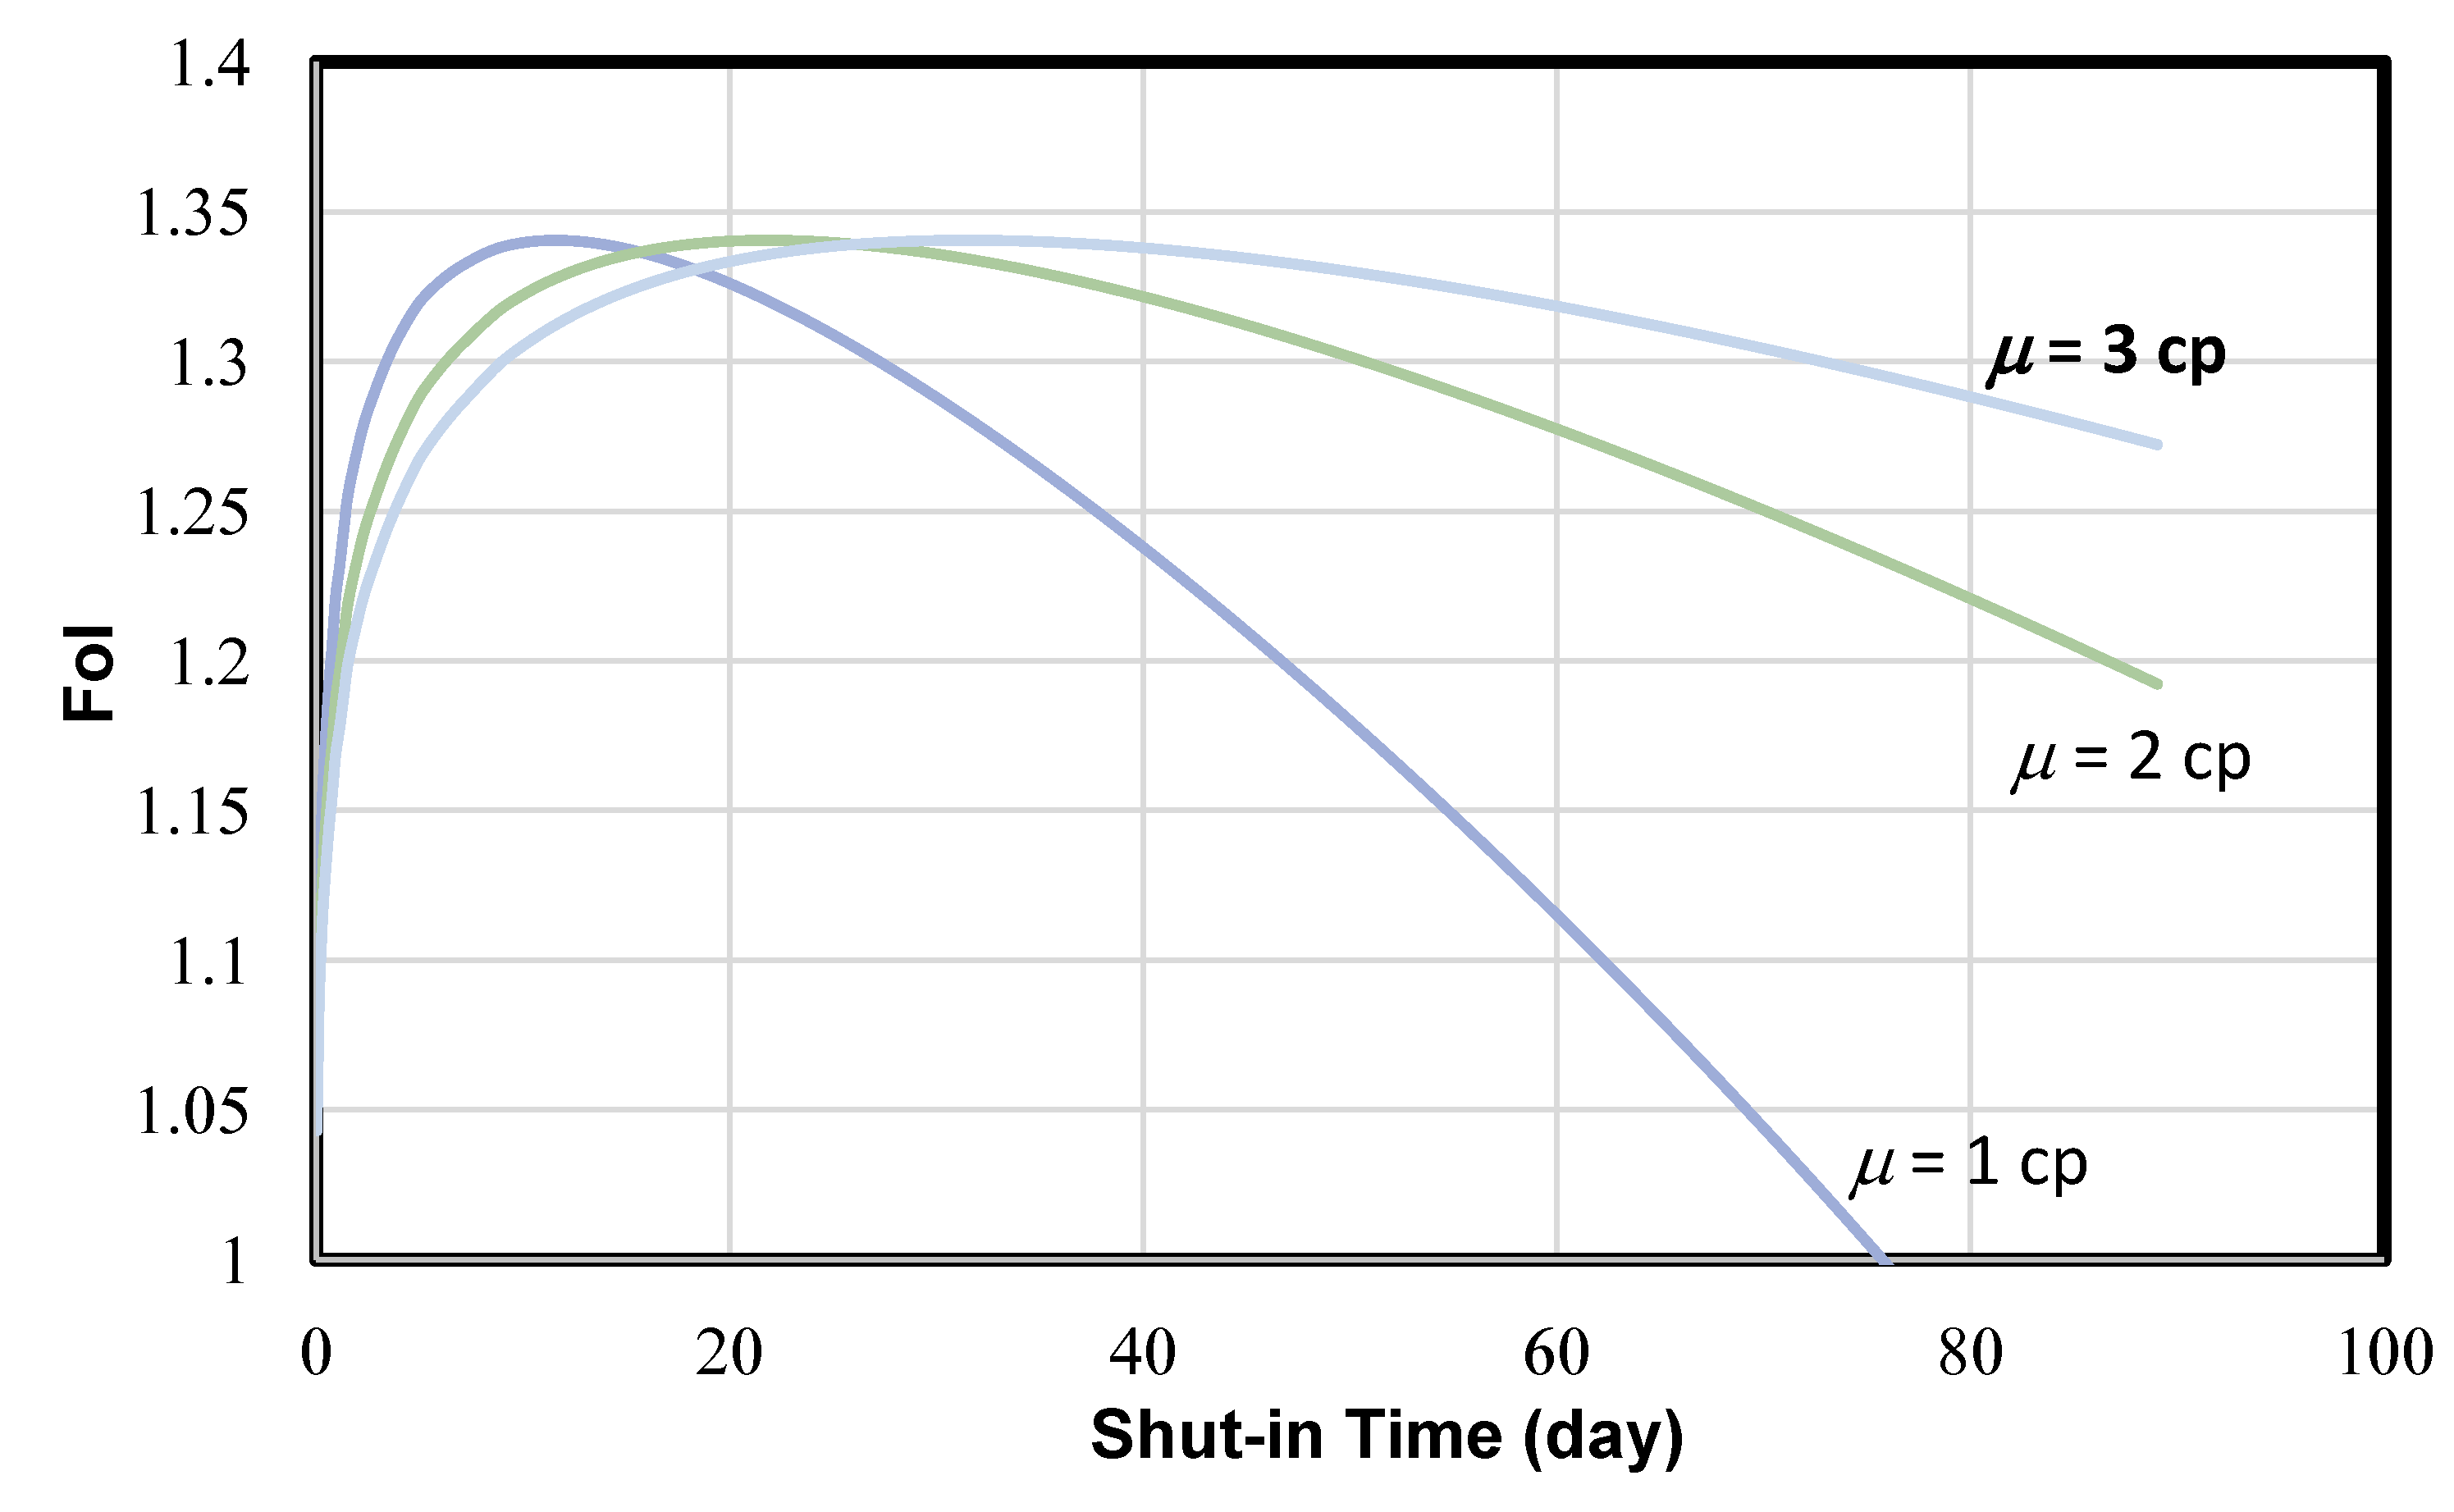
Figure 9 shows the model-calculated effect of fluid viscosity on the on the optimum soaking time. If the fluid viscosity increases to 2 cp and 3 cp, the optimum soaking time will be delayed to 22 days and 32 days, respectively. This is because fluid viscosity creates resistance to fluid flow during soaking.
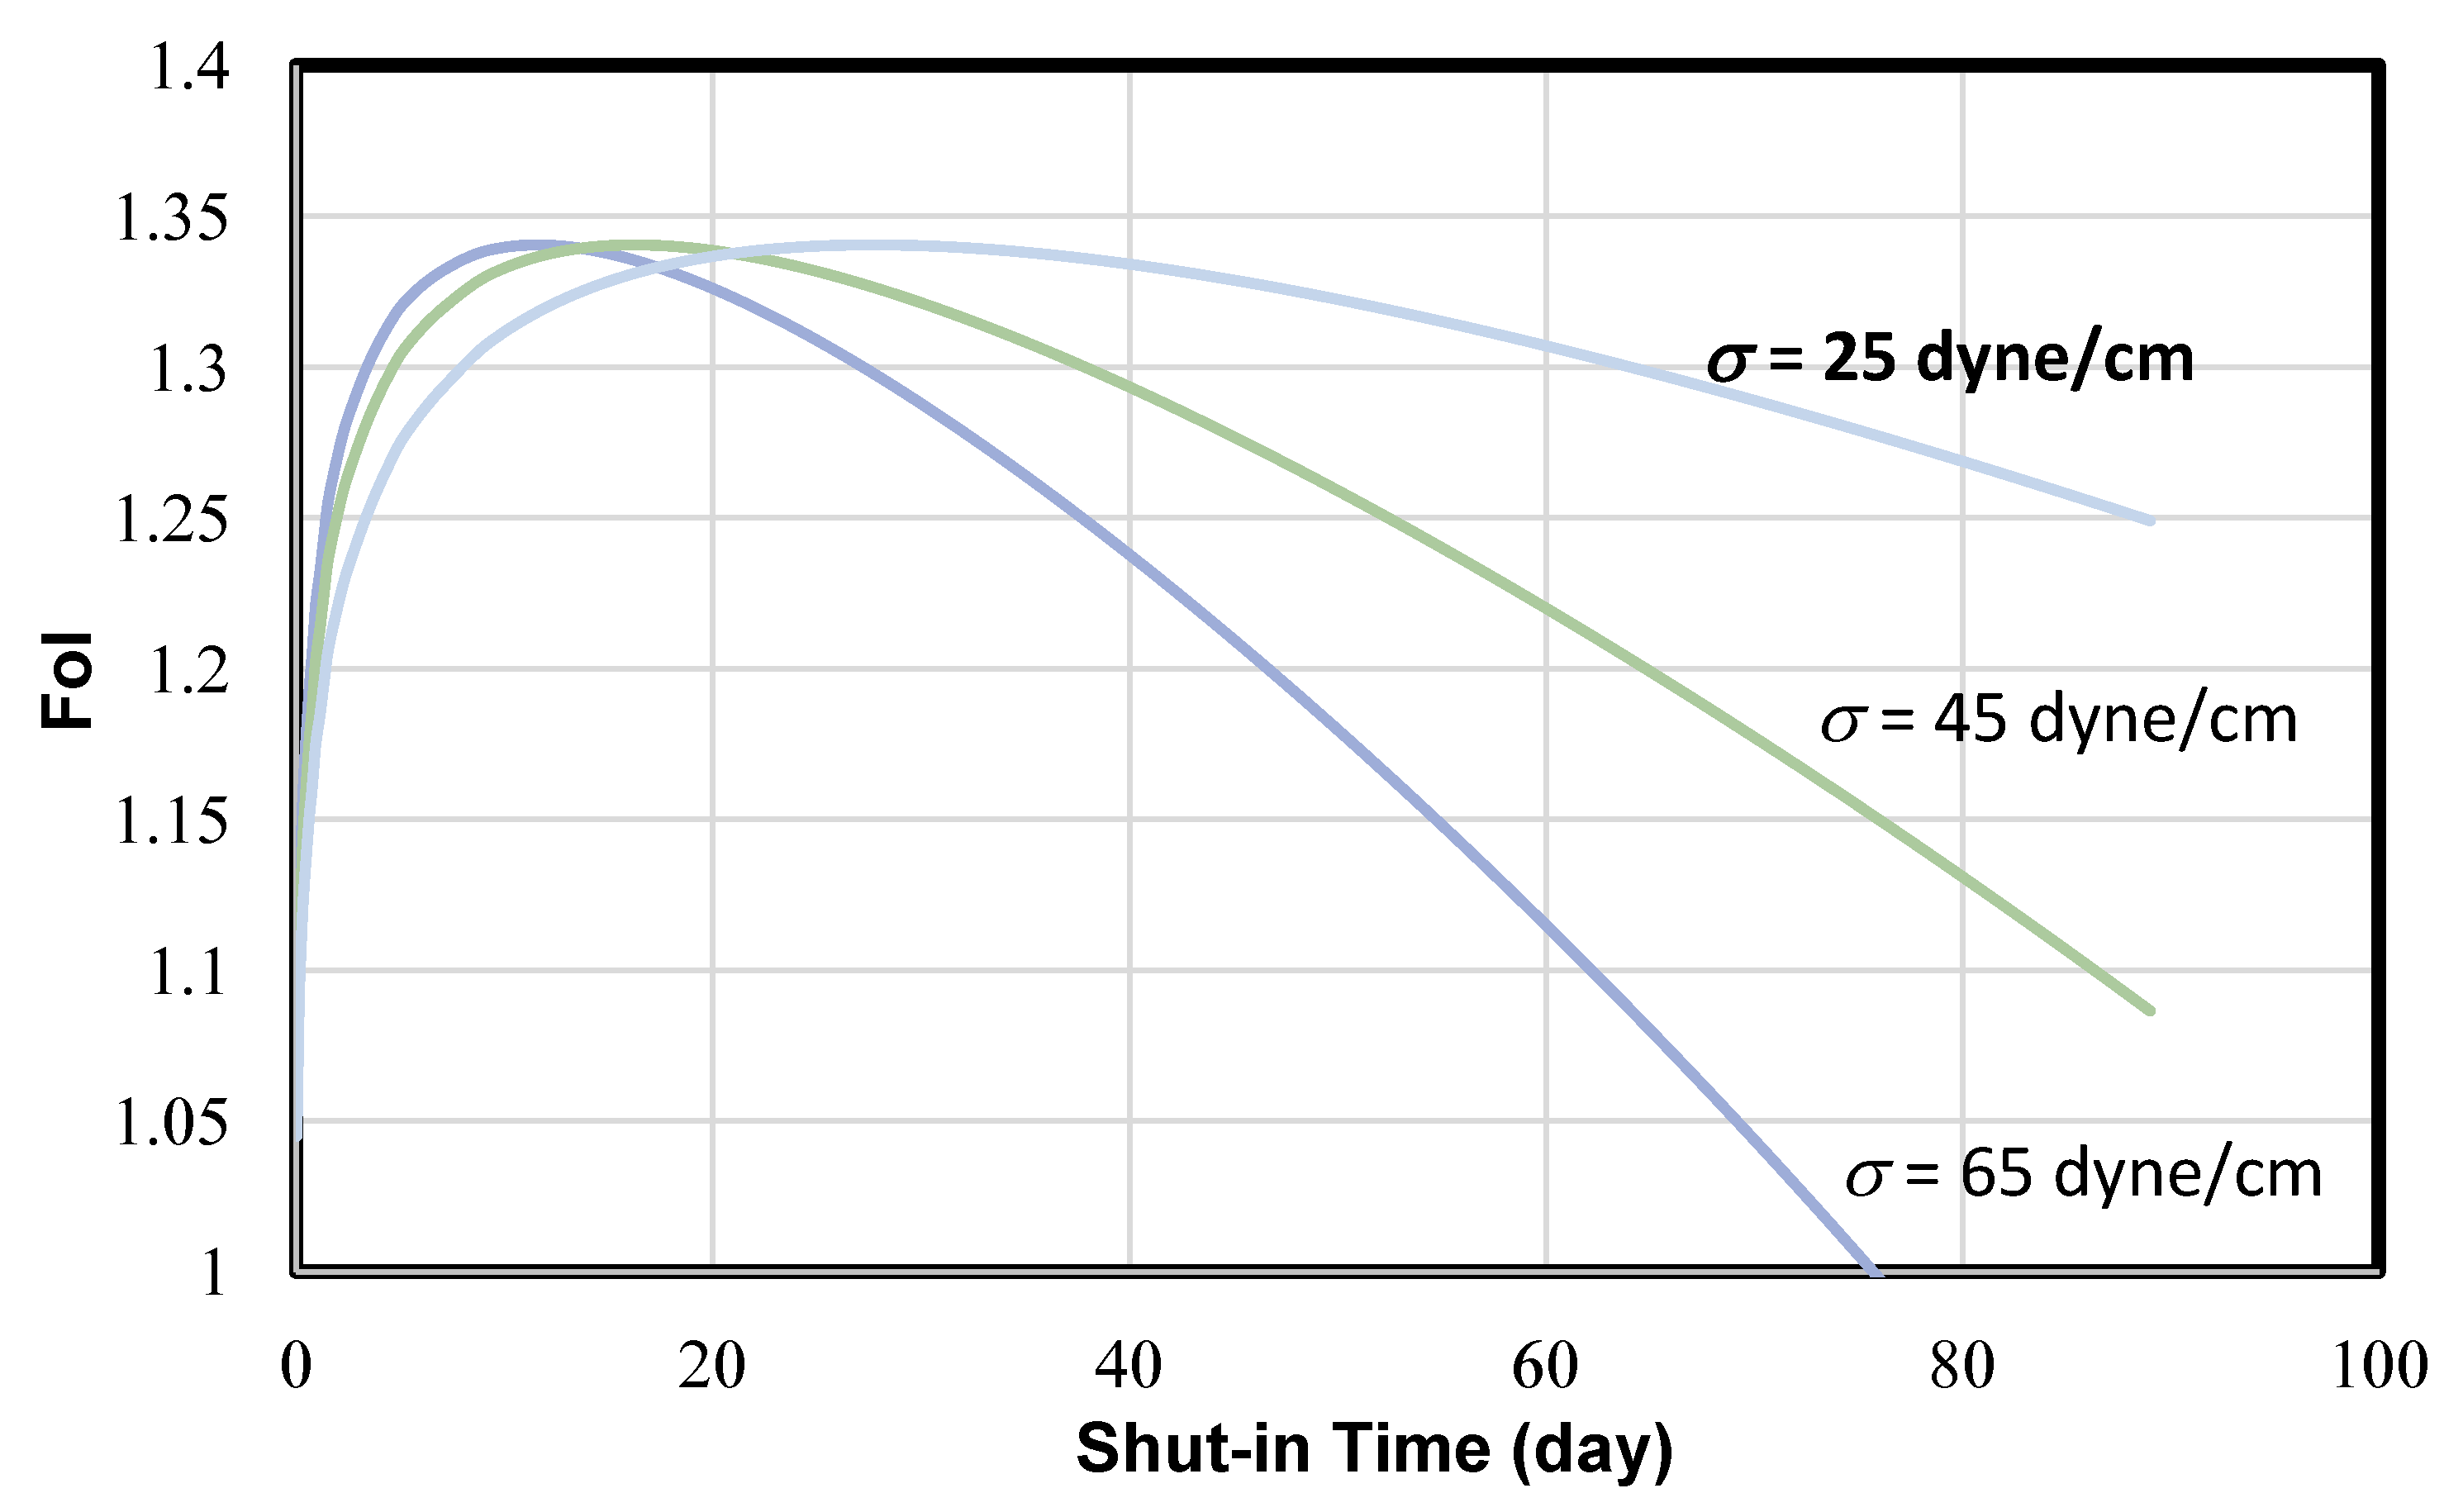
Figure 10 presents the model-calculated effect of fluid-shale interfacial tension on the optimum soaking time. If the interfacial tension is reduced to 45 dyne/cm and 25 dyne/cm, the optimum soaking time will be delayed to 18 days and 28 days, respectively. This is because reducing interfacial tension lowers capillary pressure during soaking.
5. Discussion
The tests were run at room temperature rather than reservoir temperature. Since temperature reduces interfacial tension and fluid viscosity, Equation (1) implies that tests at reservoir temperature would show low efficiency of water soaking because of low water-solid interfacial tension. However, Equation (1) also implies that reduction in water viscosity should promote water soaking. The tradeoff needs to be further investigated.
It is expected that different shale formation samples will have different test results depending on rock properties. Equation (1) shows that the crack formation depends on water saturation and contact angle. Shale formations with low water saturation but low contact angle should promote water soaking because of crack development.
The tests were run with 20/40 U.S.-mesh ceramic proppant, not the 100 U.S.-mesh sand, and 40/70 U.S.-mesh sand that are widely used in the industry for shale gas/oil wells. The reason was that the tests were also designed to investigate proppant embedment into the shale samples, which was believed to show clearer result with large proppant particles. Since none of the commercial proppant is believed to invade into the cracks during water soaking, it is anticipated that proppant size will not affect water-soaking efficiency. Nevertheless new tests are being conducted with finer proppant particles.
The strength of the proppant (ceramic proppant versus sand) is not expected to influence formation of cracks as long as the crushed proppant, if any, do not invade into the cracks during water soaking. This speculation needs further investigation though.
This work postulates a hypothesis that cracks are formed in shale formations after a hydraulic fracture stimulation and that they later contribute to improved well productivity. With some respective assumptions, mathematical models were developed to determine the optimum soaking time duration (period prior to start of flowback) and the theoretical effect of such cracks on the long-term productivity of shale gas and oil wells based on their previous work. Although the number of laboratory tests conducted is very limited and there is no field test performed yet, the hypothesis is believed relevant for well completion engineering on shale gas/oil formations. The result presented in the Example Calculations section is considered qualitative because of non-validated assumptions. The major assumption that may significantly affect the accuracy of the mathematical model is that the pressure decline during well shut-in is solely owing to crack development and not delayed by fracture closure, while fracture closure is accounted for in well productivity analysis.
The most crucial data required by the mathematical model is the real-time well shut-in pressure. The shut-in wellhead pressure prior to flowback is regularly recorded in several regions of the world but not globally. Measuring and recording well shut-in pressure data is not difficult and is feasible with today’s technologies. It is recommended to continuously measure shut-in bottom hole pressure prior to flowback and test the mathematical model.
