1. Introduction
The accelerated growth of the world population and the use of new technologies are directly related to the increasing demand for electricity, mainly generated by using fossil fuels [
1], which generate greenhouse gases and contribute to climate change [
2]. To address this issue, two major solutions have been proposed [
3]: improve energy efficiency or generate electricity using RES (renewable energy sources).
In the particular case of RES, the use of solar and wind energy for the generation of electricity is rapidly increasing, because they offer a cleaner and economically competitive generation in comparison with conventional ways of generating electricity based on fossil fuels [
4]. However, although RES offer many benefits, there are also some drawbacks [
5], one of which is that solar and wind energy are intermittent and depend on the weather conditions. For this reason, these RES are also called variable renewable energy (VRE) sources and their generation cannot follow changing electricity demand patterns without storage systems.
Therefore, the problem of VRE sources integration with electric power systems is due to its intermittency; it is still a challenge for the grid operators when scheduling the power generation [
6]. Some solutions proposed in the literature to deal with the intermittent nature of the VRE sources are to use energy storage systems, oversize the renewable energy generation plants, use distributed generation systems and flexible consumers, or use two or more VRE sources, whose generations complement each other [
7,
8].
In this regard, it is necessary to conduct energetic complementarity studies to evaluate the feasibility of the joint use of VRE sources, in a determined region in a specific time interval. The obtained results can be used for the analysis of the tradeoff between the storage and the cost of the energy from various VRE sources, and for the design of energy management strategies, which can increase the reliability of the system and help to reduce the electricity cost [
9].
The term energetic complementarity refers to the capacity of two or more energy sources to have complementary energy availabilities [
10]. The energetic complementarity between two or more RES may occur in time, when the sources have generation periods that complement each other over the time in the same region, or in space, when the generation of the RES complement each other over a region, or even both. It is important to mention that the energetic complementarity also means that the average generation values of the RES must be equal or similar regarding their respective minimum and maximum values [
11].
Energetic complementarity studies have been reported for several regions in the world and different RES. For instance, in [
12] and [
13], the energy balance between the RES generation and the load in Italy are reported, in the first case based on the standard deviation and then using a Monte Carlo approach; in [
14], the complementarity study of solar and wind resources over Europe is presented, the analysis is carried out based on measurements obtained from weather stations; in [
10], the assessment of the energetic complementarity among hydro, solar, and wind sources in Brazil is evaluated. The energetic complementarity is evaluated based on an index proposed in [
15].
The energetic complementarity of RES based on the local energy generation has been evaluated and reported in [
16], where the energetic complementarity is evaluated for various Bulgarian sites using models of the energy production; in [
17], a dimensionless index to assess the complementarity for the region of Ontario, Canada, is used; in [
18] and [
19], the spatiotemporal complementarity for Nepal and the Iberian Peninsula, respectively, are evaluated; in [
20], the use of a copula approach derived from the Kendall’s rank correlation coefficient is proposed to assess the complementarity of China; while in [
21,
22,
23,
24], the energetic complementarity of solar and wind resources based on the power density and the estimated electric power generation are evaluated for Australia, Mexico, USA, and Poland, respectively. In addition, the analysis between the availability of solar and wind resources, which is a type of spatial complementarity, has been reported in the literature. Examples of these studies are detailed in [
25] for Great Britain, in [
26] for Serbia, in [
27] for Brazil, and in [
28] for the State of Oklahoma, USA.
In this research, the monthly energetic complementarity study of solar and wind resources in Colombia for the generation of electrical power is presented. The main contribution of this research is that a novel approach to conducting the energetic complementarity study is proposed. Based on high-resolution images of the resources maps of the country and employing image processing algorithms, a dataset with the average monthly solar radiation and wind speed values is obtained. Then, the average monthly electricity generation for each energy source is calculated using the obtained dataset, and the energetic complementarity between the solar and wind energy sources is calculated using the negative of the Pearson correlation coefficient. Finally, the obtained results are presented in energetic complementarity maps, previously eliminating the protected areas from the maps because they are not suitable for the installation of generation systems of any type. The proposed procedure can be applied to any other region of the world.
The rest of the paper is organized as follows:
Section 2 describes the natural resources and protected area maps of the country used in this research and the proposed procedure for the calculation of the energetic complementarity between RES; in
Section 3, the energetic complementarity maps obtained for Colombia and the discussion about the obtained results are presented; finally, the last section of this paper draws the main conclusions of this research.
2. Materials and Methods
Colombia is a country in northwestern South America. The country has 6342 km of land borders and borders the countries of Venezuela, Brazil, Ecuador, Peru, and Panama. Because of its location, it is a privileged country in terms of RES. It has 1600 km of coast in the north facing the Caribbean Sea and 1300 km in the west bathed by the Pacific Ocean, which favors the generation of air currents suitable for the installation of wind generation systems [
29]; furthermore, it is a country with a good amount of solar energy because of its location in the Tropical Belt—energy that can be used in solar generation systems [
30].
Colombia has an ever-growing energy demand and its electricity generation is almost based on hydropower with a 69.77% of the total capacity installed, followed by a generation based on fossil fuels with 29.00%, and the rest is a mix of different technologies (bagasse, biogas, solar, and wind) [
31]. Due to a high dependence on the water resource, the Colombian’s electricity network is vulnerable to weather changes, such as the droughts caused by the multi-year climate phenomenon known as El Niño [
32]. Consequently, in the specialized literature, some studies agree that the use of other resources and having a more diverse energy matrix is of great benefit in terms of supply security by local sources, lower generation of emissions, and greater competition in the market [
33,
34], but above all, reducing the vulnerability to climate change by not only depending on the water resource [
35].
An important step in the design, installation, and operation of solar and wind generation systems is to evaluate and characterize the resource. Therefore, measurements obtained from weather stations are needed for this purpose. With these measurements, natural resources maps can be generated, which are very useful in the selection of preliminary sites that are rich in renewable resources, where generation plants can be installed. Unfortunately, sometimes these measurements are not available to everyone or are incomplete, because of problems related to the equipment and sensors from weather stations, e.g., data loss and bad calibration of the sensors, among others.
In Colombia, the UPME (Mining and Energy Planning Unit) has made important efforts to measure the solar and wind generation potential in the country and has developed maps of these natural resources. These maps are freely accessible and can be consulted at the IDEAM’s website (which stands for Institute of Hydrology, Meteorology, and Environmental Studies) [
36].
2.1. Solar Resource Maps
The solar energy potential of Colombia is high compared with the rest of the world. The greatest solar potential in the country is found in the regions of the Atlantic and the Pacific Coast, the Orinoquia, and the Central Region [
37]. It is a country with an estimated average monthly solar radiation between 3.0 kWh/m
2 and 5.0 kWh/m
2, and in comparison with the maximum registered values worldwide, Colombia has regions with values between 58% and 84% of these maximum values [
38].
The latest solar maps of Colombia can be obtained from [
36]. On this website, there is a set of maps representing the monthly and annual average distribution of the following variables: horizontal global solar radiation, solar brightness, number of days per month without solar brightness, ultraviolet radiation, and total ozone column.
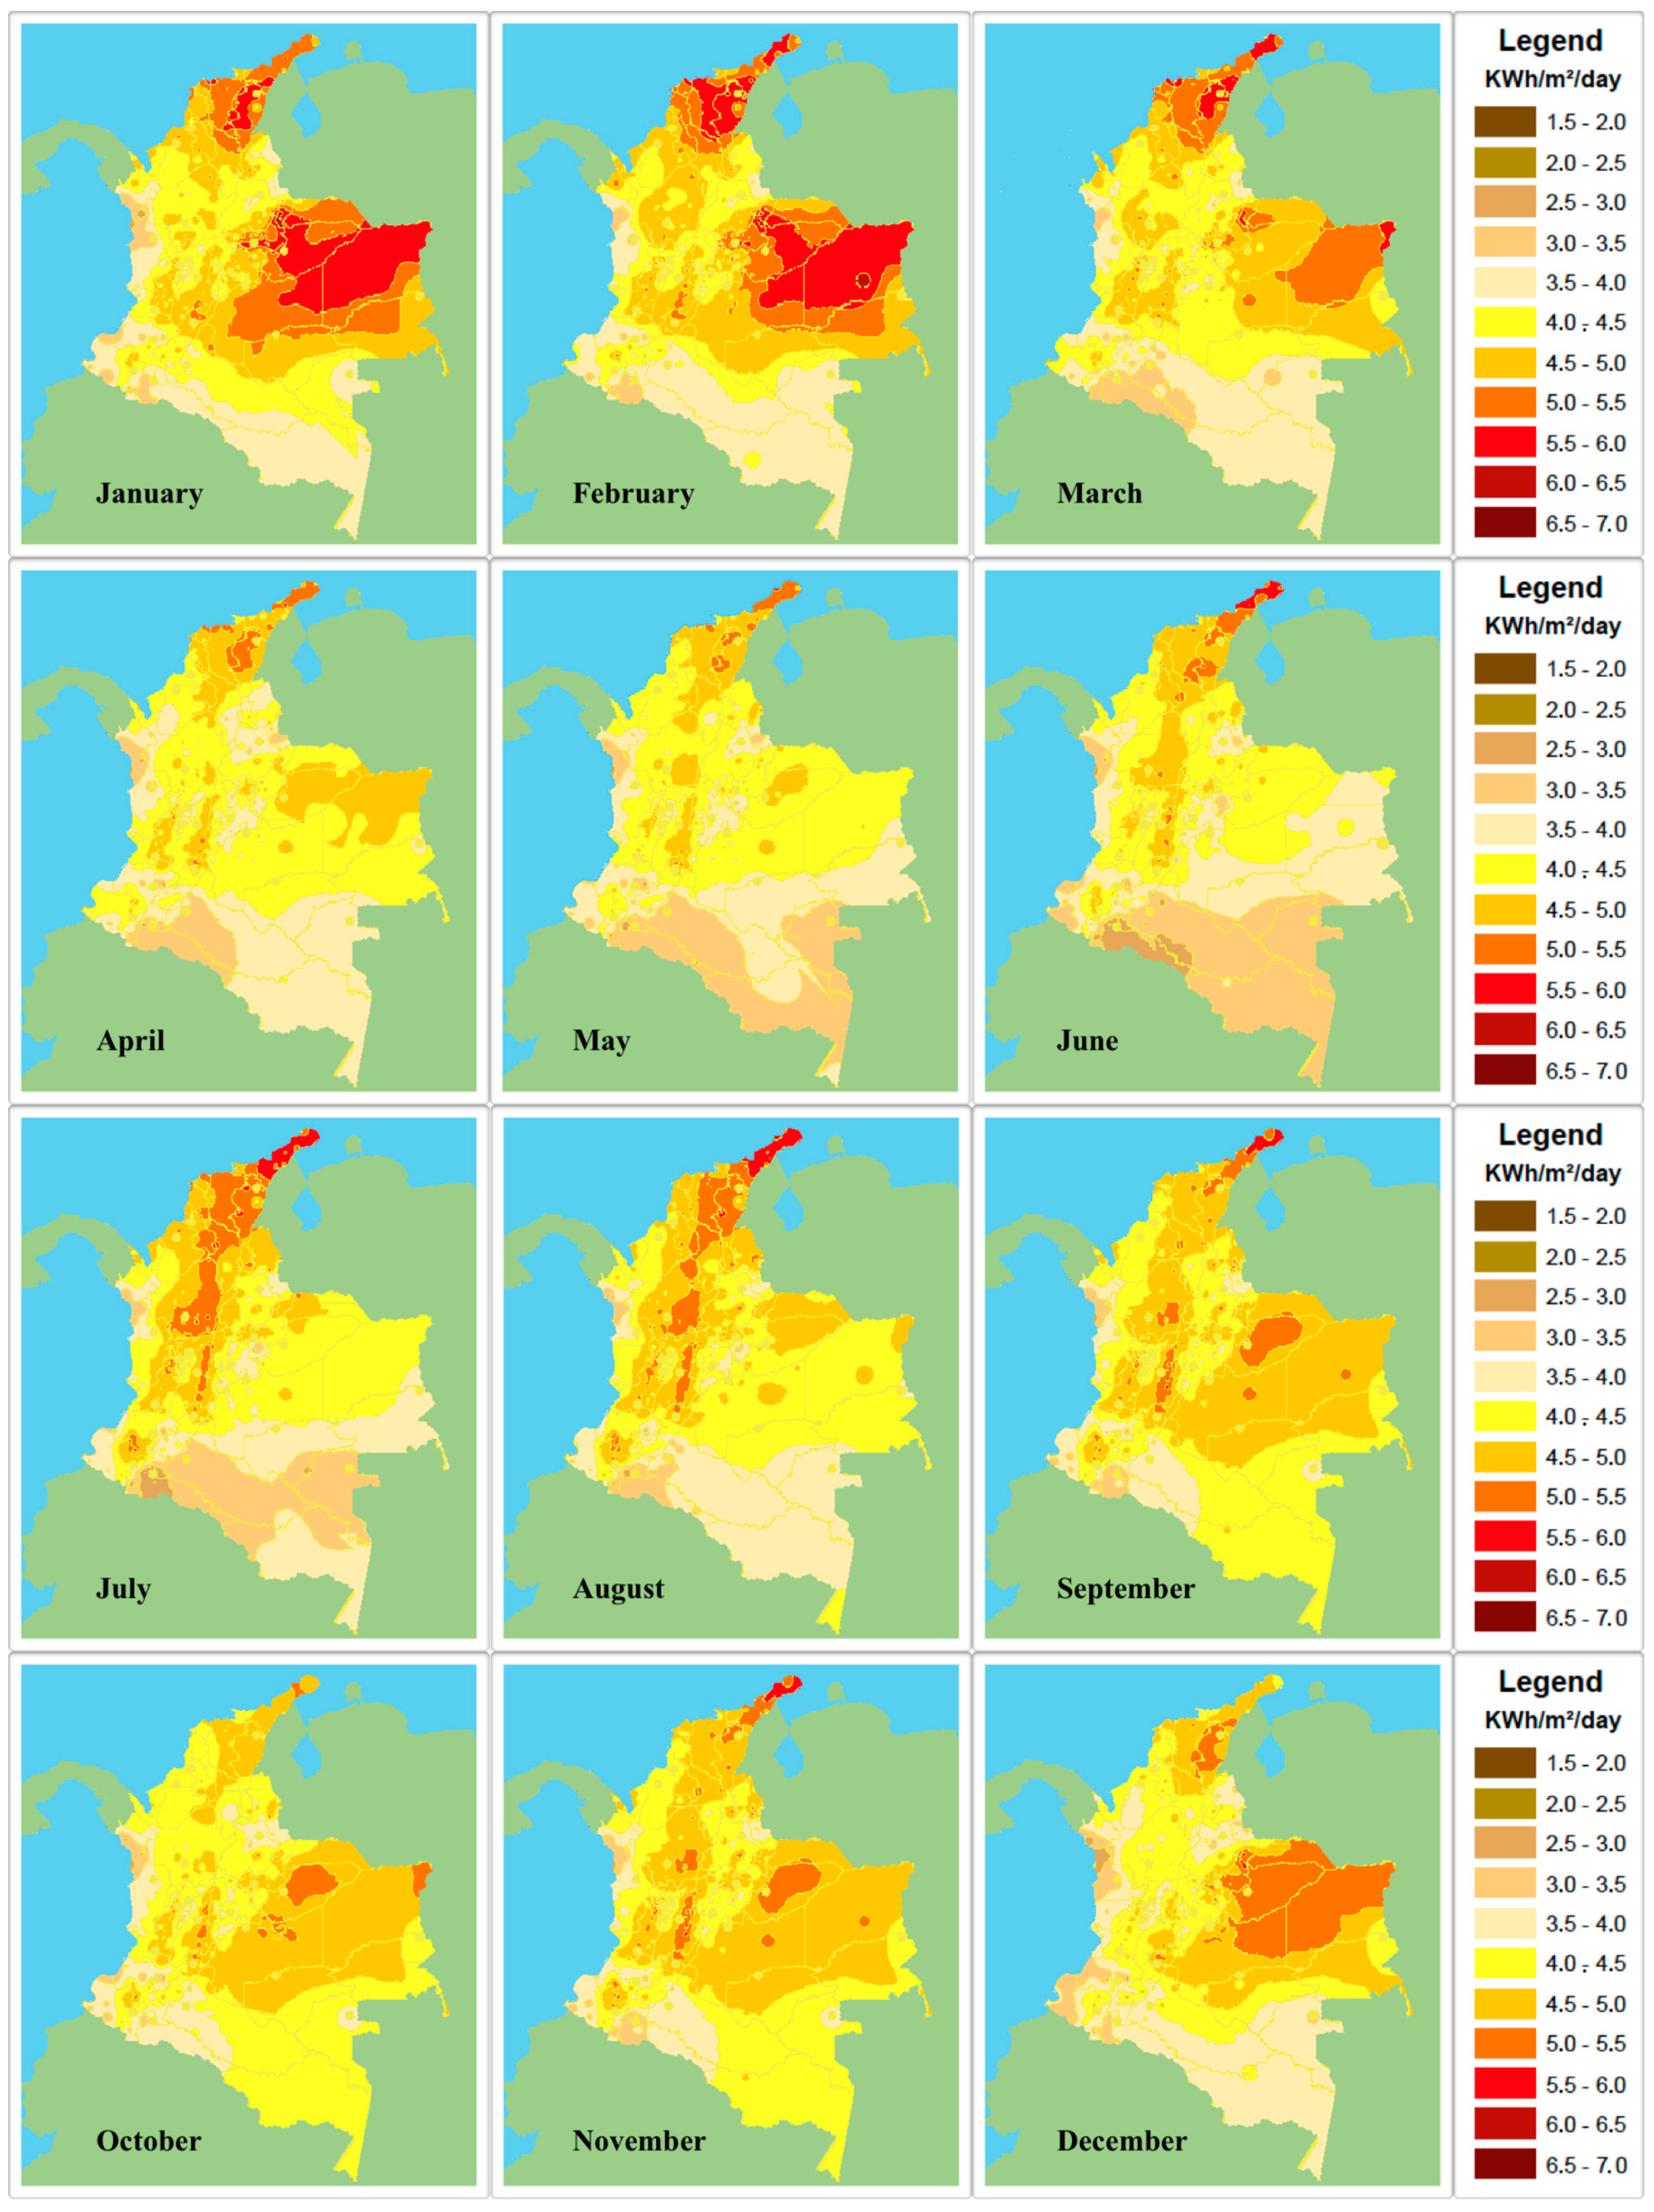
Figure 1 shows the monthly solar resource maps of the country. According to [
39], these maps were calculated using the measurements at the ground level of 71 weather stations over the country and correlated with the information of brightness, relative humidity, and temperature measurements of other 383 additional stations [
39].
From
Figure 1, it can be seen that in the months of December to April, the best solar potential is located from the center to the northern regions, with values above 4.0 kWh/m
2 in almost all the country. Likewise, it can be seen that from the months of May to August the solar potential is reduced, but there is still a good capture of solar radiation in the regions near to the oceans, especially in regions close to the Caribbean Sea. Finally, there is more solar potential in the northern region of the country from September to November, while in the western region the solar potential is reduced. Throughout the year, the best months in terms of solar resource are January and February and the worst are May and June. Please note that the capture of solar energy in some regions of the country is adequate for the installation of solar power systems [
40].
2.2. Wind Resource Maps
The wind potential of Colombia is located mainly in the northern region of the country, next to the Caribbean Sea. The department of La Guajira is located in this region, where the only wind farm in operation in the country, called “Jepirachi”, is installed, having an installed capacity of 19.5 MW, generating 50 GW per year [
41]. In 2014, Colombia enacted the Law 1715 [
42]; this law regulates the connection of non-conventional renewable sources into the national electricity network. To date, this law begins to show its benefits, because three projects about the installation of wind energy systems in the department of La Guajira have been presented to the UPME, with an estimated generation capacity of 475 MW [
43].
At the IDEAM’s website, the atlas of wind energy of Colombia [
36] can be consulted. This atlas is a collection of maps showing the spatial wind distribution on the surface and the wind potential of Colombia. The wind maps show the monthly and annual average wind speeds, and in the case of the wind energy potential maps, the average monthly values of the wind power density at two different heights (2 m and 80 m).
Figure 2 shows the monthly wind maps of the country. These maps were generated using the measurements of 111 weather stations installed across the country [
44]. The information displayed on these maps is the wind power density, at a height of 80 m, in W/m
2, with values that oscillate between 0 and 1728, corresponding to wind speeds from 0 to 12 m/s. Wind speeds above 10 m/s are suitable for the installation of wind power systems of high capacity (above 2 MW) [
45]; therefore, there are some specific regions of the country with good feasibility of installation of these systems.
Moreover, it can be seen from
Figure 2 that the best wind potential for the months of January to April is located in the country’s north, in the Caribbean Sea and its coasts, followed by the region of the Pacific Ocean. Furthermore, there is good potential in the Colombian Andes that cross the country (Central, East, and West Andes) and in some regions near Venezuela. A similar behavior can be seen for the months of May to December. The best months in terms of wind potential are from December to February, considering the whole country, and the worst are from September to November.
2.3. Protected Areas Map
Protected natural areas are a common way of conserving the natural resources in developing countries. The formal establishment and enforcement of protected areas in Colombia dates back to 1994 when the Colombian government signed the agreement on Biological Diversity in which Colombia committed to establish and maintain terrestrial zones and marine systems that are fully protected, managed, and ecologically representative, as well as to contribute to the achievement of the conservation objectives defined in the agreement [
46]. After that, Law 165 was enacted [
47], based on which the National Biodiversity Policy was formulated, and a commitment was made to create and strengthen the SINAP (National System of Protected Areas).
The SINAP is defined as a set of protected areas, social actors, strategies, and management instruments that together contribute to the fulfillment of the country’s conservation objectives. This includes all protected areas of the country of public, private, or community governance, and management [
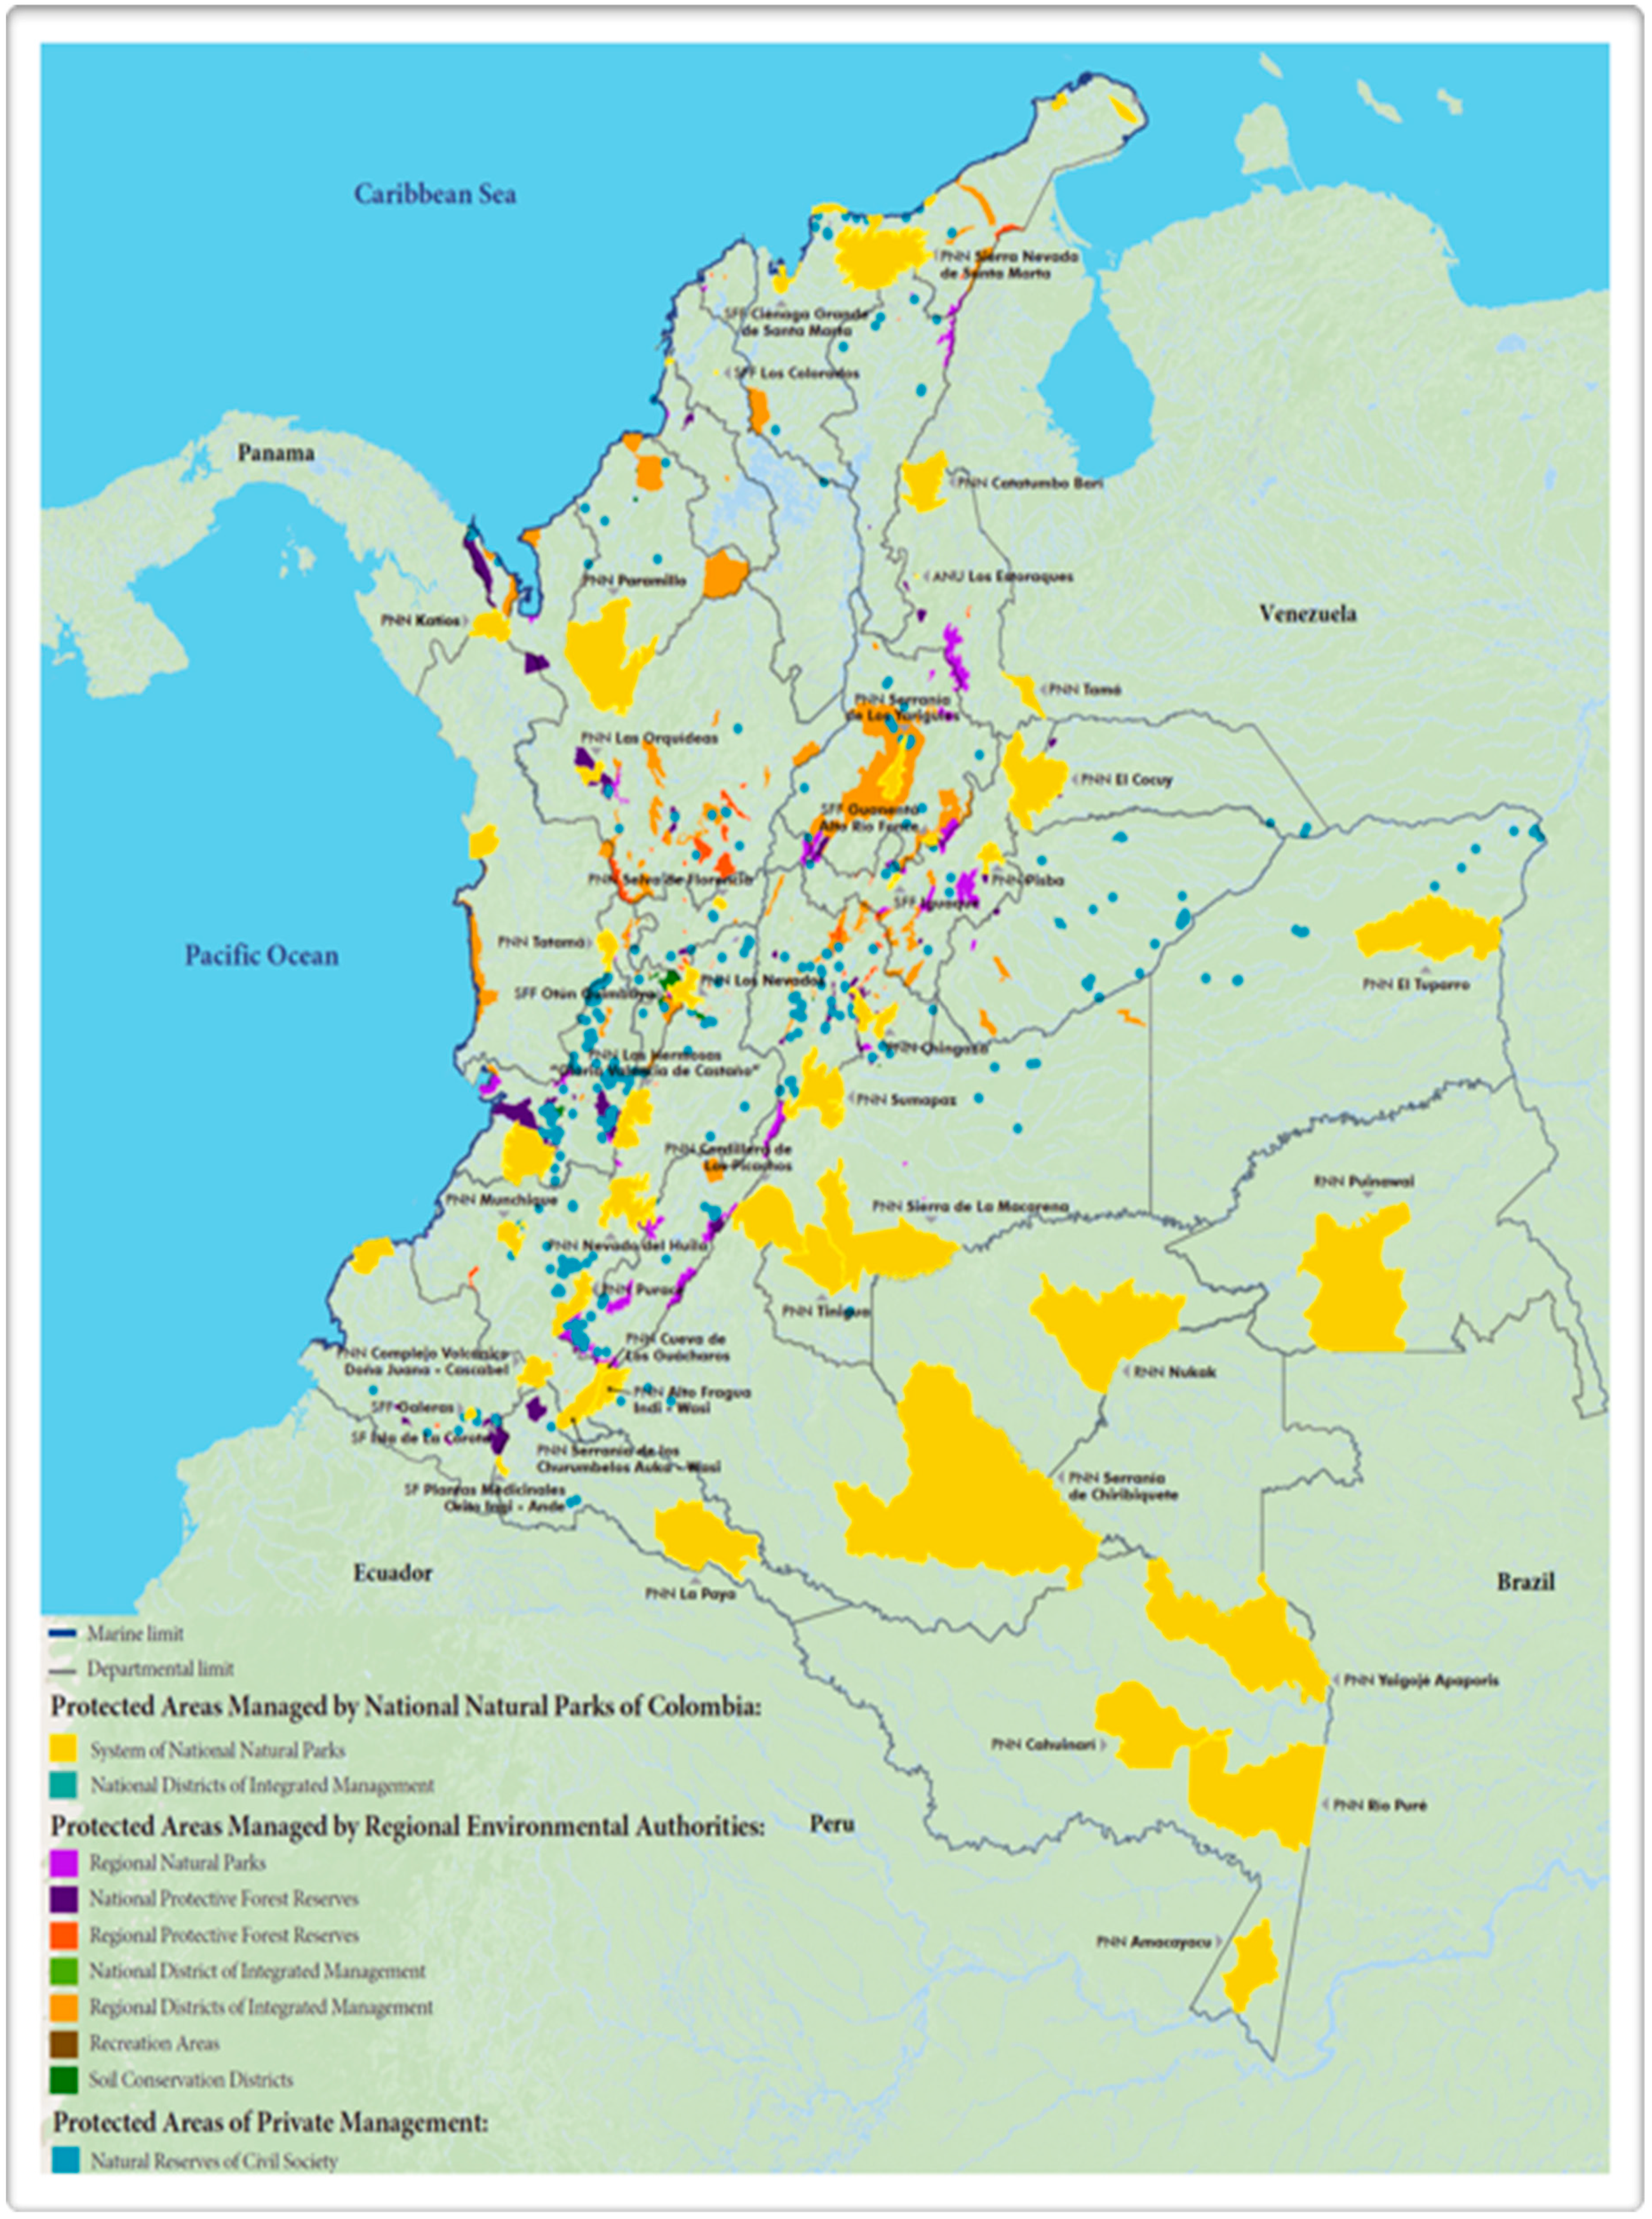
48]. To date, the SINAP keeps including new protected areas and publishes a map of Colombia’s natural protected areas every year. The last published map of Colombia’s natural protected areas can be seen in
Figure 3 [
49]. There are 962 protected areas, 13.73% of the marine surface of the country is protected, representing 12,750,004.02 hectares, and 14.16% of the land surface is protected, representing 16,168,580.42 hectares. In total, there are 28,918,584.44 hectares protected, representing 13.97% of the total national territory. From this figure, it can also be seen that the protected areas are classified according to the entity in charge of the management, such as the System of National Natural Parks, regional environment authorities, and private associations.
2.4. Procedure for Calculating the Energetic Complementarity Between RES
The statistical correlation between two or more RES is a way to measure their energetic complementarity. For this purpose, the negative of the Pearson correlation coefficient can be used. This coefficient measures the relationship between two variables. It can take a range of values from +1 to −1, where, in the case of evaluating the energetic complementarity between two RES, a positive value indicates higher feasibility of joint use of both resources.
From a set of points (
x,
y), the negative of the Pearson correlation coefficient
R can be obtained in terms of the covariance
σ as [
9,
14,
50]
where
S and
W are the solar and wind data, respectively, and
M stands for month. The
σ can be calculated as [
9,
14,
50]
To apply Equation (1), it is necessary to know the values of the resources available in the country. Typically, these values are obtained from the measurements of the weather stations installed across the country. However, in this research a novel approach is proposed. Instead of using the measurements, i.e., the values of the available country, solar and wind resources are obtained from the high-resolution maps using image processing techniques.
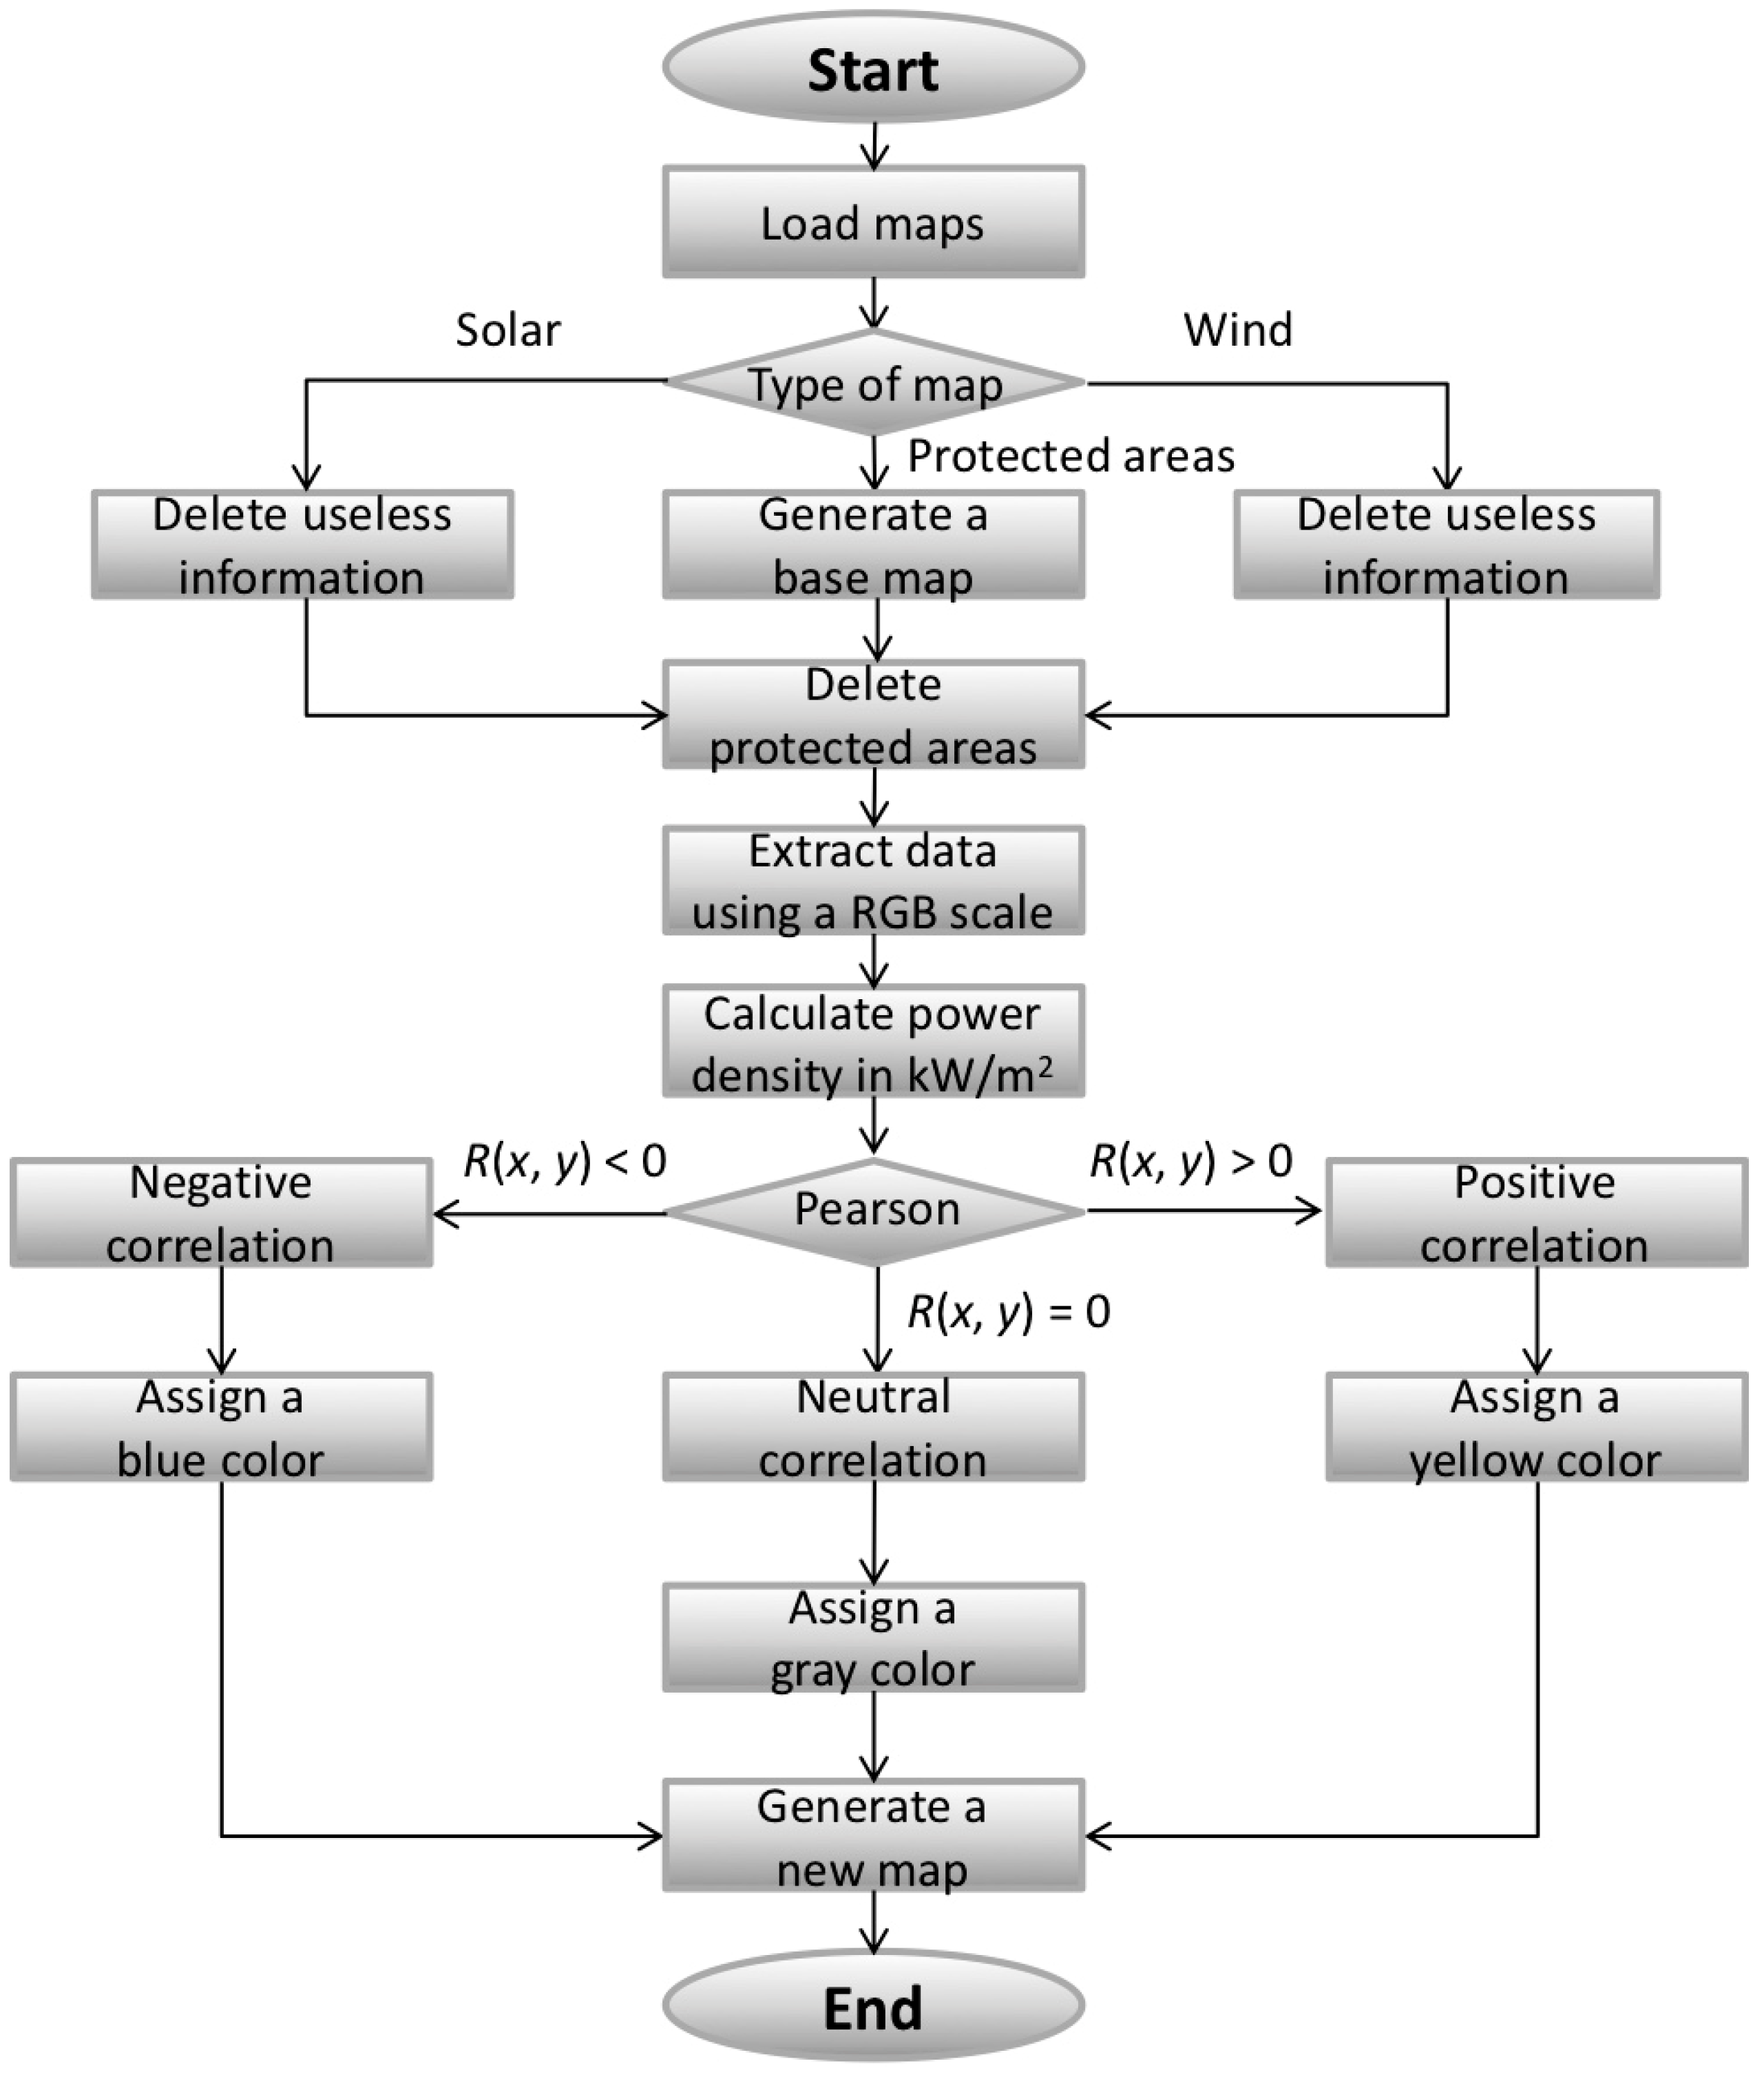
Figure 4 shows the flowchart of the procedure used to assess and generate the maps of complementarity between solar and wind resources of Colombia for each month of the year. The first step is to load the maps of the natural resources and protected areas. Twenty-five maps are used: twelve monthly maps for the solar resource, twelve monthly maps for the wind resource, and one map of the protected areas. These maps have a resolution of 1208 × 1142 pixels. Each pixel on each map has a color associated with it and represents an energetic value. To improve the accuracy of the data extracted, high-resolution images need to be used. The images are adjusted to overlay the maps and to correct any rotation or scaling using an algorithm of image processing.
After having loaded the maps, they are processed. With solar and wind maps, useless information is deleted, such as the sea and other countries, and for the protected areas map, a base map is generated using only the pixels that represent the protected areas in the country. The base map is used to delete the protected areas from the solar and wind maps.
At this point, twenty-four maps are obtained. The data of the colors on the RGB scale (Red, Green, Blue scale) of each pixel is extracted and stored in matrices. Now, the color of each pixel is known and can be matched to the values of the natural resource provided by the scale shown in the legends of
Figure 1 and
Figure 2.
The next step is to calculate the power density for each pixel in the twenty-four maps. Since the solar resource is given in kWh/m2/day and the wind resource in W/m2, it is necessary to convert the data to the same units. Two new matrices are created, which contain the information of the renewable resources and are associated with each pixel. Then, Equation (1) is applied to these matrices, and the negative of the Pearson correlation coefficient for each pixel is obtained. This information is stored in a matrix called the results matrix.
Finally, a new scale of colors based on the values obtained from Equation (1) is defined. Then, the values stored in the results matrix are converted into a new image that has the same characteristics of the resources maps. The negative of the Pearson coefficient is used to match the colors of the defined scale. A yellow-based color is assigned if a positive value is obtained, meaning a good correlation between the data of that pixel; a negative value means a bad correlation, and a blue-based color is assigned. A neutral correlation is obtained when the negative of the Pearson coefficient has a value of zero and a gray-based color is assigned. Using this information, new maps showing the energetic complementarity between both resources are generated for each month.
A script in C programming language was programmed including all the algorithms necessary for the image processing. The algorithms used are typically employed in other areas of knowledge, such as vision, recognition of images, and robotics. The advantage of this procedure is that it is simpler than processing daily measurements due to a large amount of information, different sizes of the data, or missing data. Moreover, it is useful when the measurements or data are not available, and the results obtained are accurate if high-resolution images are used. Note that the script can be applied to any other region of the world without the need of adding a new code.
Regarding the use of the Pearson correlation coefficient to calculate the energetic complementarity, it has been used and validated in [
9,
13,
14,
22,
23,
24,
25].
3. Results and Discussion
Figure 5 shows the sequence in the processing of the natural resources maps to obtain the monthly energetic complementarity maps using image processing techniques and the proposed procedure. From this figure, it can be seen how the natural resources maps are processed and the useful information for the study is extracted until a new energetic complementarity map is obtained.
Figure 6,
Figure 7 and
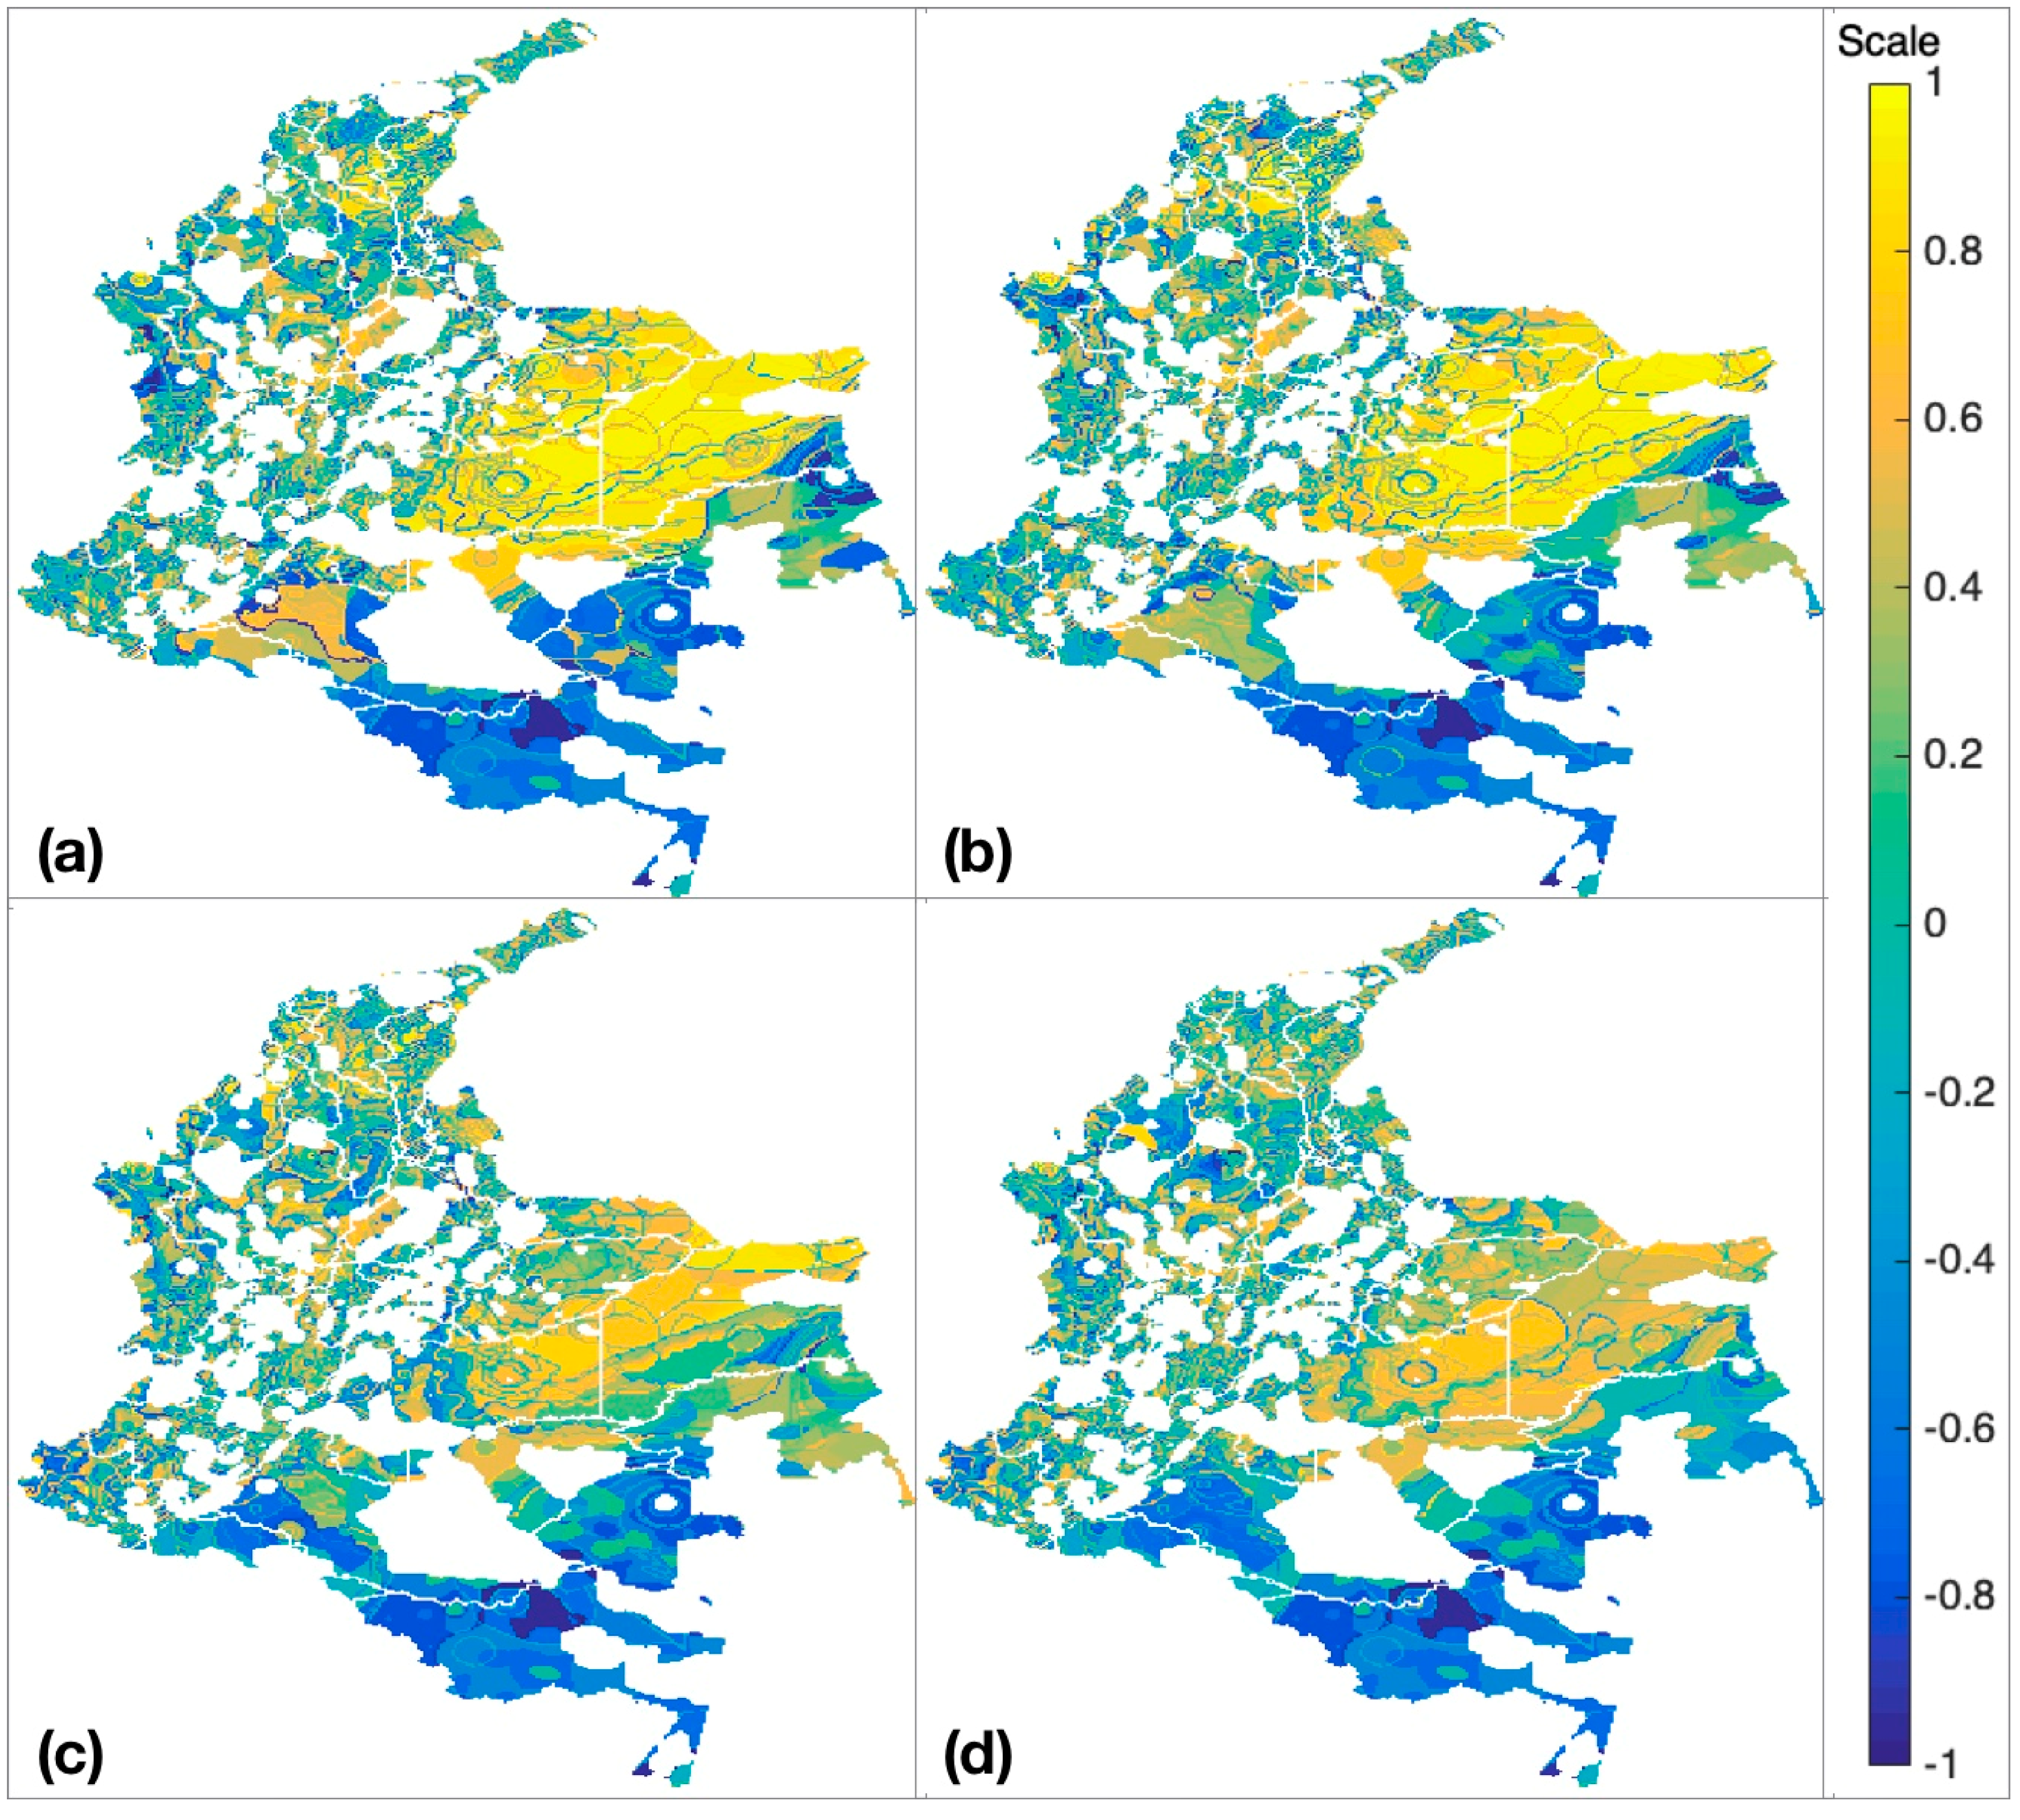
Figure 8 show the results obtained. The colors range from yellow to blue; yellow means a good energetic complementarity and blue a bad energetic complementarity. These maps were obtained for wind speeds at a height of 80 m above the ground and for solar radiation at ground level. From these figures, it can be seen that the protected areas were eliminated from the maps, and its energetic complementarity was not calculated. This is due to the current laws in the country, which state that it is not possible to install generation systems of any type in protected areas. Please note that this consideration has been always omitted in studies of energetic complementarity reported in the literature.
Figure 6a shows the energetic complementarity obtained for January. It can be observed that there is a higher complementarity in the northeastern region of the country. Moreover, there is a good complementarity in some regions of the center and the north near the Caribbean Sea, while there is no energetic complementarity between both RES in the south. Therefore, this region is not suitable for the installation of combined energy systems. A similar behavior can be seen in February, as shown in
Figure 6b. In this month, the obtained values are slightly reduced in comparison to January. This reduction in the obtained correlation continues for the months of March and April, as shown in
Figure 6c,d, respectively. The reduction in the energetic complementarity is evident since the solar and wind resources have the same pattern in these months, as can be seen from
Figure 1 and
Figure 2.
Figure 7 shows the energetic complementarity obtained for the months of May, June, July, and August. Note that the energetic complementarity for these months is good in almost the same regions of the previous ones but with a reduced value. Furthermore, there are fewer regions in blue color, particularly in May (see
Figure 7a) and in July (see
Figure 7c). The reason is that the solar resource is available in almost the entire country during these months, as shown in
Figure 1, and there is also a good wind resource, as shown in
Figure 2. June is the month with the lowest value of the negative Pearson correlation coefficient obtained in the south with values close to minus one, as observed from
Figure 7b.
Figure 7d shows that in August there is a good energetic complementarity in the regions where the Colombian Andes pass because there is good wind potential, but unfortunately, many of these places are difficult to access and the land is not suitable for the installation of generation systems.
The worst energetic complementarity obtained across the country throughout the year is in September, as shown in
Figure 8a. This month could be selected as a critical month when designing the power generation systems. In October, while the energetic complementarity is low in almost all regions of the country, in the northern region there is a good correlation between both RES, as shown in
Figure 8b.
Figure 8c,d shows that the complementarity improves for the months of November and December, due to the variations in the solar and wind resources (see
Figure 1 and
Figure 2).
The summary of the obtained results for the twelve months is given in
Table 1. Only the percentages of the total area of the country with a positive energetic complementarity are shown, with increments in 0.2 in the value of the negative of the Pearson correlation coefficient, while
Figure 9 shows the results of
Table 1. It can be observed that February is the month with a larger area having a positive value of energetic complementarity (32.99%). January has the highest values obtained, even for an energetic complementarity greater than 0.8, the area covered is 10.56%. September is the month with the worst values in terms of energetic complementarity, with values of 27.06%, 18.55%, 10.73%, 2.81%, and 0.29% for values of the energetic complementarity greater than 0, 0.2, 0.4, 0.6, and 0.8, respectively.
Figure 9 shows that the obtained energetic complementarity has the same pattern for the months of the year with different positive values, especially for values greater than 0.2, 0.4, and 0.6. For values higher than zero, the energetic complementarity oscillates around 30%, while for values greater than 0.8, only the months of January, February, March, and December have values above 2%. Bear in mind that greater obtained values mean more power generations using both resources, and in consequence, more possibilities to meet the power demand with no backup systems.
To have a better appreciation of the obtained results, a new map representing the annual energetic complementarity was obtained. This map summarizes the average of the values of the negative of the Pearson correlation coefficient calculated for each region of the country. Please note that for the correct calculation of the annual energetic complementarity, the average of the solar and wind resources must be calculated and substitute the results in Equation (1), instead of using the average of the obtained results for the twelve months.
Figure 10 shows the obtained annual energetic complementarity map of Colombia. Please observe that there is a great energetic complementarity in the northeastern region of the country throughout the year, also in some regions of the country from the southwest to the north, especially those near the Pacific Ocean and Caribbean Sea, while in the southern region of the country the solar and wind resources are low and they do not have variations, and in consequence, there is not a good energetic complementarity. The results obtained show 30.49% of the country area with a positive energetic complementarity, 14.16% are protected areas, and the rest has a negative or zero energetic complementarity, representing the 55.35%.
From the obtained results, it can be concluded that in the country’s southern region the energetic complementarity between both RES is low, especially in the regions close to the countries of Ecuador, Peru, and Brazil, with the Pearson correlation coefficient varying from zero to minus one. On the other hand, in the regions close to Venezuela, the best energetic complementarity is achieved. The obtained results suggest that for the regions from the southwest to the north of the country, the RES are suitable for the installation of hybrid renewable energy generation systems throughout the year. To date, wind plants in the north region and photovoltaic plants from the center of the country to the northern regions of Colombia have been installed. These places appear with a good energetic complementarity in maps and corroborate the information obtained.
Therefore, it is important to conduct further investigations and detailed assessment studies on-site in the areas where the obtained correlation is close to unity. These studies should consider the influence of the ground morphology, since it affects the power generation, and evaluate the energetic complementarity in small scales of time, because it is well known that the significant potential of the wind is during the night and for the solar resource during the day. These approaches could be discussed in future studies.
The proposed procedure is a valuable tool to obtain the energetic complementarity maps, which are useful to identify potential sites in a broad region where both resources are available and complement each other, and show where further studies should be performed. These maps are a valuable complement of natural resource maps.
4. Conclusions
Colombia is a country rich in solar and wind resources and with great potential for the installation of power generation systems based on these natural resources. A key aspect when designing generation systems based on variable renewable energy sources is the evaluation of the feasibility of installation. Energetic complementarity studies help to evaluate the feasibility for the joint use of two or more renewable energy sources in a determined region in a specific time interval.
In this paper, the monthly solar and wind energetic complementarity maps of Colombia have been presented. The correlation between solar and wind data has been calculated using the negative of the Pearson correlation coefficient and using the data extracted from the natural resources images employing image processing algorithms.
The obtained results show a good energetic complementarity between solar and wind resources throughout the year in the regions from the southwest to the north of the country. A total of 30.49% of the country has a positive energetic complementarity. The results suggest that these regions are suitable for the development of projects related to the joint use of both resources for electricity generation. On the other hand, the southern region of the country does not have a positive energetic complementarity, but this does not mean that projects related to the use of a single technology cannot be developed. The protected areas of the country, representing 14.16% of the total area, were not considered since it is not allowed to install power generation systems on them.
It is important to remark that the obtained energetic complementarity maps show wide areas with good energetic complementarity between both resources, but further studies on site are necessary for small regions with a good energetic complementarity according to the maps. Moreover, it is necessary to consider the ground morphology, other time scales, and local measurements in these studies.
The proposed procedure can be easily adapted to be applied in other regions of the world. It can be used together with curves of electricity demand to cope with the problem of grid balancing and improve the security of supply.


