Modelling and Evaluation of the Thermohydraulic Performance of Finned-Tube Supercritical Carbon Dioxide Gas Coolers


Abstract
1. Introduction
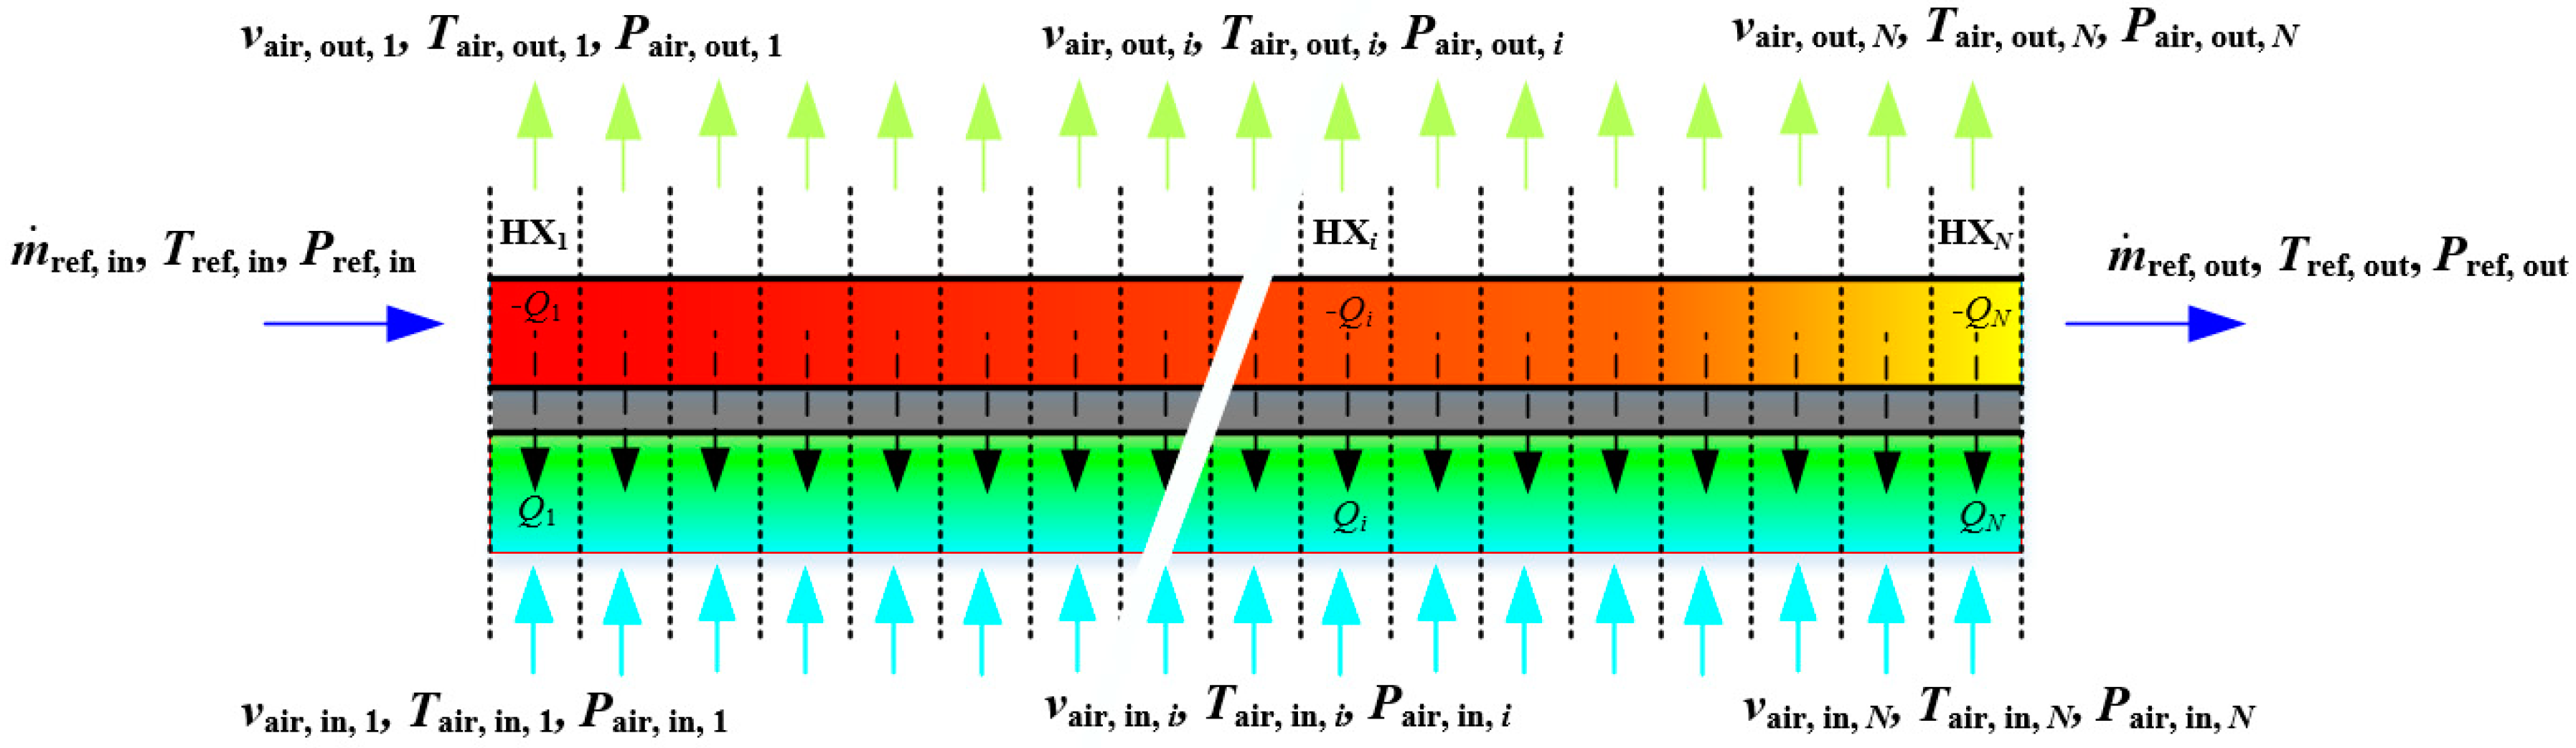
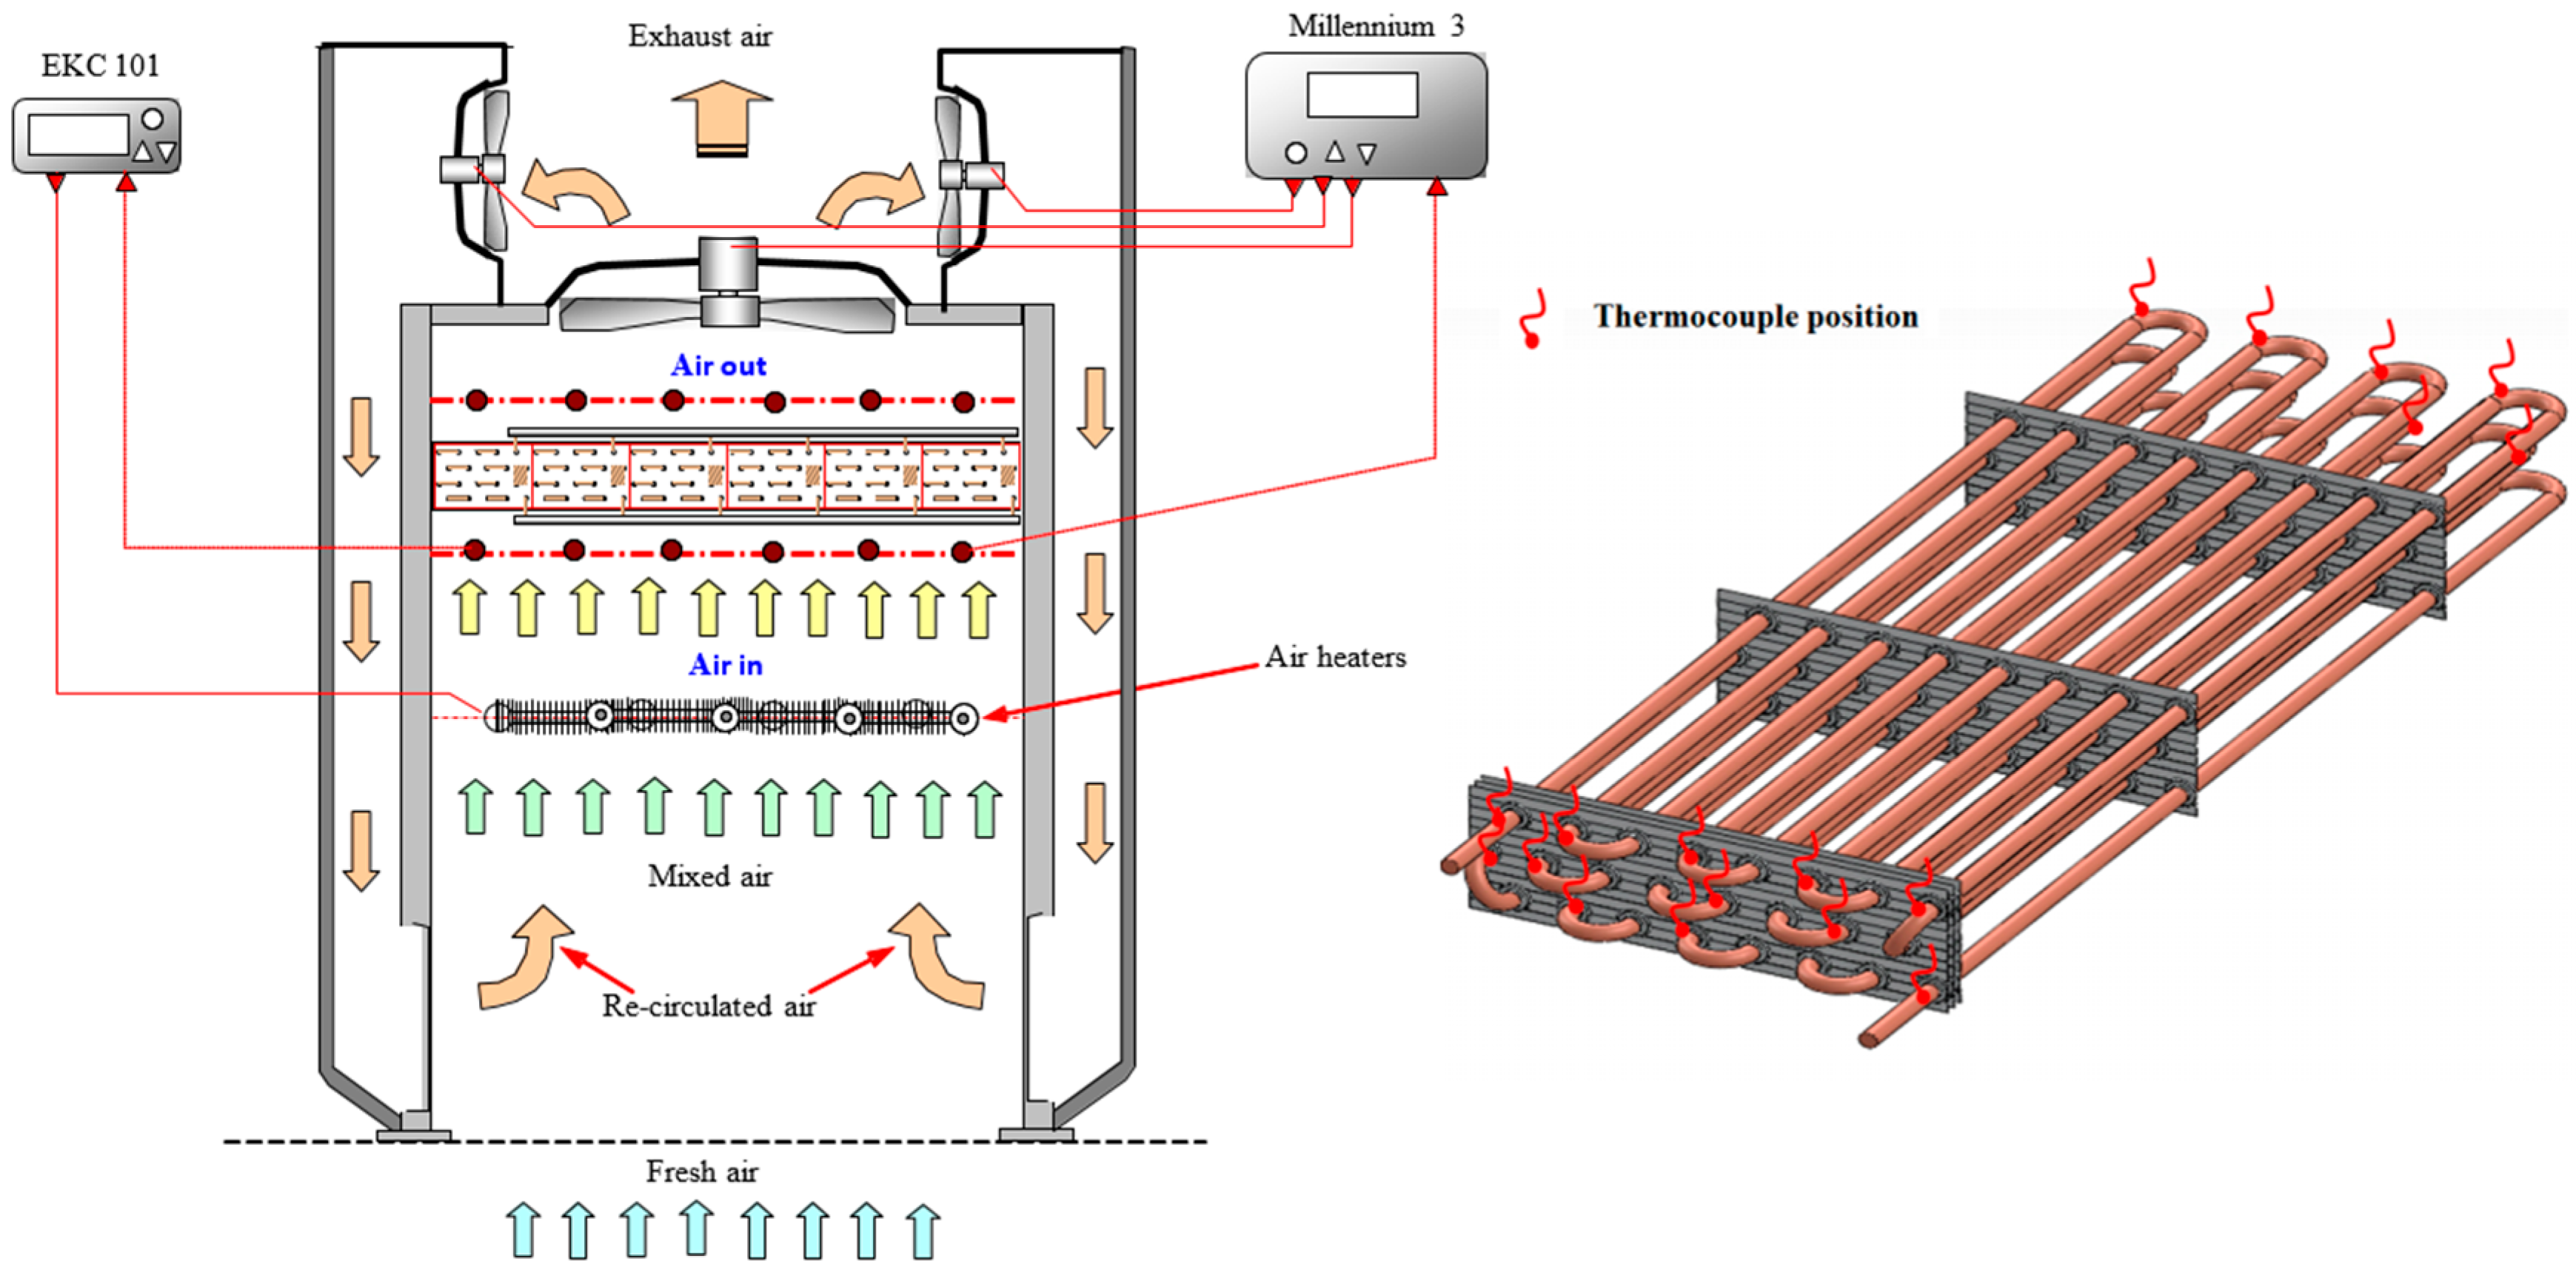
2. Methodology
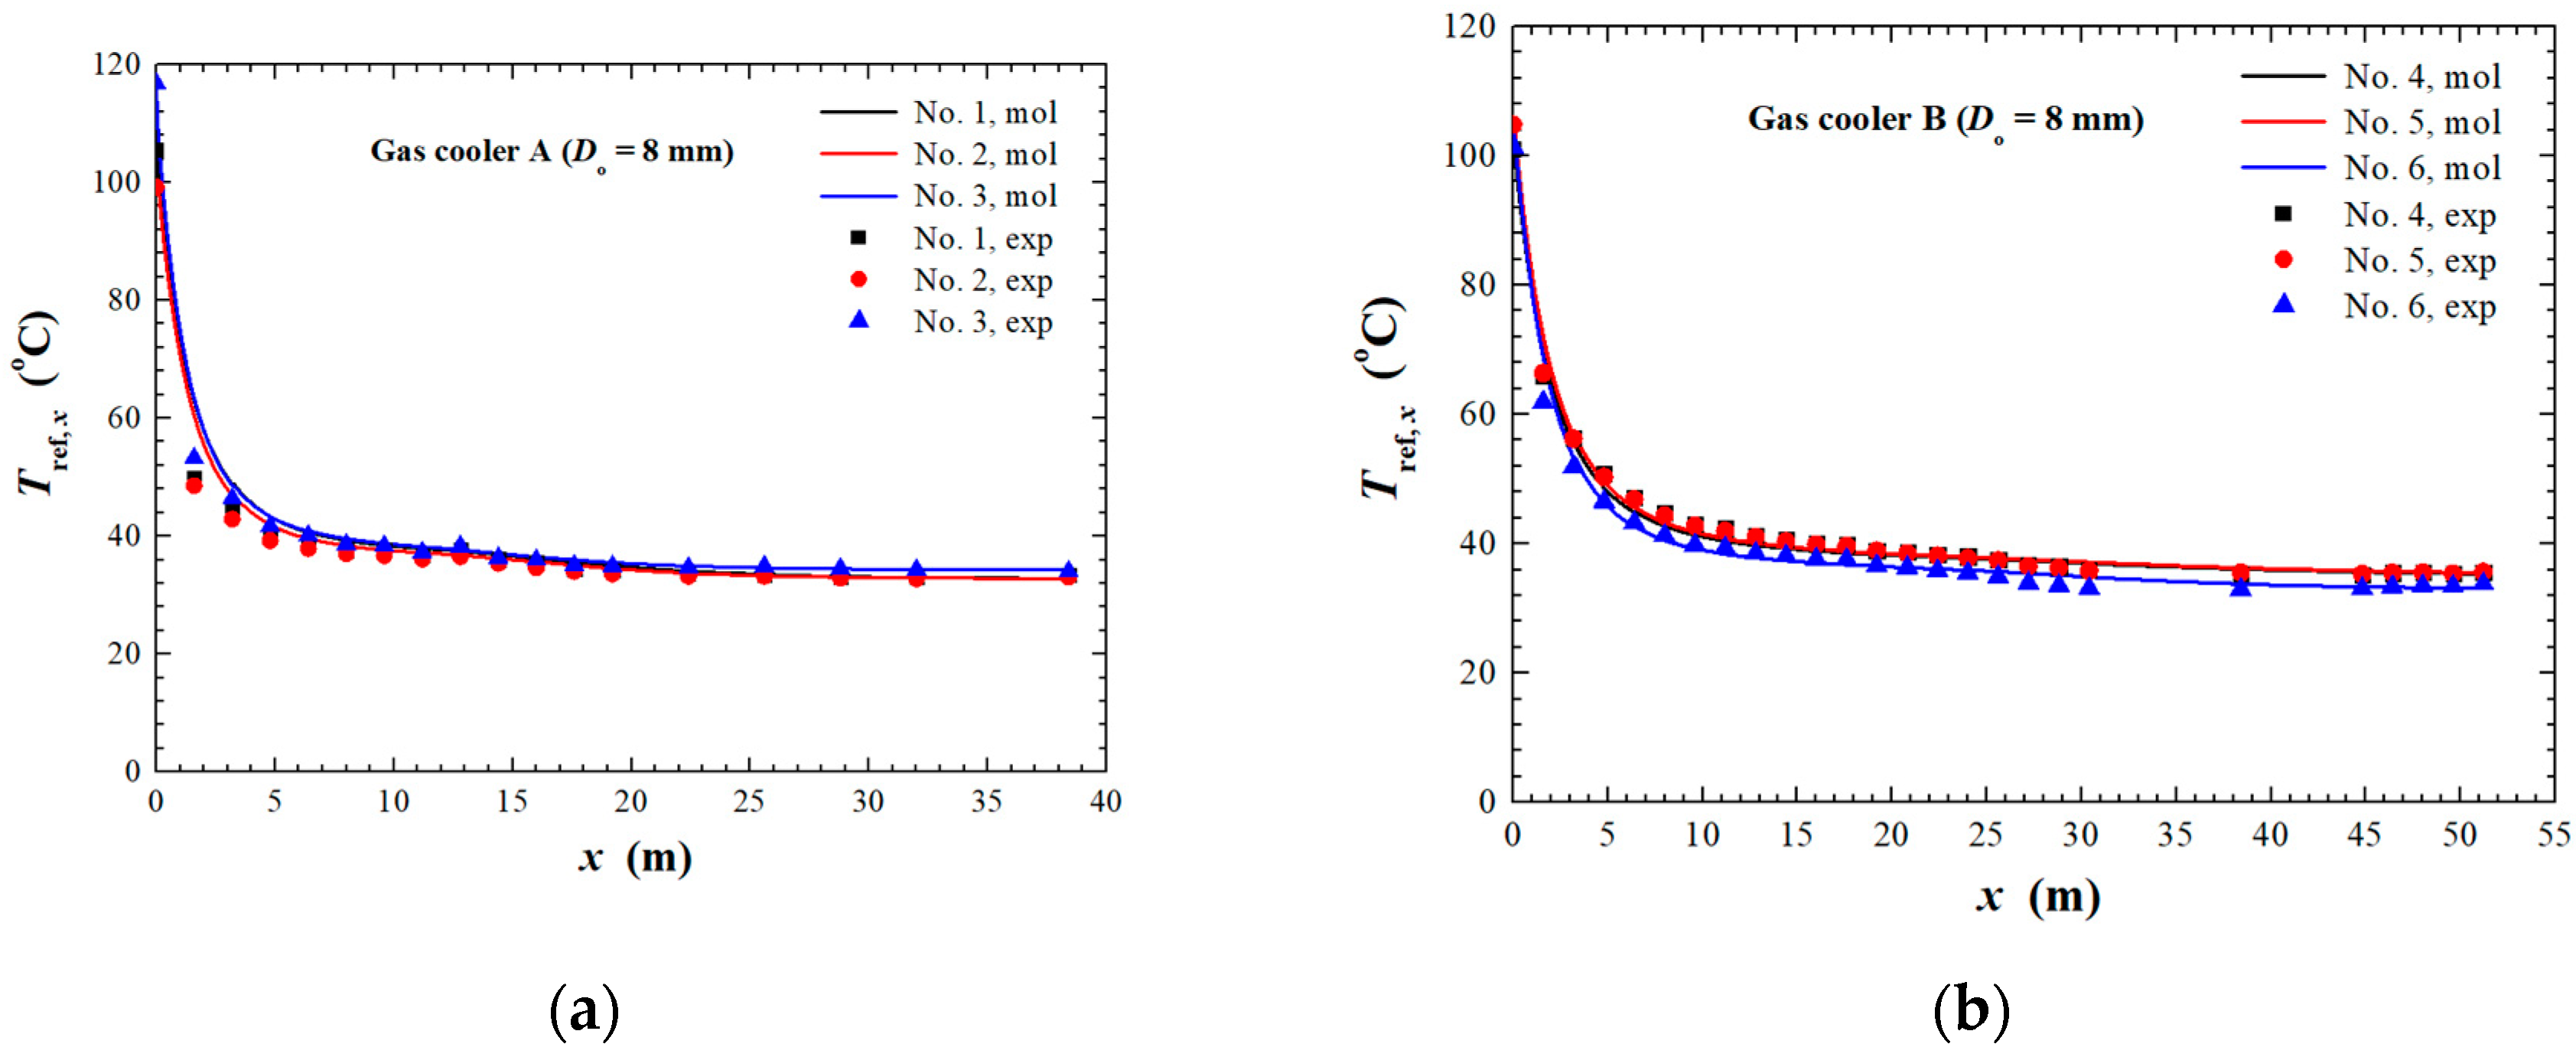
3. Model Validation
4. Results
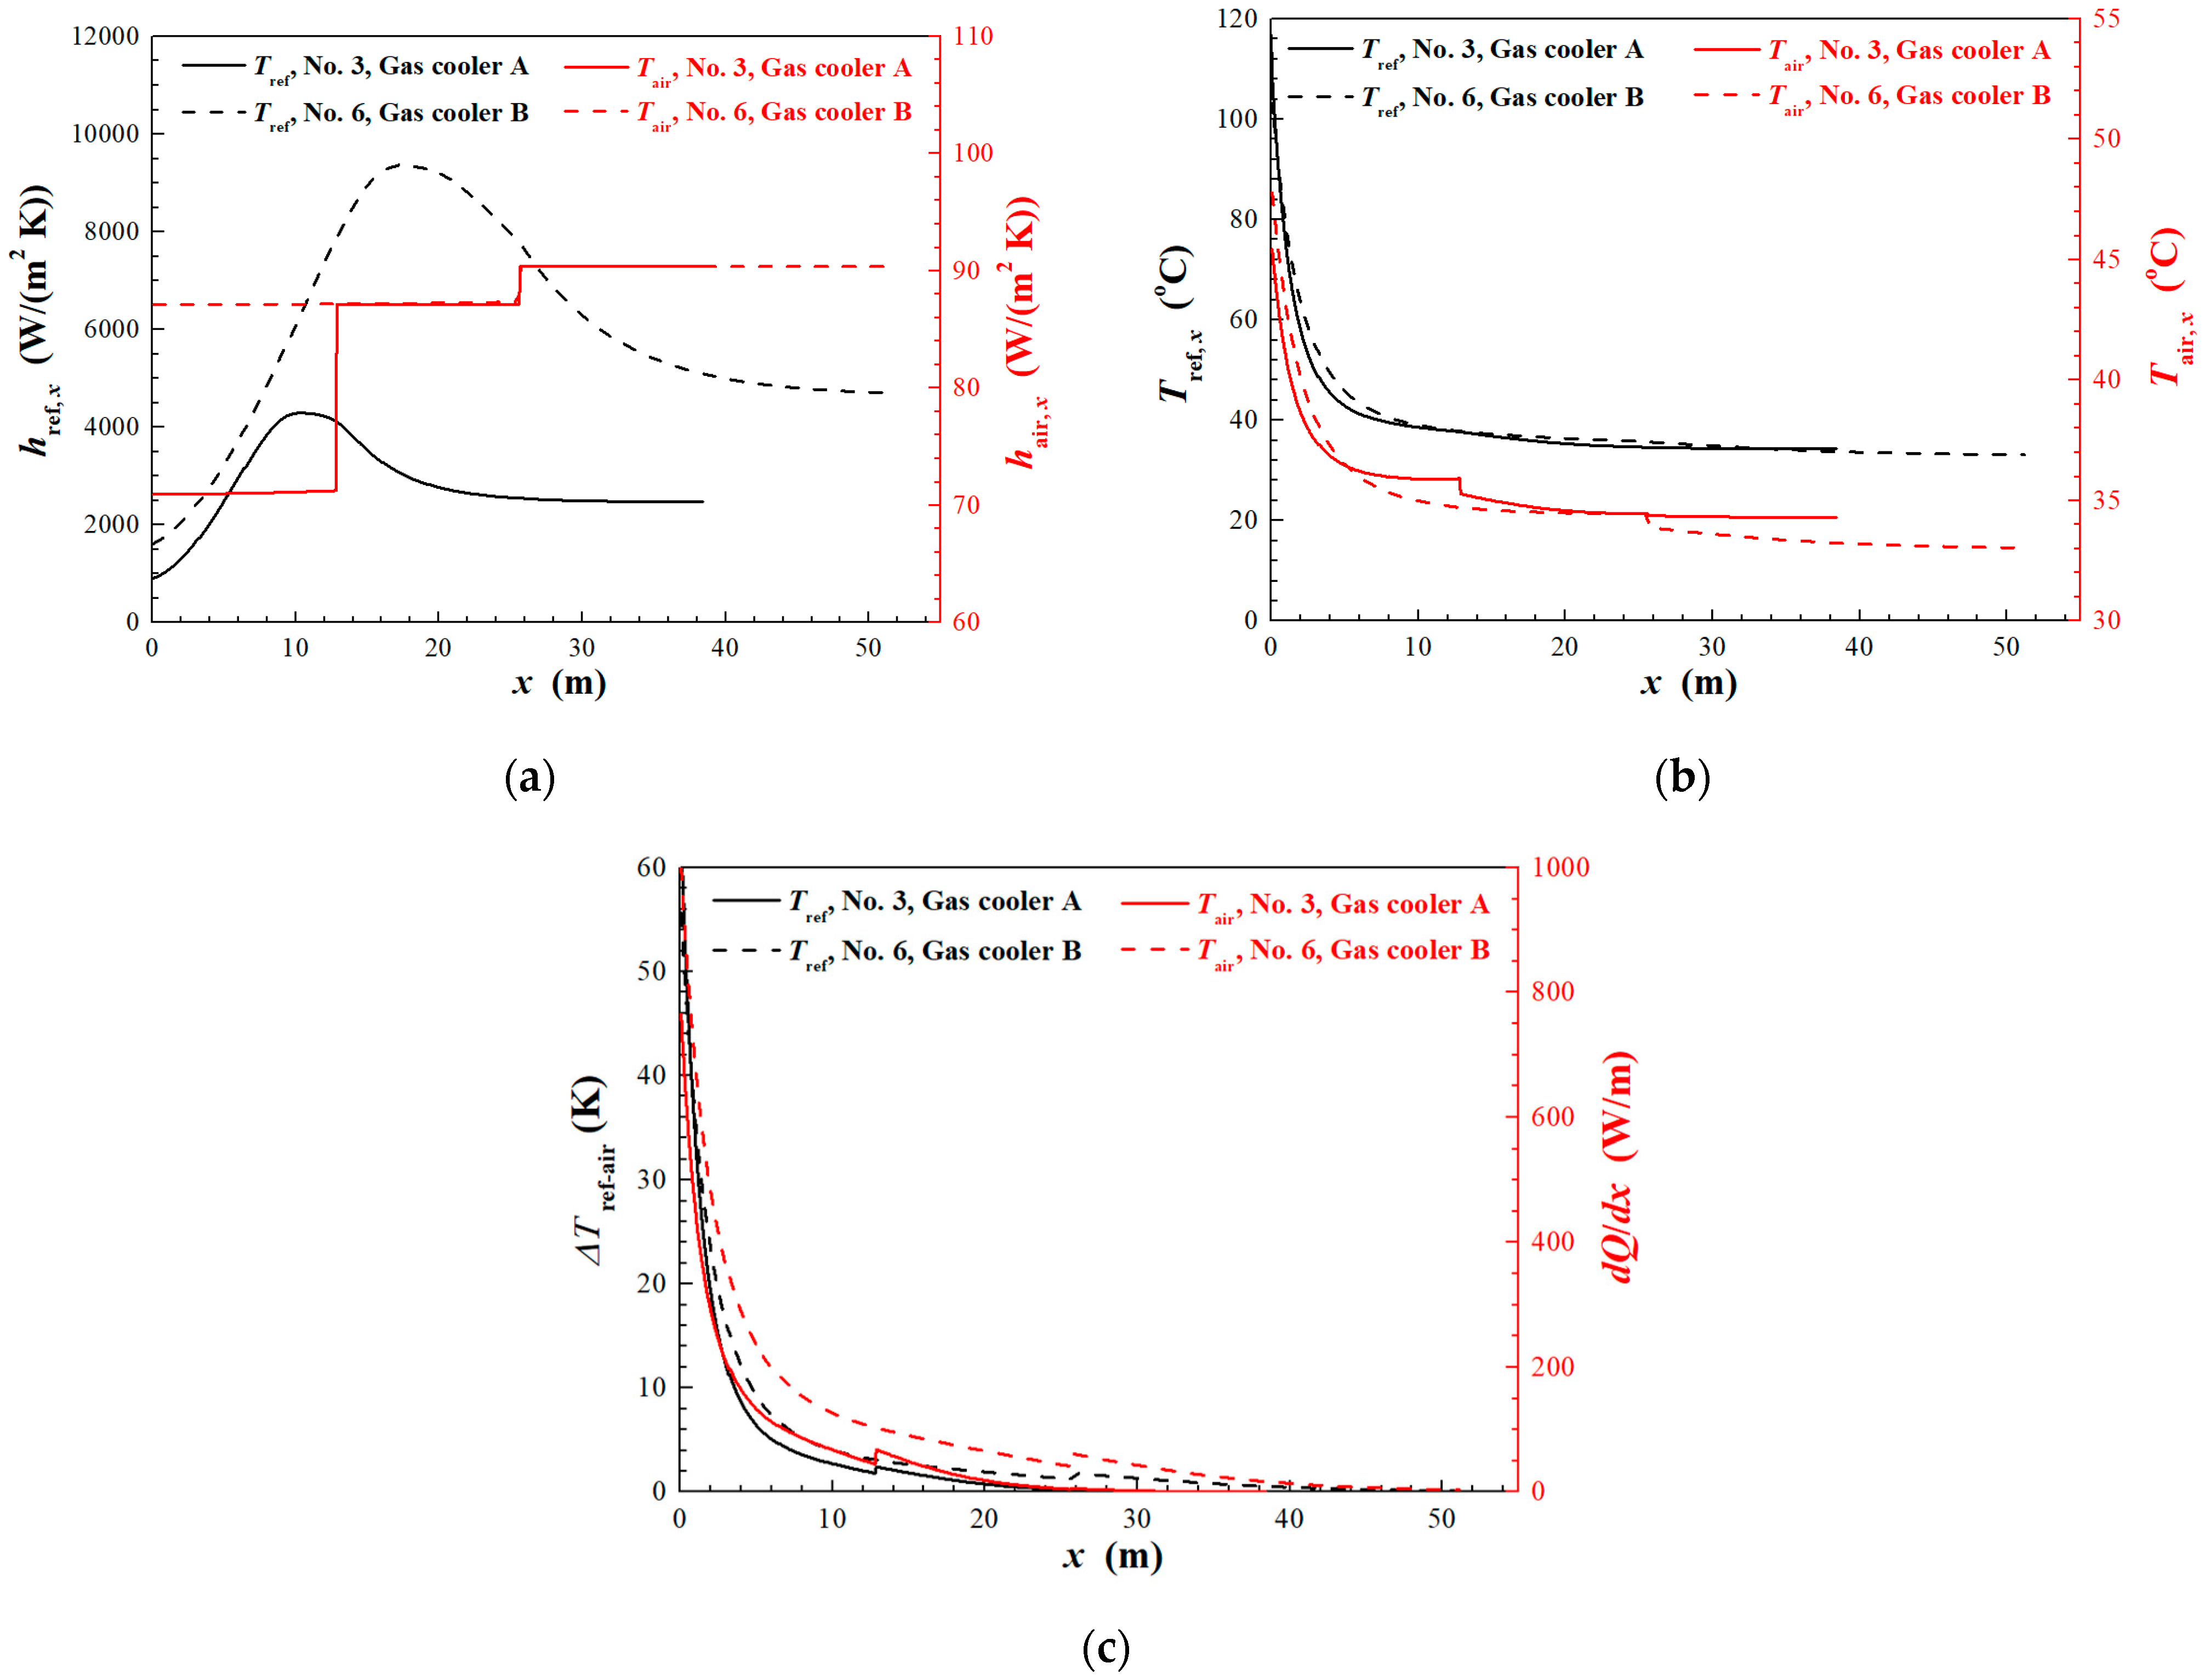
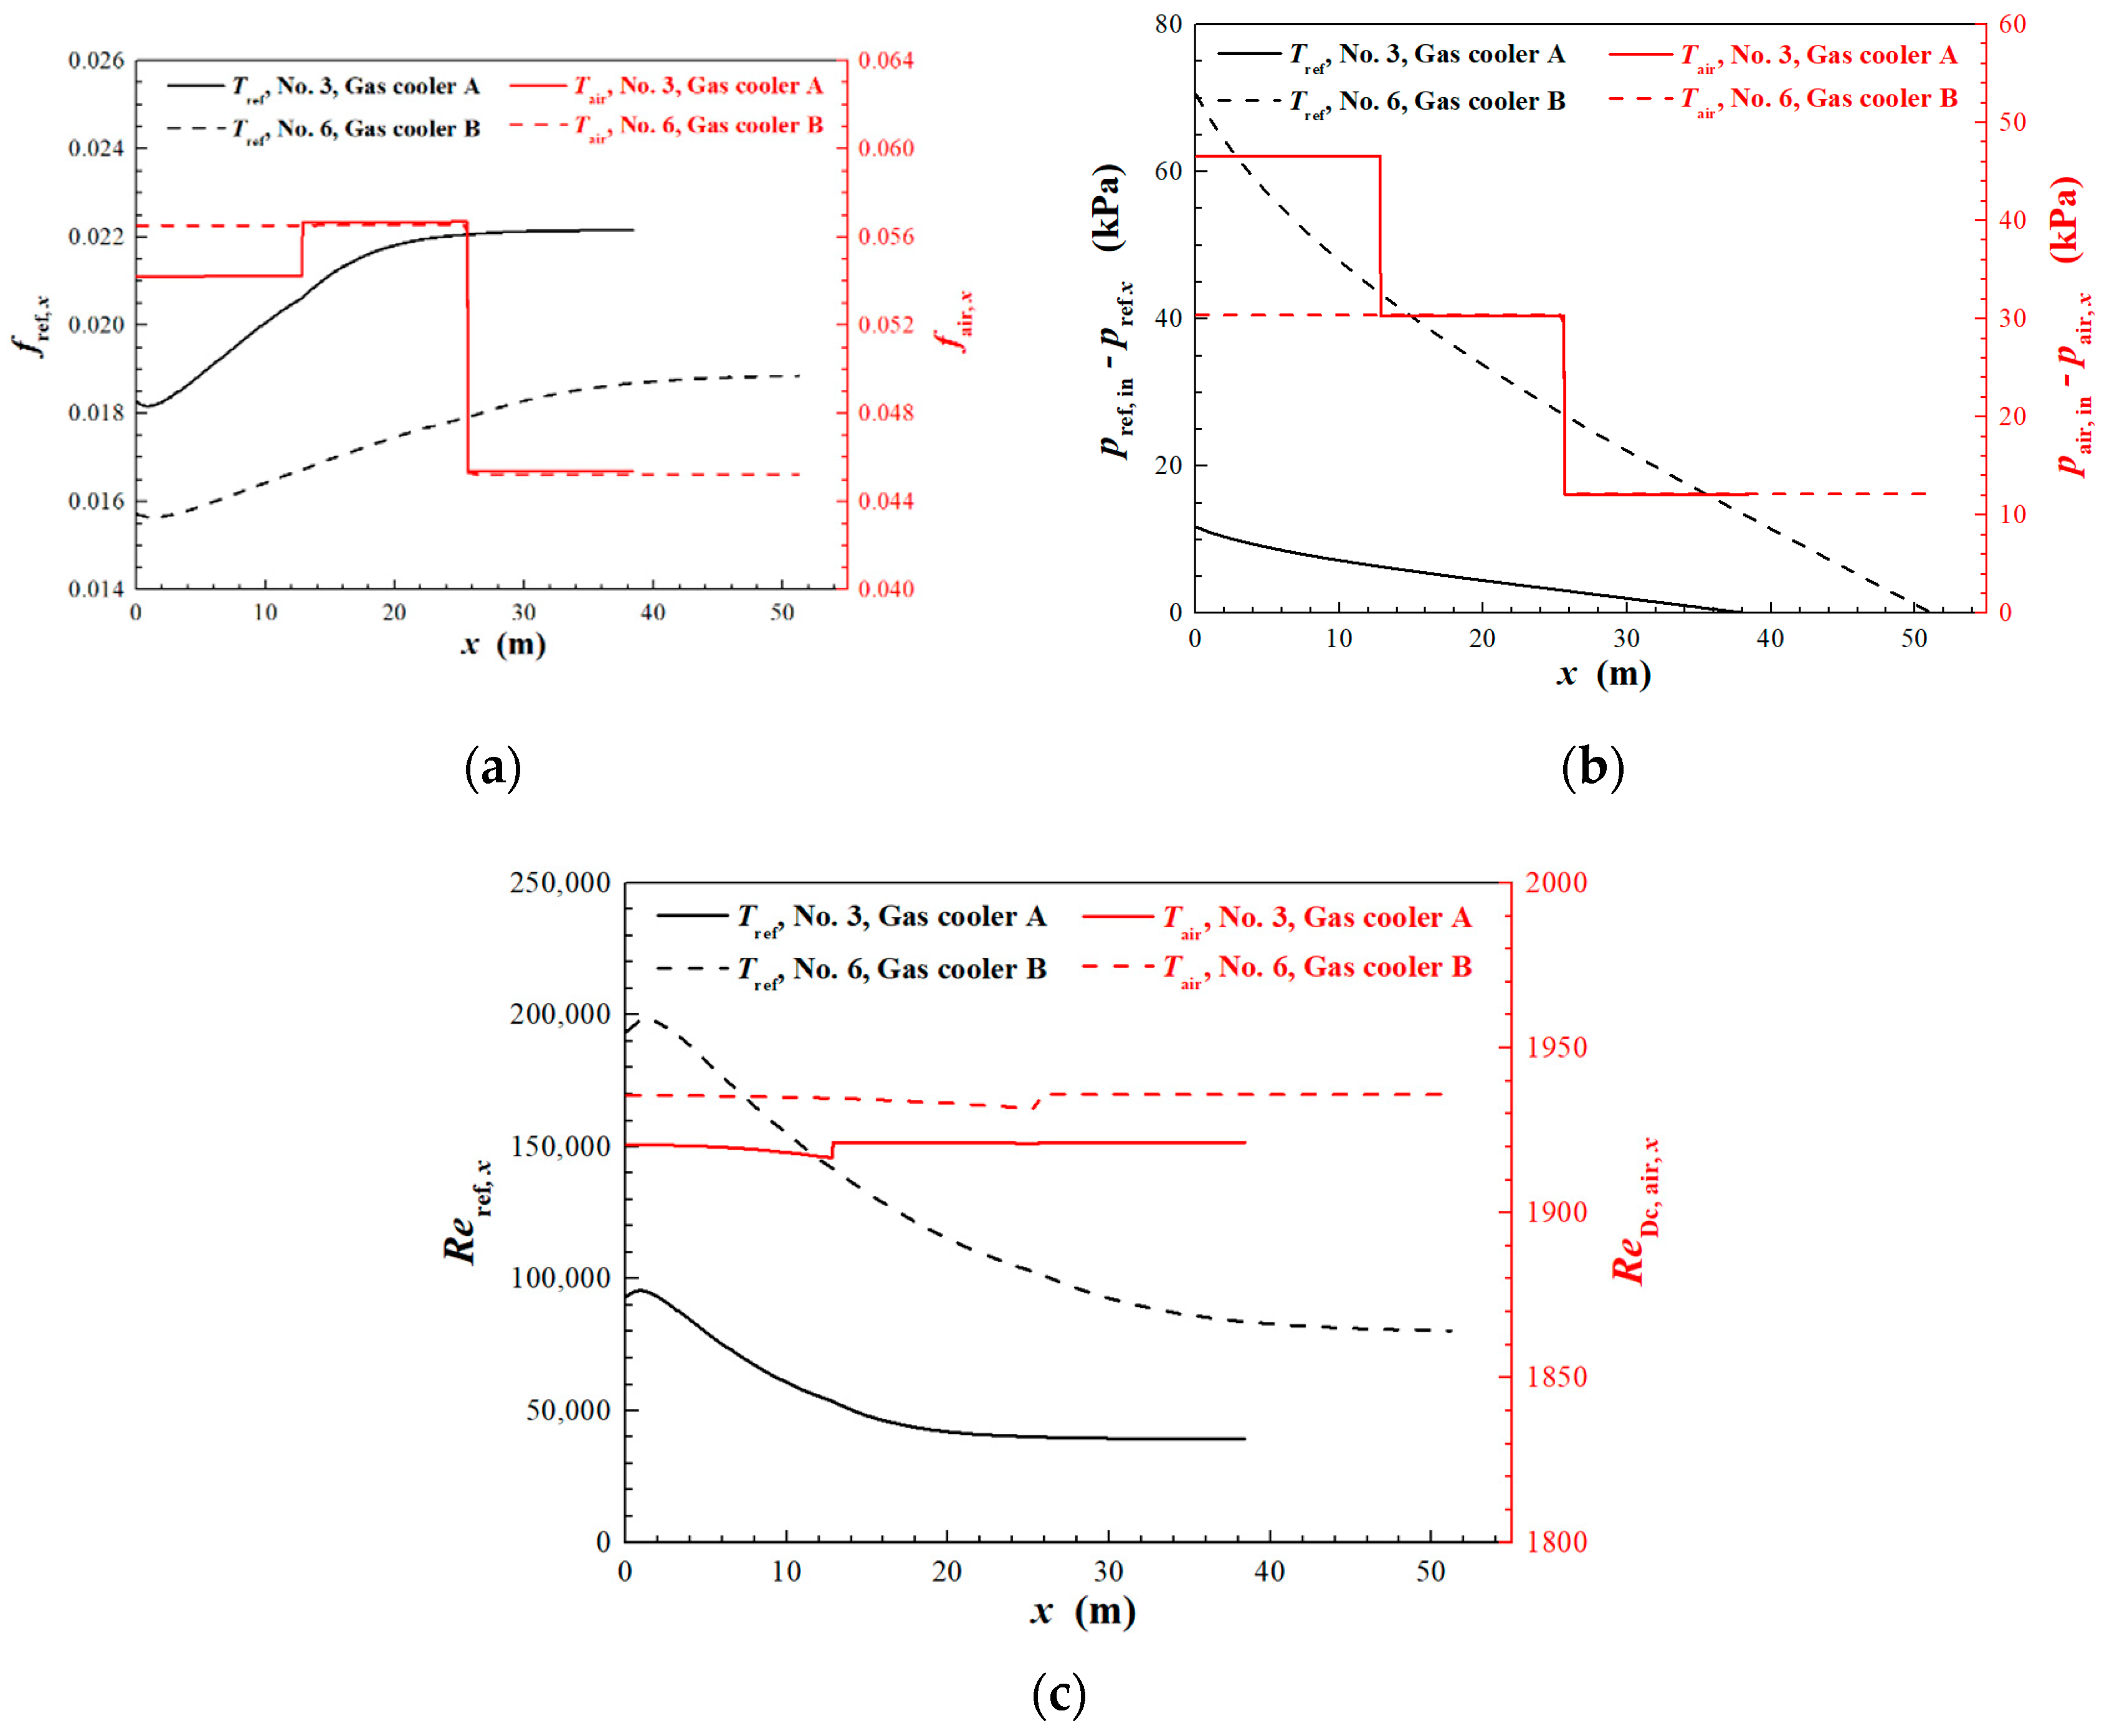
4.1. Local Thermohydraulic Performance
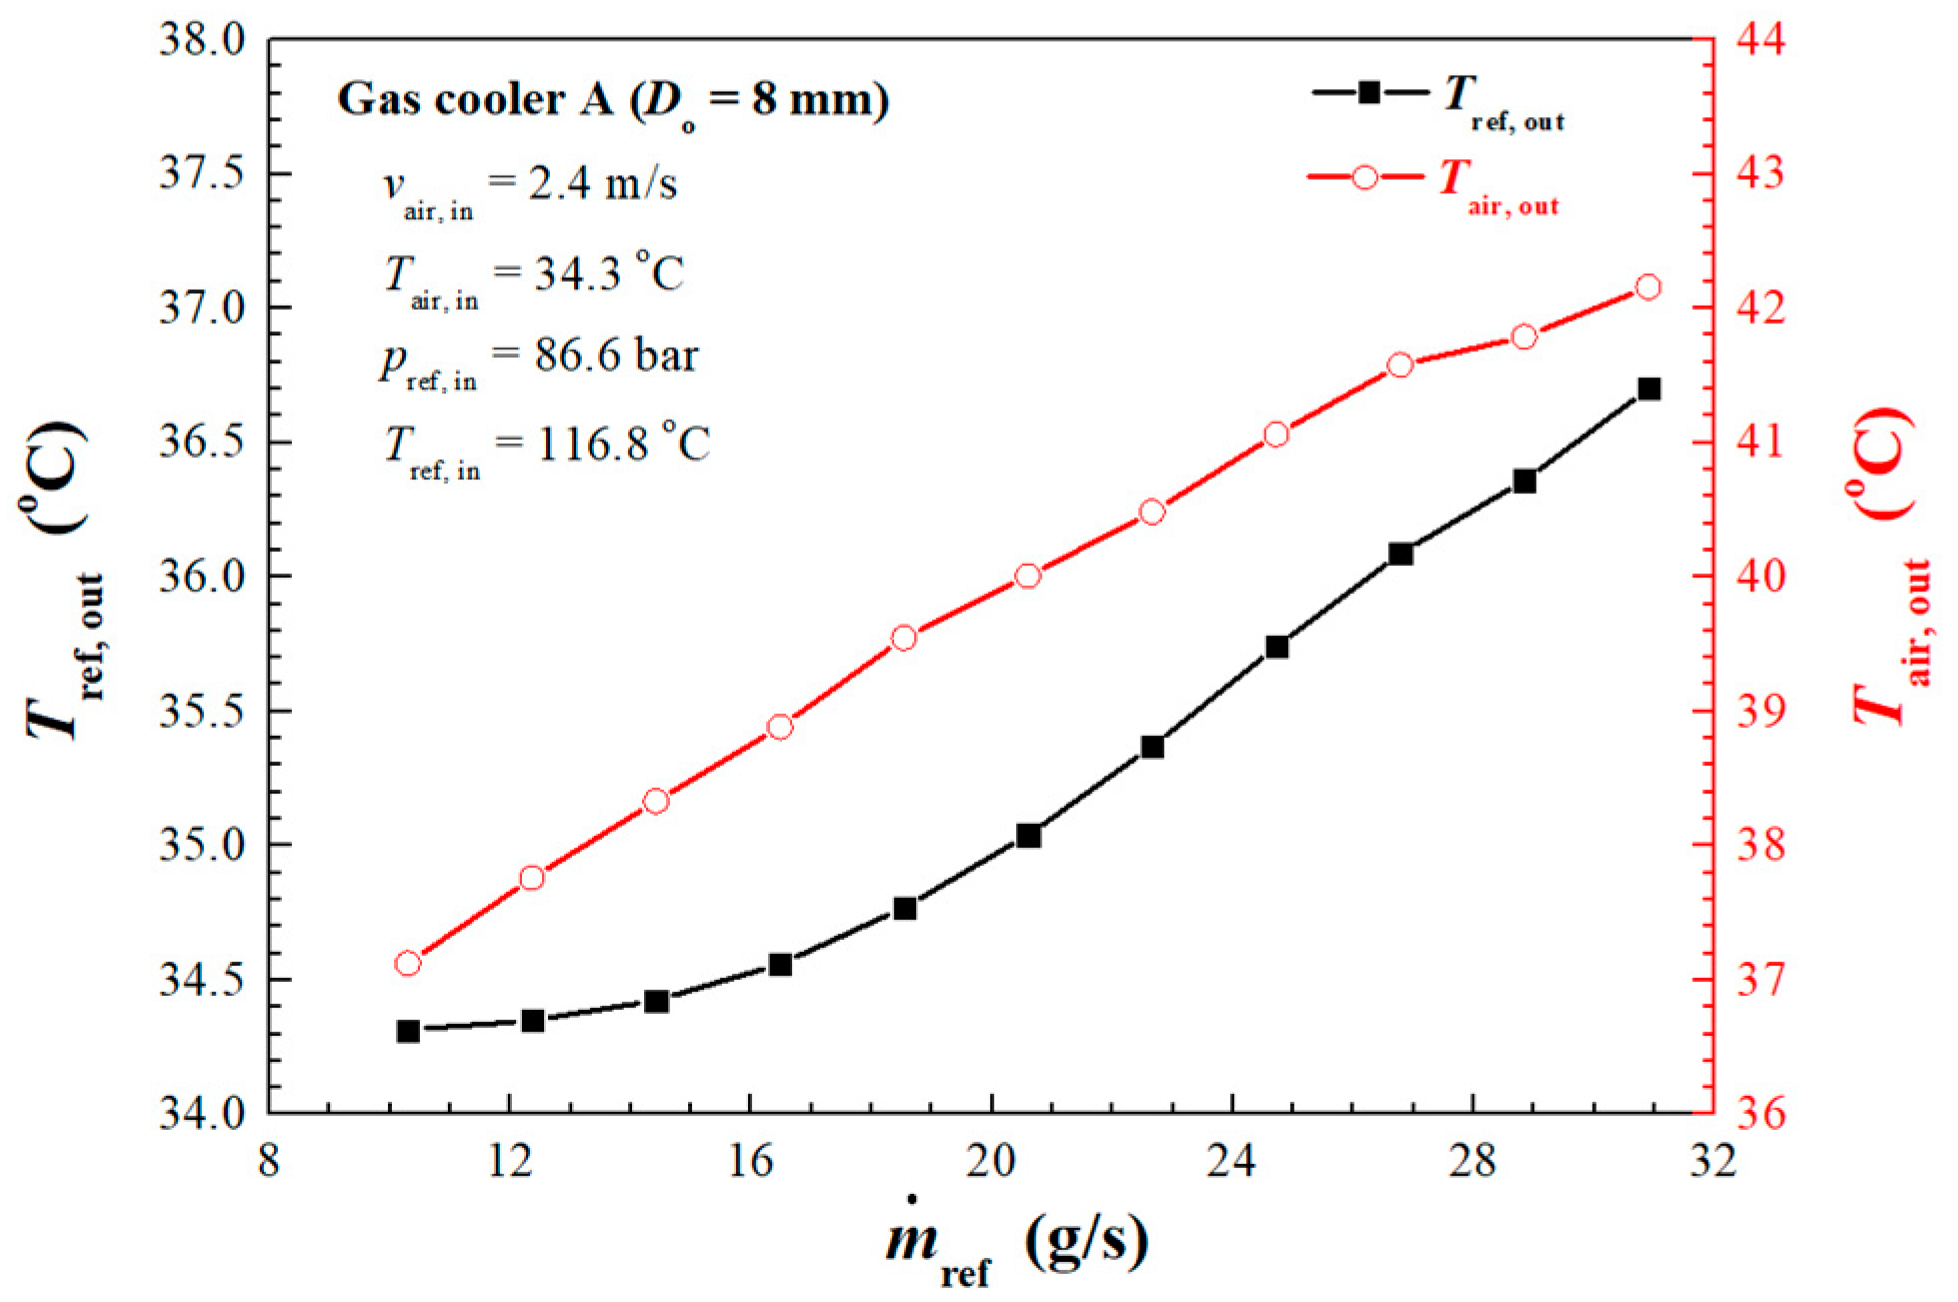
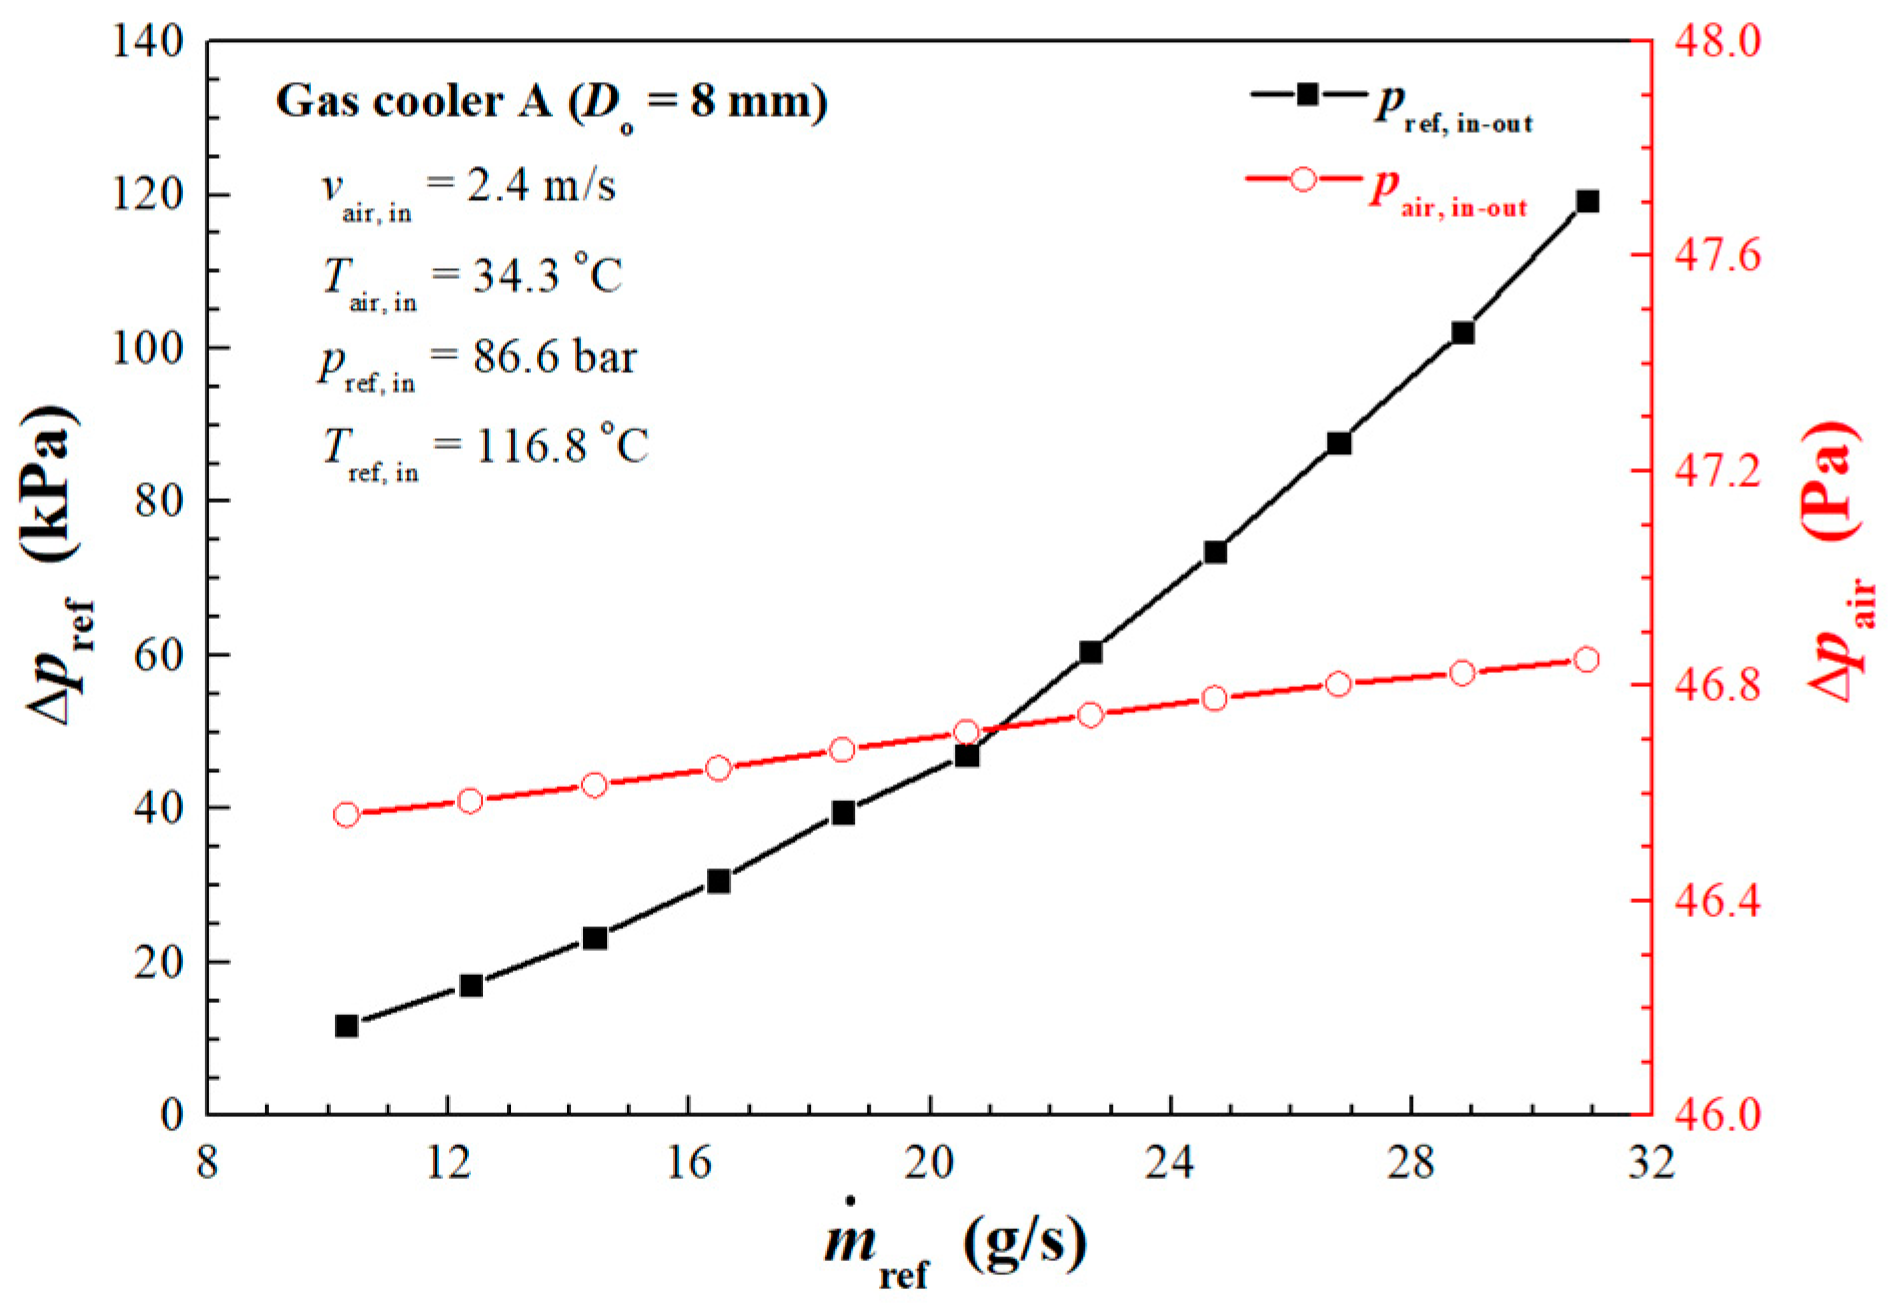
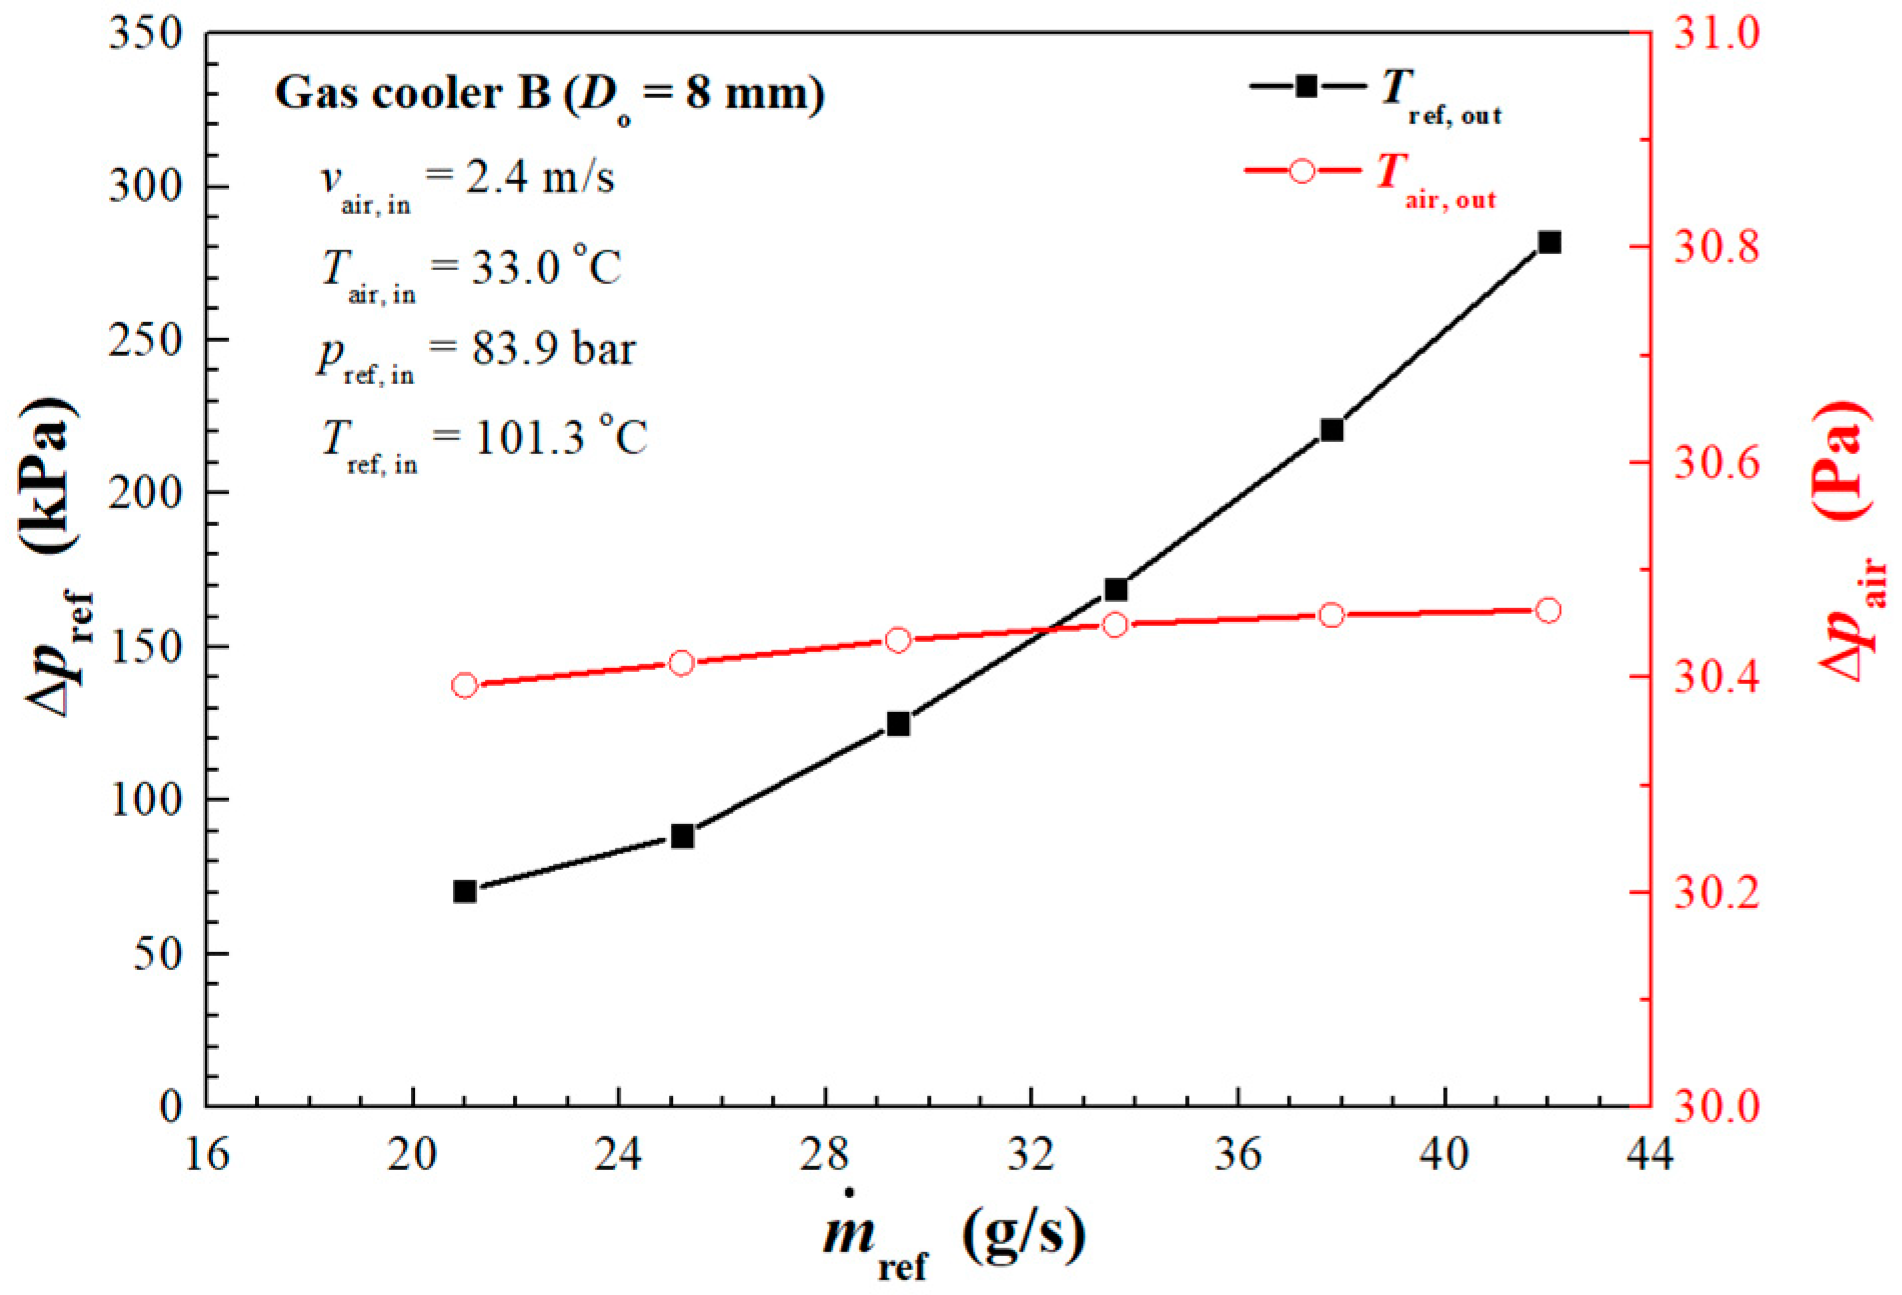
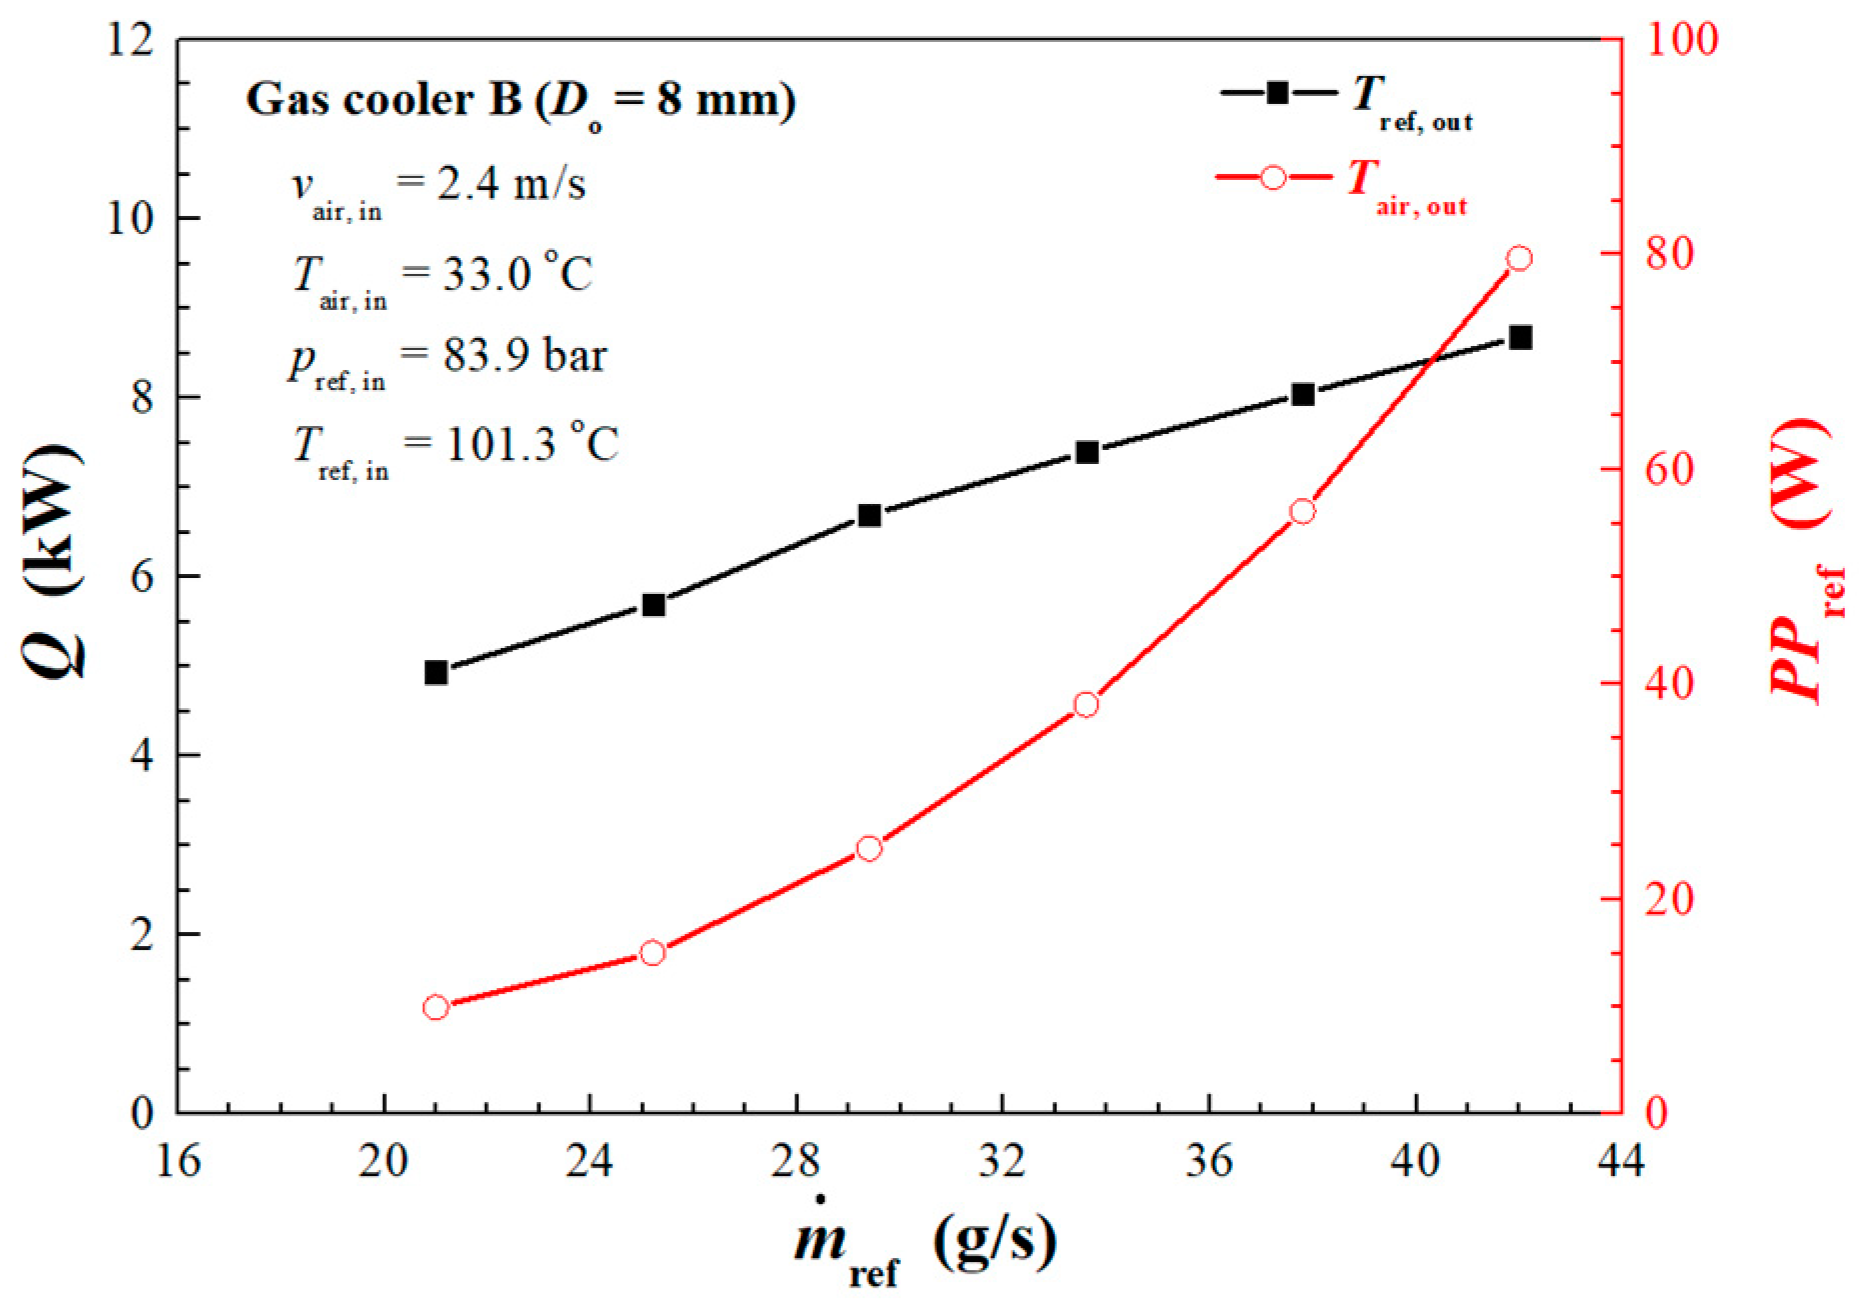
4.2. Influence of Refrigerant Mass Flow Rate
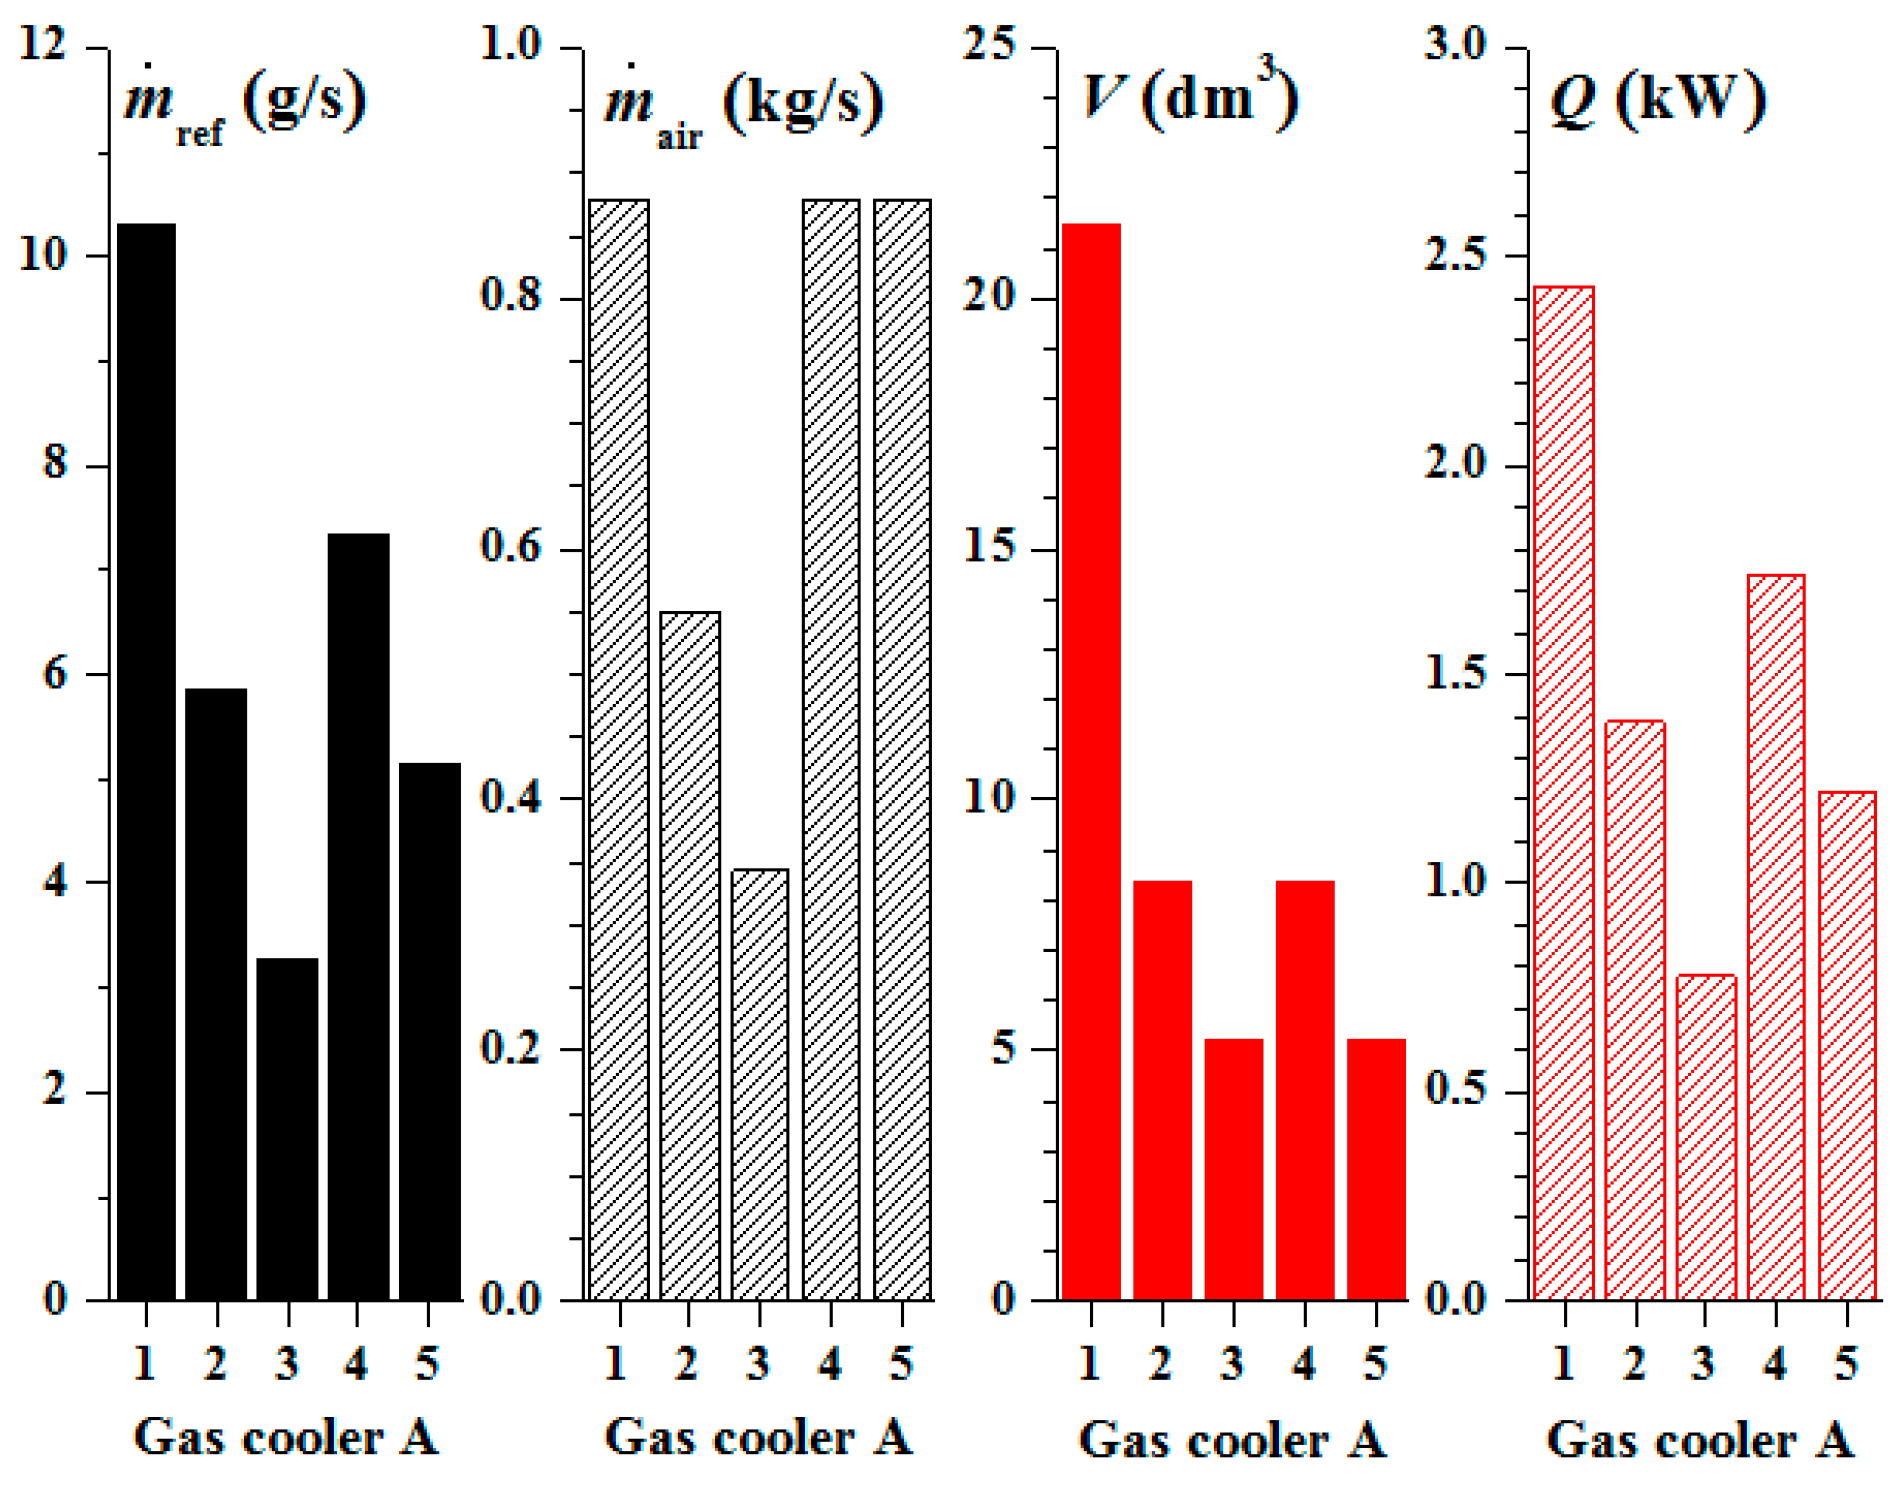
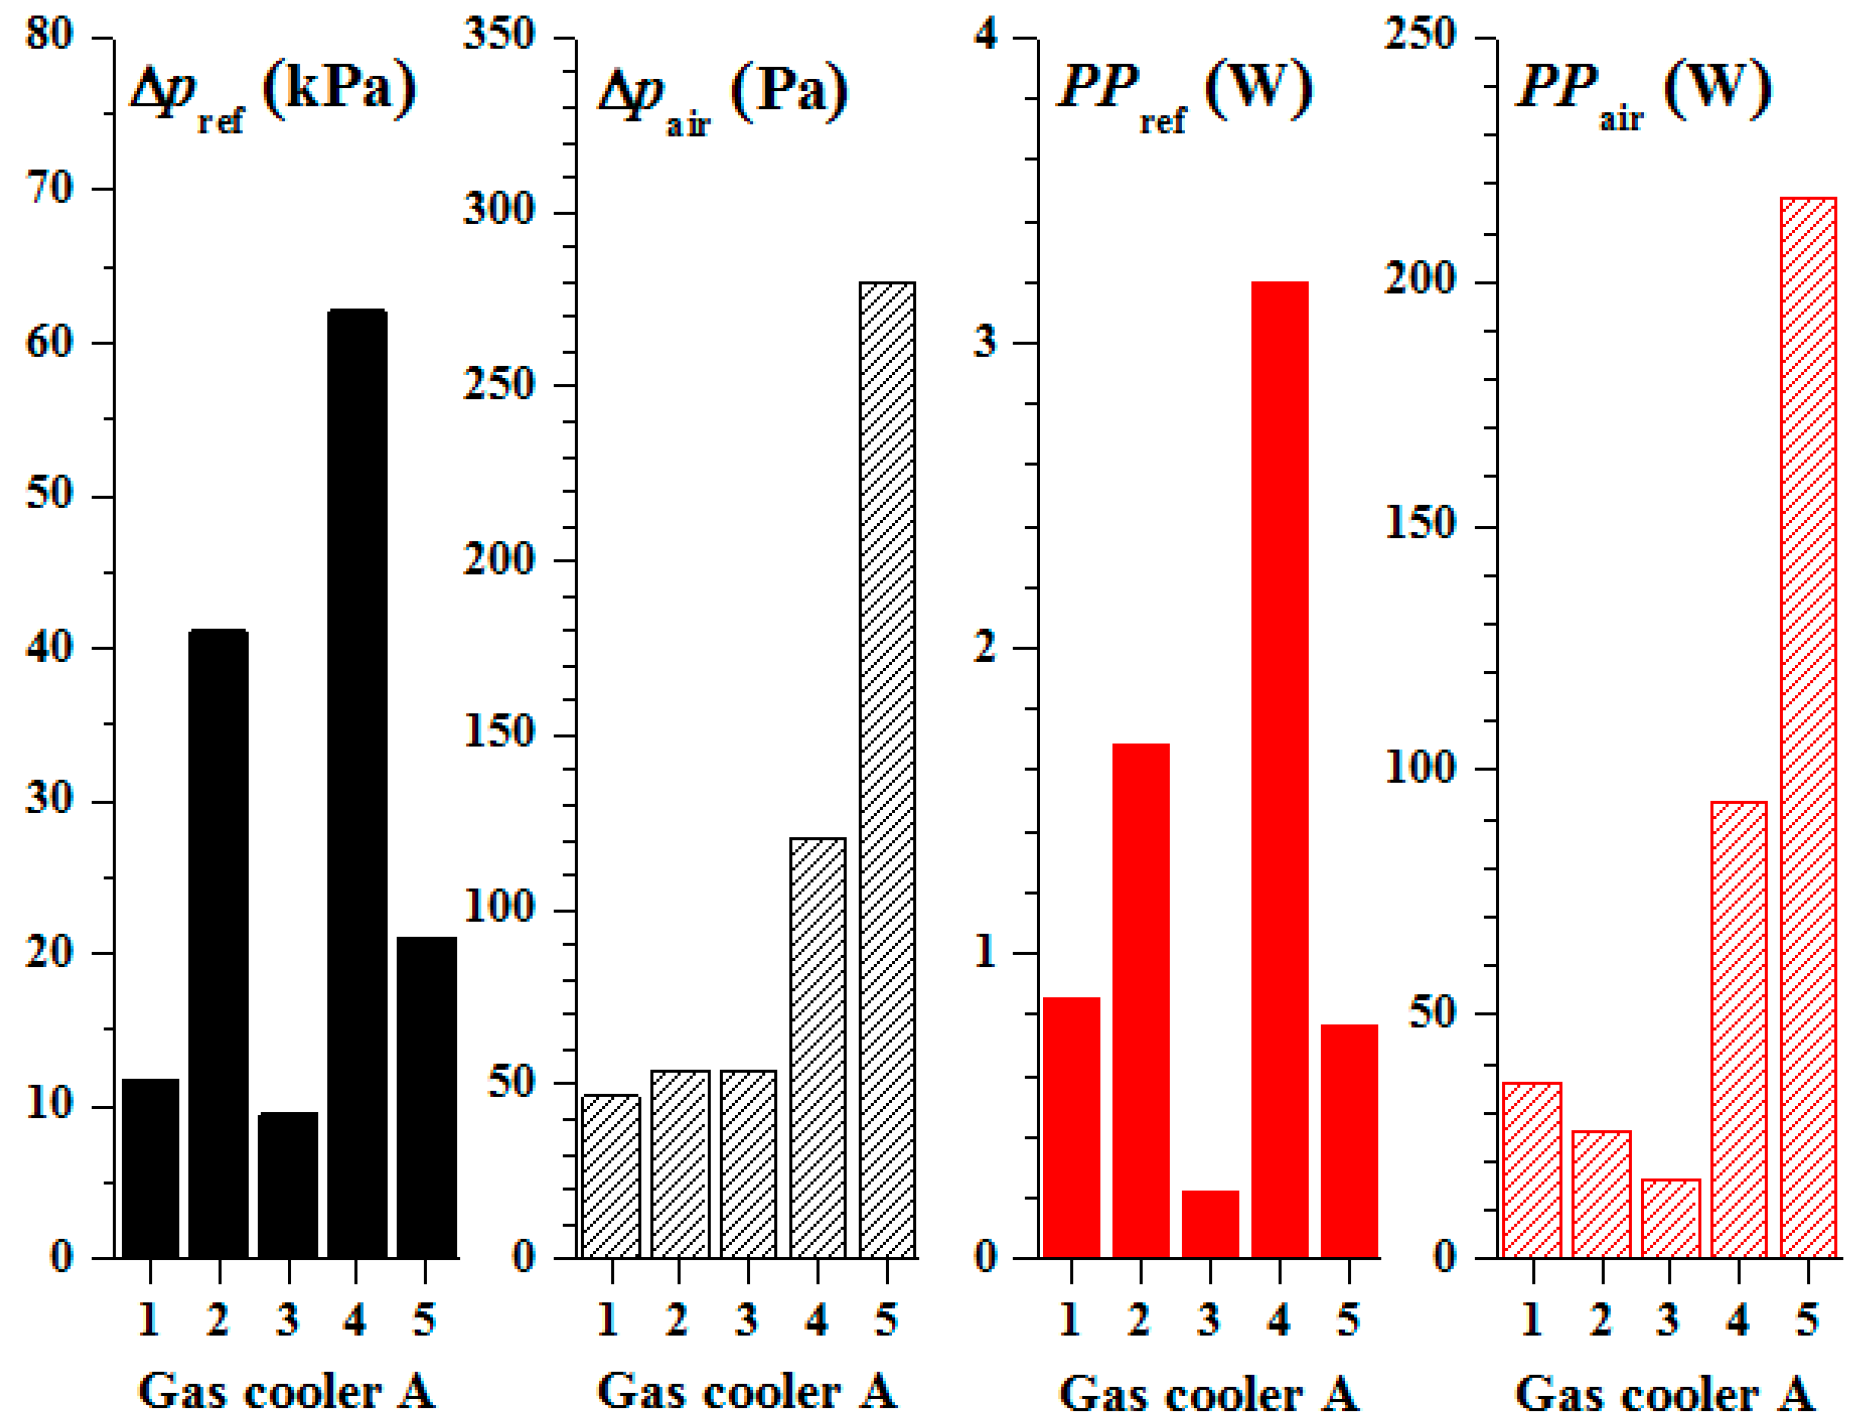
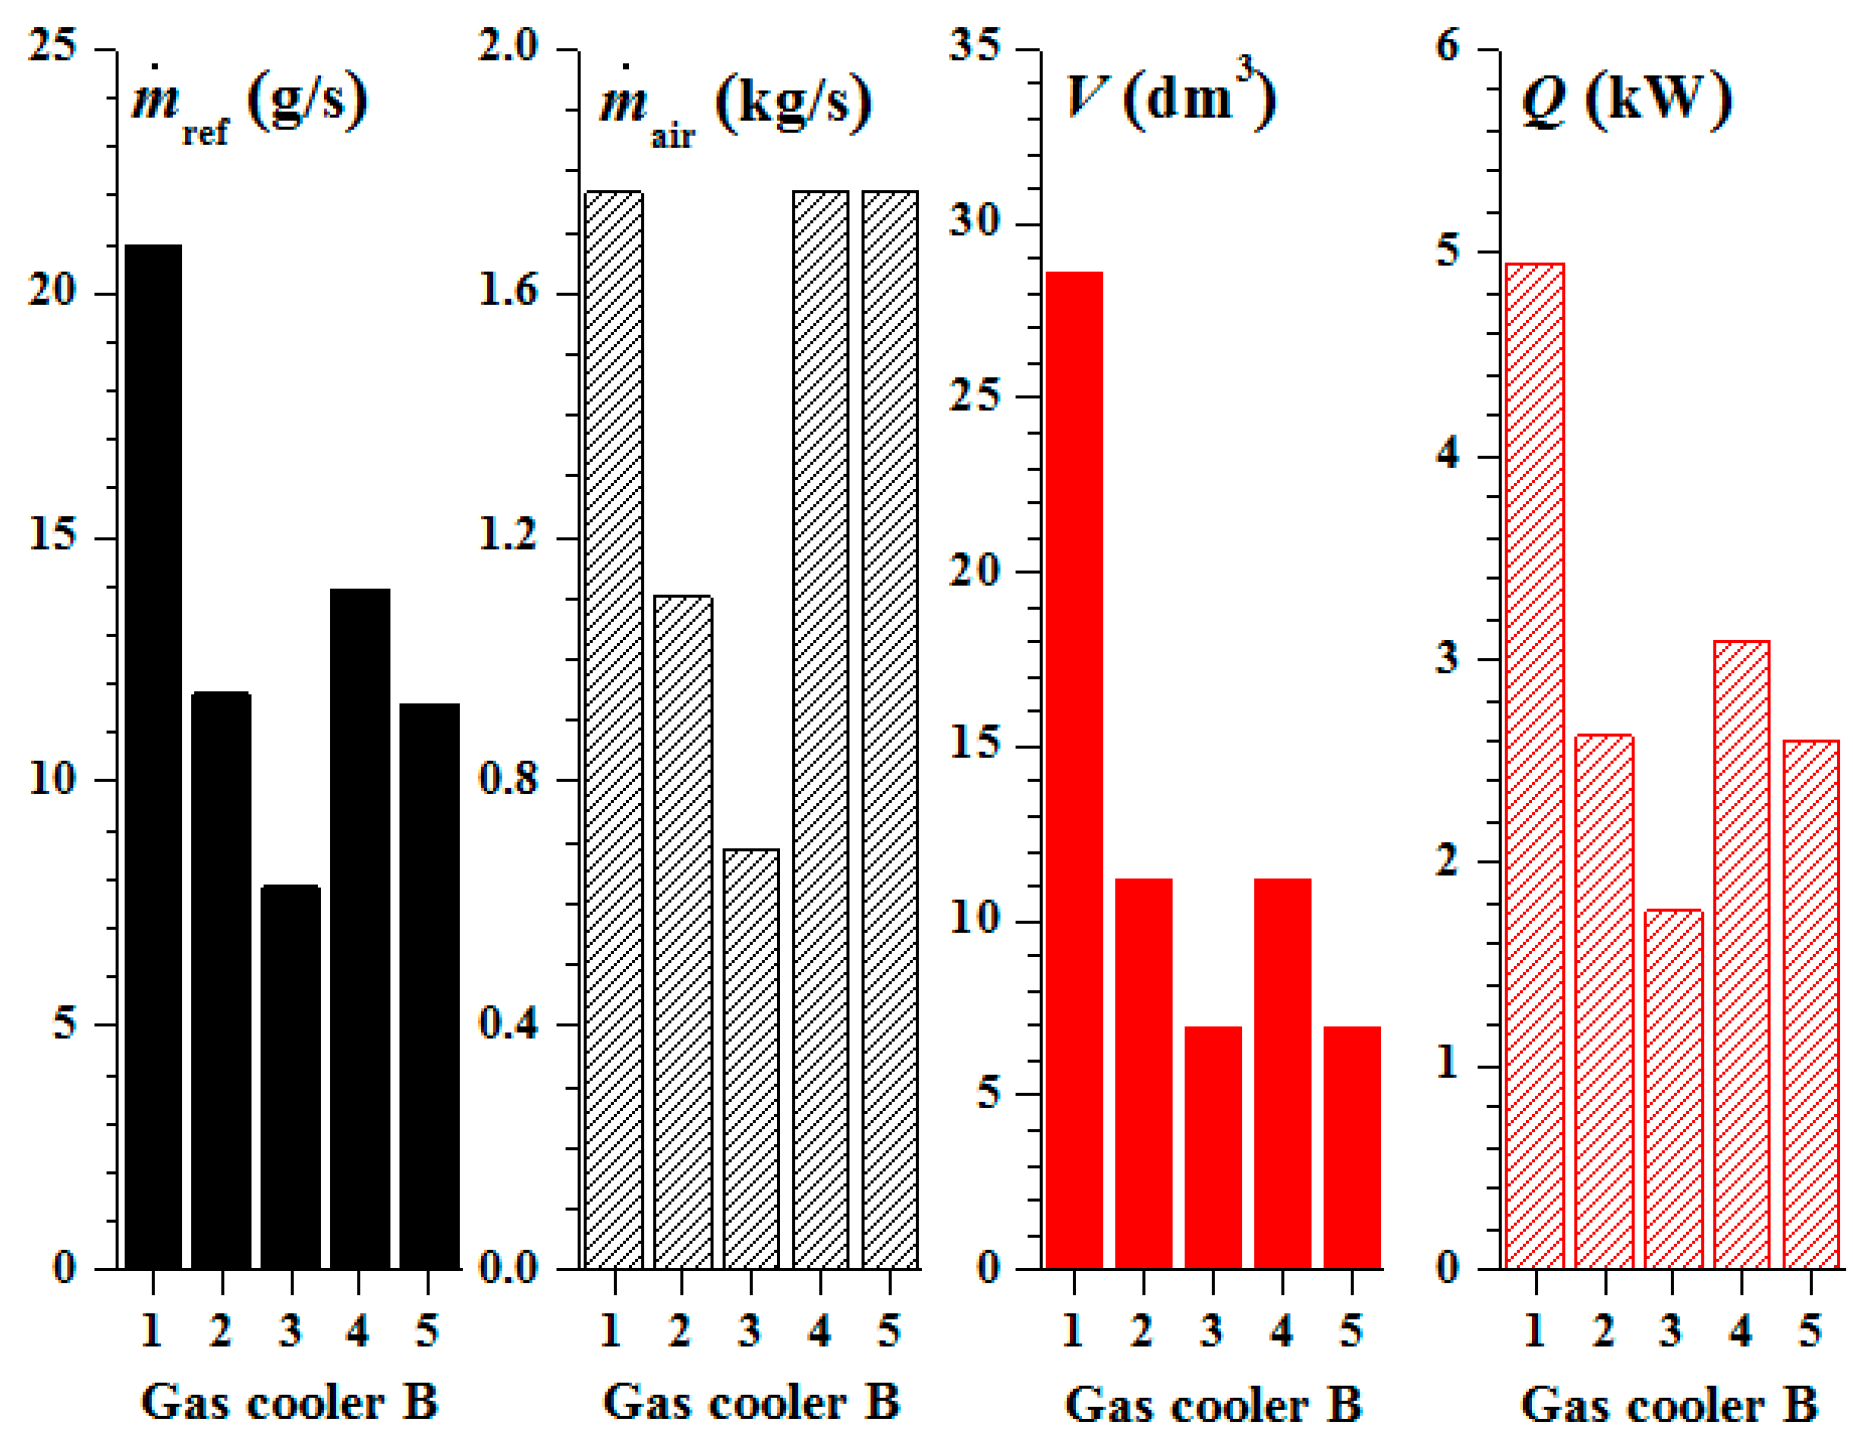
4.3. Comparison between 8 mm and 5 mm Coils Finned-Tube Gas Coolers
5. Conclusions
Author Contributions
Funding
Acknowledgments
Conflicts of Interest
Nomenclature
| A | area, m2 |
| cp | specific heat, J/(kgK) |
| C | heat capacity rate, W/K |
| D | hydraulic diameter, m; diameter, m |
| f | friction factor |
| Fs | fin spacing, m |
| G | mass flux, kg/(m2s) |
| h | heat-transfer coefficient, W/(m2 K); specific enthalpy, J·kg−1 |
| i | segment number |
| j | tube number |
| k | thermal conductivity, W/(mK); row number |
| L | length, m |
| m | exponent parameter |
| mass flow rate, kg/s | |
| N | total segment number |
| NTU | number of transfer units |
| Nu | Nusselt number |
| p | pressure, Pa |
| P | tube pitch |
| Pr | Prandtl number |
| Q | heat-transfer rate, W |
| r | radius, m |
| R | thermal resistance, K/W |
| Re | Reynolds number |
| ReDc | Reynolds number based on tube collar diameter |
| Sh | height of slit, m |
| Sn | spacing in normal direction, m; number of slit |
| Sp | spacing in parallel direction, m |
| Ss | breadth of a slit in airflow direction, m |
| T | temperature, K |
| U | overall heat-transfer coefficient, W/ (m2K) |
| Δp | pressure drop, Pa |
| x | refrigerant flow direction |
| XL | parameter |
| XM | parameter |
| Greek letters | |
| ρ | density, kg/m3 |
| μ | dynamic viscosity, Pa·s |
| ɛ | effectiveness |
| η | efficiency |
| δ | thickness, m |
| Subscripts | |
| a | air |
| cal | calculation |
| eq | equivalent |
| f | fin |
| i | segment number |
| in | inlet |
| l | longitudinal |
| max | maximum |
| min | minimum |
| mod | modelling |
| n | normal |
| p | parallel |
| ref | refrigerant |
| t | transverse |
| out | outlet |
| w | wall |
References
- Lorentzen, G. Trans-Critical Vapour Compression Cycle Device. International Patent Publication WO90/07683, 12 July 1990. [Google Scholar]
- Austin, B.T.; Sumathy, K. Transcritical carbon dioxide heat pump systems: A review. Renew. Sustain. Energy Rev. 2011, 15, 4013–4029. [Google Scholar] [CrossRef]
- Nekså, P. CO2 heat pump systems. Int. J. Refrig. 2002, 25, 421–427. [Google Scholar] [CrossRef]
- Kim, M.H.; Pettersen, J.; Bullard, C.W. Fundamental process and system design issues in CO2 vapor compression systems. Prog. Energy Combust. Sci. 2004, 30, 119–174. [Google Scholar] [CrossRef]
- Cavallini, A.; Cecchinato, L.; Corradi, M.; Fornasieri, E.; Zilio, C. Two-stage transcritical carbon dioxide cycle optimisation: A theoretical and experimental analysis. Int. J. Refrig. 2005, 28, 1274–1283. [Google Scholar] [CrossRef]
- Pettersen, J.; Hafner, A.; Skaugen, G.; Rekstad, H. Development of compact heat exchangers for CO2 air-conditioning systems. Int. J. Refrig. 1998, 21, 180–193. [Google Scholar] [CrossRef]
- Hwang, Y.; Jin, D.H.; Radermacher, R.; Hutchins, J.W. Performance measurement of CO2 heat exchangers. ASHRAE Trans. 2005, 111, 306–316. [Google Scholar]
- Zilio, C.; Cecchinato, L.; Corradi, M.; Schiochet, G. An assessment of heat transfer through fins in a fin-and-tube gas cooler for transcritical carbon dioxide cycles. HVAC R Res. 2007, 13, 457–469. [Google Scholar] [CrossRef]
- Ge, Y.T.; Tassou, S.A.; Santosa, I.D.; Tsamos, K. Design optimisation of CO2 gas cooler/condenser in a refrigeration system. Appl. Energy 2015, 160, 973–981. [Google Scholar] [CrossRef]
- Tsamos, K.M.; Ge, Y.T.; Santosa, I.; Tassou, S.A. Experimental investigation of gas cooler/condenser designs and effects on a CO2 booster system. Appl. Energy 2017, 186, 470–479. [Google Scholar] [CrossRef]
- Santosa, I.D.M.C.; Gowreesunker, B.L.; Tassou, S.A.; Tsamos, K.M.; Ge, Y. Investigations into air and refrigerant side heat transfer coefficients of finned-tube CO2 gas coolers. Inter. J. Heat Mass Transf. 2017, 107, 168–180. [Google Scholar] [CrossRef]
- Ge, Y.T.; Cropper, R.T. Simulation and performance evaluation of finned-tube CO2 gas coolers for refrigeration systems. Appl. Therm. Eng. 2009, 29, 957–965. [Google Scholar] [CrossRef]
- Singh, V.; Aute, V.; Radermacher, R. Investigation of effect of cut fins on carbon dioxide gas cooler performance. HVAC R Res. 2010, 16, 513–527. [Google Scholar] [CrossRef]
- Gupta, D.K.; Dasgupta, M.S. Simulation and performance optimization of finned tube gas cooler for trans-critical CO2 refrigeration system in Indian context. Int. J. Refrig. 2014, 38, 153–167. [Google Scholar] [CrossRef]
- Marcinichen, J.B.; Thome, J.R.; Pereira, R.H. Working fluid charge reduction. Part II: Supercritical CO2 gas cooler designed for light commercial appliances. Int. J. Refrig. 2016, 65, 273–286. [Google Scholar] [CrossRef]
- London, A.L.; Seban, R.A. A generalization of the methods of heat exchanger analysis. Int. J. Heat Mass Transf. 1980, 23, 5–16. [Google Scholar] [CrossRef]
- Krasnoshchekov, E.A.; Kuraeva, I.V.; Protopopov, V.S. Local heat transfer of carbon dioxide at supercritical pressure under cooling conditions. Teplofiz. Vysok. Temp. 1969, 7, 922–930. [Google Scholar]
- Fang, X.; Xu, Y. Modified heat transfer equation for in-tube supercritical CO2 cooling. Appl. Therm. Eng. 2011, 31, 3036–3042. [Google Scholar] [CrossRef]
- Jackson, J.D.; Hall, W.B. Influences of buoyancy on heat transfer to fluids flowing in vertical tubes under turbulent conditions. In Turbulent Forced Convection in Channels and Bundles, 1st ed.; Hemisphere: New York, NY, USA, 1979; Volume 2, pp. 613–640. [Google Scholar]
- Bourke, P.J.; Pulling, D.J.; Gill, L.E.; Denton, W.H. Forced convective heat transfer to turbulent CO2 in the supercritical region. Int. J. Heat Mass Transf. 1970, 13, 1339–1348. [Google Scholar] [CrossRef]
- Liao, S.M.; Zhao, T.S. An experimental investigation of convection heat transfer to supercritical carbon dioxide in miniature tubes. Int. J. Heat Mass Transf. 2002, 45, 5025–5034. [Google Scholar] [CrossRef]
- Pidaparti, S.R.; McFarland, J.A.; Mikhaeil, M.M.; Anderson, M.H.; Ranjan, D. Investigation of buoyancy effects on heat transfer characteristics of supercritical carbon dioxide in heating mode. J. Nucl. Eng. Radiat. Sci. 2015, 1, 031001. [Google Scholar] [CrossRef]
- Jiang, P.X.; Xu, Y.J.; Lv, J.; Shi, R.-F.; He, S.; Jackson, J.D. Experimental investigation of convection heat transfer of CO2 at super-critical pressures in vertical mini-tubes and in porous media. Appl. Therm. Eng. 2004, 24, 1255–1270. [Google Scholar] [CrossRef]
- Jiang, P.X.; Shi, R.F.; Xu, Y.J.; He, S.; Jackson, J.D. Experimental investigation of flow resistance and convection heat transfer of CO2 at supercritical pressures in a vertical porous tube. J. Supercrit. Fluids 2006, 38, 339–346. [Google Scholar] [CrossRef]
- Jiang, P.X.; Shi, R.F.; Zhao, C.R.; Xu, Y.J. Experimental and numerical study of convection heat transfer of CO2 at supercritical pressures in vertical porous tubes. Int. J. Heat Mass Transf. 2008, 51, 6283–6293. [Google Scholar] [CrossRef]
- Wang, C.C.; Lee, W.S.; Sheu, W.J. A comparative study of compact enhanced fin-and-tube heat exchangers. Int. J. Heat Mass Transf. 2001, 44, 3565–3573. [Google Scholar] [CrossRef]
- Schmidt, T.E. Heat transfer calculations for extended surfaces. Refrig. Eng. 1949, 57, 351–357. [Google Scholar]
- Liao, S.M.; Zhao, T.S. Measurements of heat transfer coefficients from supercritical carbon dioxide flowing in horizontal mini/micro channels. Trans. Am. Soc. Mech. Eng. J. Heat Transf. 2002, 124, 413–420. [Google Scholar] [CrossRef]
- Dang, C.; Iino, K.; Fukuoka, K.; Hihara, E. Effect of lubricating oil on cooling heat transfer of supercritical carbon dioxide. Int. J. Refrig. 2007, 30, 724–731. [Google Scholar] [CrossRef]
- Cheng, L.; Ribatski, G.; Thome, J.R. Analysis of supercritical CO2 cooling in macro-and micro-channels. Int. J. Refrig. 2008, 31, 1301–1316. [Google Scholar] [CrossRef]
- Oh, H.K.; Son, C.H. New correlation to predict the heat transfer coefficient in-tube cooling of supercritical CO2 in horizontal macro-tubes. Exp. Therm. Fluid Sci. 2010, 34, 1230–1241. [Google Scholar] [CrossRef]


| Operating Conditions | ||||||||
|---|---|---|---|---|---|---|---|---|
| Test | vair, in (m/s) | Tair, in (°C) | pref, in (bar) | Tref, in (°C) | (g/s) | ReDc, air, in | Reref, in | |
| Gas Cooler A | ||||||||
| No. 1 | 1.7 | 32.8 | 85.1 | 105.5 | 10.5 | 1373 | 96,764 | |
| No. 2 | 2.0 | 32.8 | 84.2 | 99.2 | 10 | 1615 | 92,595 | |
| No. 3 | 2.4 | 34.3 | 86.6 | 116.8 | 10.3 | 1921 | 93,345 | |
| Gas Cooler B | ||||||||
| No. 4 | 1.7 | 35.1 | 86.3 | 100.8 | 19 | 1355 | 17,468 | |
| No. 5 | 2.0 | 35.2 | 86.5 | 104.6 | 21.5 | 1593 | 19,678 | |
| No. 6 | 2.4 | 33.0 | 83.9 | 101.3 | 21 | 1936 | 19,375 | |
| Results | ||||||||
| Test | Δpair, exp (Pa) | Δpair, mod (Pa) | Tref, out, exp (°C) | Tref, out, mod (°C) | Tair, out, exp (°C) | Tair, out, mod (°C) | Qexp (kW) | Qmod (kW) |
| Gas Cooler A | ||||||||
| No. 1 | 26.6 | 26.9 | 33.2 | 32.83 | 36.9 | 36.8 | 2.4 | 2.46 |
| No. 2 | 34.2 | 34.8 | 32.8 | 32.82 | 35.9 | 36.0 | 2.23 | 2.31 |
| No. 3 | 41.4 | 46.6 | 34.9 | 34.31 | 37.2 | 37.1 | 2.4 | 2.43 |
| Gas Cooler B | ||||||||
| No. 4 | 13.9 | 17.6 | 35.3 | 35.38 | 38.7 | 38.5 | 4.1 | 4.12 |
| No. 5 | 25.6 | 22.7 | 35.0 | 35.54 | 38.5 | 38.5 | 4.6 | 4.75 |
| No. 6 | 27.6 | 30.4 | 33.0 | 33.15 | 35.9 | 35.9 | 4.65 | 4.94 |
| Type | No | Dimension | Operating Condition |
|---|---|---|---|
| Gas cooler A | 1 | Do = 8 mm, Din = 6.64 mm, Sj = 25.4 mm, Sk = 22 mm, L = 1.6 m, 12 fins per inch | vair, in = 2.4 m/s (air, in = 0.8794 kg/s) |
| 2 | Do = 5 mm, Din = 4.5 mm, Sj = 15.875 mm, Sk = 13.75 mm, L = 1.6 m, 12 fins per inch | vair, in = 2.4 m/s | |
| 3 | Do = 5 mm, Din = 4.5 mm, Sj = 15.875 mm, Sk = 13.75 mm, L = 1.0 m, 12 fins per inch | vair, in = 2.4 m/s | |
| 4 | Same as gas cooler A 2 | air, in = 0.8794 kg/s | |
| 5 | Same as gas cooler A 3 | air, in = 0.8794 kg/s | |
| Gas cooler B | 1 | Do = 8 mm, Din = 6.64 mm, Sj = 25.4 mm, Sk = 22 mm, L = 1.6 m, 12 fins per inch | vair, in = 2.4 m/s (air, in = 1.7662 kg/s) |
| 2 | Do = 5 mm, Din = 4.5 mm, Sj = 15.875 mm, Sk = 13.75 mm, L = 1.6 m, 12 fins per inch | vair, in = 2.4 m/s | |
| 3 | Do = 5 mm, Din = 4.5 mm, Sj = 15.875 mm, Sk = 13.75 mm, L = 1.0 m, 12 fins per inch | vair, in = 2.4 m/s | |
| 4 | Same as gas cooler B 2 | air, in = 1.7662 kg/s | |
| 5 | Same as gas cooler B 3 | air, in = 1.7662 kg/s |
© 2020 by the authors. Licensee MDPI, Basel, Switzerland. This article is an open access article distributed under the terms and conditions of the Creative Commons Attribution (CC BY) license (http://creativecommons.org/licenses/by/4.0/).
Share and Cite
Chai, L.; Tsamos, K.M.; Tassou, S.A. Modelling and Evaluation of the Thermohydraulic Performance of Finned-Tube Supercritical Carbon Dioxide Gas Coolers. Energies 2020, 13, 1031. https://doi.org/10.3390/en13051031
Chai L, Tsamos KM, Tassou SA. Modelling and Evaluation of the Thermohydraulic Performance of Finned-Tube Supercritical Carbon Dioxide Gas Coolers. Energies. 2020; 13(5):1031. https://doi.org/10.3390/en13051031
Chicago/Turabian StyleChai, Lei, Konstantinos M. Tsamos, and Savvas A. Tassou. 2020. "Modelling and Evaluation of the Thermohydraulic Performance of Finned-Tube Supercritical Carbon Dioxide Gas Coolers" Energies 13, no. 5: 1031. https://doi.org/10.3390/en13051031
APA StyleChai, L., Tsamos, K. M., & Tassou, S. A. (2020). Modelling and Evaluation of the Thermohydraulic Performance of Finned-Tube Supercritical Carbon Dioxide Gas Coolers. Energies, 13(5), 1031. https://doi.org/10.3390/en13051031