Simplified Layer Model for Solid Particle Clusters in Product Oil Pipelines

Abstract
1. Introduction
- (1)
- The height of the particle cluster is the same along the axis, and the force of each part is uniform.
- (2)
- The interstitial fluid can be ignored in describing the flow behavior and only the upper and lower surface contact with the oil [22]. In addition, the volume of the particle cluster remains unchanged.
- (3)
- In the deformation process of the particle cluster, the adjustment coefficient is a constant.
- (4)
- The effect of room temperature and usage time on diesel viscosity during the test is ignored.
2. Model
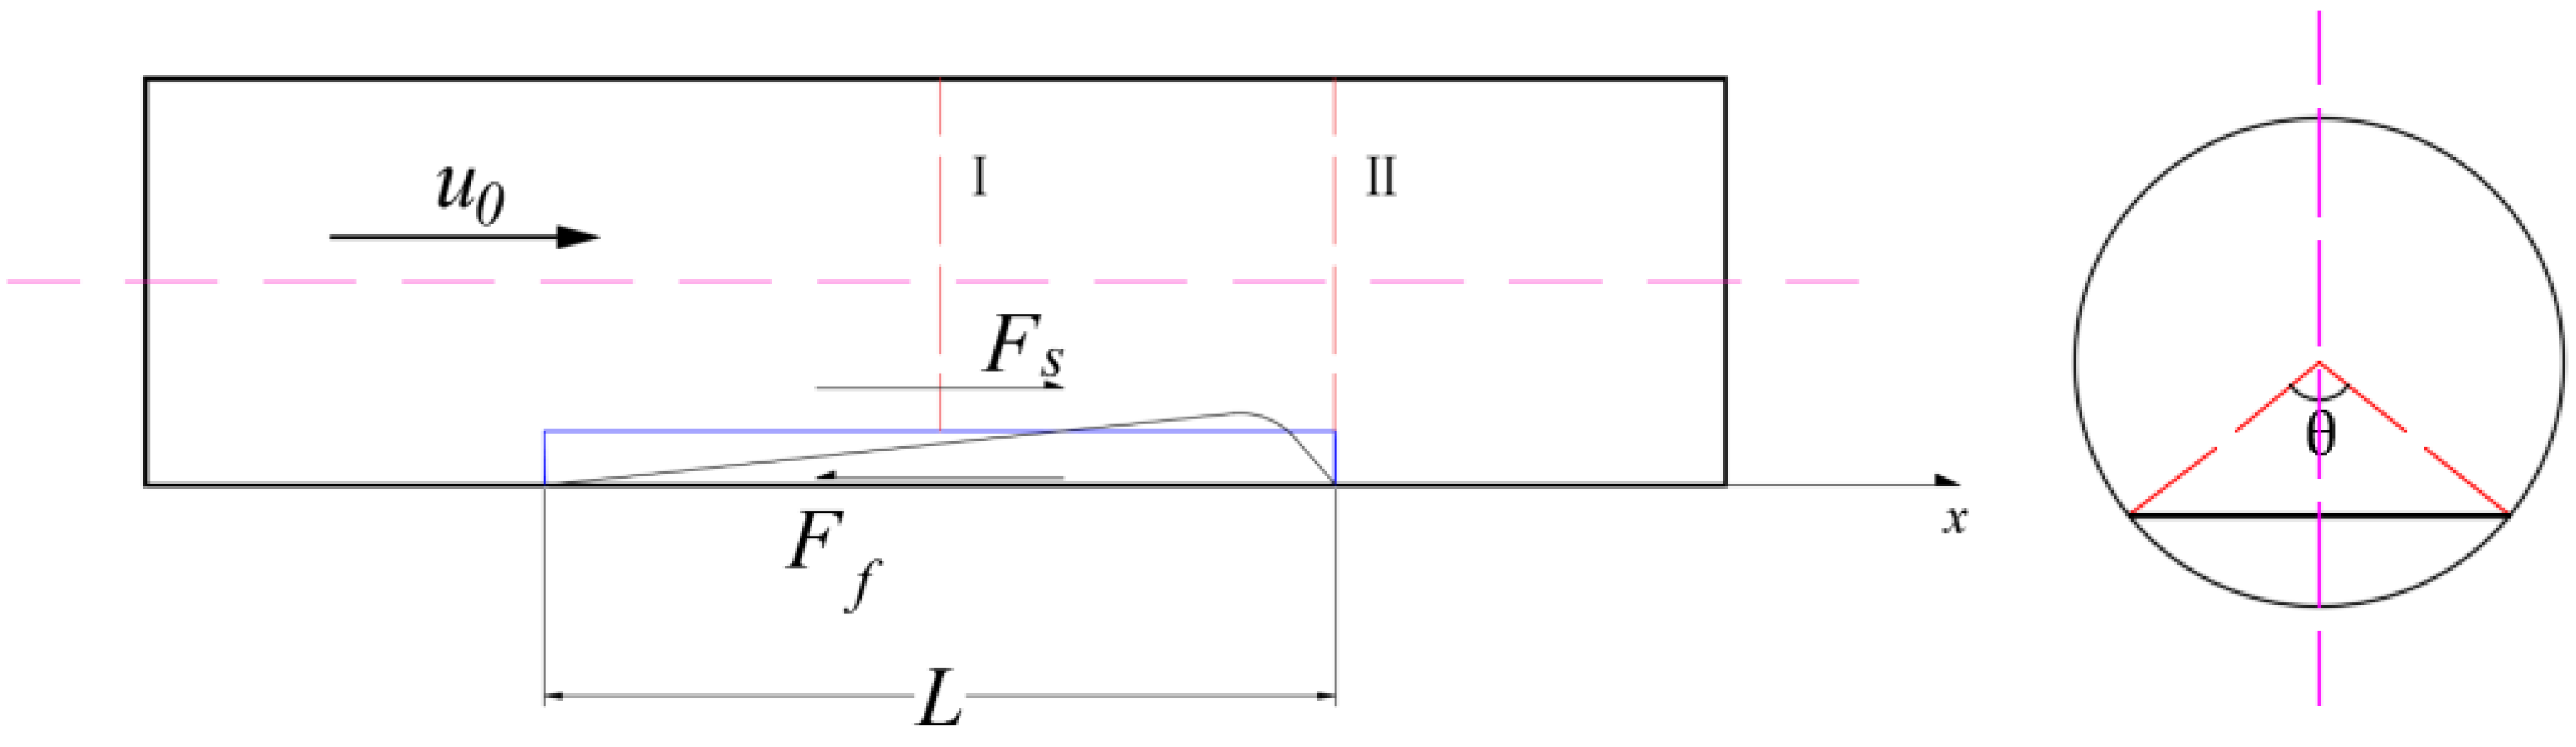
2.1. Shear Force
2.2. Resistance
2.2.1. Friction
2.2.2. Viscous Resistance
2.2.3. Component of Gravity
2.3. Internal Force
2.3.1. Expression of Internal Force
2.3.2. Calculation of Le
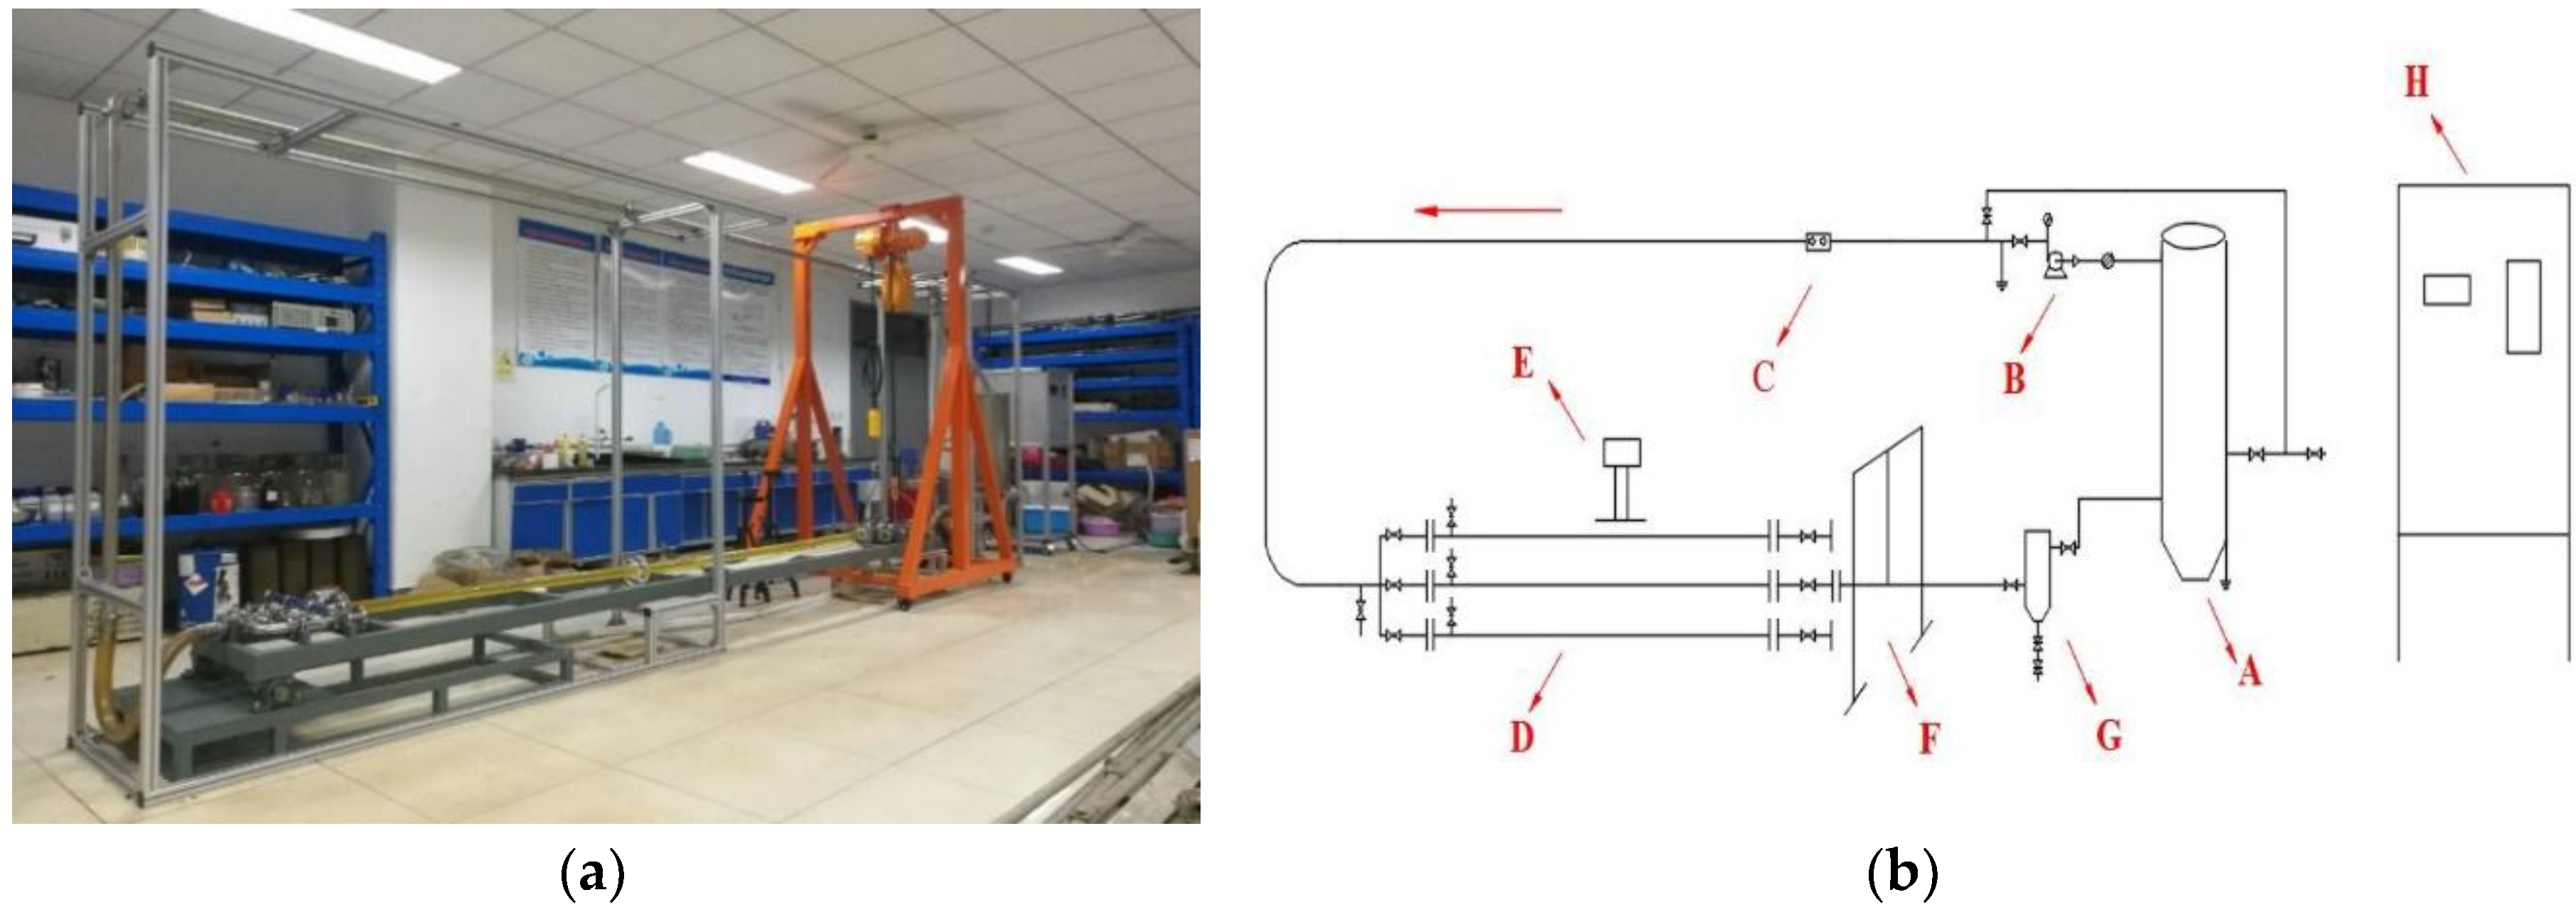
3. Experiments
3.1. Test Plan
3.1.1. Selection of Quartz Sand Particles
3.1.2. Viscosity Measurement of Oil
3.1.3. Test Procedure
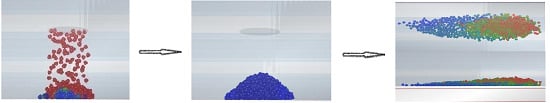
3.2. Test Phenomena
3.3. Data Processing
4. Model Application and Verification
4.1. Model Application
4.2. Verification of Critical Flow Velocity
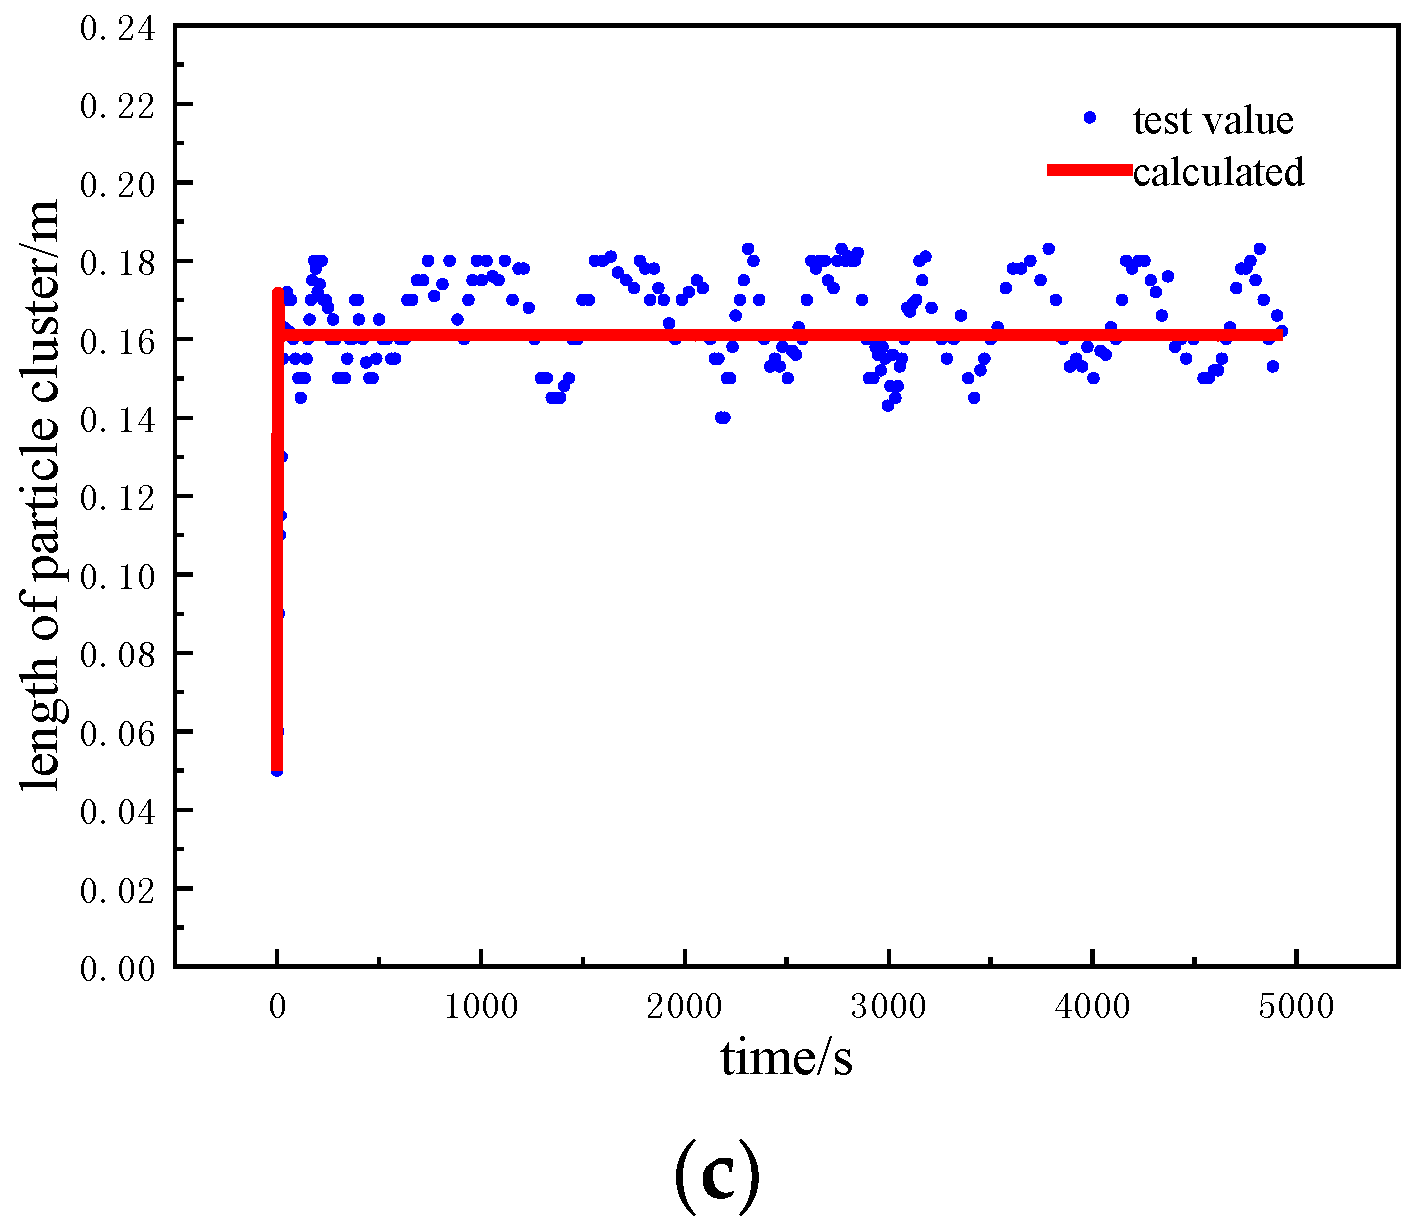
4.3. Verification of Stable Migration Velocity
5. Conclusions
- (1)
- The particles were analyzed as a whole. The particle cluster is mainly subjected to the shear force and the viscous resistance exerted by the oil flow, the friction exerted by the pipe wall, and its own internal force mainly affecting the particle cluster length.
- (2)
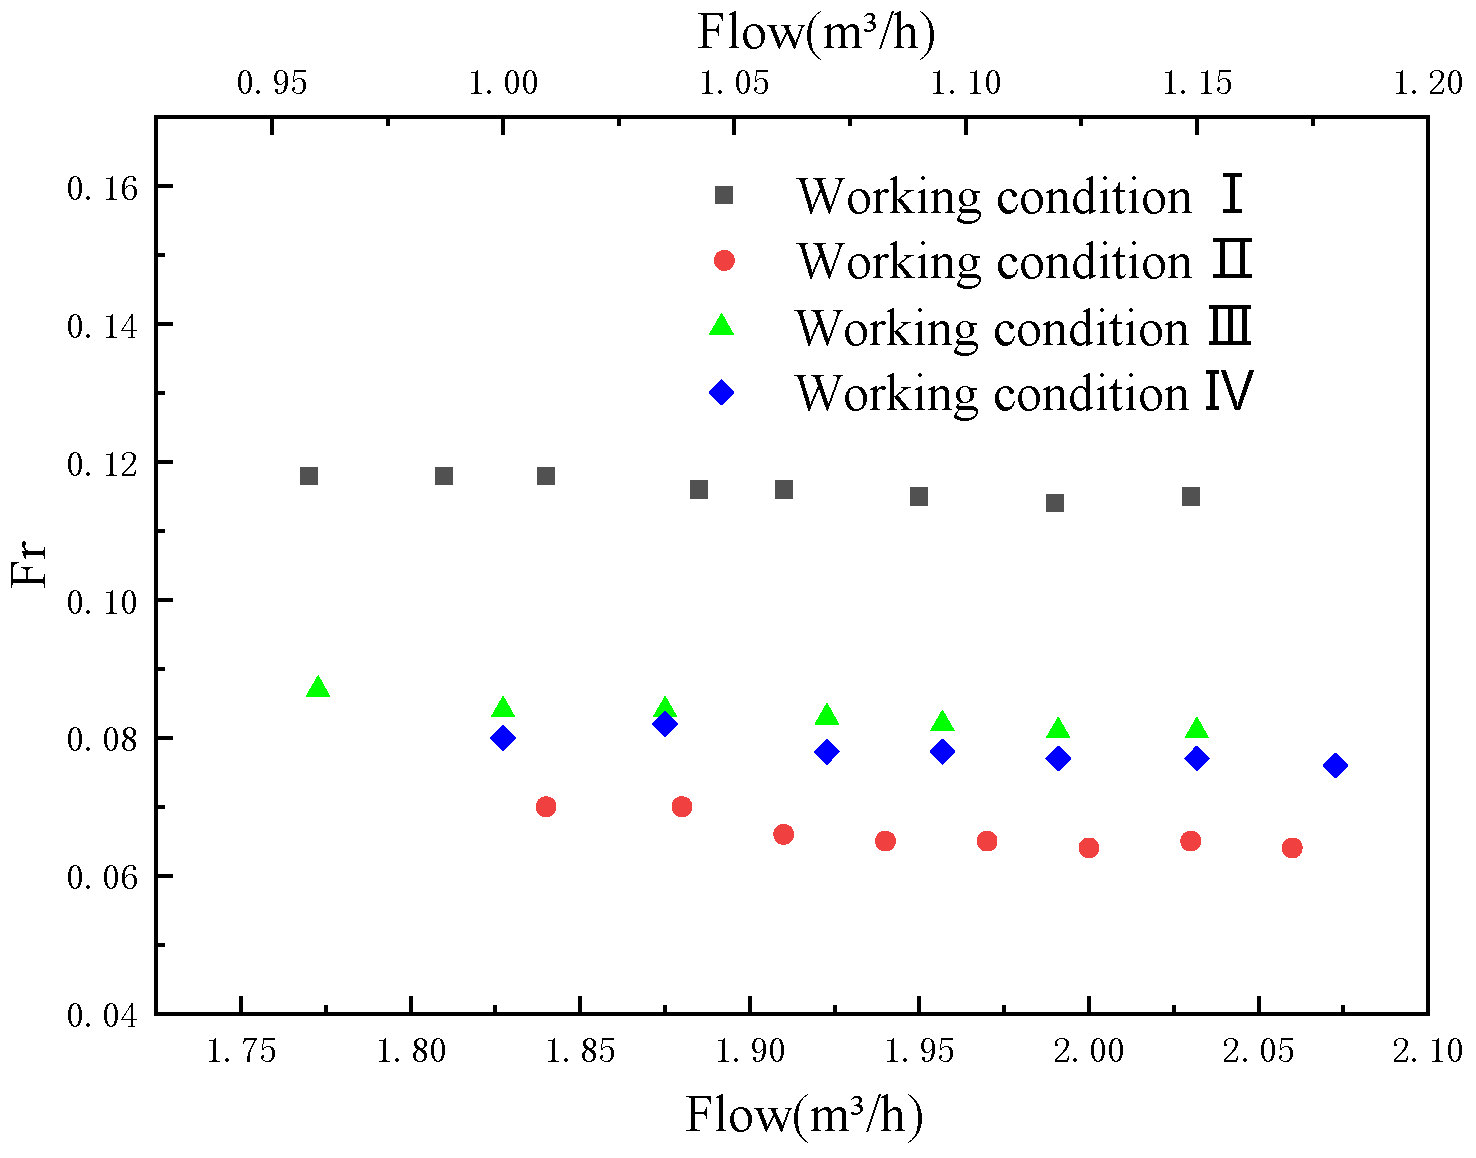
- In the product oil pipeline, an equilibrium state exists during the migration of the solid particle cluster. After reaching the equilibrium state, the migration of the particle cluster tends to be stable, the velocity and length no longer change significantly, and the Froude number is considered the same at different flow rates.
- (3)
- The two-layer model based on the force balance principle can better describe the transformation process from the non-equilibrium state to the equilibrium state, and can accurately predict the critical flow velocity and stable migration velocity of the particle cluster.
- (4)
- At the same flow rate, the larger the mass of the particle cluster or the inclination of the pipe is, the lower the migration velocity.
Author Contributions
Funding
Conflicts of Interest
References
- Li, S. Damage of solid impurities to long-distance oil pipeline equipment and preventive measures. Chem. Equip. Pip. 2008. doi:SUN:HGSB.0.2008-02-014 (In Chinese) [Google Scholar]
- Che, W.Q. Hazard analysis and countermeasure research on impurity operation of oil pipeline. Petrochem. Ind. Technol. 2015. doi:SUN:SHJS.0.2015-11-128 (In Chinese) [Google Scholar]
- Haider, G.; Arabnejad, H.; Shirazi, S.A. A mechanistic model for stochastic rebound of solid particles with application to erosion predictions. Wear 2017, 376–377, 615–624. [Google Scholar] [CrossRef]
- Sajeev, S.; McLaury, B.S.; Shirazi, S.A. Threshold particle concentration in single-phase and multiphase flow sand transport in pipelines. In Proceedings of the 11th North American Conference on Multiphase Production Technology, Banff, AB, Canada, 6–8 June 2018. [Google Scholar]
- Xu, G.L.; Zhang, G.Z.; Liu, G. Trapped water displacement from low sections of oil pipelines. Int. J. Multiph. Flow 2011, 37, 1–11. [Google Scholar] [CrossRef]
- Ibarra, R.J. Critical sand deposition velocity in horizontal stratified flow at low concentrations. Master’s Thesis, The University of Tulsa, Tulsa, OK, USA, 2012. [Google Scholar]
- Dabirian, R.; Mohan, R.S.; Shoham, O. Solid-particles flow regimes in air/water stratified flow in a horizontal pipeline. Oil Gas. Facil. 2016. [Google Scholar] [CrossRef]
- Najmi, K. Particle transport in single-phase and multiphase horizontal pipes with emphasis on the effect of viscosity. Ph.D. Thesis, The University of Tulsa, Tulsa, OK, USA, 2015. [Google Scholar]
- Dabirian, R.; Mohan, R.; Shoham, O. Critical sand deposition velocity for gas-liquid stratified flow in horizontal pipes. J. Nat. Gas. Sci. Eng. 2016, 33, 527–537. [Google Scholar] [CrossRef]
- Dabirian, R.; Mohan, R.S.; Shoham, O. Sand transport in stratified flow in a horizontal pipeline. In SPE Annual Technical Conference and Exhibition; Society of Petroleum Engineers: Houston, TX, USA, 2015. [Google Scholar]
- Leporini, M.; Marchetti, B.; Corvaro, F. Sand transport in multiphase flow mixtures in a horizontal pipeline: An experimental investigation. Petroleum 2019, 5, 161–170. [Google Scholar] [CrossRef]
- Archibong-Eso, A.; Aliyu, A.M.; Yan, W.; Okeke, N.E.; Baba, Y.D.; Fajemidupe, O.; Yeung, H. Experimental Study on Sand Transport Characteristics in Horizontal and Inclined Two-Phase Solid-Liquid Pipe Flow. J. Pipeline Syst. Eng. Pract. 2019, 11, 04019050. [Google Scholar] [CrossRef]
- Leporini, M.; Terenzi, A.; Marchetti, B.; Corvaro, F.; Polonara, F. On the numerical simulation of sand transport in liquid and multiphase pipelines. J. Pet. Sci. Eng. 2019, 175, 519–535. [Google Scholar] [CrossRef]
- Yang, Y.; Peng, H.; Wen, C. Sand Transport and Deposition Behaviour in Subsea Pipelines for Flow Assurance. Energies 2019, 12, 4070. [Google Scholar] [CrossRef]
- Doron, P.; Barnea, D. A three-layer model for solid-liquid flow in horizontal pipes. Int. J. Multiph. Flow 1993, 19, 1029–1043. [Google Scholar] [CrossRef]
- Gorji, M.; Ghorbani, N. The influences of velocity on pressure losses in hydrate slurry. Int. J. Numer. Methods Heat Fluid Flow 2008, 18, 5–13. [Google Scholar] [CrossRef]
- Matoušek, V.; Krupička, J. Unified model for coarse-slurry flow with stationary and sliding bed. In Proceedings of the 15th International Conference on Transport and Sedimentation of Solid Particles, Wroclaw, Poland, 6–9 September 2011; pp. 181–189. [Google Scholar]
- Matoušek, V.; Krupička, J. Interfacial friction and transport in stratified flows. Proc. Inst. Civ. Eng. Marit. Eng. 2014, 167, 125–134. [Google Scholar] [CrossRef]
- Rojas, M.R.; Sáez, A.E. Two-Layer Model for Horizontal Pipe Flow of Newtonian and Non-Newtonian Settling Dense Slurries. Ind. Eng. Chem. Res. 2012, 51, 7095–7103. [Google Scholar] [CrossRef]
- Matoušek, V.; Krupička, J.; Kesely, M. A layered model for inclined pipe flow of settling slurry. Powder Technol. 2018, 2018, S0032591018302948. [Google Scholar] [CrossRef]
- Dabirian, R.; Padsalgikar, A.; Mohan, R.S. Four-layer model for prediction of sand bed height in horizontal gas-liquid stratified flow. J. Pet. Sci. Eng. 2018, 165, 151–160. [Google Scholar] [CrossRef]
- Campbell, C.S. Rapid Granular Flows. Annu. Rev. Fluid Mech. 1990, 22, 57–90. [Google Scholar] [CrossRef]
- Forterre, Y.; Pouliquen, O. Flows of Dense Granular Media. Annu. Rev. Fluid Mech. 2008, 40, 1–24. [Google Scholar] [CrossRef]
- Xu, D.Z.; Zhang, G.Z.; Zhang, X. The Impact of Surface Tension on the Oil-Water Stratified Flow. Adv. Mat. Res. Tran Tec Publ. 2012, 383, 826–829. [Google Scholar] [CrossRef]
- Wu, B.S. Delayed response model for fluvial processes of alluvial rivers - I model development. J. Sediment Res. 2008, 6, 3–9. [Google Scholar]


| Diesel Model | Density (kg/m3) | Dynamic Viscosity (mPa·s) |
|---|---|---|
| 0# | 850 | 3.2 |
| Working Condition | Particles Mass (g) | Pipe Diameter (mm) | Pipe Inclination Angle (°) |
|---|---|---|---|
| I | 20 | 40 | 0 |
| II | 40 | 40 | 0 |
| III | 10 | 30 | 0 |
| IV | 10 | 30 | 10 |
| Working Condition I | ||||||||
|---|---|---|---|---|---|---|---|---|
| Flow/(m³/h) | 1.770 | 1.810 | 1.840 | 1.885 | 1.910 | 1.950 | 1.990 | 2.030 |
| Velocity/(×10−4 m/s) | 1.51 | 2.46 | 2.85 | 4.24 | 4.95 | 5.84 | 7.21 | 8.41 |
| Length/(m) | 0.148 | 0.154 | 0.159 | 0.168 | 0.172 | 0.180 | 0.189 | 0.196 |
| Working Condition II | ||||||||
| Flow/(m³/h) | 1.840 | 1.880 | 1.910 | 1.940 | 1.970 | 2.000 | 2.030 | 2.060 |
| Velocity/(×10−4 m/s) | 1.64 | 2.90 | 3.44 | 4.04 | 5.50 | 6.47 | 7.00 | 7.92 |
| Length/(m) | 0.272 | 0.284 | 0.304 | 0.318 | 0.329 | 0.341 | 0.345 | 0.359 |
| Working Condition III | ||||||||
| Flow/(m³/h) | 0.960 | 1.000 | 1.035 | 1.070 | 1.095 | 1.120 | 1.150 | |
| Velocity/(×10−4 m/s) | 0.44 | 1.36 | 3.06 | 5.20 | 7.12 | 8.00 | 10.91 | |
| Length/(m) | 0.181 | 0.201 | 0.216 | 0.232 | 0.245 | 0.259 | 0.271 | |
| Working Condition IV | ||||||||
| Flow/(m³/h) | 1.000 | 1.035 | 1.070 | 1.095 | 1.120 | 1.150 | 1.180 | |
| Velocity/(×10−4 m/s) | 1.01 | 2.79 | 4.61 | 6.56 | 7.41 | 9.93 | 11.77 | |
| Length/(m) | 0.211 | 0.220 | 0.245 | 0.255 | 0.270 | 0.283 | 0.301 | |
| Working Condition | I | II | III | IV |
|---|---|---|---|---|
| Test Value/(m/s) | 0.385 | 0.393 | 0.369 | 0.377 |
| Calculated /(m/s) | 0.376 | 0.387 | 0.377 | 0.381 |
| Absolute Error /(m/s) | 0.009 | 0.006 | -0.008 | -0.004 |
© 2019 by the authors. Licensee MDPI, Basel, Switzerland. This article is an open access article distributed under the terms and conditions of the Creative Commons Attribution (CC BY) license (http://creativecommons.org/licenses/by/4.0/).
Share and Cite
Li, D.; Chen, L.; Miao, Q.; Liu, G.; Ren, S.; Wang, Z. Simplified Layer Model for Solid Particle Clusters in Product Oil Pipelines. Energies 2019, 12, 4809. https://doi.org/10.3390/en12244809
Li D, Chen L, Miao Q, Liu G, Ren S, Wang Z. Simplified Layer Model for Solid Particle Clusters in Product Oil Pipelines. Energies. 2019; 12(24):4809. https://doi.org/10.3390/en12244809
Chicago/Turabian StyleLi, Dongze, Lei Chen, Qing Miao, Gang Liu, Shuyi Ren, and Zhiquan Wang. 2019. "Simplified Layer Model for Solid Particle Clusters in Product Oil Pipelines" Energies 12, no. 24: 4809. https://doi.org/10.3390/en12244809
APA StyleLi, D., Chen, L., Miao, Q., Liu, G., Ren, S., & Wang, Z. (2019). Simplified Layer Model for Solid Particle Clusters in Product Oil Pipelines. Energies, 12(24), 4809. https://doi.org/10.3390/en12244809