1. Introduction
Natural gas hydrates (NGHs) are ice-like compounds formed by water molecules and gas molecules under low temperature or/and high pressure. Water molecules form cavities with different morphology and dimension by hydrogen bonding and gas molecules fill the cavities by van de Walls force [
1]. Gas hydrates in sea floor or permafrost usually exist in three structures such as structure I (sI), structure II (sII) and structure H (sH). According to literature reports, most NGH deposits are sI gas hydrates [
2,
3] which are composed of six 5
126
2 cages and two 5
12 cages [
1]. The NGHs, attracting much attention for their abundant reserves in the seabed and permafrost regions, have the potential to be an alternative energy resource in the future because it is estimated that the total amount of carbon resources contained in the NGHs is about twice as much as that in the proven fossil fuel reserves [
4,
5,
6,
7,
8,
9]. To date, many studies have been carried out to exploit CH
4 from NGHs deposits and several field trails have been conducted in last 40 years. The exploitation methods mainly include thermal stimulation, depressurization and chemical inhibitor injection, but the disadvantages such as enormous energy consumption, risks of the probably catastrophic landslide and serious environmental pollution are the main issues we are facing [
10]. Notably, methane is an about 20 times more efficient greenhouse gas than CO
2 [
11]. Therefore, effective and environmental friendly production technologies are expected, including CH
4-CO
2 swap, in-situ combustion and in-situ catalytic oxidation, etc.
The concept of CH
4-CO
2 swap in natural gas hydrates was firstly proposed by Ohgaki et al., [
12,
13,
14] and this attracted worldwide attention for its ability to simultaneously produce CH
4 from NGHs and sequestrate CO
2 in sea sediments. Firstly, the researchers studied the thermodynamic feasibility of CH
4-CO
2 swap in gas hydrates, [
15,
16,
17,
18] and the results of Sivaraman’s work showed that CO
2 hydrate could be formed under more moderate conditions of temperature and pressure than CH
4 hydrate and the heat of CO
2 hydrate formation (−57.98 kJ/mol) is larger than that of CH
4 hydrate dissociation (54.49 kJ/mol) [
19]. Ors and Sinayuc [
20] conducted an experimental study on the CH
4-CO
2 swap between gaseous CO
2 and CH
4 hydrate in porous media at 3.7 MPa and 277.15 K, and their results revealed that the CH
4-CO
2 swap process mostly took place at the gas-solid surface and the injection of gaseous CO
2 caused the dissociation of methane hydrate. Ota and Inomata et al. [
21,
22] studied the replacement of CH
4 in the hydrate by use of liquid CO
2 and the CH
4 recovery rate of 35% was obtained in 307 h, they also found that the CH
4 hydrate decomposed during the replacement process and the decomposition of the large cage (51262) in the CH
4 hydrate proceed faster than that of the small cage (512). They also suggested that CH
4 hydrate decomposition was probably dominated by rearrangement of water molecules in the hydrate whereas CO
2 hydrate formation seemed to be dominated by CO
2 diffusion in the hydrate phase. Lee and Ripmeester [
23] used solid-state NMR methods to investigate the limiting equilibrium compositions and the distribution of guest molecules over different cages of the mixed hydrate formed from different CO
2 concentration gas mixture of CH
4 and CO
2, they suggested that the ratio of CH
4 in large cages to CH
4 in small cages of sI hydrate declined steadily to a value with increasing CO
2 concentration in the gas mixture. Schicks et al. [
24] investigated the conversion of the primary CH
4 hydrate into a CO
2-rich hydrate using in situ microscopy, confocal Raman spectroscopy and powder XRD, and they suggested that the conversion process was induced by the gradient of the chemical potential between the hydrate phase and the environmental gas phase, and the conversion process could be described as a decomposition and reformation process. The conversion rate depended on the surface area of the hydrate phase and the concentration gradient of one component between the hydrate phase and the gas phase.
With further research, many researchers studied the feasibility of explore CH
4 from natural gas hydrates with gas mixture of CO
2 and N
2 which was the main component of flue gas. Kvamme [
25] studied the feasibility of simultaneous CO
2 storage and CH
4 production from natural gas hydrate using mixtures of CO
2 and N
2, and suggested that the fast exchange between CH
4 and CO
2/N
2 mixtures was achieved through a new hydrate formation and the adding of N
2 into CO
2 is advantageous to gas permeability in the hydrates. Also, they suggested there were two primary mechanisms for the conversion of CH
4 hydrate into CO
2 hydrate, one was the direct solid state conversion [
23] and the other was that new CO
2 hydrate formed from injected CO
2 and free water in the pores [
26,
27]. Lee et al. [
28] explored the swap phenomenon occurred in sI and sII hydrates, and CH
4 recovery rates of 64% and 85% were obtained with CO
2 and CO
2/N
2, respectively, and the results showed that the sII hydrate was transformed into sI when sII hydrates were exposed to CO
2 and CO
2/N
2. Beyond that, they also investigated the recovery of CH
4 from gas hydrates intercalated within natural sediments using CO
2 and CO
2/N
2 gas mixtures, and they found that the recovery efficiency was nearly identical [
2].
In addition to the above laboratory studies, there also were some field tests to produce CH
4 from CH
4 hydrate reservoirs in permafrost or subsea sediments [
29,
30,
31,
32,
33]. In 2002 and 2008, the production tests were carried out in the permafrost reservoir of Mallik in northern Canada by injection of hot water and depressurization, and limited amounts of CH
4 was successfully exploited in a few days. After that, in 2012, the method of injection of 23% CO
2 and 77% N
2 was tested in the Alaska North Slope. The gas production were conducted above and near the P–T condition of CH
4 hydrate equilibrium respectively, and the total volume of produced gas mixture approached 30,000 m
3 over the whole test period though the mole fraction of CH
4 in the gas mixture were different at the different test period [
31,
34,
35]. Then the depressurization technique was firstly used in offshore hydrate reservoirs at the eastern Nankai Trough in 2013, and the total gas production was around 120,000 m
3 in six days. Eventually the test was suspended due to the bad weather conditions and sand control problems. Therefore, the commercial NGH exploitation is both highly complex and technologically challenging because the complex geologic structure, harsh engineering conditions and the risks of collapse of marine and potential serious damage to the marine ecosystem.
The changes of temperature and pressure have great influence on CH4 recovery from NGHs via CH4-CO2 replacement. In order to clarify the influence of temperature and pressure and the possible influence of different added gas in CO2, in this work, the changes of gas phase and hydrate phase during the replacement process under different pressure condition, using simulated IGCC syngas as displacement gas, are determined by in situ Raman spectroscopy, powder XRD and gas chromatography.
2. Experimental Section
2.1. Apparatus
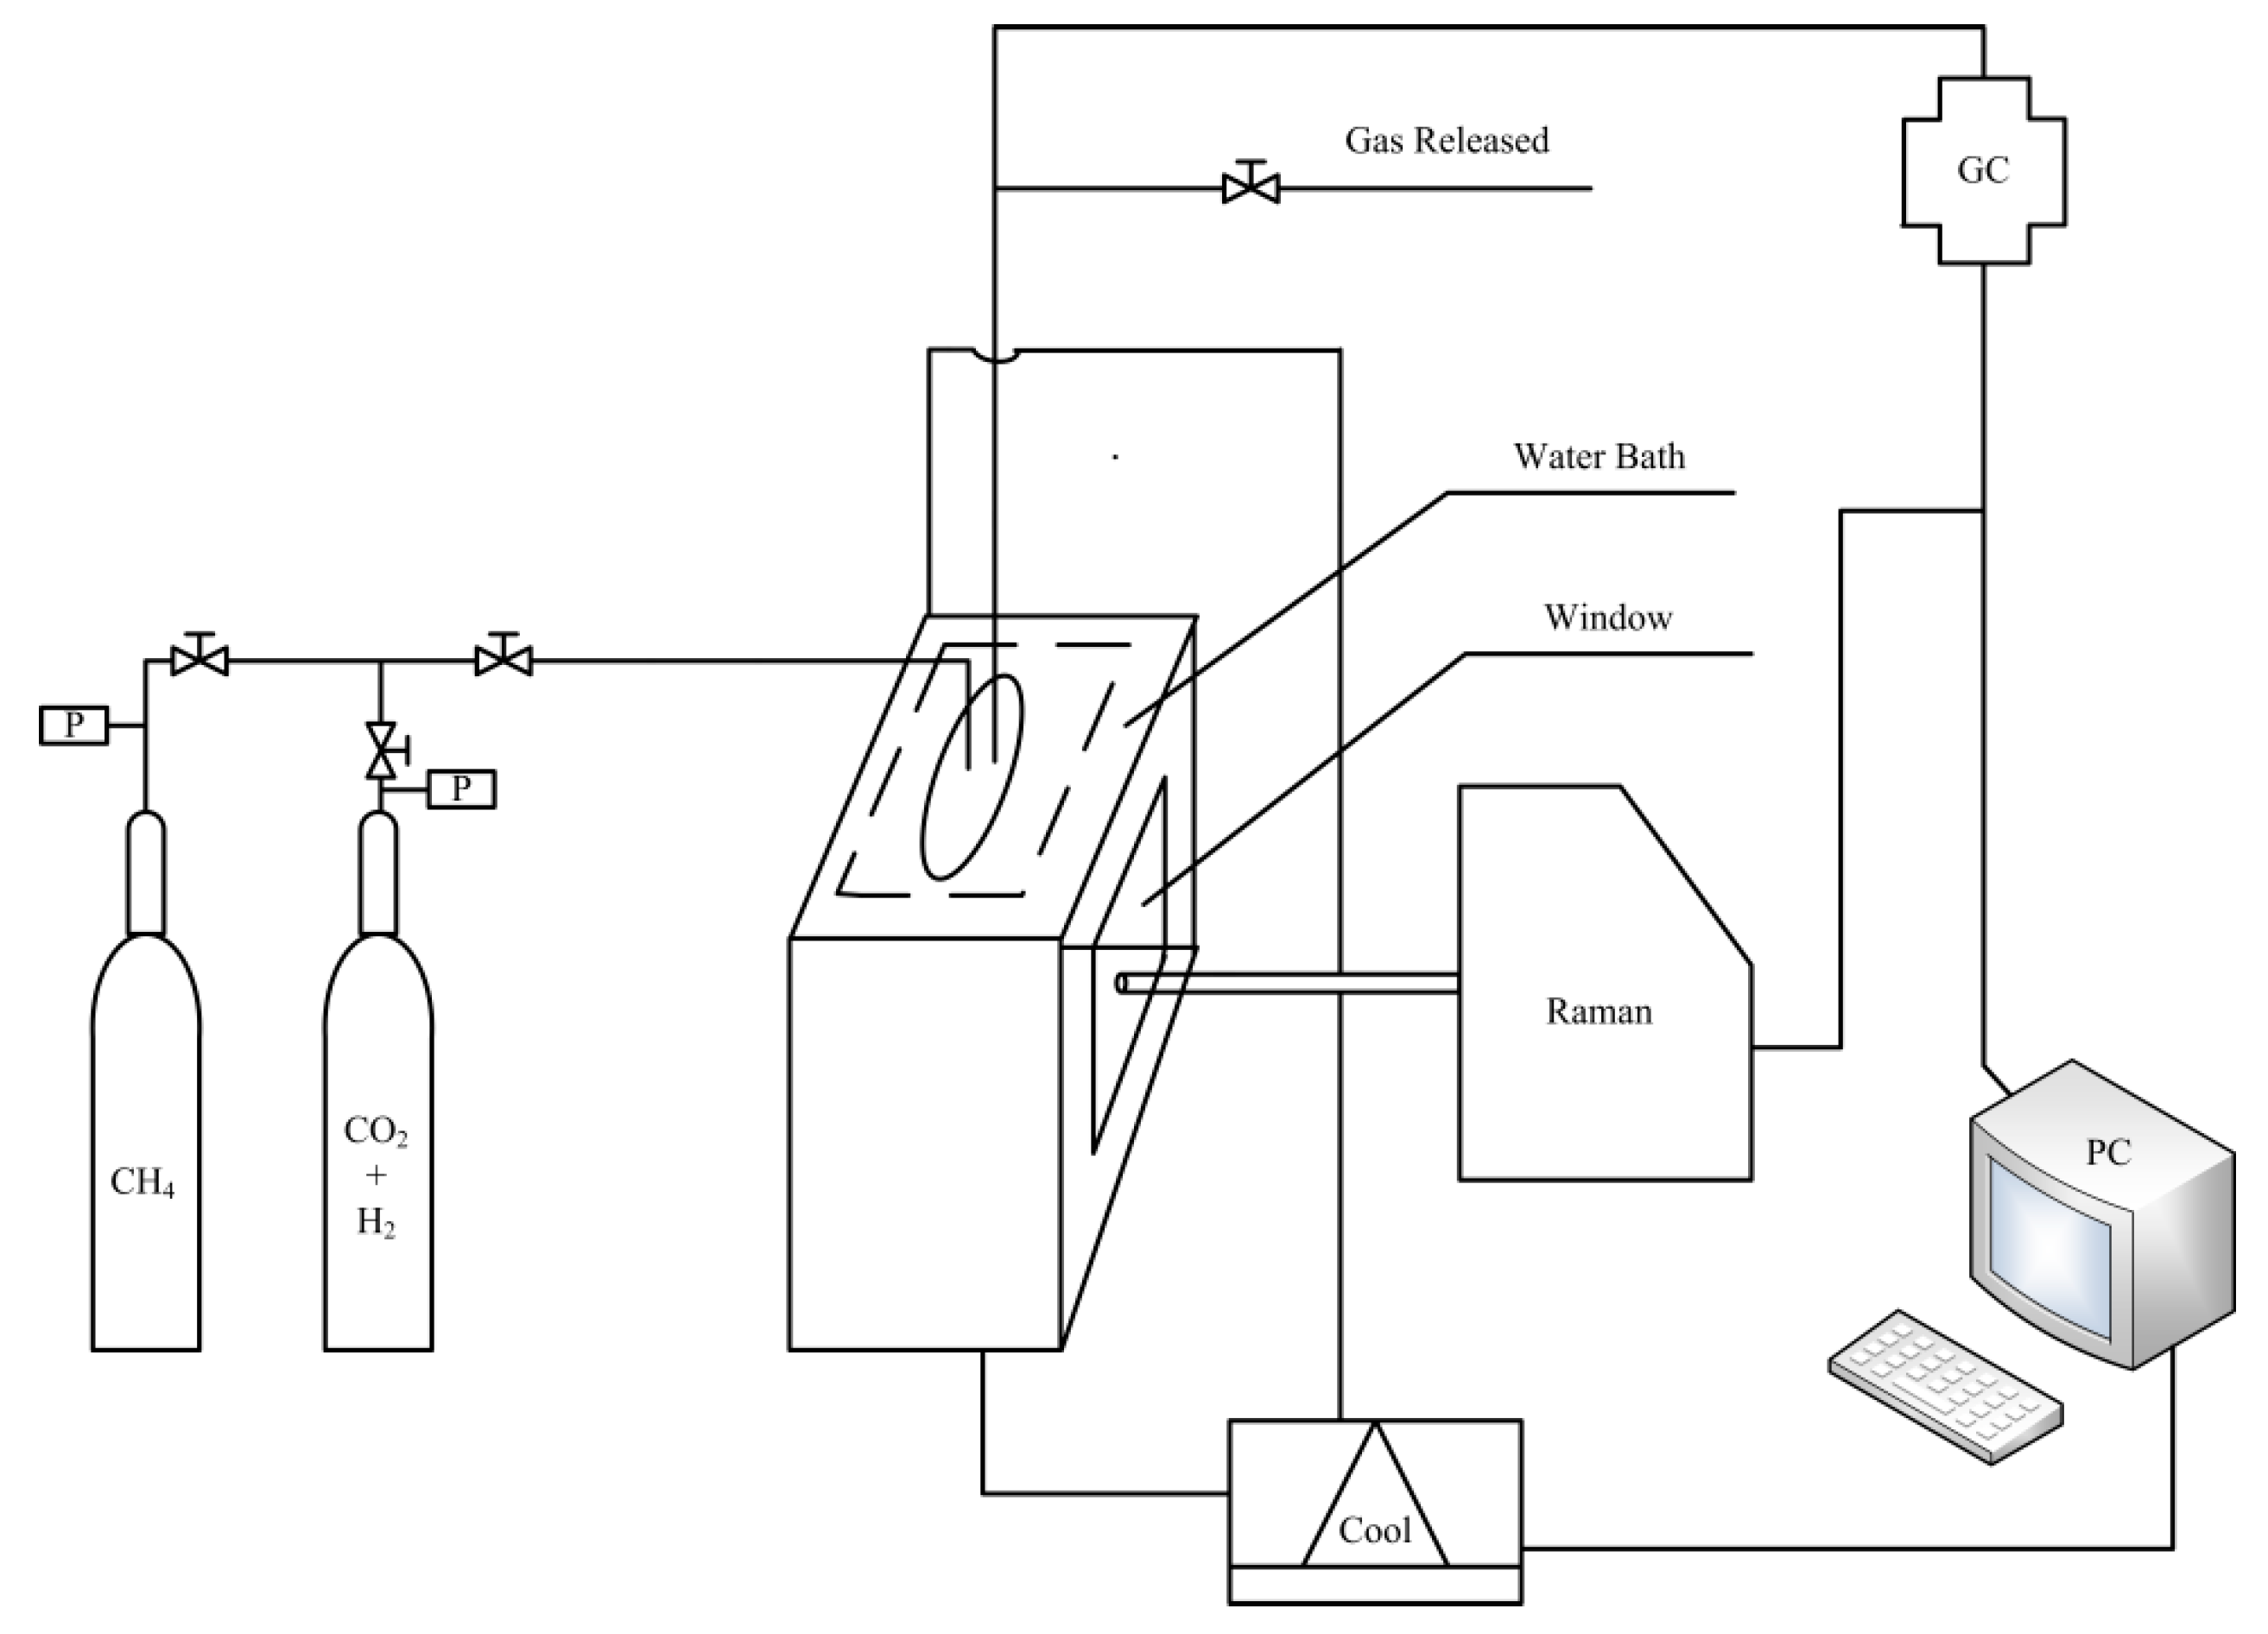
As shown in
Figure 1, the experimental apparatus consists of a gas supply system, a high-pressure vessel used as the hydrate formation or dissociation reactor, a cooling system and detection equipment. The stainless-steel reactor with an inner volume of 100 mL is embedded in the notch which is linked with the cooling system, and two quartz windows are mounted on front and back sides of the reactor for viewing the swap process and applying Raman measurement. In the cooling system, the ethylene glycol solution with the volume ratio of 1:3 are used as coolant, and the temperature can be controlled in the range of 253.15–303.15 K, and a Pt100 thermocouple (JM6081) supplied by Jiangsu Hongbo machinery manufacturing co. LTD (Nantong, Jiangsu, China) with uncertainties of ±0.1 K is employed to measure the temperature.
The gas component is determined by an Agilent 7890A gas chromatograph (GC, Agilent Technologies Inc., Palo Alto, CA, USA). The experimental CH4 gas with a purity of 99.9% and 39.9% CO2 +60.1% H2 gas mixture were supplied by Foshan Huate Gas Co., Ltd. (Foshan, China). The deionized water with the resistivity of 18.25 mΩ cm−1 is produced with an ultra-pure water machine from Nanjing Ultrapure Water Technology Co., Ltd. (Nanjing, China).
The Raman spectra are obtained from on a LabRam Raman spectrometer (Jobin Yvon, Paris, France) with a 50 times tele lens and a single monochromator of 1800 grooves/mm grating and a multichannel air-cooled charged-coupled device (CCD) detector. In addition to this, the Raman spectrometer uses an Ar-ion laser source, which emits a 532 nm line with a power of 100 mW. The silicon (Si) crystal standard of 520.7 cm−1 is employed to calibrate the subtractive spectrograph.
The XRD patterns are recorded at 193 K on a D/MAX-2500 device (Rigaku, Tokyo, Japan) using graphite-monochromatized Cu Kα1 radiation (λ = 1.5406 Å) in the θ/2θ scan mode. The XRD experiments are carried out in step mode with a fixed time of 3 s and a step size of 0.03° for 2θ = 10–60° for each hydrate sample.
The gas component in the collected gas samples and the final dissociated gas was analyzed on an Agilent 7890A GC (Agilent Technologies Inc., Palo Alto, CA, USA), equipped with a flame ionization detector (FID) and thermal conductivity detector (TCD). Besides that, the gas samples are detected with the method of uniform heating from 298.15–523.15 K, and H2 (30 mL/min) is used as combustion gas, air (400 mL/min) is used as combustion-supporting gas and helium (25 mL/min) is used as make-up gas.
2.2. Procedure
Deionized water (60 mL) is injected into the reactor, followed by cooling down the system to 274.15 K and removing the air in the gas phase by injecting CH4 gas continuously into the water from the bottom of reactor at a system pressure of 1.0 MPa, and after that the system is pressurized to 4.5 MPa. During the CH4 hydrate sample preparation period, the intake of CH4 gas and the agitation of the deionized water are maintained so that the injected CH4 gas could dissolve well in the water and the experimental CH4 hydrate sample forms evenly in the water phase. About five days later, once there is no water in the reactor as determined by Raman analysis, the CH4 hydrate formation reaction is deemed finished. Hereafter, the simulated IGCC syngas of 39.9% CO2 and 60.1% H2 gas mixture is injected into the reactor from bottom of reactor, and the CH4 gas above the hydrate is discharged at the same time under the stable pressure of 4.5 MPa. Once the CH4 in gas phase is lower than 2%, the outlet valve is shut off and then the gas mixture of CO2 and H2 gradually displaces CH4 from the hydrate. In the process of the replacement, the composition of the gas phase, gas-hydrate interface and the hydrate phase are determined through Raman spectroscopy every 24 h, and the component of the gas phase is also determined through GC analysis. At the end of replacement process, the hydrate is dealt with liquid nitrogen and the gas phase is removed, then the reactor is placed at room temperature for dissociation of the hydrate. Meanwhile, one same replacement reaction is conducted in another same reactor and at the end of the replacement process the hydrate is took out for powder XRD detection. These two experiments are labeled as experiment 1.
In addition to that, another two experiments, which are labeled as experiment 2, were conducted under the same conditions as above method, except for the fact the hydrate formation and the replacement processes are carried out at 6.0 MPa.
3. Results and Discussion
For monitoring the changes of the hydrate phase and gas phase during the replacement process, three fixed points are selected for Raman detection as point “A” in the hydrate phase, point “B” at the interface of gas phase and hydrate phase and point “C” in the gas phase.
After the formation of pure CH
4 hydrate, the Raman spectra and powder XRD pattern are obtained and shown in
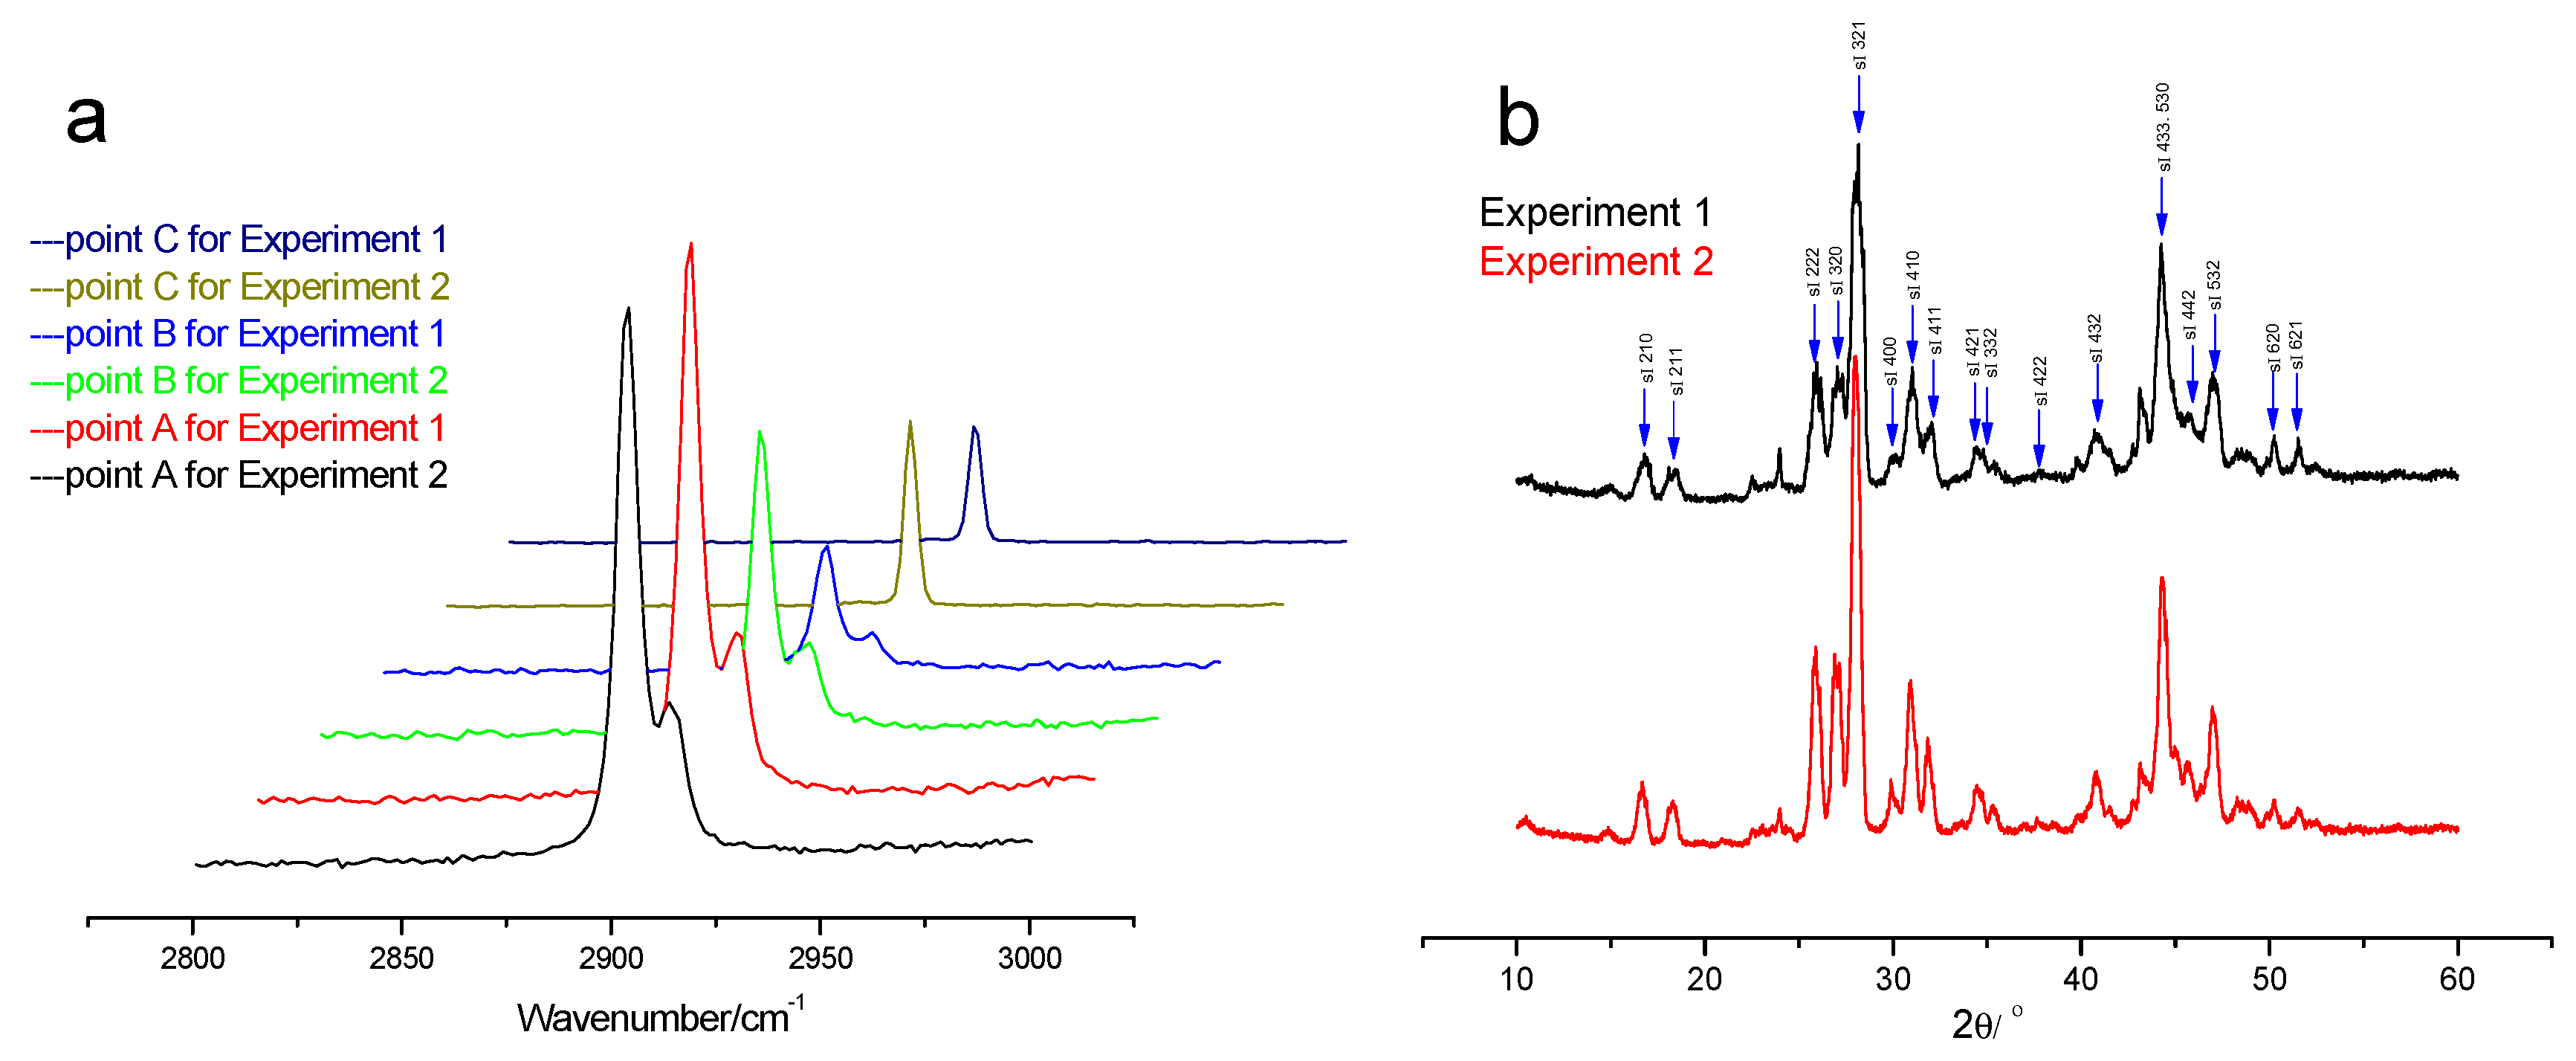
Figure 2. As shown in
Figure 2a, all the hydrate samples have the representative Raman peaks of sI hydrate. The strong peak at 2905 cm
−1 and relatively weak peak at 2915 cm
−1 with the intensity ratio of 3:1 are attributed to the C-H symmetric stretching vibration of CH
4 molecules in large cages and small cages of sI hydrate, respectively. The peak at 2917 cm
−1 which is detected in the gas phase is attributed to C-H symmetric stretching vibration of CH
4 gas. In addition, the powder XRD pattern of the hydrate samples are shown in
Figure 2b, it can be seen that the hydrate samples show all peaks of the sI hydrate and little ice Ih. It can be concluded that all the formed hydrates are sI hydrates.
Once the water is fully converted into hydrate, the gas is quickly replaced by CO2/H2 under the same temperature and pressure conditions. During the process of replacement, the component changes in hydrate phase, gas-hydrate interface are determined by in situ Raman every 24 h until the intensities of Raman peaks obtained from point “A” show no changes.
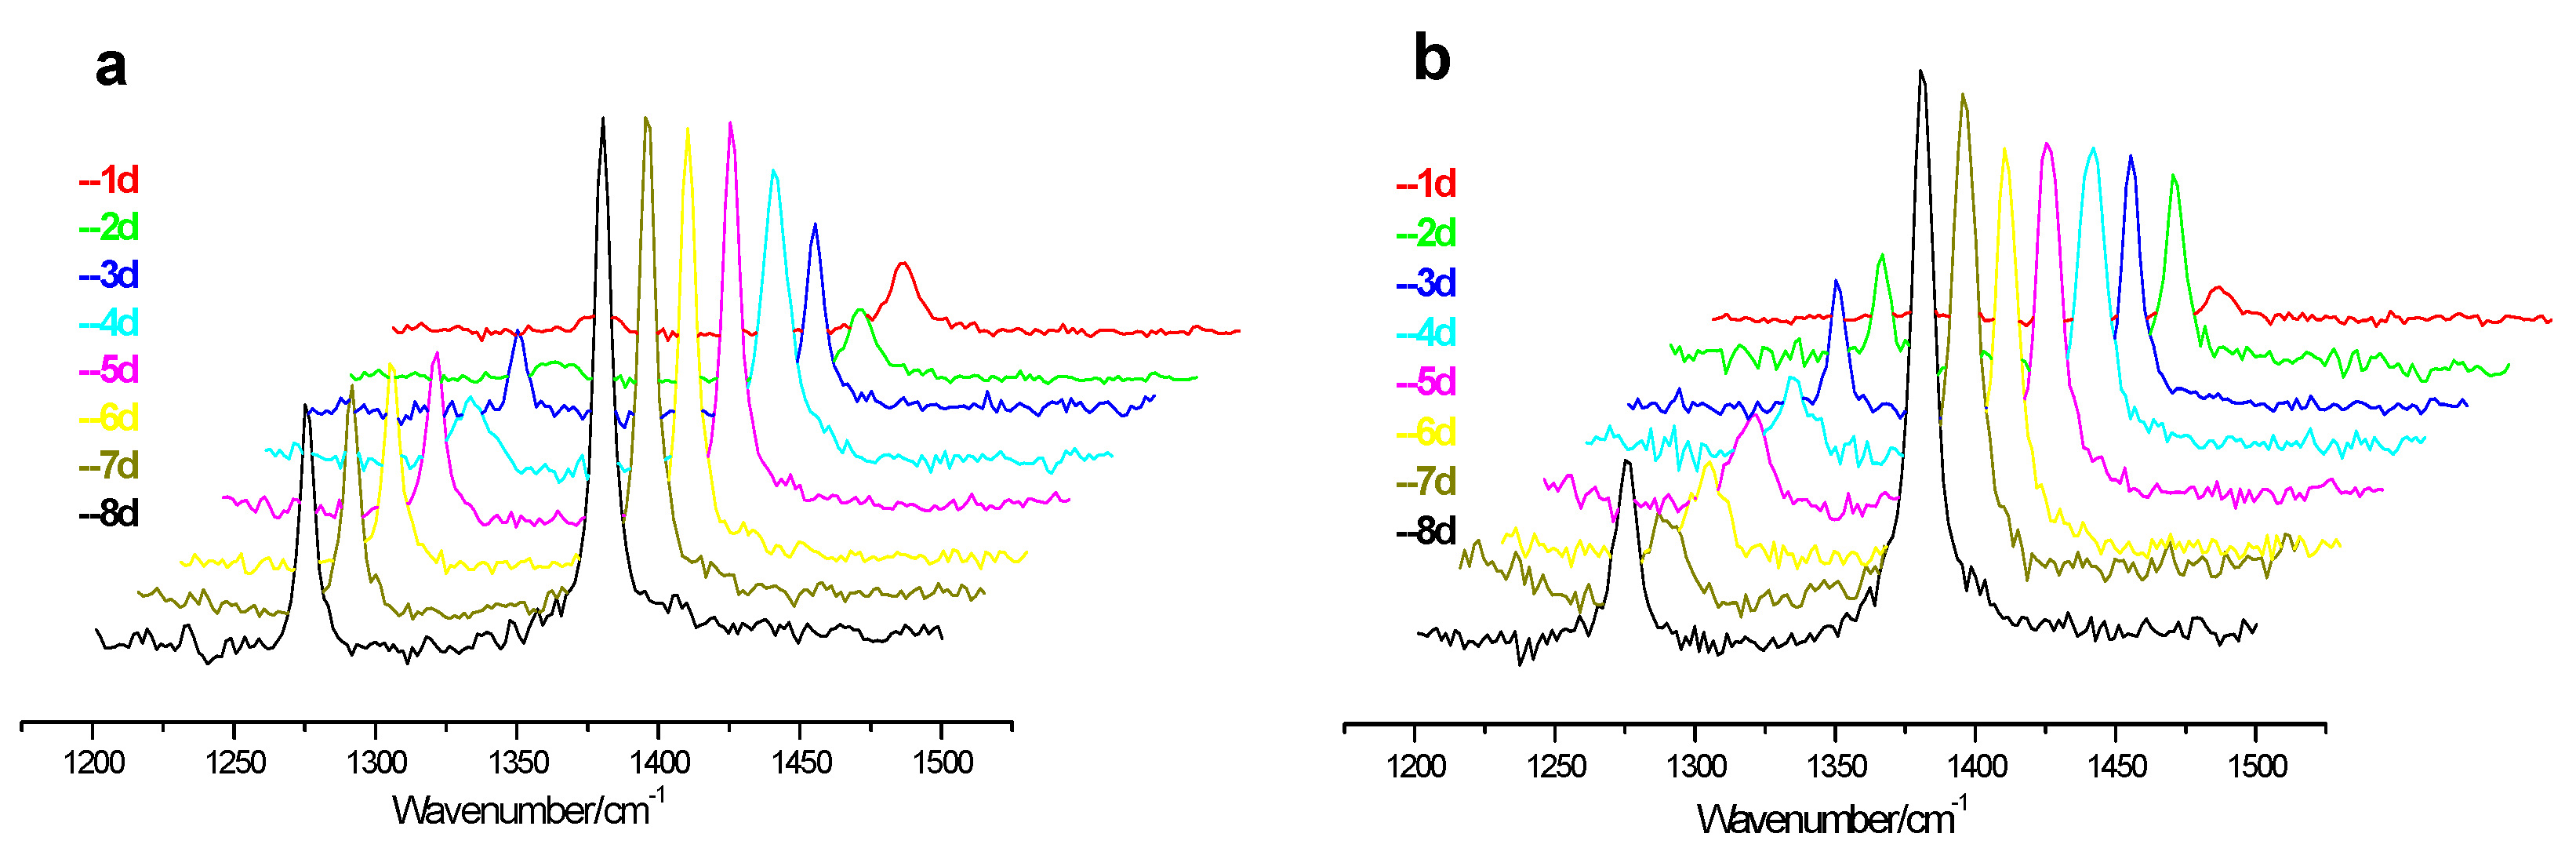
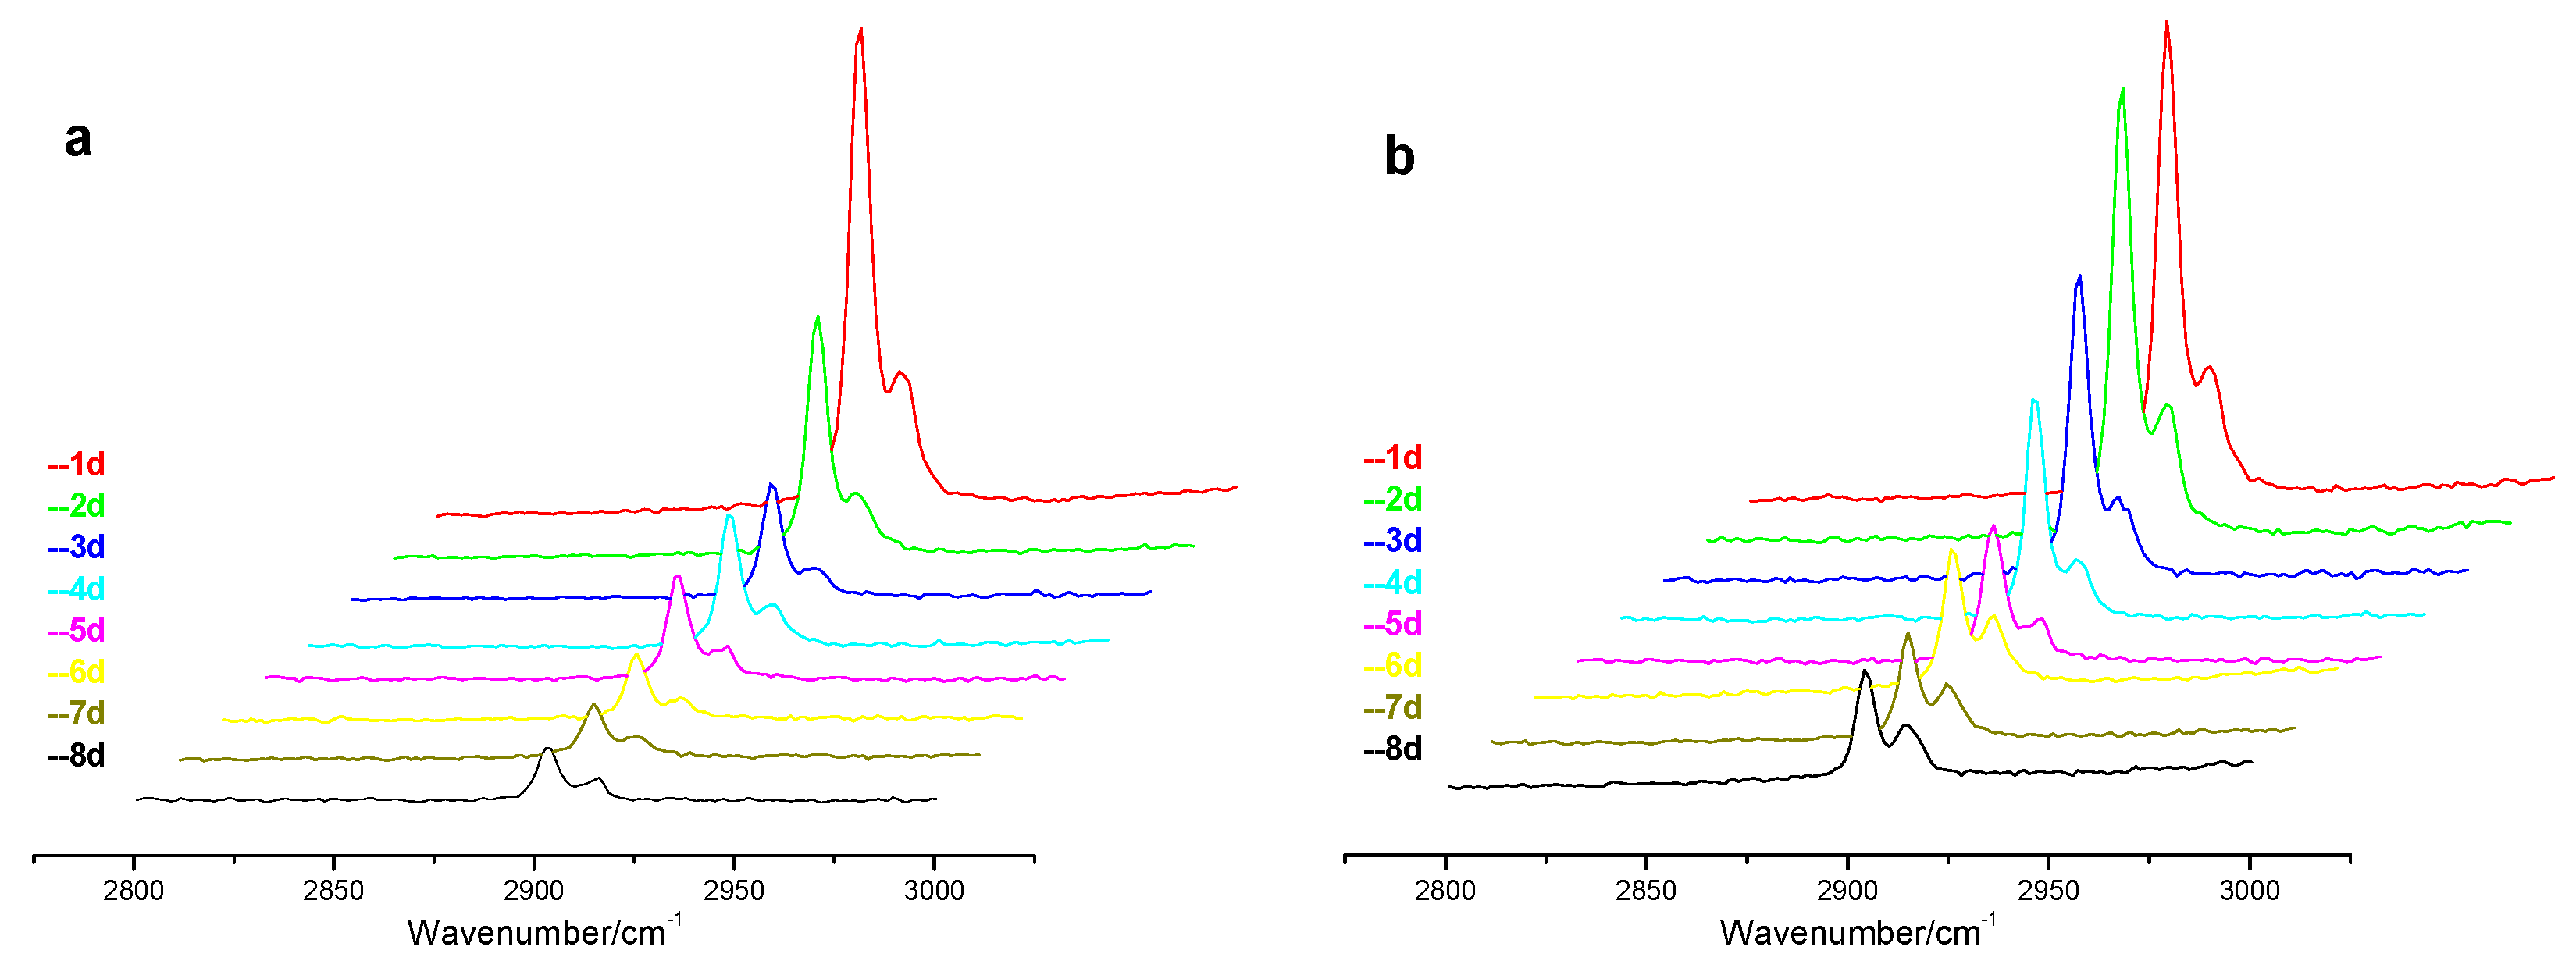
Figure 3 shows the changes of Raman spectra of CO
2 hydrate at point “A” during the replacement process for both experiments, and the picture a and b represent the low pressure (4.5 MPa) and high pressure (6.0 MPa) experiments, respectively. The Raman peaks at 1277 and 1380 cm
−1 correspond to the C = O stretching vibration and bend vibration, respectively. Because of Fermi splitting, we cannot judge which cages are occupied by CO
2. It can be seen that the Raman peak intensity corresponding to CO
2 hydrate increases gradually for both low and high pressure experiments, but the growth rate for low pressure experiment is larger than that for high pressure experiment. The possible reason is that the partial pressure of CO
2 in the gas mixture of the low pressure experiment (1.8 MPa) is lower than that of high pressure experiment (2.4 MPa), bringing about the smaller driving force of CO
2 molecule in low pressure experiment, resulting in the retard of CO
2 hydrate formation. On the contrary, the driving force of the CO
2 molecules in the high pressure experiment is large enough to form CO
2 hydrate, and the formed CO
2 hydrate covers the CH
4 hydrate and impedes the gas mixture from contacting CH
4 hydrate.
For the same smaller driving force reason more and more water results from the decomposition of the hydrate phase and is carried by the gas mixture up to the interface of the gas phase and hydrate phase in the low pressure experiment, and the more CO
2 hydrate is formed at the interface, as shown in
Figure 4. The Raman peak of CO
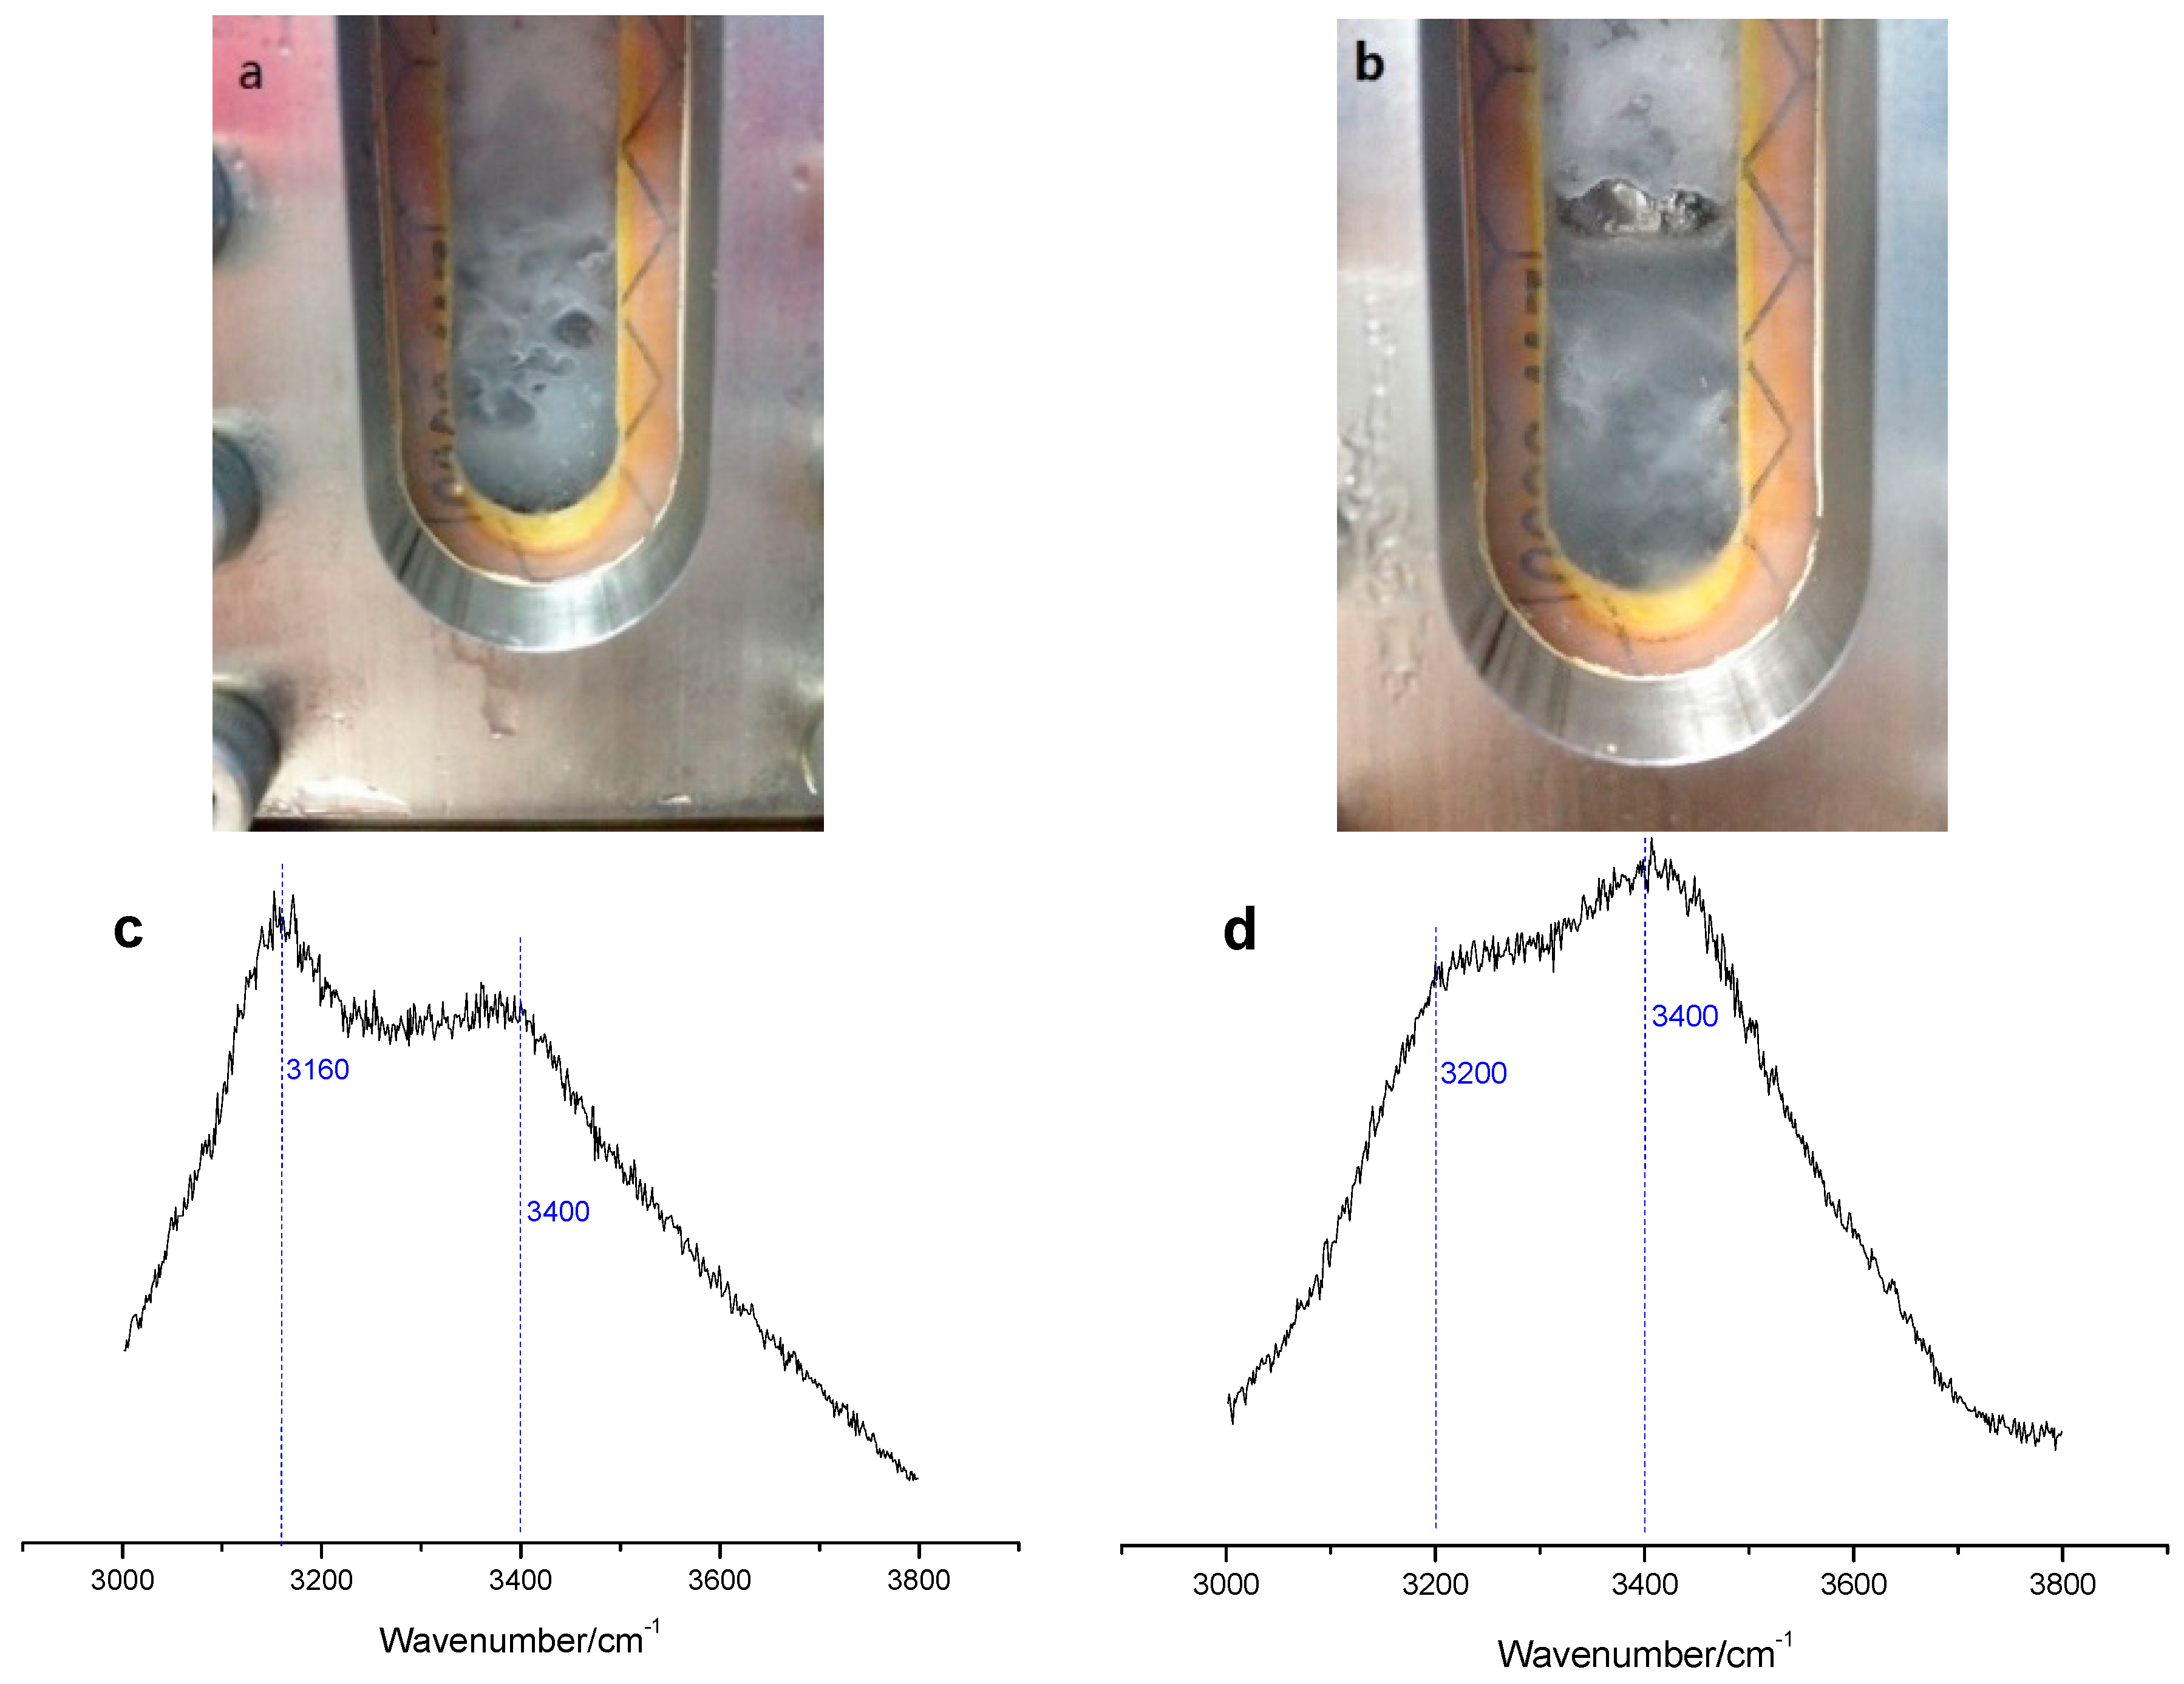
2 hydrate for low pressure experiment increases faster than that for high pressure experiment, and finally, a stronger intensity of peak for low pressure experiment is obtained. Furthermore, it can be observed that there is significant water phase at the interface between gas phase and hydrate phase. However, a similar phenomenon has not been observed for the high pressure experiment in which the presence or not of the water from decomposition of hydrate can only be determined by in situ Raman, as shown in
Figure 5, where the pictures a and b show the photo of vessel at the first and sixth day of replacement reaction of low pressure experiment, and the pictures c and d show the Raman peak change between 3100 and 3500 cm
−1 which is attributed to O-H symmetric stretching vibration of H
2O molecules during the replacement reaction of high pressure experiment [
36].
It can be seen that the Raman peak shows sharp appearance at about 3160 cm-1 and short appearance at about 3400 cm−1 which are attributed to O-H symmetric stretching vibration of H2O molecules in sI hydrate, then along with the replacement progress the peak appearance changes to low peak at 3200 cm−1 which is attributed to Fermi resonance between O-H stretch and bending mode of H2O molecules in water phase, and high peak at 3400 cm−1 which is attributed to the O-H symmetric stretching vibration of H2O molecules in water phase. This observation strongly verifies the decomposition of hydrate during the replacement process, though the degree of decomposition is different between low pressure experiment and high-pressure experiment. The presence of water from decomposition of hydrate phase may improve the permeability of hydrate phase and gives one reason for the higher CH4 recovery yield in the low-pressure experiment.
During the replacement process, when the CH
4 hydrate is attacked by the CO
2/H
2 gas mixture, the hydrate lattice is decomposed and then the water from the decomposition of CH
4 hydrate forms CO
2 hydrate with the CO
2 gas molecules, so the amount of CH
4 hydrate at monitoring point “A” gradually decreases to a certain extent, as shown in
Figure 6, which represents the changes of Raman spectra of CH
4 hydrate at point “A” during replacement process for both low and high pressure experiments. As can be seen that the Raman peaks of CH
4 hydrate gradually decrease during the replacement process, and the drop rate in the low pressure experiment is higher than that in the high pressure experiment, and the result is consistent with the rule of the increase of CO
2 hydrate in the
Figure 3, where the increment of Raman peaks for CO
2 hydrate in low pressure experiment is higher than that in high pressure experiment. Apart from this, another result that can be seen from the picture
b in
Figure 6 is the changes of ratio of Raman peak intensity at 2905 cm
−1 to that at 2915 cm
−1 in the high pressure experiment. As known that the peak at 2905 cm
−1 represents the CH
4 molecules in large cages of sI hydrate and the peak at 2915 cm
−1 stands for the CH
4 molecules in small cages. During the high pressure replacement process, the intensity ratio of peak at 2905 cm
−1 and peak at 2915 cm
−1 changes gradually from premier 3:1 to final 2:1 and this decreasing ratio demonstrates that the replacement reaction only conducts in the large cage of the sI hydrate. The reason for this result may be the fast formation of CO
2 hydrate at the interface between gas phase and hydrate phase limits the injected gas mixture further contacting CH
4 hydrates.
For preventing the released CH
4 from forming mixed hydrate with CO
2 gas, the gas injection and simultaneous discharge of gas mixture is conducted every 24 h, following the Raman detection, to decrease the CH
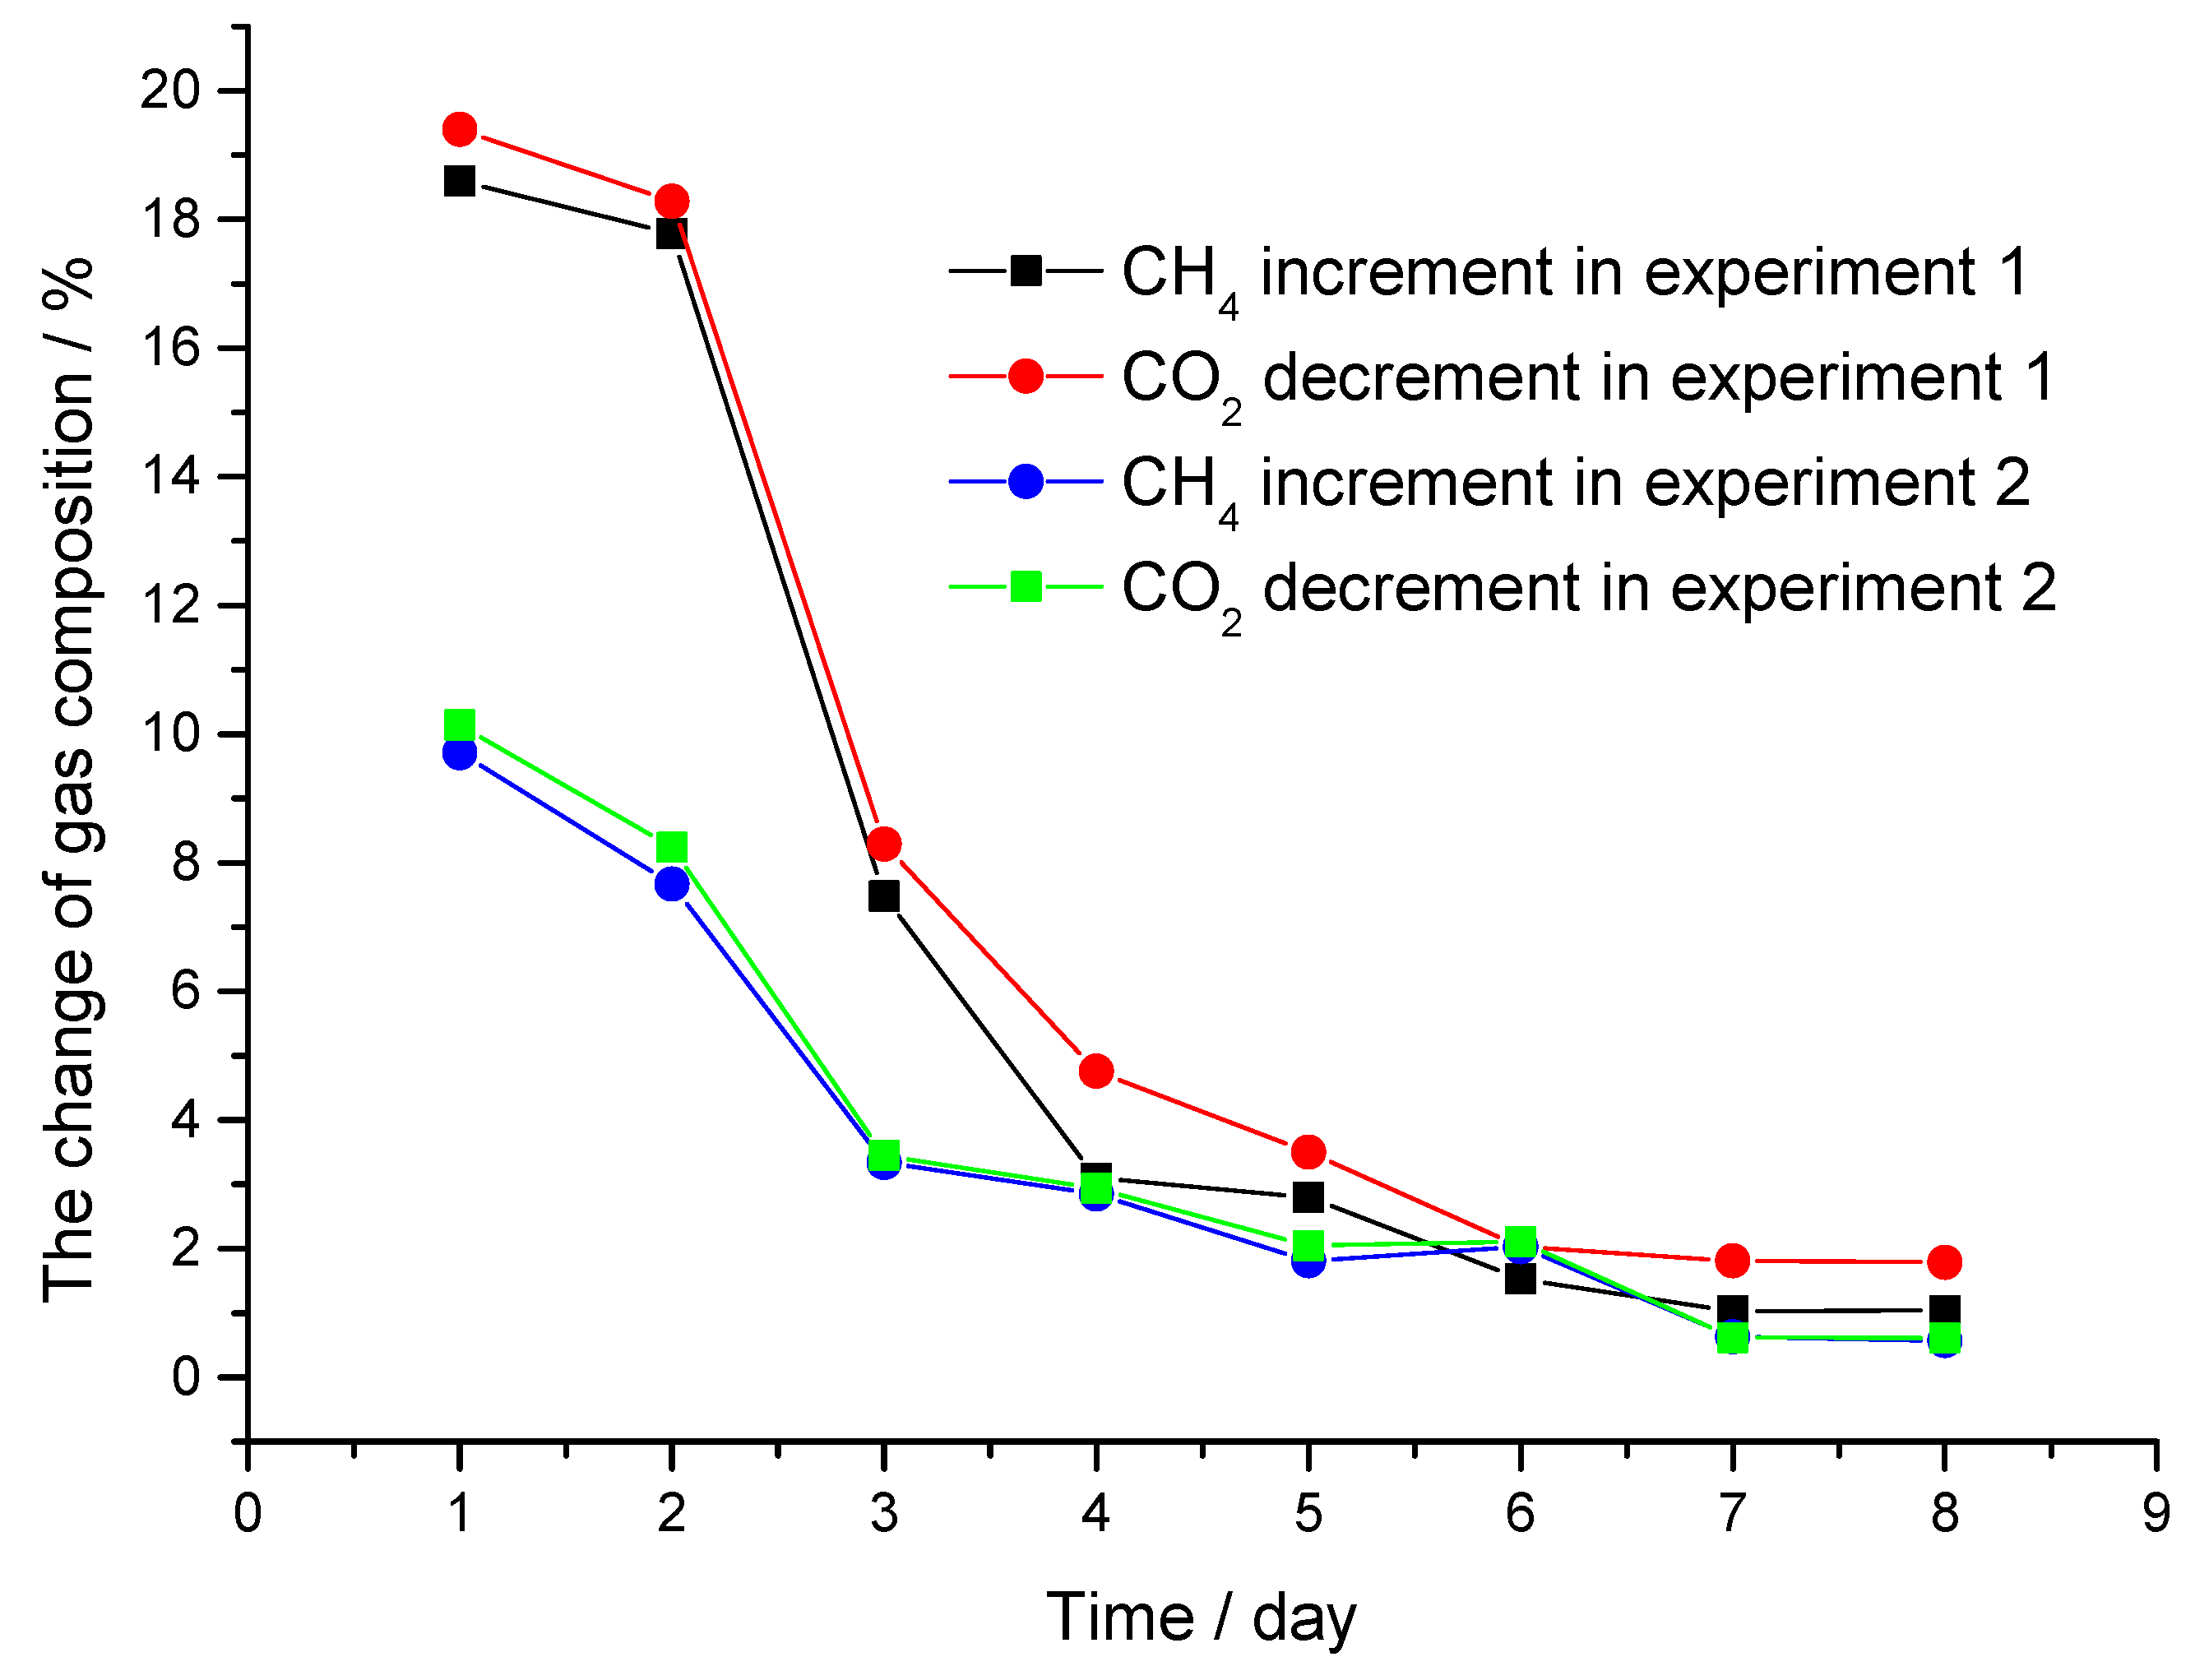
4 component concentration to less than 2% again, and the gas samples are collected at the beginning and end of the ventilation process and analyzed by gas chromatography. The results are shown in
Table 1 and the data in
Table 1 is plotted in
Figure 7. It can be seen that in the low pressure experiment the CH
4 component concentration increases from less than 2% to 18.60, 17.18, and 7.48 mol% respectively in the first 3 days and tends to remain unchanged in the next 5 days till stabilizes at 1.0 mol% in the last 2 days. However, in the high-pressure experiment, the CH
4 component concentration only increases from less than 2% to 9.71 and 7.67 mol% in the first 2 days and the increment tends to remain unchanged in the following days till stabilizes at 0.5 mol% in the last 2 days. What should be noted is that the CO
2 percent decrement is a little larger than the of CH
4 percent increment in both experiments. This result could be attributed to the decomposition of CH
4 hydrate and the new formation of CO
2 hydrate, as well as the low-pressure experiment shows a greater extent of decomposition of CH
4 hydrate than the high pressure experiment.
When the Raman peak intensity of CH
4 hydrate and CO
2 hydrate at the point “A” and “B” show no changes and the CH
4 percent increment in the collected gas samples is less than 0.5, the replacement process is considered finished. Thereafter, the vessel is cooled with liquid nitrogen and the gas phase is withdrawn quickly by a vacuum pump, then the vessel is placed in the atmosphere for dissociation of the hydrate phase and the gas samples of decomposed hydrate phase are detected by gas chromatography. The gas chromatography results of the gas from decomposition of the final hydrate are shown in
Table 2. As seen, the CH
4 residues in the hydrate phase after replacement process are 29.29% and 67.76%, indicating that the CH
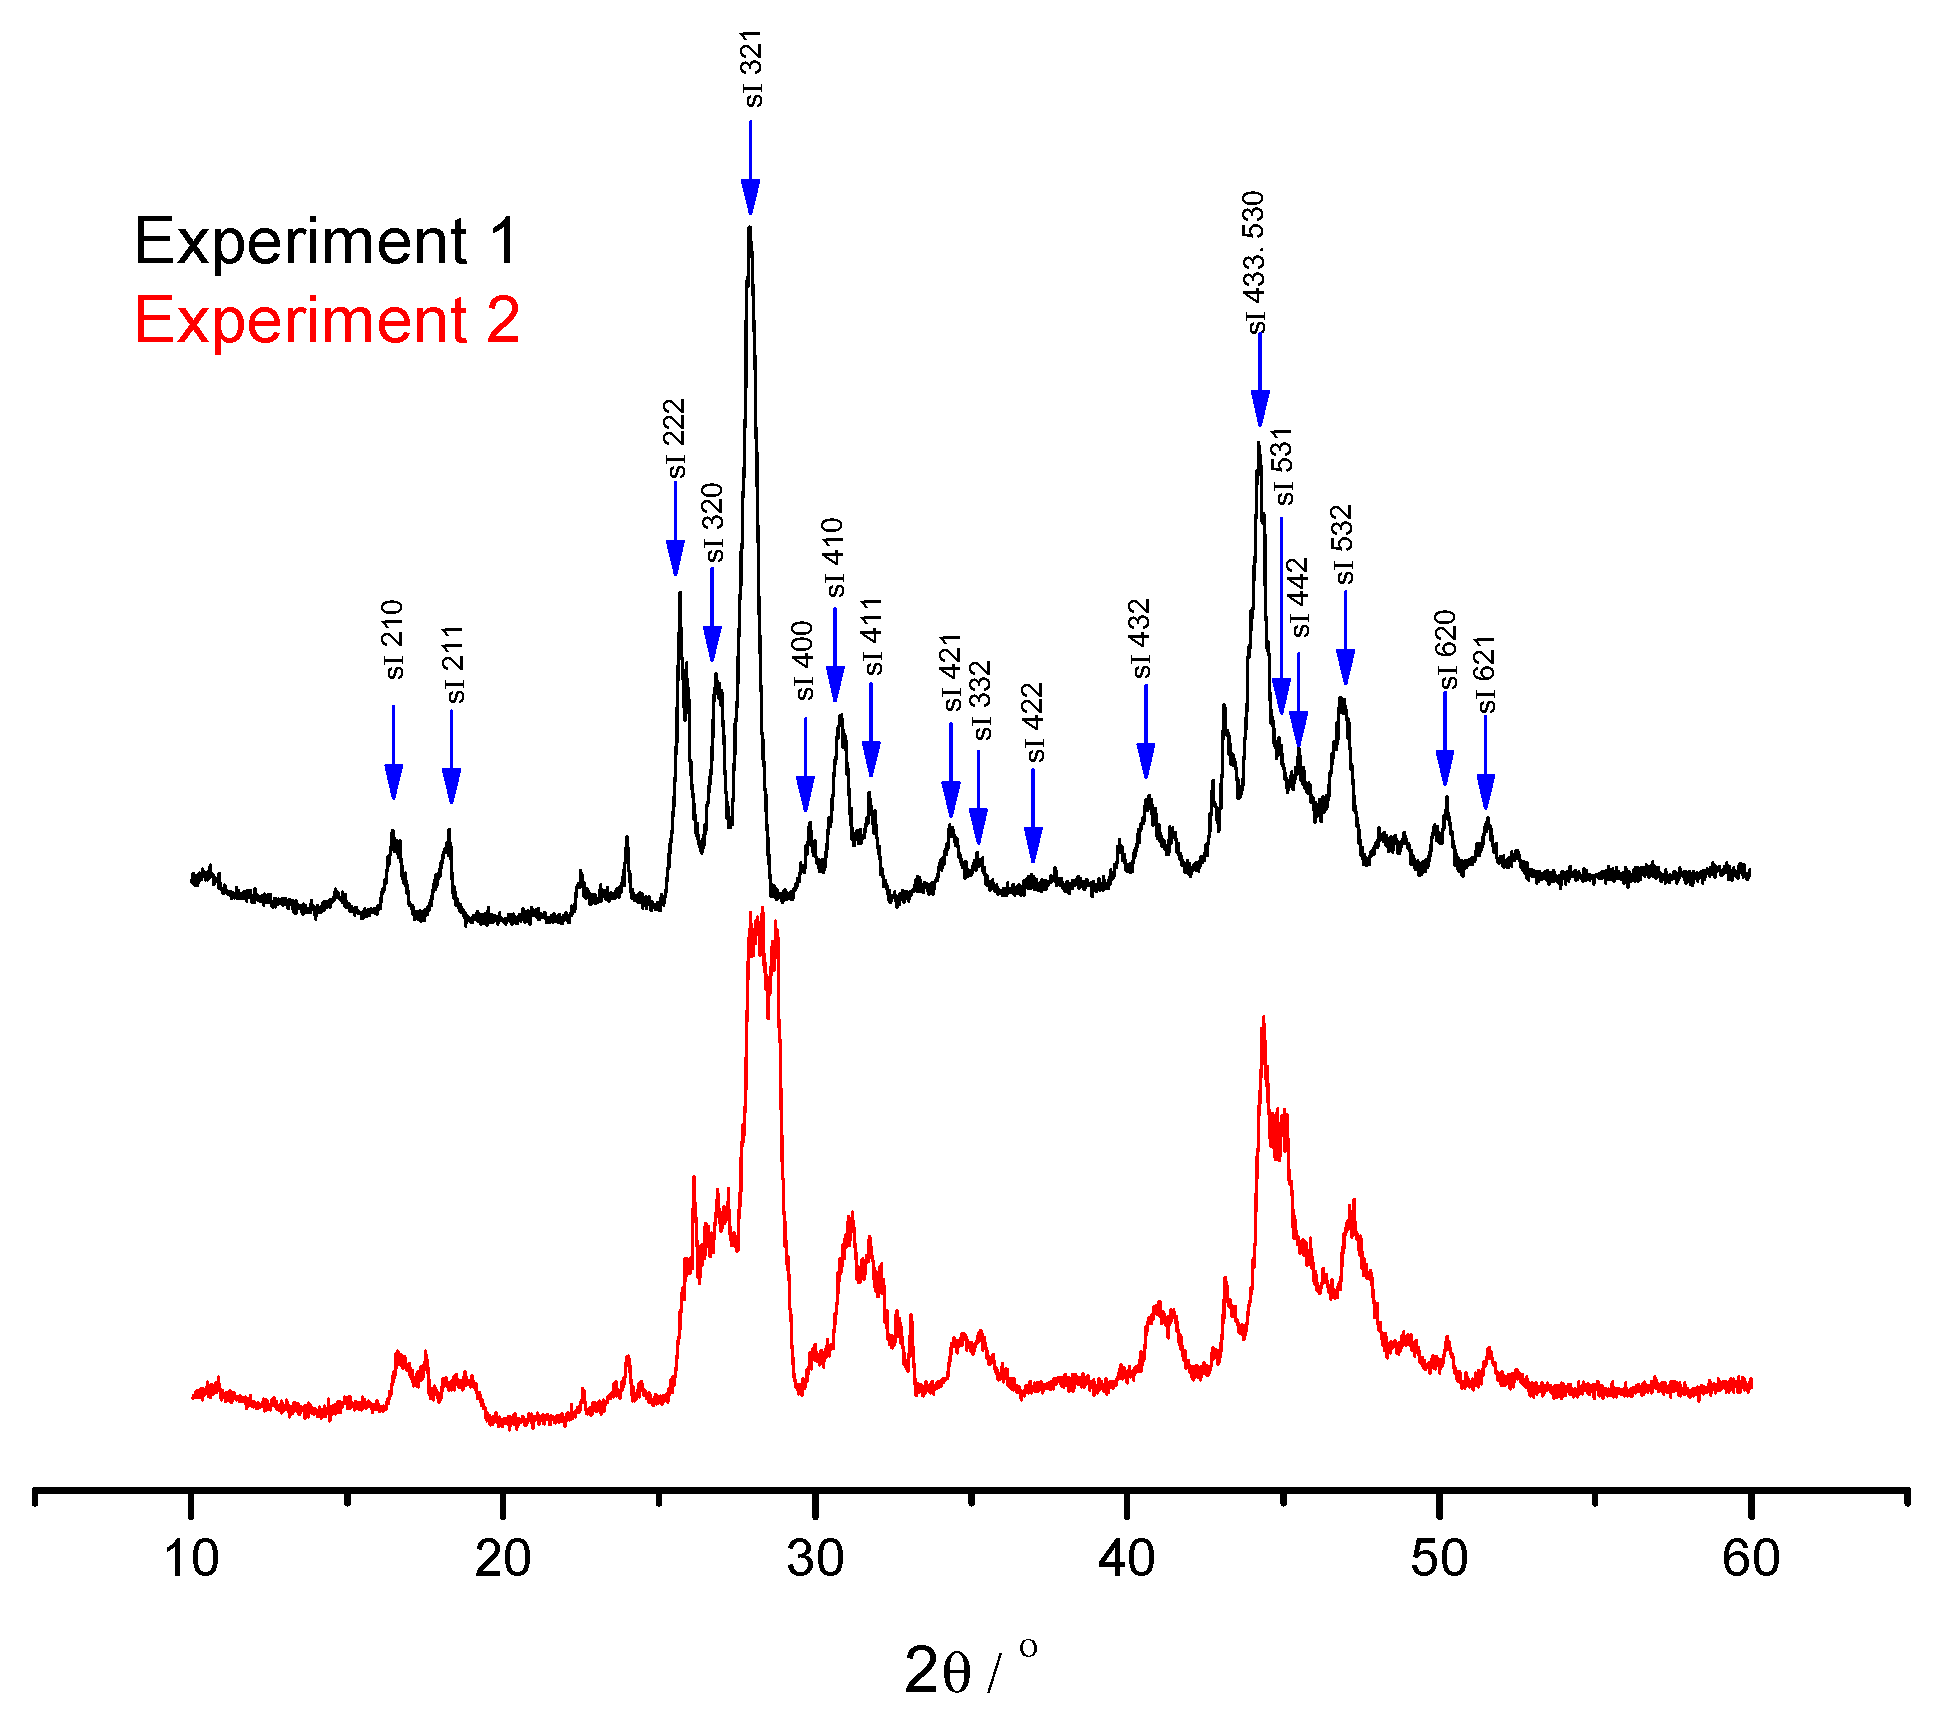
4 recovery rates are 70.21% and 32.24% for low pressure experiment and high-pressure experiment, respectively. Also, the same low-pressure experiment and high pressure experiment are conducted, the final hydrate phases are removed from vessel and detected by powder XRD to determine the structure of the hydrates. The powder XRD patterns of the hydrates are shown in
Figure 8, the peaks with blue arrows are attributed to the cubic crystal system which represents the sI hydrate. It can be concluded that the hydrate structure has no change during the replacement. In both low and high pressure experiments, there is no presence of H
2 in hydrate phase on the basis of Raman results, thus it can be concluded that the H
2 molecules does not occupy cages of the hydrate, they may only play a promotion role during the replacement process. Comparing with the results obtained previously, where the replacement process of CH
4 hydrate is conducted with gaseous CO
2, the obtained CH
4 recovery efficiency was 50%. Due to the adding of H
2, the CH
4 recovery efficiency was increased from 50% to 70.29%, it could be referred that the stability of the cages is broken and the CH
4 molecules in the cages could spilled over when the H
2 molecules contact with the hydrate lattices. However, the lattices could form again once CO
2 molecules step into the cages. The higher CH
4 yield for the low pressure experiment is due to the lower driving force of CO
2 in the gas mixture, and thus the disturbed hydrate lattices resulting from the connection of hydrate with H
2 molecules could not occupied by CO
2 molecules in good time, which causes the decomposition of hydrate. However, during the high-pressure replacement process, the CO
2 molecules can occupy the disturbed hydrate cages for the high CO
2 partial pressure, and the hydrate lattice stabilizes again.
