Article

A Criterion of Heat Transfer Deterioration for Supercritical Organic Fluids Flowing Upward and Its Heat Transfer Correlation

1
Department of Mechanical Engineering, National Chiao Tung University, Hsinchu 300, Taiwan
2
Green Energy & Environment Research Laboratories, Industrial Technology Research Institute, Hsinchu 31040, Taiwan
*
Author to whom correspondence should be addressed.
Energies 2020, 13(4), 989; https://doi.org/10.3390/en13040989
Submission received: 22 January 2020 / Revised: 17 February 2020 / Accepted: 19 February 2020 / Published: 22 February 2020
(This article belongs to the Special Issue Experimental Heat Transfer in Energy Systems)

Abstract

:
The main objective of this study was to develop the supercritical heat transfer correlation applicable for organic fluids when flowing upward in smooth tubes based on the available experimental data. The organic fluids contain R-22, R-134a, R-245fa and Ethanol and the associated heat transfer characteristics were compared with non-organic fluids like water and carbon-dioxide (CO2). It was found that the limit heat flux may result in heat transfer deterioration (HTD) of organic fluid and the corresponding values are much smaller than water or CO2. A new criterion to predict the HTD was developed and this criterion yields the best predictive ability against database. It was found that HTD occurs can be well described by the acceleration parameter evaluated at the wall condition rather than at bulk condition. For estimation of the supercritical heat transfer coefficient (HTC) for organic fluid, the present study proposes a new correlation with a physically based correction factor, which gives satisfactory predictions against the HTC of supercritical organic fluid. The new correlation can offer the smallest average deviation of 0.007 and standard deviation of 0.181 among the existing correlations.

1. Introduction

The cycling process of an Organic Rankine Cycle (ORC) is similar to Rankine cycle except the working fluid is organic. ORC can harvest low grade energy such as geothermal energy, solar energy, etc. [1]. However, the thermal efficiency for typical ORC is comparatively low. By changing the subcritical cycle to the trans-critical cycle, the efficiency of ORC can be improved because a better temperature can be reached in the evaporator, and higher exergy is attainable [2,3,4]. However, the estimation to heat transfer performance in the supercritical heating process is much more difficult than the subcritical heating process due to the immense variations of physical properties in the critical/pseudo-critical regions [3].
Figure 1 shows the enormous variations of properties for R-22 [5] at a certain temperature, called the pseudo-critical point. At a pseudo-critical point at a certain specified pressure above the critical point, the specific heat capacity may achieve to the maximum, and the density, viscosity, and thermal conductivity decrease remarkably. Yet, the variations become even more pronounced when the pressure is close to the critical point.
The gigantic change of physical properties also results in huge change in heat transfer coefficients (HTC). Figure 2 shows the comparison of measured HTC against Dittus-Boelter correlation [5] for R-22. As depicted in the Figure, the correlation is applicable only at a lower heat flux (10 kW/m2) or at a temperature that is some distance away from the pseudo-critical point. A further rise in heat flux to 20 kW/m2 causes a significant over-prediction of the HTC, and it becomes more conspicuous with the heat flux. This phenomenon of reduction of HTC is called heat transfer deterioration (HTD) [6,7] and the lowest heat flux that leads to HTD is called limit heat flux (LHF) [5,8]. The phenomenon occurs due to the rapid change of density, which induces significant effects regarding buoyancy and acceleration [9,10,11]. In this regard, it is imperative to have an accurate correlation to predict the occurrence of HTD for supercritical fluid.
There have been many available correlations regarding HTD for inorganic fluids such as water and CO2 and can be found in typical review articles (e.g., Jackson [11], Pioro et al. [12], and Yoo et al. [13]). However, there is few research concerning the heat transfer performance of organic fluids. The investigation for organic fluids in smooth tubes are listed on Table 1 [5,14,15,16,17]. Most investigations applied the correlations that were developed from water or carbon dioxide to predict the performance of organic fluids. Yamashita et al. [5] commented that the Watts and Chou [18] correlation developed from water gives the best agreement against the experimental data for R-22. Zhang et al. [16] suggested that the correlation proposed by Jackson [19] shows the best agreement against the experimental data for R-134a. He et al. [17] recommended two correlations that were originally developed from water proposed by Yamagata et al. [8] and Jackson [19] upon the R-245fa experimental data. On the other hand, the existing correlations developed for water or carbon dioxide all fail to predict the experimental data regarding the onset of HTD [16,17]. Several studies have developed new empirical correlations for organic fluids. For example, Kang and Chang [14] proposed a modified correlation based on the Jackson and Fewster correlation [20], and reported a mean deviation of 20% in predicting the Nusselt number for 94.6% of their R-134a experimental data. Zhang et al. [16] proposed a new simple modified correlation Dittus-Boelter correlation [21] by adding an acceleration parameter. The correlation is in good agreement with their R-134a test data. Notice that the foregoing correlations are only applicable for their test data only and no general heat transfer correlation for organic fluids yet.
There were also some review papers regarding the heat transfer performance and the occurrence of HTD for supercritical water and carbon dioxide in the smooth tube [7,22,23]. Figure 3 compares the LHF against the mass flux of water, carbon dioxide, and the organic fluids investigated from the existing literature [5,14,15,16,17,23]. As shown in Figure 3, water contains the highest LHF among these fluids with the same mass flux, followed by the carbon dioxide, and lastly by the organic fluid. Comparing the criteria with the data of LHF, Yamagata’s criterion [8], which is developed by water, shows good agreement only with water. Kim’s criterion [24], which is developed based on carbon dioxide, is also only applicable for carbon dioxide. As can be clearly seen, both criteria over-predict the LHF of organic fluids, especially Yamagata’s criterion.
Moreover, the quantitative comparison with experimental data of LHF and the existing criteria in terms of polynomial form against the mass flux is listed in Table 2. The average deviation (AD) and standard deviation (SD) are defined [10] below:
A D = 1 N i = 1 N 2 ( LHF C LHF M ) i ( LHF C + LHF M ) i ,
S D = [ 1 N 1 i = 1 N ( A D 2 ( LHF C LHF M ) i ( LHF C + LHF M ) i ) ] 1 / 2 .
The criteria developed by water and carbon dioxide were discussed in the review by Huang et al. [23]. The result shows that the criteria can provide good predictions only for its database, extrapolations to other working fluids are normally futile. The criteria developed for water (e.g., Yin et al. [25], Yamagata et al. [8], Styrikovich et al. [26], and Mokry et al. [27]) could provide an absolute average deviation of below 0.6 and a standard deviation of less than 0.3. The criteria developed for carbon dioxide such as Kim et al. [24] could provide an absolute average deviation less than 0.3 with a standard deviation being lower than 0.6. However, it also reveals that these criteria over-predict the data of organic fluids, especially for those criteria developed for water. The average deviations are at least 0.5. Based on the aforementioned reviews, it was concluded that no appropriate criteria of LHF is applicable yet.
In view of the foregoing review, despite the fact that there were many studies concerning the predictions about the limit heat flux and the occurrence of the HTD in the literature, there were simply no general criteria and correlations for organic fluids. Hence, the objective of this study was to tailor and bridge the gap in developing the associated criteria and correlations for engineering elaborations. By collecting and analyzing exiting experimental data in the literature, the main objective of this study was to propose a new criterion to describe the heat transfer deterioration of supercritical organic fluids. Yet, a corresponding heat transfer correlation based on the experimental data was also developed that will be shown subsequently to offer a superior predictive ability to the existing correlations.

2. Materials and Methods

2.1. Data Analysis

The related studies [5,14,15,16,17] in association with organic fluids are tabulated in Table 3 and all the data points are included as the database for developing the criteria and correlations. Yamashita et al. [5] carried out the experiment for supercritical R-22 flowing upward in the vertical tube. The hydraulic diameter is 4.4 mm with the heated length of 2 m. Their range of operating condition included the pressure of 5.5 MPa, the mass flux of 400–2000 kg/m2∙s, and wall heat flux of 10–170 kW/m2. Kang and Chang [14] carried out the experiment for supercritical R-134a flowing upward in the vertical tube. The diameter of the test tube is 9.4 mm with a heated length of 2 m. The operating conditions were with the inlet pressure of 4.1, 4.3, and 4.5 MPa, respectively, while the wall heat flux is from 10 to 160 kW/m2⋅s and the mass flux ranges from 600 to 2000 kg/m2∙s. Jiang et al. [15] conducted an experiment of supercritical R-22 and ethanol. The diameter of the tube was 1.004 mm. Their wall heat flux ranged from 110 to 1800 kW/m2, while the fluid inlet Reynold number ranged from 3500 to 24000, and the pressure spanned from 5.5 MPa to 10 MPa. Zhang et al. [16] performed the experiment for the supercritical R-134a flowing upward in the vertical tube. The hydraulic diameter was 7.6 mm with the heated length of 2.3 m. Their operating conditions included the pressure of 4.3–4.7 MPa, the mass flux of 600–2500 kg/m2 s, and the wall heat flux of 20–180 kW/m2. He et al. [17] carried out the experiment for supercritical R-245fa flowing upward in the vertical tube. The hydraulic diameter is 4 mm with the heated length of 1.04 m. Operating conditions included the pressure of 4–5 MPa, the mass flux of 400–800 kg/m2∙s, and wall heat flux of 15–100 kW/m2.
Prior studies addressed some important factors on the thermofluids characteristics such as fluid flow condition, flow direction, geometry, etc. Yet, it was found that the buoyancy and acceleration effects impose severe effect on the heat transfer performance especially for the upward flowing conditions. Hence, this study stresses only for smooth tubes subject to upward flow conditions. To sum up, the fluid investigated includes R-22, R-134a, R-245fa, and ethanol. The total number of data used to develop the correlation is 4260. The diameter ranges from 1 to 10 mm, and the corresponding mass flux and heat flux ranges from 400–4000 kg/m2∙s, and 10–1800 kW/m2, respectively.

2.2. Data Reduction

Since part of the database only discloses the bulk enthalpy and wall temperature, the corresponding bulk temperature and corresponding physical properties were evaluated with the help of REFPROP ver. 8 [28] from the prescribed pressures and the bulk enthalpies. To further investigate the heat transfer performance, the heat transfer coefficient (HTC) was used and analyzed in the following:
HTC = q T w T b ,
where q represents the heat flux and Tw and Tb represent wall and bulk temperature, respectively. To facilitate detailed comparisons amid the proposed and some existing correlations, the HTC is further termed into dimensionless Nusselt number:
N u = HTC × D k ,
where D represents the diameter, and k is thermal conductivity. The collected experimental data is further analyzed through Matlab 2018b. Quantitative comparisons with experimental data of Nusselt number and the existing correlation are termed as the average deviation AD and the standard deviation SD [10] in the following:
A D = 1 N i = 1 N 2 ( N u C N u M ) i ( N u C + N u M ) i ,
S D = [ 1 N 1 i = 1 N ( A D 2 ( N u C N u M ) i ( N u C + N u M ) i ) ] 1 / 2 .

3. Results and Discussion

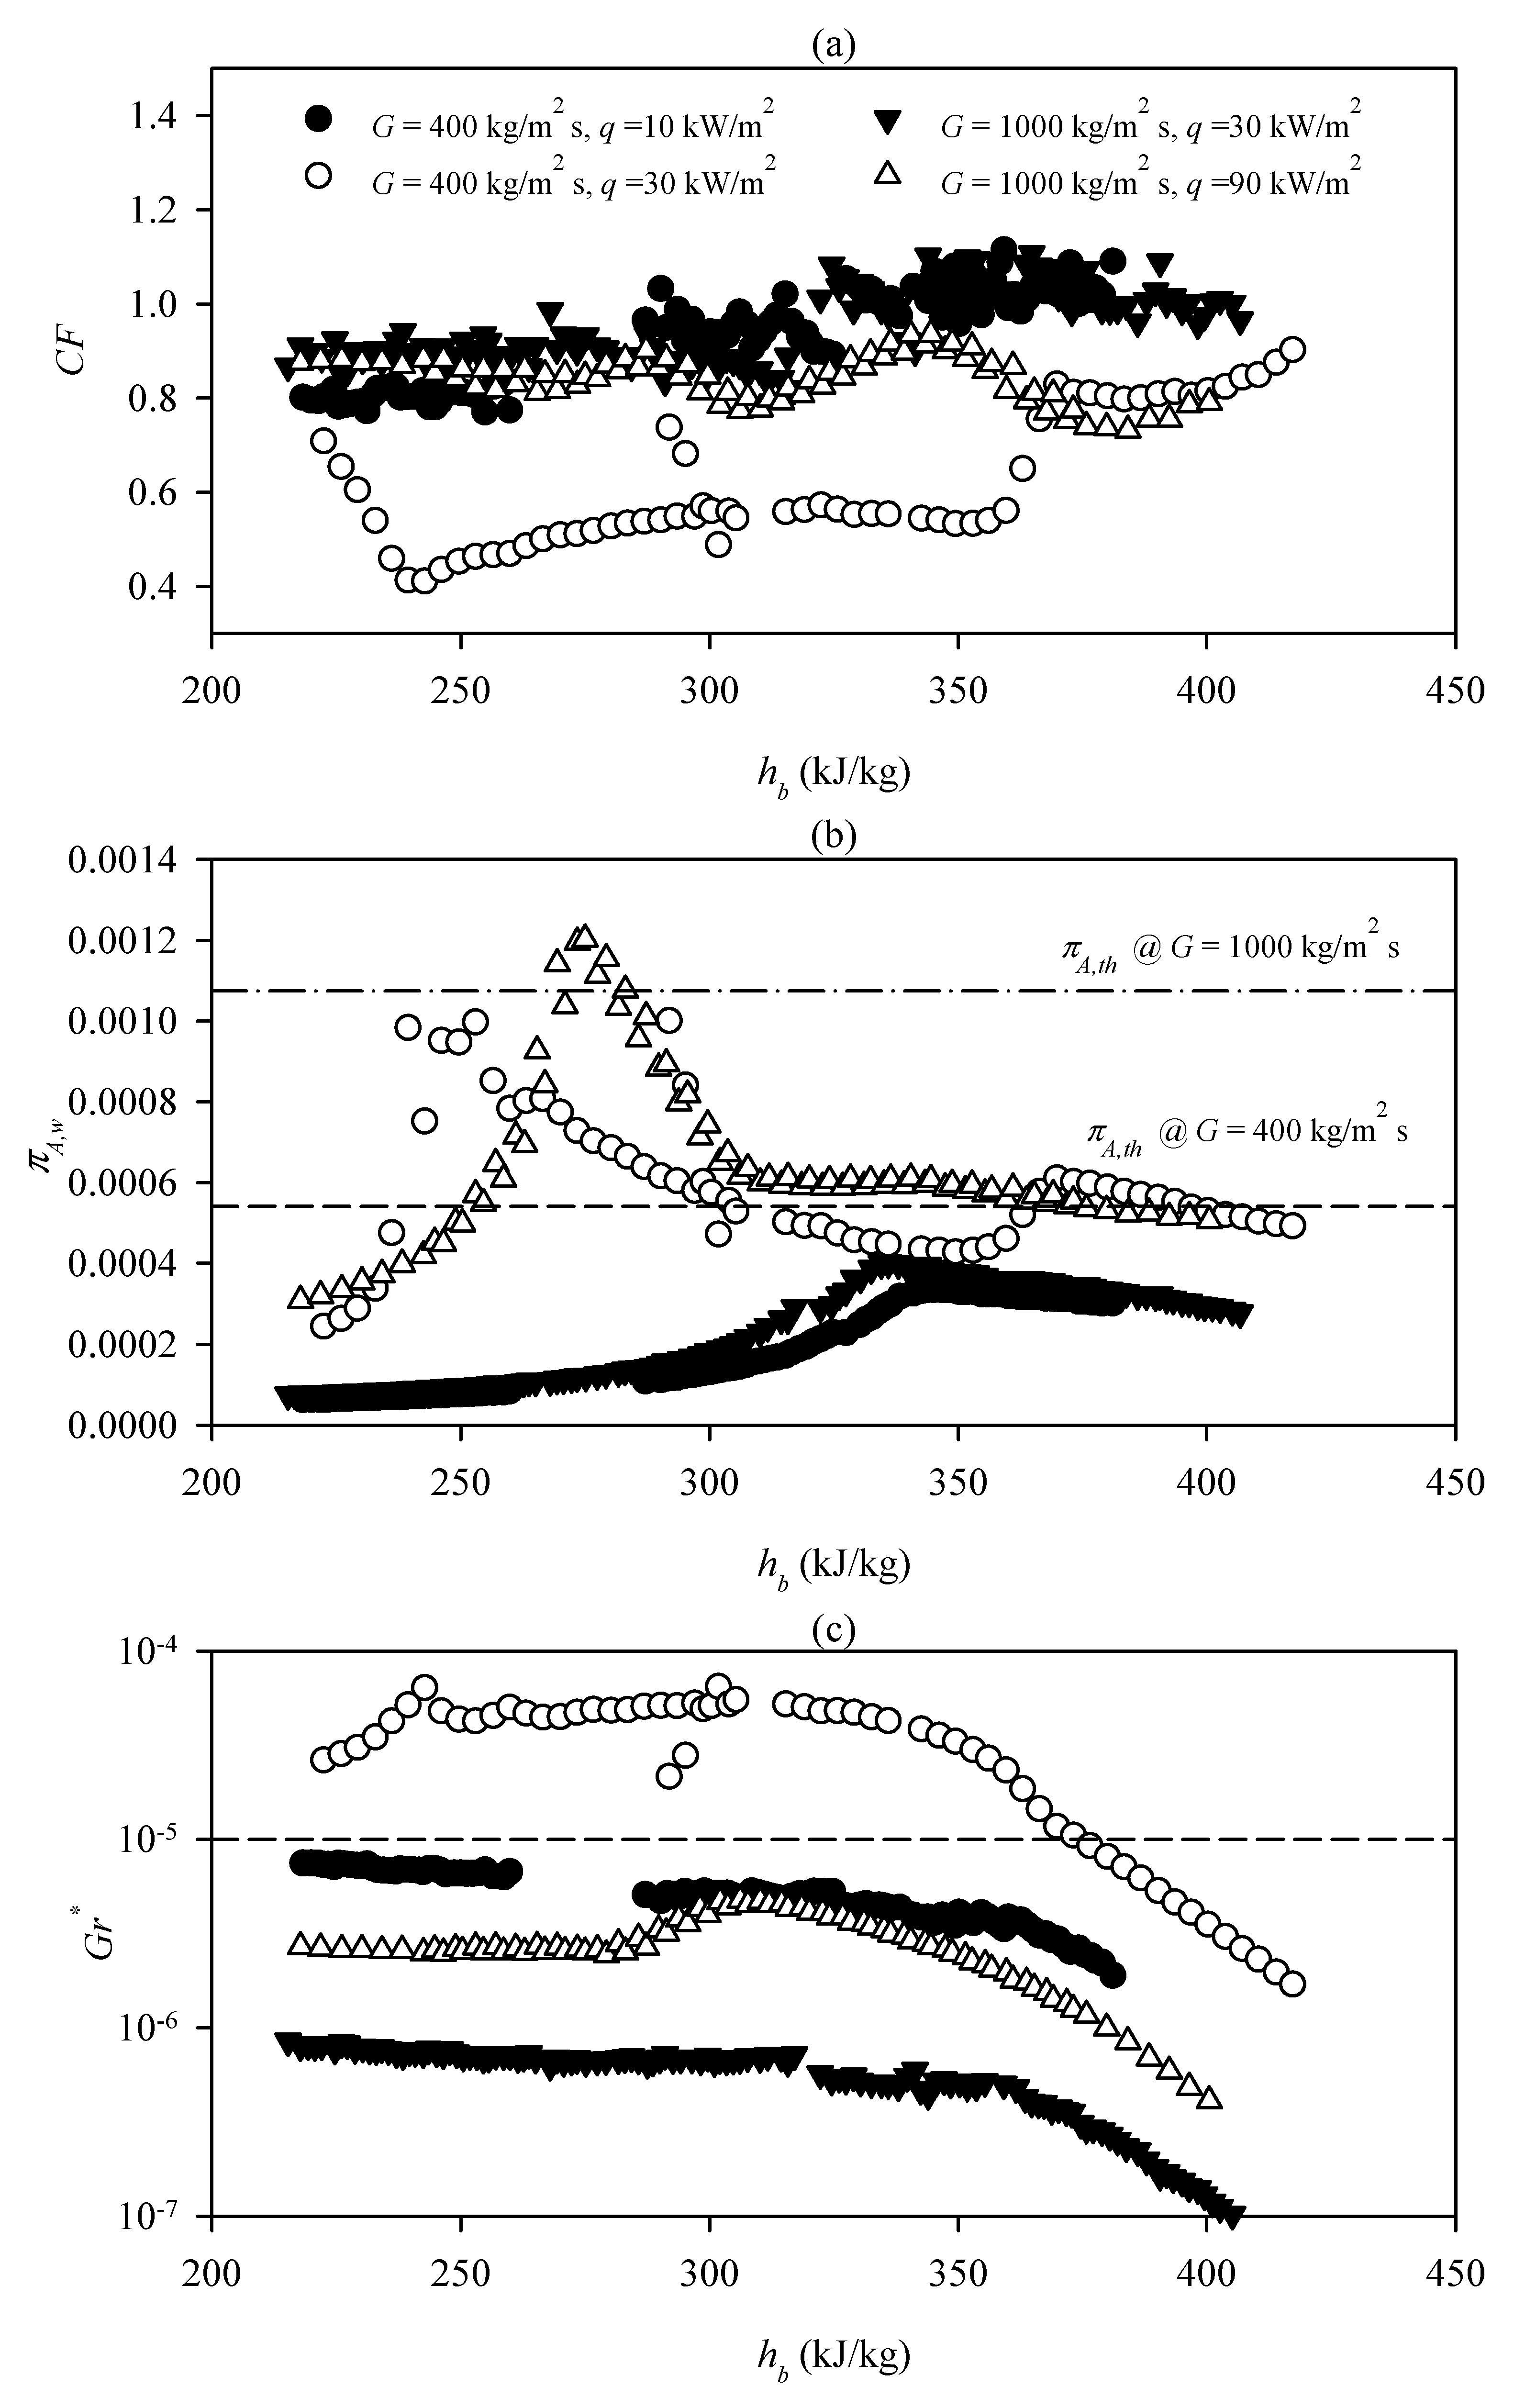
3.1. The Criterion of the Lowest Heat Flux for Heat Transfer Deterioration

Figure 4 shows the Nusselt number versus the enthalpy at different conditions from Yamashita et al. [5]. As addressed in prior studies, the effect of heat flux occurs only when buoyancy and acceleration effects is in control and this influence is accentuated nearby pseudo-critical regions. For a mass flowrate of 400 kg/m2∙s, the Nusselt number increases with enthalpy and then level-off appreciably when it reaches the vicinity of pseudo-critical enthalpy. The peak of Nusselt number becomes less profound when raising the heat flux. However, when heat flux achieves to a threshold value such as 30 kW/m2 (for G = 400 kg/m2∙s), the Nusselt number suddenly drops before the bulk temperature reaches the pseudo-critical temperature. In essence, HTD occurs accordingly.
At a mass flow rate of 1000 kg/m2∙s, the trend of HTD was similar to low mass flow rate of 400 kg/m2∙s. However, the Nusselt number of a mass flow rate of 1000 kg/m2∙s was higher than the one of 400 kg/m2∙s at lower enthalpy region for its much higher Reynolds number. Interestingly, at the heat flux at 30 kW/ m2, HTD did not happen at a mass flow rate of 1000 kg/ m2∙s as that of G = 400 kg/m2∙s. Instead, HTD occurred at a higher heat flux such as 90 kW/m2. It reveals the lowest heat flux leading the HTD, which is called limit heat flux (LHF) [5,8], which depends on mass flux.
As aforementioned, there were no appropriate criteria of LHF using polynomial forms for organic fluid. However, Cheng et al. [10] proposed a different polynomial form as the criterion of LHF (Equation (7)). The authors claimed that the property of fluid is included in the criterion:
LHF G = 1.354 10 3 C p P C β P C ,
where C p P C and β P C is specific heat capacity and thermal expansion coefficient at pseudo-critical condition, respectively.
Figure 5 shows a good agreement between the experimental LHF of water and carbon dioxide and the criterion of Cheng et al. [10]. Moreover, the criterion of Cheng et al. [10] contained the effect of pressure in comparison with Yamagata’s criterion [8]. Although the criterion by Cheng et al. [10] cannot predict the HTD of the organic fluids well, it revealed that the ratio of β to C p may affect the occurrence of HTD. The ratios are listed in Table 4, and it was found that the ratios for the organic fluids except ethanol ranging from 13 × 10−6 to 16 × 10−6 kg/J. The values were much higher than 1.79 × 10⁻⁶ kg/J of water and 8.80 × 10⁻⁶ kg/J of carbon dioxide at a near critical pressure. The higher ratios lead to the occurrence of HTD at a quite low heat flux due to the higher level of thermal expansion or the higher variety of density for given a heat flux or mass flux. The magnitude of the ratios of β to C p can explain the LHF of organic fluids that is lower than water and carbon dioxide at a given mass flux.
Until now, there is no criterion for organic fluid. It is difficult to use Cheng et al.’s form to develop the criterion for HTD of organic fluids. As a result, the study performed regression upon the experiment data and proposes a new criterion for the organic fluids as shown in the following:
LHF = 4.5 × 10 4 G 1.75 .
The correlation is valid for ratios ranging from 13 × 10-6 to 16 × 10-6 kg/J and the fluid of R-22, R-134a, and R-245fa. The quantitative comparison amid the experimental data and the criteria proposed by Cheng et al. [10] and the proposed criterion is shown as Table 5. It also reveals a good agreement between the experimental LHF of water and carbon dioxide and the criterion of Cheng et al [10]. However, their correlation showed a deviation of 0.650 for organic fluids, which is much higher than the standard deviation of 0.336 upon the proposed new criterion. Moreover, the absolute average deviation of 0.232 for organic fluids is lower than the deviation provided by the existing criteria form Table 2. In conclusion, the proposed new criterion of LHF for organic fluids shows the best predictive ability.

3.2. The onset of Laminarization and HTD

The occurrence of HTD is related to acceleration [9,11]. When the effect of acceleration is increased, the turbulence might be suppressed and the heat transfer performance decreases. The dimensionless form of acceleration factor is proposed by McEligot et al. [9] as K v (acceleration factor):
K v = ν b u b 2 u b x = D Re β p d p d x + 4 q w d β Re 2 μ b C p .
McEligot et al. [9] suggested that the flow changes from turbulent to laminar when K v is higher than 3 × 10⁻⁶. However, Jiang et al. [15] indicated that K v for R-22 is far less than the threshold value proposed by McEilgot et al. [9]. On the other hand, Cheng et al. [10] proposed a simpler parameter π A to describe the acceleration effect, which is defined as:
π A = D ρ ρ x = q β G C p .
Obviously, K v is more complex than π A . Hence, using π A is easier to implement from an engineering perspective and will be adopted in the following developments.
Figure 6, Figure 7 and Figure 8 depict the corresponding Nusselt number and acceleration factor π A at both bulk and wall condition versus enthalpy for R-22, R-134a, and R-245fa. It was found that the peak of π A is increased with a rise of heat flux. When compared with Nusselt number and π A at bulk condition, the Nusselt number will decrease first, followed by an increase against the enthalpy when π A passes through a certain value against the enthalpy. This is the basic cause for deterioration of heat transfer performance. Manipulation and combination of the criterion of LHF by Equation (8) and π A yields the corresponding threshold value:
π A , t h = LHF × β p c G C p p c .
The value shown as dash line in Figure 6 indicates that HTD does occur in the condition when the peak of π A is beyond the threshold. However, it cannot predict the location where HTD occurs in association with π A at bulk condition. Hence, π A at the wall condition should be also taken in account. By comparing Nusselt number and π A at wall condition, it is found that HTD occurs in the vicinity even after π A at wall condition approaches the threshold value. This correlation can predict the onset of HTD due to laminarization [9,11].

3.3. The Correlations of the Heat Transfer

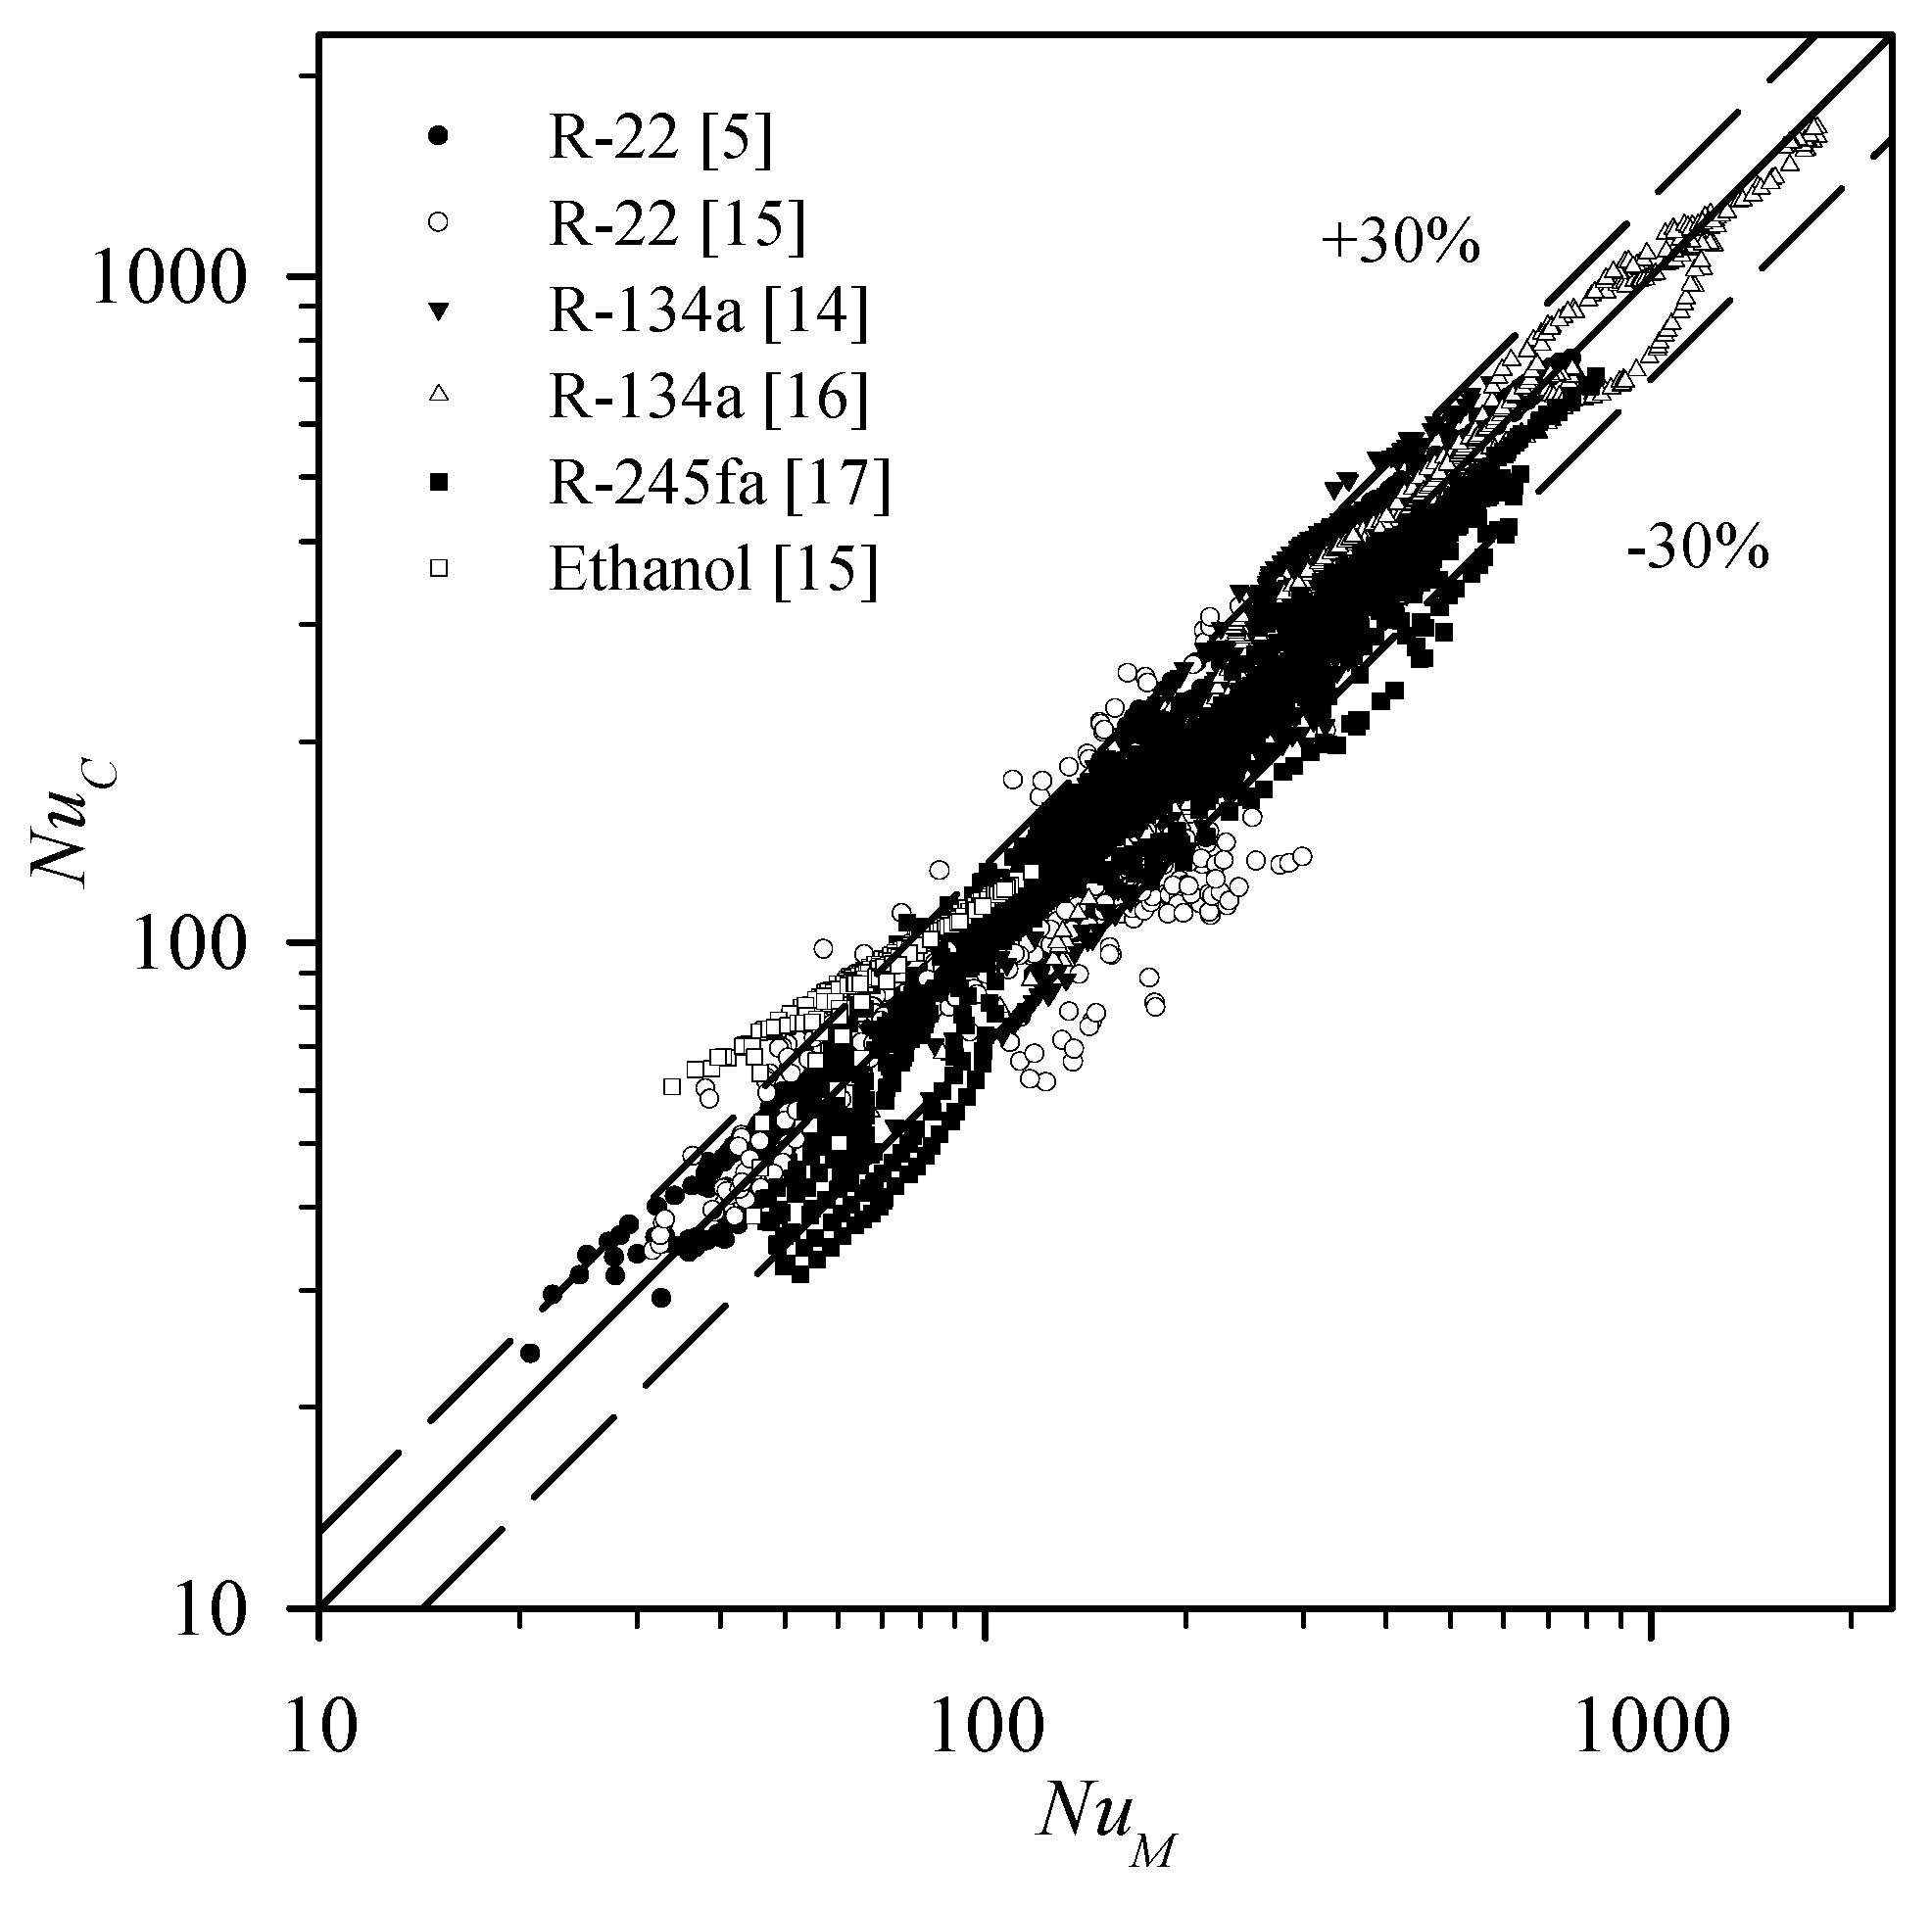
3.3.1. The Comparison Between the Experimental Data and the Existing Correlations

Table 6 lists some correlations that are employed for further comparison against the database from the literature.
Table 7 shows the comparisons between the experimental data and the existing correlations. The average deviation and standard deviation are defined in Eqs. (5-6) [10], which are used to compare the experimental data.
For the data of R-22, Kang and Chang’s correlation [14] provides the smallest average deviation of 0.068 and 0.014 against the data of Yamashita et al. [5] and Jiang et al. [15], respectively. The correlations of Watts and Chou [18] and Yamagata et al. [8] provide the smallest standard deviation of 0.169 and 0.462 against the database of Yamashita et al. [5] and Jiang et al. [15], respectively.
For the data of R-134a, Kang and Chang’s correlation [14] also provides the smallest average deviation of 0.117 and −0.040 against the data of both Kang and Chang [14] and Zhang et al. [16], respectively. The correlation of Yamagata et al. [8] provides the smallest standard deviation 0.150 and 0.099 against the database from Kang and Chang [14] and Zhang et al. [16], respectively.
For the data of R-245fa, Yamagata’s correlation [8] provides the smallest average deviation of 0.061, and Watts and Chou’s correlation [18] provide the smallest standard deviation.
For the data of ethanol from Jiang et al. [15], Zhang’s correlation [16] offers the smallest average value, and Yamagata’s correlation [8] provides the smallest standard deviation. For all data, Watts and Chou’s correlation [18] can provide the smallest average deviation (−0.017) and standard deviation (0.291) among these correlations.
Moreover, the performance of empirical correlation for heat transfer to supercritical organic fluid is listed Table 8. It reveals that Kang and Chang correlation [14] provides the predictive ability against the R-22 and R-134a data. Watts and Chou’s correlation [18] provides the best agreement against the R-245fa data. Zhang’s correlation [16] offers the best agreement against the ethanol data. Obviously, the best agreement is obtained if the correlation has the smallest either average or standard deviation. It implies that there are no existing correlations that are able to provide satisfactory agreement against all organic data. In fact, Watts and Chou’s correlation [18] shows the best overall predictive ability in which 73% of 4260 data falls within the ±30% span.

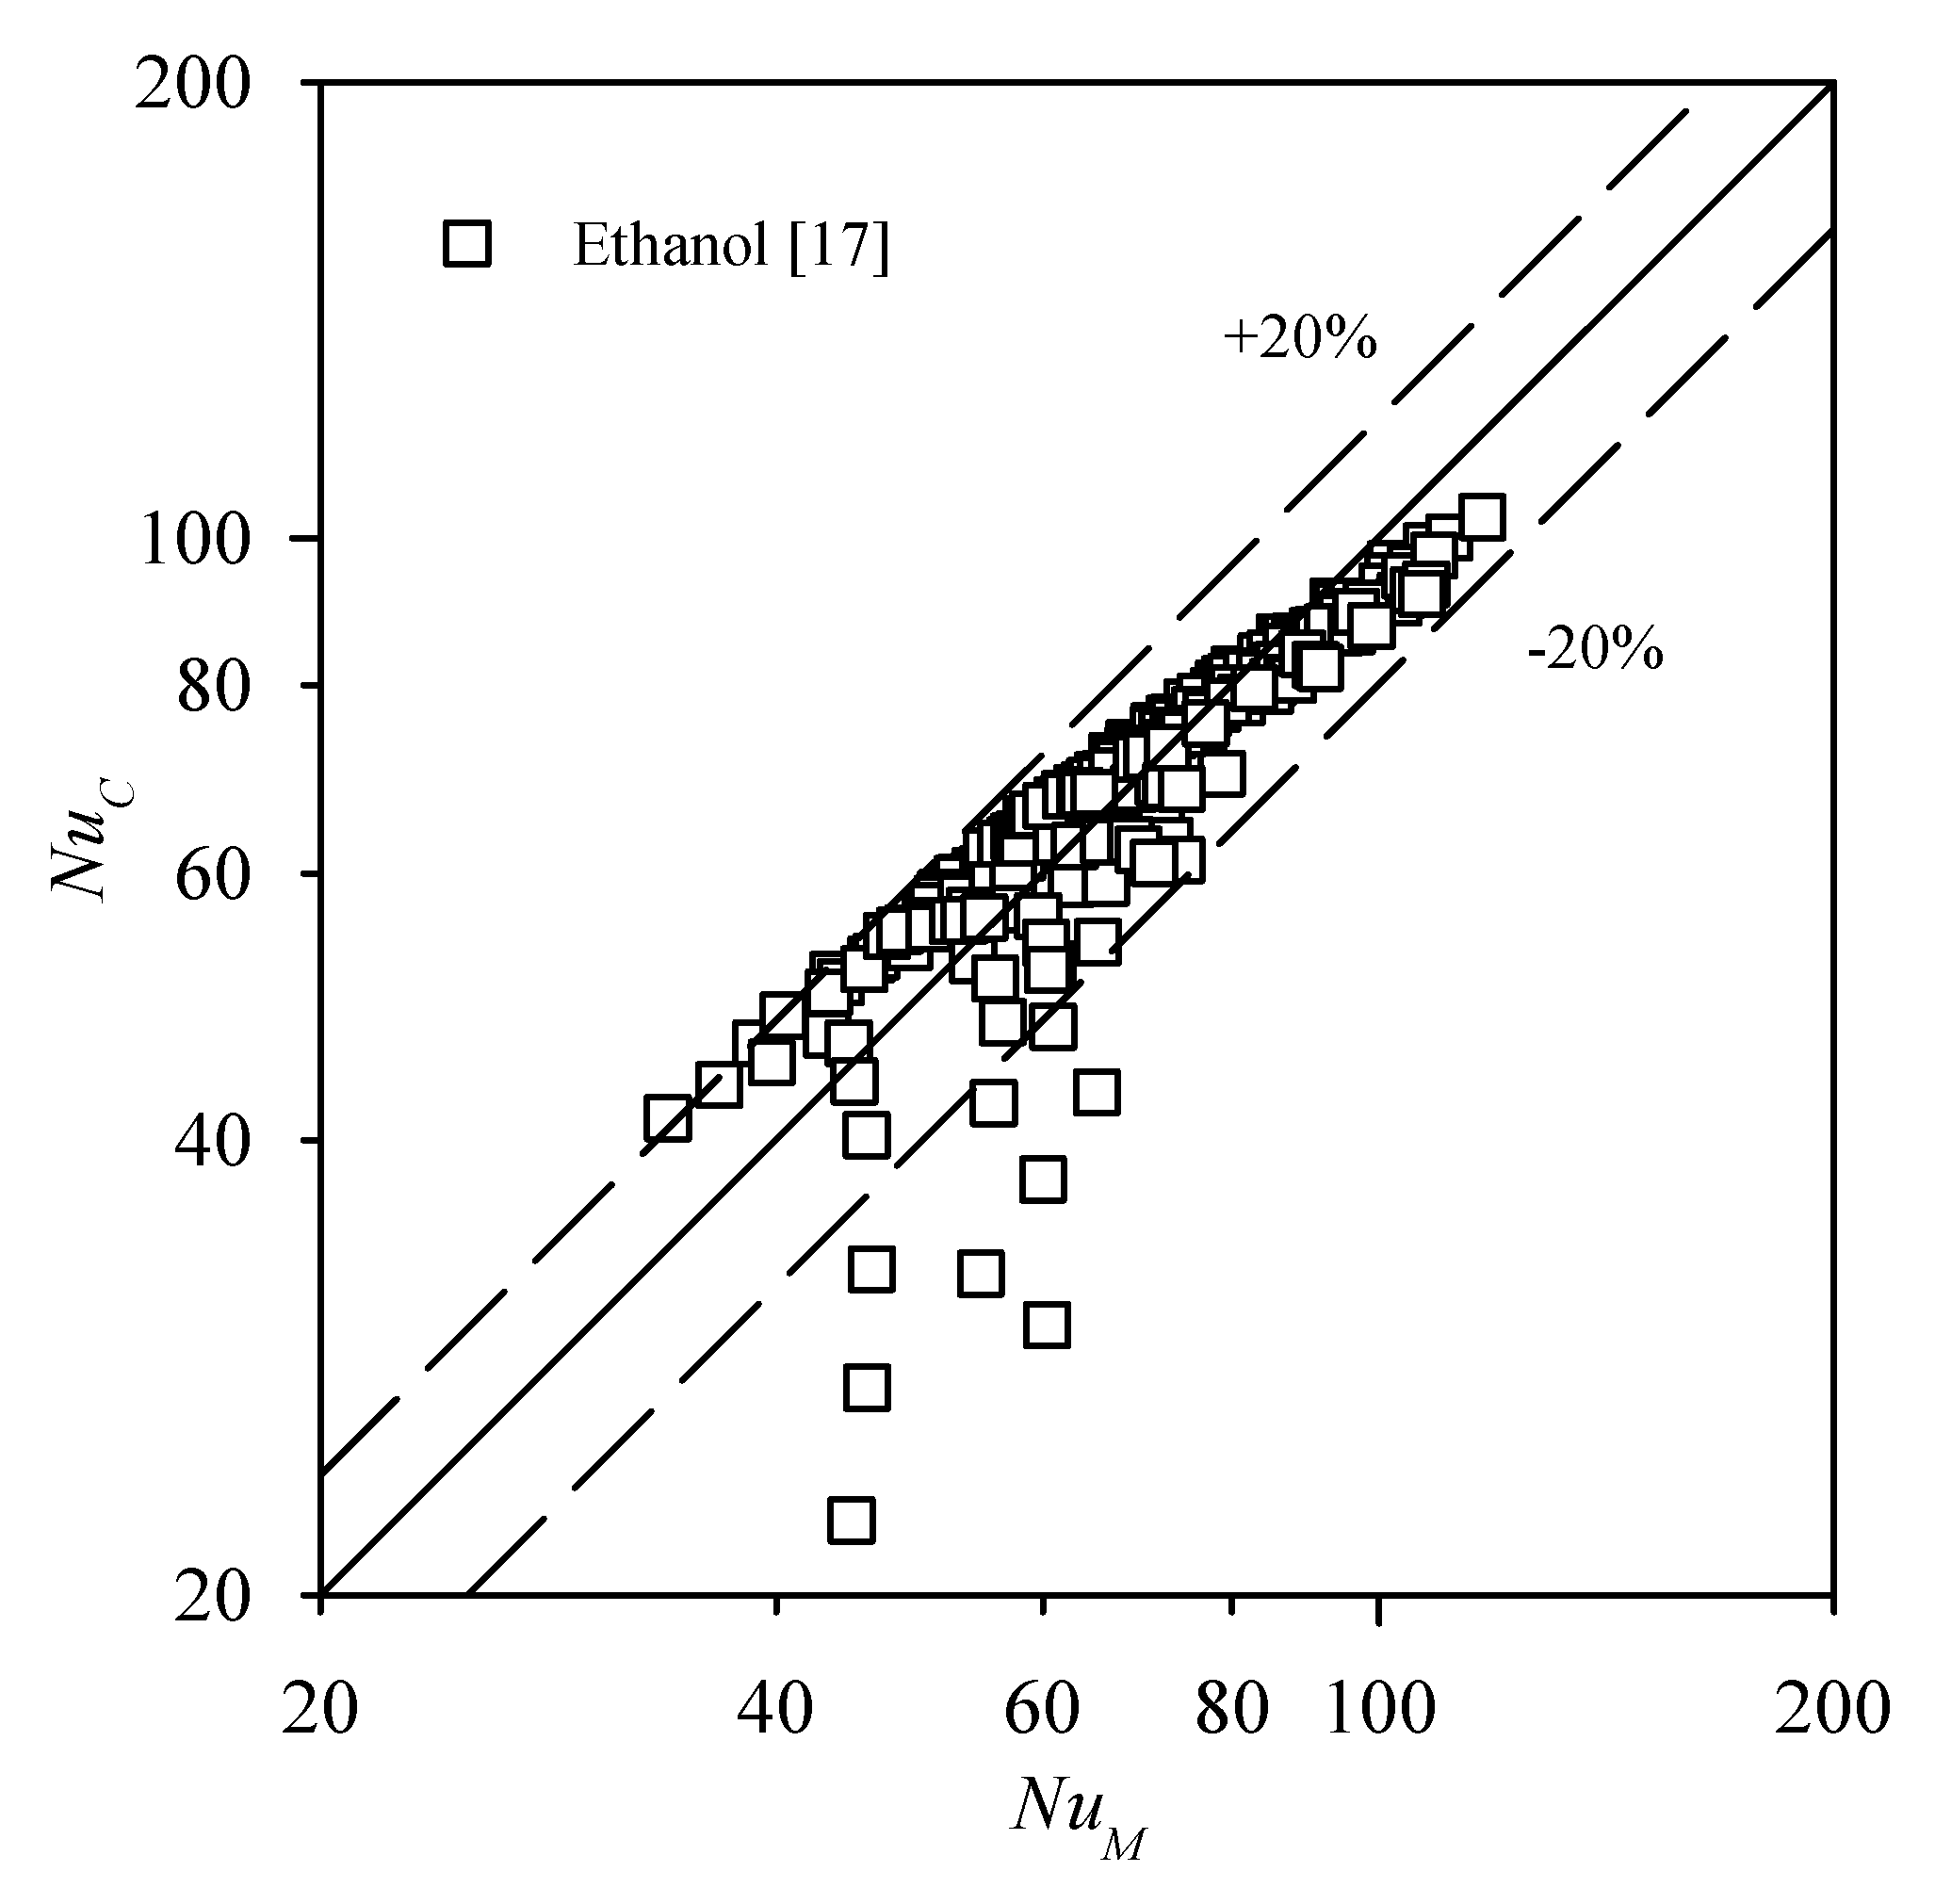
3.3.2. The Modified Correlation and Corresponding Correction Factor

From the above discussions, Watts and Chou’s correlation [18] provides the best overall predictive ability. Hence, efforts are made in modifying the correlation by introducing a rational dimensionless parameter, G r * , into the correlation. Figure 9 shows the correction factor (CF) proposed by Watts and Chou [18], π A at wall condition and G r * against enthalpy for R-22 [5]. Note that CF is defined as:
C F = N u 0.021 × R e 0.8 P r ¯ 0.55 ( ρ w / ρ b ) 0.35 .
It was found that the trend of G r * is more similar to Nusselt number as compared to π A at the wall condition. G r * is more appropriate as the correction factor for heat transfer. Moreover, the threshold proposed Watt and Chou [18] is valid for these organic fluids at lower mass flux. However, it is not applicable at a higher mass flux. Figure 9 shows G r * does not reach the threshold value even when HTD happens. The threshold may be revised to the baseline relative to the boundary condition. It is observed that the baseline of G r * increase with the heat flux and decrease with the mass flux, implying different resistance that limits HTD happening due to buoyancy force at different conditions. The change of the correction factor, however, almost correspond to the change of G r * whatever the heat and mass flux are. The baseline can be estimated using the local or bulk condition of the working fluids:
G r b a s e * = G r ¯ b R e b 2.7 P r ¯ b 0.5 ,
where G r ¯ i n l e t can be written as:
G r ¯ b = g ρ ( ρ   ρ ¯ ) D 3 μ 2 = ( ρ b ρ ¯ ) ( ρ b ρ w ) ( ρ b ρ w ) ρ b g D 3 ν 2 ( ρ ρ ¯ ) ( ρ ρ w ) g β Δ T D 3 ν 2 ,
where ρ ¯ is the density calculated by integration-averaging with temperature in between the wall and bulk conditions. In the subcritical region, the change of density with the temperature is quite small and ρ ¯ can be assumed as the arithmetic average density of the wall and bulk. The ratio of the change of density may be written below:
( ρ b ρ ¯ ) ( ρ b ρ w ) 0.5 .
The temperature difference between wall and bulk condition can be written as:
Δ T = q HTC .
In subcritical region, the buoyancy effect is much smaller than the inertia effect. The forced convection dominates. Hence, the Dittus-Boelter correlation can be applied to estimate the heat transfer coefficient:
HTC = k b D × 0.023 R e b 0.8 P r ¯ b 0.4 .
According to Equations (13–17), G r b a s e * can be written as:
G r b a s e * = 0.5 0.023 q g β D 4 k b ν 2 R e b 3.5 P r ¯ b 0.9 .
Figure 10 shows the effect of these dimensionless parameters such as π A , b , π A , w , G r * and G r * / G r b a s e * . The analysis includes six databases that are considered in this study. It shows the deviations of database pertaining to G r * / G r b a s e * is much better than other dimensionless parameters. As a consequence, G r * / G r b a s e * is selected as the correction factor for developing the new correlation. Eventually, the derived new correlation is as follows:
N u = 0.0219 × R e b 0.8 P r ¯ 0.55 ( ρ w / ρ b ) 0.35 ( G r * / G r b a s e * ) 0.58 .
The correlation takes the basic form from Watts and Chou [18]. Yet G r * is replaced by G r * / G r b a s e * as the correction factor and the fitting constant is slightly higher changing from 0.021 to 0.0219.
Figure 11 and Table 9 shows the comparison between the predictive Nusselt number and the experimental data all literature. From the table, the proposed correlation offers an average deviation of 0.007 and a standard deviation of 0.181 for all data (4260 in total). With the proposed correlation, Table 10 also indicates that 90% of the R-22 data, 94% of the R-134a data, and 95% of the R-245fa are within the range of ±30%. In essence, the proposed correlation yields the best predictive ability for the organic fluids except ethanol.
For ethanol, the study also provides another new correlation to estimate the heat transfer and show as:
N u = 0.0165 × R e b 0.8 P r ¯ 0.55 ( ρ w / ρ b ) 0.35 ( G r * / G r b a s e * ) 0.8 .
Figure 12 shows the new correlation for ethanol that is in good agreement with the experimental data from Jiang et al. [15]. Additionally, 96% of the ethanol data are within ±20% of predictions.

4. Conclusions

This study investigated the heat performance of organic fluids for smooth tubes with fluid flowing upward. The organic fluids include R-22, R-134a, R-245fa, and ethanol. It was found that the limit heat flux for organic fluid near the critical point is much smaller than that of the water and carbon dioxide due to the difference in the ratio of the thermal expansion coefficient and the specific heat capacity. The study presents a new criterion of limit heat flux (LHF) for organic fluids and the proposed criterion of LHF for organic fluid is superior to the existing criteria. The correlation shows an average deviation of -0.232 and a standard deviation of 0.336 for organic fluid.
In the investigation about the onset of the heat transfer deterioration, acceleration parameter imposes a significant effect on the onset of heat transfer deterioration (HTD) due to laminarization. The acceleration parameter, π A , imposed appreciable influence on the heat transfer deterioration. For accurate assessment of HTD, the estimation for threshold π A should be at the wall condition rather than at the bulk condition. The threshold π A is strongly related to the limit heat flux and property at the pseudo-critical point.
Based on the evaluations of the existing correlations against existing data, it was found that most correlations are only applicable to their own datasets. Through detailed analysis of the prior data and correlations, the non-dimensional parameter G r * offers better predictive ability of the heat transfer coefficient for organic fluids. The correlation takes the basic form from Watts and Chou [18]. Yet, G r * is replaced by G r * / G r b a s e * as the correction factor. The new correlation can provide the smallest average deviation of 0.007 and standard deviation of 0.181 against all data among these common correlations for supercritical conditions. The 90% of 4260 data are within the range of ±30% of the presented correlation. It is the best among other correlations. On the other hand, the study also presents another new correlation for ethanol due to the worse agreement of previously presented correlation, and 96% of the 262 data for ethanol are within the range of ±20% of the correlation.

Author Contributions

All the authors have contributed their efforts to complete the paper. Conceptualization, Y.-M.L. and C.-C.W.; Formal analysis, Y.-M.L.; Funding acquisition, J.-S.L. and C.-C.W.; Methodology, Y.-M.L.; Supervision, J.-S.L. and C.-C.W.; Writing—original draft, Y.-M.L.; Writing—review and editing, C.-C.W. All authors have read and agreed to the published version of the manuscript.

Funding

This research was funded by the Bureau of Energy, Ministry of Economic Affairs of Taiwan and Ministry of science and technology, Taiwan, grant number 108-2622-E-009-027-CC2 and 108-2221-E-009-037-MY3.

Acknowledgments

The authors are indebted to the financial support from the Bureau of Energy, Ministry of Economic Affairs of Taiwan, and grants from Ministry of science and technology, Taiwan.

Conflicts of Interest

The authors declare no conflict of interest.

Nomenclature

AArea, m2
ADAverage deviation
CCorrelation constant
CFCorrection factor
CpSpecific heat capacity, kJ/kg∙K
C p ¯ Integrated average specific heat capacity, kJ/kg∙K
DDiameter, m
EEckert number defined by the correlation of Yamagata et al. [8]
FCorrection factor defined by the correlation of Zhang et al. [16]
GMass flux, kg/m2∙s
gGravity acceleration, 9.81 m/s2
GrGrashof number
G r ¯ Grashof number estimated by integrated average density
Gr*Buoyancy criterion defined by the correlation of Watts and Chou [18]
hEnthalpy, kJ/kg
kThermal conductivity, W/m∙K
KvAcceleration factor proposed by McEligot et al. [9]
NNumber of data
minMinimum operator
nExponent of dimensionless factor
NuNusselt number
PPressure, MPa
PrPrandtl number
P r ¯ Integrated average Prandtl number
qHeat flux, kW/m2
ReReynolds number
SDStandard deviation
TTemperature, K
uVelocity, m/s
xUnit length of flow direction, m
Greek letter
β Thermal expansion coefficient, 1/K
μ Dynamics viscosity, Pa∙s
ν Kinematic viscosity, m2/s
ρ Density, kg/m3
ρ ¯ Integrated average density, kg/m3
π A Acceleration parameter proposed by Cheng et al. [10].
ξ Fanning fiction factor
Subscript
bBulk condition
baseBaseline
CCalculated value
iIndex
MMeasured value
pcPseudo-critical condition
thThreshold
wWall condition
Abbreviations
HTCHeat transfer coefficient
HTDHeat transfer deterioration
LHFLimit heat flux
ORCOrganic Rankine cycle

References

  1. Hung, T.-C.; Shai, T.; Wang, S.K. A review of organic Rankine cycles (ORCs) for the recovery of low-grade waste heat. Energy 1997, 22, 661–667. [Google Scholar] [CrossRef]
  2. Schuster, A.; Karellas, S.; Aumann, R. Efficiency optimization potential in supercritical Organic Rankine Cycles. Energy 2010, 35, 1033–1039. [Google Scholar] [CrossRef]
  3. Karellas, S.; Schuster, A.; Leontaritis, A.-D. Influence of supercritical ORC parameters on plate heat exchanger design. Appl. Therm. Eng. 2012, 33–34, 70–76. [Google Scholar] [CrossRef]
  4. Chen, H.; Goswami, D.Y.; Rahman, M.M.; Stefanakos, E.K. A supercritical Rankine cycle using zeotropic mixture working fluids for the conversion of low-grade heat into power. Energy 2011, 36, 549–555. [Google Scholar] [CrossRef]
  5. Yamashita, T.; Yoshida, S.; Mori, H.; Morooka, S.; Komita, H.; Nishida, K. Heat transfer study under supercritical pressure conditions. In Proceedings of the GENES4/ANP2003, Kyoto, Japan, 15–19 September 2003. [Google Scholar]
  6. Petukhov, B. Heat transfer and friction in turbulent pipe flow with variable physical properties. In Advances in Heat Transfer; Elsevier: Amsterdam, The Netherlands, 1970; Volume 6, pp. 503–564. [Google Scholar]
  7. Pioro, I.L.; Duffey, R.B. Experimental heat transfer in supercritical water flowing inside channels (survey). Nucl. Eng. Des. 2005, 235, 2407–2430. [Google Scholar] [CrossRef]
  8. Yamagata, K.; Nishikawa, K.; Hasegawa, S.; Fujii, T.; Yoshida, S. Forced convective heat transfer to supercritical water flowing in tubes. Int. J. Heat Mass Transf. 1972, 15, 2575–2593. [Google Scholar] [CrossRef]
  9. McEligot, D.; Coon, C.; Perkins, H. Relaminarization in tubes. Int. J. Heat Mass Transf. 1970, 13, 431–433. [Google Scholar] [CrossRef]
  10. Cheng, X.; Yang, Y.H.; Huang, S.F. A simplified method for heat transfer prediction of supercritical fluids in circular tubes. Ann. Nucl. Energy 2009, 36, 1120–1128. [Google Scholar] [CrossRef]
  11. Jackson, J.D. Fluid flow and convective heat transfer to fluids at supercritical pressure. Nucl. Eng. Des. 2013, 264, 24–40. [Google Scholar] [CrossRef]
  12. Pioro, I.L.; Khartabil, H.F.; Duffey, R.B. Heat transfer to supercritical fluids flowing in channels—Empirical correlations (survey). Nucl. Eng. Des. 2004, 230, 69–91. [Google Scholar] [CrossRef]
  13. Yoo, J.Y. The turbulent flows of supercritical fluids with heat transfer. Annu. Rev. Fluid Mech. 2013, 45, 495–525. [Google Scholar] [CrossRef]
  14. Kang, K.-H.; Chang, S.-H. Experimental study on the heat transfer characteristics during the pressure transients under supercritical pressures. Int. J. Heat Mass Transf. 2009, 52, 4946–4955. [Google Scholar] [CrossRef]
  15. Jiang, P.-X.; Zhao, C.-R.; Liu, B. Flow and heat transfer characteristics of r22 and ethanol at supercritical pressures. J. Supercrit. Fluids 2012, 70, 75–89. [Google Scholar] [CrossRef]
  16. Zhang, S.; Gu, H.; Cheng, X.; Xiong, Z. Experimental study on heat transfer of supercritical Freon flowing upward in a circular tube. Nucl. Eng. Des. 2014, 280, 305–315. [Google Scholar] [CrossRef]
  17. He, J.; Dang, C.; Hihara, E. Experimental investigation of heat transfer to supercritical R245fa flowing vertically upward in a circular tube. Int. J. Heat Mass Transf. 2018, 127, 286–295. [Google Scholar] [CrossRef]
  18. Watts, M.J.; Chou, C.T. Mixed convection heat transfer to supercritical pressure water. In Proceedings of the 7th International Heat Transfer Conference, Munchen, Germany, 6–10 September 1982. [Google Scholar]
  19. Jackson, J.D. Consideration of the heat transfer properties of supercritical pressure water in connection with the cooling of advanced nuclear reactors. In Proceedings of the 13th Pacific Basin Nuclear Conference, Shenzhen, China, 21–25 October 2002. [Google Scholar]
  20. Jackson, J.D.; Fewster, J. Forced Convection Data for Supercritical Pressure Fluids; Report No. HTFS 21540; Simon Engineering Laboratory, University of Manchester: Manchester, UK, 1975. [Google Scholar]
  21. Dittus, F.; Boelter, L. Heat transfer in automobile radiators of the tubular type. Int. Commun. Heat Mass Transf. 1985, 12, 3–22. [Google Scholar] [CrossRef]
  22. Duffey, R.B.; Pioro, I.L. Experimental heat transfer of supercritical carbon dioxide flowing inside channels (survey). Nucl. Eng. Des. 2005, 235, 913–924. [Google Scholar] [CrossRef]
  23. Huang, D.; Wu, Z.; Sunden, B.; Li, W. A brief review on convection heat transfer of fluids at supercritical pressures in tubes and the recent progress. Appl. Energy 2016, 162, 494–505. [Google Scholar] [CrossRef]
  24. Kim, J.K.; Jeon, H.K.; Yoo, J.Y.; Lee, J.S. Experimental study on heat transfer characteristics of turbulent supercritical flow in vertical circular/non-circular tubes. In Proceedings of the 11th International Topical Meeting on Nuclear Reactor Thermal Hydraulics (NURETH 11), Avignon, France, 2–6 October 2005; p. 85. [Google Scholar]
  25. Yin, F.; Chen, T.-K.; Li, H.-X. An Investigation on Heat Transfer to Supercritical Water in Inclined Upward Smooth Tubes. Heat Transf. Eng. 2007, 27, 44–52. [Google Scholar] [CrossRef]
  26. Styrikovich, M.; Margulova, T.K.; Miropol’Skii, Z. Problems in the development of designs of supercritical boilers. Therm. Eng. 1967, 32, 4–7. [Google Scholar]
  27. Mokry, S.; Pioro, I.; Farah, A.; King, K.; Gupta, S.; Peiman, W.; Kirillov, P. Development of supercritical water heat-transfer correlation for vertical bare tubes. Nucl. Eng. Des. 2011, 241, 1126–1136. [Google Scholar] [CrossRef]
  28. Lemmon, E.; Huber, M.; McLinden, M. Reference fluid thermodynamic and transport properties–REFPROP Version 8.0. In NIST Stand. Ref. Database; 2007; 23. Available online: https://www.nist.gov/publications/nist-standard-reference-database-23-reference-fluid-thermodynamic-and-transport-0?pub_id=50520 (accessed on 2 April 2007).
  29. Krasnoshchekov, E.; Protopopov, V.; Van, F.; Kuraeva, I. Experimental investigation of heat transfer for carbon dioxide in the supercritical region. In Proceedings of the 2nd All-Soviet Union Conference on Heat and Mass Transfer, Minsk, Belarus, 5–9 May 1964; pp. 26–35. [Google Scholar]
Figure 1. The enormous variations of physical properties for R-22 at a pressure of 5.5 MPa [5], where ρ is density, Cp is specific heat capacity, μ is viscosity, and k is thermal conductivity, respectively.
Energies 13 00989 g001
Figure 2. The comparison of experimental data for R-22 and Dittus-Boelter correlation [5], where hb and hpc signify bulk enthalpy and the enthalpy at the pseudo-critical point, respectively.
Energies 13 00989 g002
Figure 3. Comparisons of the limit heat flux (LHF) between correlations and experimental data against the mass flux for water, carbon dioxide and the organic fluids [5,14,15,16,17,23].
Energies 13 00989 g003
Figure 4. Nusselt number vs. the enthalpy subject to the heat flux and mass flux [5].
Energies 13 00989 g004
Figure 5. Comparison between experimental LHF and the criterion proposed by Cheng et al. [10].
Energies 13 00989 g005
Figure 6. (a) Nusselt number, (b) π A at both bulk and (c) wall condition vs. enthalpy for R-22 at mass flux of 400 kg/ m2∙s subject to heat fluxes [5].
Energies 13 00989 g006
Figure 7. (a) Nusselt number, (b) π A at both bulk and (c) wall condition vs. enthalpy for R-134a at mass flux of 600 kg/ m2∙s subject to heat fluxes [16].
Energies 13 00989 g007
Figure 8. (a) Nusselt number, (b) π A at both bulk and (c) wall condition vs. enthalpy for R-245fa at mass flux of 400 kg/ m2∙s subject to heat fluxes [17].
Energies 13 00989 g008
Figure 9. (a) CF proposed by Watts and Chou [18], (b) π A at wall condition, and (c) G r * against enthalpy for R-22 [5].
Energies 13 00989 g009
Figure 10. The deviation of pertaining to (a) π A , b , (b) π A , w , (c) G r * , and (d) G r * / G r b a s e * .
Energies 13 00989 g010
Figure 11. Comparison of Nusselt numbers between the proposed correlation and all experimental data.
Energies 13 00989 g011
Figure 12. The comparison between the measured and calculated Nusselt number for ethanol.
Energies 13 00989 g012
Table 1. Investigations for performance of the heat transfer coefficient (HTC) and heat transfer deterioration (HTD) for organic fluids in smooth tube at supercritical region [5,14,15,16,17].
ReferenceOrganic FluidInvestigation of Limit Heat FluxRecommended
Correlation
New Correlation Ability to Predict others’ Data
Yamashita et al. [5]R-22YesWatts and Chou [18]NoNo
Kang and Chang [14]R-134aNoNoYesYes
Jiang et al. [15]EthanolYesNoNoNo
Jiang et al. [15]R-22YesNoNoNo
Zhang et al. [16]R-134aYesJackson [19]YesNo
He et al. [17]R-245faYesYamagata et al. [8], Jackson [19]NoNo
Table 2. The criteria and predicted the average deviation (AD) and standard deviation (SD) of the LHF of water and carbon dioxide [23].
ReferencesCriterionFor WaterCarbon DioxideOrganic Fluids
Yin et al. [25] LHF = 1 2.16 G WaterAD
SD
−0.535
0.198
1.138
0.181
1.293
0.448
Yamagata et al. [8] LHF = 0.2 G 1.2 WaterAD
SD
−0.119
0.216
1.358
0.180
1.551
0.243
Styrikovich et al. [26] LHF = 0.58 G WaterAD
SD
−0.323
0.208
1.279
0.159
1.407
0.394
Kim et al. [24] LHF = 0.0002 G 2 CO2AD
SD
−1.470
0.189
−0.299
0.581
0.584
0.387
Mokry et al. [27] LHF = 58.97 + 0.745 G WaterAD
SD
−0.232
0.211
1.219
0.417
1.471
0.324
Table 3. The experimental data from the literatures [5,14,15,16,17].
ReferencesFluidNL (m)D (mm)P (MPa)G
(kg/m2∙s)
q
(kW/m2)
Tb
(°C)
Tw
(°C)
Yamashita et al. [5]R-2292724.4 5.5400–200010–17012–12026–154
Kang and Chang [14]R-134a56029.44.1–4.5600–200010–16049–11359–188
Jiang et al. [15]Ethanol262 0.1521.0045.5–102000–4000110–180023–11046–326
Jiang et al. [15]R-223450.1521.0045.5–102000–4000110–180022–18341–384
Zhang et al. [16]R-134a5302.37.64.3–4.7600–250020–18074–10786–182
He et al. [17]R-245fa16361.0444–5400–80015–100100–195121–234
Table 4. The ratio of β to C p for water, carbon dioxide, and organic fluids.
FluidP (MPa) β p c / C p p c ×   10 6   ( kg / J )
Water22.61.79
CO27.58.80
R-225.513.43
R-134a4.315.27
R-245fa415.77
4.513.23
Table 5. The criteria of the LHF of water and carbon dioxide [23].
AuthorCriterionFor WaterCarbon DioxideOrganic Fluids
Cheng et al. [10] LHF G = 1.354 10 3 C p P C β P C WaterAD
SD
−0.069
0.213
0.199
0.271
0.111
0.650
This study LHF = 4.5 × 10 4 G 1.75 OrganicAD
SD
-
-
-
-
−0.232
0.336
Table 6. Some correlations used for comparisons against the experimental data subject to supercritical conditions.
AuthorsCorrelationFluid
Dittus-Boelter [21] N u = 0.023 R e b 0.8 P r b 0.4
R e b = G D / μ b
P r b = μ b C p b / k b
Water
Krasnoshchekov et al. [29] N u = ( ξ / 8 ) R e b P r ¯ 12.7 ξ / 8 ( P r ¯ 2 / 3 1 ) + 1.07 ( ρ w / ρ b ) 0.3 ( C p ¯ / C p b ) n
ξ = ( 1.82 log 10 R e b 1.64 ) 2
P r ¯ = μ b C p ¯ / k b
C p ¯ = ( h w h b ) / ( T w T b )
n = { 0.4 f o r T w / T p c 1 o r 1.2 T b / T p c n 1 = 0.22 + 0.18 ( T w / T p c ) f o r 1 T w / T p c 2.5 n 1 + ( 5 n 1 2 ) [ 1 ( T b / T p c ) ] f o r 1 T b / T p c 1.2
Water, Carbon dioxide
Yamagata et al. [8] N u = 0.0135 R e b 0.85 P r b 0.8 C F
C F = { 1 f o r E > 1 0.67 P r p c 0.05 ( C p ¯ / C p b ) n 1 f o r 0 E 1 ( C p ¯ / C p b ) n 2 f o r G r * < 0
E = ( T p c T b ) / ( T w T b )
n 1 = 0.77 ( 1 + 1 / P r p c ) + 1.49
n 2 = 1.44 ( 1 + 1 / P r p c ) 0.53
Water
Jackson and Fewster [20] N u = 0.0183 R e b 0.82 P r ¯ 0.5 ( ρ w / ρ b ) 0.3 Water
Watts and Chou [18] N u = 0.021 R e b 0.8 P r ¯ 0.55 ( ρ w / ρ b ) 0.35 C F ( G r * )
C F ( G r * ) = { 1 f o r G r * < 10 5 ( 1 3000 G r * ) 0.295 f o r 1 0 5 G r * 10 4 ( 7000 G r * ) 0.295 f o r G r * > 10 4
G r * = G r ¯ R e b 2.7 P r ¯ 0.5
G r ¯ = ρ b ( ρ b ρ ¯ ) g D 3 / μ b 2
ρ ¯ = 1 ( T w T b ) T b T w ρ ( T ) d T
Water
Jackson [19] N u = 0.0183 R e b 0.82 P r b 0.5 ( ρ w / ρ b ) 0.3 ( C p ¯ / C p b ) n
n = { 0.4 f o r T b < T w < T p c o r 1.2 T p c < T b < T w 0.4 + 0.2 ( T w / T p c 1 ) f o r T b < T p c < T w 0.4 + 0.2 ( T w / T p c 1 ) [ 1 5 ( T b / T p c 1 ) ] f o r T p c T b 1.2 T p c a n d T b < T w
Water
Kang and Chang [14] N u = 0.0244 R e b 0.762 P r ¯ 0.552 ( ρ w / ρ b ) 0.293 R-134a
Zhang et al. [16] N u = 0.023 R e b 0.8 P r b 0.4 C F
C F = min ( F 1 , F 2 )
F 1 = 1.0 + 1936 π A 1.059
F 2 = 5.19 0.817 ln π A
π A = q β b G C p b
R-134a
Table 7. Comparisons between the experimental data and the correlations.
Correlation R-22R-22R-134aR-134aR-245faEthanolTotal
Yamashita et al. [5]Jiang et al. [15]Kang and Chang [14]Zhang et al. [16]He et al. [17]Jiang et al. [15]
Dittus-Boelter [21] N
AD
SD
927
0.252
0.342
345
0.298
0.556
560
0.358
0.382
530
0.048
0.390
1636
−0.164
0.366
262
−0.071
0.227
4260
0.065
0.433
Krasnoshchekov et al. [29]N
AD
SD
927
0.165
0.297
345
−0.062
0.586
560
0.125
0.340
530
0.093
0.323
1636
−0.226
0.278
262
0.044
0.216
4260
−0.025
0.369
Yamagata et al. [8]N
AD
SD
927
0.439
0.175
345
0.252
0.462
560
0.505
0.150
530
0.367
0.099
1636
0.061
0.287
262
0.780
0.171
4260
0.300
0.329
Jackson and Fewster [20]N
AD
SD
927
0.207
0.184
345
0.050
0.467
560
0.226
0.157
530
0.063
0.112
1636
−0.194
0.241
262
0.143
0.202
4260
0.021
0.294
Watts and Chou [18]N
AD
SD
927
0.165
0.169
345
−0.026
0.477
560
0.162
0.158
530
0.012
0.105
1636
−0.228
0.232
262
0.232
0.195
4260
−0.017
0.291
Jackson [19]N
AD
SD
927
0.209
0.188
345
0.045
0.468
560
0.237
0.183
530
0.047
0.142
1636
−0.195
0.246
262
0.130
0.200
4260
0.019
0.301
Kang and Chang [14]N
AD
SD
927
0.068
0.272
345
0.014
0.468
560
0.117
0.172
530
−0.040
0.174
1636
−0.311
0.310
262
0.114
0.225
4260
−0.086
0.339
Zhang et al. [16]N
AD
SD
927
0.319
0.246
345
-0.554
1.201
560
0.261
0.380
530
0.080
0.195
1636
−0.372
0.532
262
0.027
0.226
4260
−0.072
0.608
Table 8. Comparisons of the predictive ability of heat transfer coefficient at supercritical states between the existing correlations and the test data for organic fluids.
Correlation R-22R-134aR-245faEthanolTotal
Dittus-Boelter [21]N
±20%
±30%
1272
42
55
1090
48
61
1636
25
52
262
55
87
4260
37
57
Krasnoshchekov et al. [29]N
±20%
±30%
1272
30
55
1090
32
48
1636
50
64
262
70
82
4260
40
58
Yamagata et al. [8]N
±20%
±30%
1272
11
20
1090
0
7
1636
47
67
262
0
0
4260
22
34
Jackson and Fewster [20]N
±20%
±30%
1272
43
69
1090
66
76
1636
48
68
262
62
72
4260
51
70
Watts and Chou [18]N
±20%
±30%
1272
52
72
1090
76
86
1636
47
69
262
47
59
4260
55
73
Jackson [19]N
±20%
±30%
1272
45
68
1090
63
73
1636
45
68
262
63
73
4260
50
69
Kang and Chang [14]N
±20%
±30%
1272
63
74
1090
78
89
1636
18
43
262
63
77
4260
50
66
Zhang et al. [16]N
±20%
±30%
1272
21
38
1090
46
64
1636
42
52
262
74
85
4260
39
52
Table 9. Comparisons between the experimental data and the proposed correlation.
Correlation R-22R-22R-134aR-134aR-245faEthanolTotal
Yamashita et al. [5]Jiang et al. [15]Kang and Chang [14]Zhang et al. [16]He et al. [17]Jiang et al. [15]
Present studyN
AD
SD
927
0.076
0.090
345
−0.059
0.292
560
0.043
0.196
530
−0.013
0.124
1636
−0.084
0.137
262
0.279
0.105
4260
0.007
0.181
Table 10. The predictive ability of the proposed correlation for heat transfer coefficient of supercritical organic fluids.
Correlation R-22R-134aR-245faEthanolTotal
Presented studyN
±20%
±30%
1272
82
90
1090
70
94
1636
86
95
262
16
42
4260
76
90

