Article

Performance Analysis of a Stirling Engine Hybrid Power System

by
Pablo Jimenez Zabalaga
1,*,
Evelyn Cardozo
1,
Luis A. Choque Campero
1,2 and
Joseph Adhemar Araoz Ramos
1
1
Facultad de Ciencias y Tecnología, Universidad Mayor de San Simón, Cochabamba 2500, Bolivia
2
Department of Energy Technology, School of Industrial Technology and Management (ITM), KTH Royal Institute of Technology, SE-100 44 Stockholm, Sweden
*
Author to whom correspondence should be addressed.
Energies 2020, 13(4), 980; https://doi.org/10.3390/en13040980
Submission received: 31 December 2019 / Revised: 13 February 2020 / Accepted: 17 February 2020 / Published: 21 February 2020

Abstract

:
The Bolivian government’s concerns that are related to reducing the consumption of diesel fuel, which is imported, subsidized, and provided to isolated electric plants in rural communities, have led to the implementation of hybrid power systems. Therefore, this article presents the performance analysis in terms of energy efficiency, economic feasibility, and environmental sustainability of a photovoltaic (PV)/Stirling battery system. The analysis includes the dynamic start-up and cooling phases of the system, and then compares its performance with a hybrid photovoltaic (PV)/diesel/battery system, whose configuration is usually more common. Both systems were initially optimized in size using the well-known energy optimization software tool, HOMER. An estimated demand for a hypothetical case study of electrification for a rural village of 102 households, called “Tacuaral de Mattos”, was also considered. However, since the characteristics of the proposed systems required a detailed analysis of its dynamics, a dynamic model that complemented the HOMER analysis was developed using MATLAB Simulink TM 8.9. The results showed that the PV/Stirling battery system represented a higher performance option to implement in the electrification project, due to its good environmental sustainability (69% savings in CO2 emissions), economic criterion (11% savings in annualized total cost), and energy efficiency (5% savings in fuel energy conversion).

Graphical Abstract

1. Introduction

The role of electricity is essential for the economic and social development in a community [1]. Unfortunately, around 850 million people around the world do not have access to electricity. Likewise, many more suffer from a low-quality service, generally in rural areas [2]. Under this consideration, developing countries are making strenuous efforts to sponsor the expansion of electricity generation systems in remote areas. Although fossil fuel generators (especially diesel), are the main source of electricity in many rural communities worldwide, the growing energy demand, the unstable prices of fossil fuels, the depletion of oil resources, as well as the growing concern about greenhouse gas emissions, are incrementing the use of renewable energy sources [3]. Consequently, a hybrid power system could represent a promising solution for isolated communities. This type of system integrates diverse renewable and non-renewable technologies and storage components with an appropriate operation and control strategy [4,5]. Despite the benefits of hybrid energy systems, they confront several challenges such as the forecasting of uncertain renewable energy potential, the evolution of energy consumption through time [6], and the mathematical modeling of components’ operation, which, nowadays, is imperfect [7].
In Bolivia, around 25.18% of the inhabitants of rural areas do not have access to electricity [8]. According to the Electricity and Social Control Authority (Autoridad de Fiscalización y Control Social de Electricidad, AE), the residential sector of the isolated electrical generation systems represented 6.64% (183.90 MW) of the total electric power generated in the country in 2018. In their majority, these systems are composed of fossil fuel generators (97%) and arrays of photovoltaic modules (3%). Additionally, they are located in the northern and eastern populations of the country; most users are concentrated in Beni Department, with almost 58% of the 145,499 total users of these isolated systems [9]. Therefore, the largest community without electrical energy access in Beni Department has been selected as a case study.
A concern of the Bolivian government is diesel import, which is carried out by a state-owned oil and gas company of Bolivia (Yacimientos Petrolíferos Fiscales Bolivianos, YPFB) and provided to the operators of plants in the isolated electrical systems at a subsidized price of USD $0.16/L, despite the fact that the market cost to import the mentioned fuel is over USD $1.30/L [10]. Therefore, the Bolivian government has been promoting projects for the hybridization of thermoelectric remote plants in order to reduce the consumption of diesel in electricity generation. The photovoltaic (PV)/diesel/battery hybrid plants installed in the city of Cobija and in the community of El Espino are examples of this trend [11,12]. The first plant is composed of 5 MW PV panels, 1.1 MWh lithium-ion batteries, and 11 MW diesel gensets and was inaugurated on 24 July 2015 [13,14]. The plant is located in El Espino and consists of 60 kW, 509 kWh lead-acid batteries, and 60 kW diesel generators, and was inaugurated on 22 October 2015 [15,16].
Considering the information provided above, this study aims to evaluate the performance of a hybrid system comprised of PV panels, a Stirling engine, and batteries, and then compare it with a typical PV/diesel/battery system in order to provide clean, reliable and low-cost electricity to a rural community in Bolivia. The selection of components of the proposed system was based on the availability of natural resources in the zone. Specifically, the Stirling engine technology was chosen as it denotes a suitable alternative to generate electrical power in remote regions where biomass resource is accessible according to research works made in Brazil and Bolivia [17,18,19,20]. In addition, the use of wood pellets as a fuel resource increases the energy efficiency, reduces handling, storage, transport costs [21], and improves the quality, stability, and durability of the agro-industrial waste as compared with the use of raw wood material [22].
This paper is organized as follows: A literature review regarding the generalities, renewable fuel sources, simulation approaches, and the integration in a hybrid power system of Stirling engines is described in Section 2. Section 3 develops the main goals and the methodology of this work. Next, inputs and assumptions regarding the optimization of the systems are detailed in Section 4. Section 5 specifies the main equations and algorithms used to develop dynamic models. Then, the performance indices are explained in Section 6. Optimization, simulation, and performance analysis results including their discussion are presented in Section 7. Our conclusions are stated in Section 8.

2. Literature Review

2.1. Overview of the Stirling Engine Technology

A Stirling engine is an external heating machine which operates in a closed and regenerative thermodynamic cycle. This engine utilizes a gaseous working fluid (air, nitrogen, hydrogen, and helium) which moves through three heat exchangers (heater, cooler, and regenerator). On the one hand, the heater absorbs heat from a source. On the other hand, the cooler releases heat to a sink. These two processes lead to a temperature difference in the system. Furthermore, the regenerator is located between the two aforementioned parts and acts as a thermal storage. Finally, mechanical work is generated as a consequence of the net conversion of heat energy due to the cyclic compression and expansion of the working gas [23,24]. Stirling engines are attractive because of their high theoretical thermodynamic efficiency (near Carnot cycle efficiency), low noise, and multifuel capability, especially for renewable or waste sources such as biomass, waste heat, and solar energy. Moreover, the external combustion is related to minimum values of pollution and the closed cycle leads to a simple and reliable mechanical design [25]. With respect to downsides, Stirling engines possess large dead volume, weight, relatively low compression ratio, limited output power (commercial sizes ranging from 1 to 10 kWe), and real electrical efficiency between 10% and 40% due to various energy losses [26,27]. Finally, yet importantly, there is no precise model related to the performances nor a widely design methodology of the engines [28]. Therefore, current research on these type of heat machines focuses on the following:
  • Geometric features such as heater, cooler, regenerator configurations, and cylinders capacity [29,30,31,32,33];
  • Operating conditions (pressure and rotational speed) and performance characteristics (overall efficiency, power, heat exchangers effectiveness, heat losses, and energy dissipation) [34,35], and other studies have focused on additional parameters such as concentration ratio, hot and cold temperature, working fluid, and absorber temperature in order to analyze a solar dish solution [36,37,38,39];
  • Combined methodologies using the three parameters previously mention such as the optimization of geometric and operating parameters of a beta Stirling engine [40], the development of an experimental free-piston engine used in a micro combined heat and power system [41], and the implementation of a new control method related to a variable-speed operation of a dish Stirling system [42].

2.2. Utilization of Alternative Renewable Resources to Fuel Stirling Engines

Although most commercial models of Stirling machines run on fossil fuels, these engines possess high potential for using alternative sources (i.e., solar energy and biomass) with elevated overall efficiencies [43]. Related to solar power, a parabolic collector is used in order to reflect solar radiation and produce thermal energy which is first transformed into mechanical energy and, then, into electrical energy. In addition, solar dish systems have shown the highest solar to electricity conversion net efficiency [44]. Bataineh performed a study of a dish Stirling system, and found that the maximum thermal efficiency for this kind of technology was 32%, having an absorber temperature of 850 K and a concentration ratio of 1300 [45], whereas solar dish systems are quite heavy, around 100 kg/m2 [46].
Regarding biomass, systems that use this source are generally applied in combined heat and power (CHP) solutions such as wood pellets stoves and boilers [47]. Cardozo et al. [48] evaluated the experimental integration of a wood pellet burner of 20 kWth and a gamma Stirling engine of 1 KWel. Their work centered on the effects of a diverse type of pellets, combustion chamber, and cycling operation of Stirling engine related to temperatures and thermal power. Although biomass has attractive characteristics such as good combustion and high availability, the development of domestic small and micro-CHP systems fueled with the resource are still limited [49,50]. This is due to difficulties related to ash content (fouling and slagging) and reduction of flue gas temperature close to the Stirling engine [51]. However, industries such as Sunmachine and Sunpower have built commercial biomass micro-CHP systems [52]. Recently, ÖkoFEN, which is an Austrian company, launched a pellet boiler with an integrated Stirling engine, called Pellematic Condens_e. Its nominal thermal output is around 9 kWth and its rated electrical power is up to 0.6 kWel [53,54]. Furthermore, a Swedish company, Inresol AB, developed a multifuel CHP system (Genius) composed of a Stirling Engine (V2-6), which was able to provide 15 kW of heat and produce up to 5 kW of electrical energy [55,56].

2.3. Stirling Engine Modeling Approaches

Annex 42, developed by the International Energy Agency (IEA), establishes three main types of models related to Stirling engine microgeneration systems [57]. First, there are empirical models, which liberate themselves from the theoretical laws of physical phenomena involved and can be compared to the so-called “black box” models. This type of approach is extremely limited to a specific product and under achieved test conditions. Thiers et al. [58] proposed a quasi-static model of a Stirling engine biomass microcogenerator that was based on experimental correlations from the Sunmachine Pellet prototype. Veitch and Mahkamov developed an empirically performance model of WhisperGen Mk Vb, a Stirling engine fueled by gas [59,60]. Conroy et al. worked on a dynamic and empirical model on the basis of field tests of the gas microcogenerator Stirling Mk 4 from WhisperGen [61].
The second type of approach is related to the semi-physical models which involve modeling a physical phenomenon by an empirical method but using a theoretical basis. Usually, these models are called “gray box” models. Beausoleil-Morrison et al. [57] and Ferguson [62] carried out a physical and parametric model that could be utilized for biomass applications and was based on the work of Annex 42 of the IEA. In summary, Annex 42 discretizes the generator into three control volumes and differentiates four transient phases, standby, warm-up, steady state, and cool down. Lombardi et al. [63] modified the mentioned model by adding a linear method to it. Ulloa et al. [64] proposed a simple model of Whispergen DC PPS16-24MD engine running on diesel. Their work was carried on TRNSYS and was based on lumped-mass blocks and an optimized performance (GenOpt). The proposed methodology is applicable to other Stirling engines, predicting adequately the behavior of an engine under steady-state, start-up, and shutdown periods.
Finally, there is the fully physical approach which makes use of the theoretical laws of a given domain, modeling analytically or numerically a system. These models are commonly called: “white box” models. Schulz and Schwendig [65] modeled a global Stirling cycle, then, Kongtragool and Wongwises [66] studied the impact of dead volumes. Organ [67] programmed the first computational fluid dynamics (CFD) code for a Stirling engine and Mahkamov [68] developed a CFD script for a biomass Stirling engine. These models were originally developed for the understanding and evaluation of internal phenomena and for the optimization of the design. Shih [69] developed a dynamic model of a gamma-type Stirling engine with a capacitive harvester, which considered the heat, mechanical, and electric conversion of energy. In this study, energy inside the engine is divided in three parts, mechanical, air, and friction.
This review shows that the first type of model is experimentally restricted, and thus is not generalizable. Moreover, this approach lacks precision. However, the physical models could be extended for different engines, but needs a lot of input data, and more computational time. The semi-physical models could be more flexible, generalizable, and could concentrate the physical modeling on the variables of interest. Consequently, this modeling approach offers a good compromise between precision, calculation time, and generalization among diverse machines [70].

2.4. Hybrid Power Systems Base on Stirling Engine Technology

Few studies that had addressed the utilization of a Stirling engine in hybrid power systems were found. Balcombe et al. performed two analyses related to a combined heat and power (SHP) system composed of PV panels, and a Stirling engine fueled with natural gas and batteries. The first work focused on the environmental impacts of the aforementioned system, which were estimated using a life-cycle assessment and compared to a solution based on a gas boiler and electricity grid for households in United Kingdom (UK). This study suggested that the impacts were reduced by 35% to 100% as compared with conventional electricity and heat supply. Moreover, these results were shown to be highly affected by the operation of the system [71]. The second article centered on the system’s electricity self-sufficiency which led to an approximately 70% value and showed that the hybrid system was only feasible for households with an equal or higher electrical consumption of 4300 kWh/yr [72]. Both articles explored and simulated a system with the same components of the system presented in this paper, but they assumed fixed start-up and shutdown periods related to the Stirling engine with no useful generation of energy during those times. Arco Sola et al. [20] and Ljunggren Falk et al. [19] performed an optimization of a PV/Stirling/battery system in order to cover the electricity demand in a Bolivian rural community. Nonetheless, energy performance of the system was only considered, excluding the economic and environmental aspects. Other studies [73,74,75] focused on modeling and simulation of a hybrid power system that included a dish Stirling solar engine and a wind turbine. Nevertheless, power generation of Stirling engine was considered to always be in steady-state mode.

3. Objectives and Methodology

As it is mentioned in literature review, Stirling engine hybrid energy systems have been investigated in some studies. Nonetheless, the possibility to integrate a Stirling engine with PV panels and batteries in order to cover the electricity demand in an isolated system is not explore thoroughly enough. In addition, modeling related to Stirling engine hybrid power systems uses simplified approaches that do not take into account the dynamics related to technologies, especially the Stirling engine.
Therefore, this research addresses the performance related to energy efficiency, economic feasibility, and environmental sustainability of a PV/Stirling/battery system as compared to a hybrid PV/diesel/battery system since using diesel fuel is one of the most common solutions for power generation in rural areas. A case for both systems was presented and took into account the electric load of a rural community in Bolivia named “Tacuaral de Mattos". Moreover, the completion of the work lead to development of dispatch strategies for hybrid power systems under transient conditions and a computational tool that could be used to evaluate different configurations of microgrids and other control strategies. It is important to highlight that a simplified version of this study was presented at the 32nd International Conference on Efficiency, Cost, Optimization, Simulation, and Environmental Impact of Energy Systems (ECOS 2019) [76], and then received an invitation to publish it in this journal.
Due to the complexity of hybrid power systems, three software were selected, one to create daily load profiles for rural consumers (LoadProGen), another for sizing (HOMER), and the other for open architecture research (MATLAB/Simulink). Specifically, LoadProGen (Load Profile Generator) is an open source software implemented in MATLAB to formulate hourly or minute profiles of electricity demand in rural localities. Its algorithm uses a stochastic bottom-up approach with correlations between load profile parameters (i.e., coincidence factor, load factor, and number of consumers) in order to create realistic load demands [77]. HOMER (Hybrid Optimization Model for Electric Renewables) is a computational model for micropower solutions designed by the National Renewable Energy Laboratory (NREL). It assists by finding the optimized group of systems which fulfil the energy demand under specific system constraints and input assumptions [78]. In the optimization process, this computing tool simulates several system configurations searching for the best architecture that satisfies the technical limitations at the lowest life cycle cost [79]. In this way, HOMER uses the enumeration method, which considers all possible cases, ensuring that the best solution is found, but requiring high calculation time [80].
The paper has proposed a methodology that started with an economic optimization. Next, a dynamic modeling approach of the different components was developed in Simulink using the sizing results from HOMER. The Simulink model of Stirling engine is semi-physical model that allows variations of the time step of the simulation, and thus evaluates the dynamics of the technology. After that, two simulations of the systems were carried out, one through the winter solstice and the other through an entire year. Finally, the performance analysis was executed by considering the following three metrics: Fuel saving ratio (FSR) for energy evaluation, CO2 emission reduction ratio (CO2ERR) for environmental evaluation, and annualized total cost saving ratio (ATCSR) for economic evaluation. Hence, the methodology and general approach of the current study is presented in Figure 1.

4. Economic Optimization

Two models, that consisted of solar PV panels, a solar inverter, a battery bank, bidirectional inverter, and a generator (diesel genset/Stirling engine), were implemented in HOMER Pro v 3.10. In the following section, the inputs and assumptions of the models such as meteorological data and energy resources for the selected location, load demand for the community, the specification of components, and their respective costs are detailed.

4.1. Geographical Site Selection

The first choice made within the design process was the selection of the site where the electric generation systems would be implemented. In this specific case, it is assumed that hybrid microgrids should provide electricity to a community in Beni Department, called “Tacuaral de Mattos”. This is located southwest of José Ballivián province, inside the municipality of San Borja and lies between a latitude and longitude of −14.993° S, −66.537° W [81]. Unfortunately, the community is one of the localities that is not connected to the national electricity grid and has the largest number of houses without electricity access in the department. Furthermore, it was estimated that it had an average of 102 households and a population of 527 inhabitants by the year 2017 [82].

4.2. Primary Energy Sources

In this section, primary energy sources and their availability are identified and explained briefly. Solar radiation and average ambient temperature data were extracted from Meteonorm v.7.1.3 software database, which generates hourly and minute values related to meteorological resources [83].

4.2.1. Solar Energy

Bolivia is located in a strip of territory which receives high solar radiation. Furthermore, some other factors are favorable, such as low cloudiness and diverse geographical profile, that lead to a usable natural resource in almost all of the country and during the entire year [84]. The average amount of global solar radiation in the eastern lowlands, where the studied community is situated, lies between 3.9 and 5.1 kWh/m2/day [85]. According to the Meteonorm data, Tacuaral de Mattos has an annual average solar power of 4.6 kWh/m2/day. The monthly average global horizontal solar radiation of this town is shown in Figure 2.

4.2.2. Biomass Resources

The departments of Santa Cruz, Beni, Pando and the northern region of La Paz possess a high biomass potential (around 1000 m2/km2/year) as a result of the abundance of agro-industrial and forestry resources in the area [86]. However, biomass is mostly used as heat sources in Bolivian rural households [87]. In the region under study, there were 162 species of timber trees and 20 species of palm trees [88]. Thus, these resources could be utilized, in coordination with good forestry regulations, to generate electricity.

4.2.3. Temperature

The municipality, to which the community belongs, is between 220 to 235 m above sea level and with an average annual temperature of 27 °C. However, there are minimum extreme temperatures of 11 °C, which are recorded in the dry season, and a maximum temperature that is nearly 40 °C [88]. The average temperature of the town is illustrated in Figure 3.

4.3. Load Characteristics
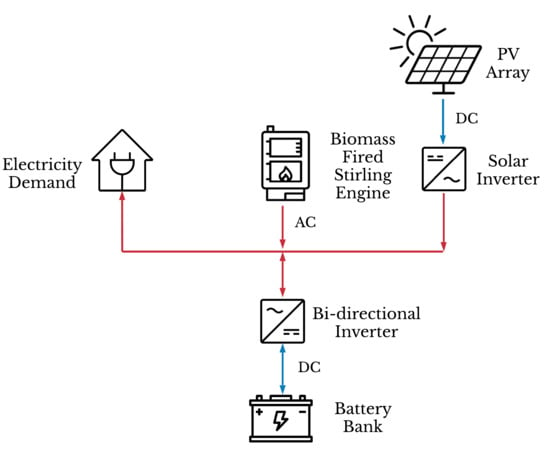
The aim of the hybrid systems was to cover the demand of the households, but also that of two schools, the church, the primary healthcare facility, and the streetlight of “Tacuaral de Mattos”, therefore, the electric demand was based on field studies of communities located at the northeastern part of Bolivia. The hypothesis that inhabitants of the mentioned town would behave as people in those sites was reasonable because they possessed similar cultural, economic, and climate characteristics. The household demand was based on a family of farmers who lived in Nuevo Horizonte, a population located in the department of Beni and without access to electricity by the time the survey was conducted in 2014 [89]. Electrical consumption related to the church and schools were considered from data of La Brecha [90] while the health center and the street light demand came from information of Central Caranavi community [91]. In this way, a summary of the load demand details is shown in Table 1.
Moreover, yearly demand profiles were estimated by relying on the software LoadProGen, which created a slightly different daily load profile and a maximum demand between operations. This was achieved by adding a percentage of uncertainty to the operating time of appliances [83]. Therefore, an average load demand profile is shown in Figure 4. In this context, the yearly demand had an average peak value of 6450 W and an average daily consumption of 29.29 kWh/day.

4.4. Configuration

The architecture of both systems was based on a centralized AC bus. This configuration was chosen by considering the following aspects: Centralized configuration allows the development of modular systems, which can adapt to potential changes in the electricity demand; these systems are also considered robust and easier to control [92]. The AC bus arrangement allows an easier interconnection with a power grid when this is required [93]. Furthermore, the Bolivian energy sector has started to gain experience in the operation of this type of architecture, for example this configuration was implemented for the hybrid system of the community El Espino [15]. However, its main disadvantage was related to the required synchronization of inverters and AC sources in order to maintain an adequate voltage and frequency [92]. It is important to mention that the study of frequency and voltage responses is out of the scope of this analysis. The configurations of the PV/diesel/battery and PV/Stirling/battery systems are shown in Figure 5.

4.5. Component Specifications and Inputs to HOMER

In this section, specifications of the diverse components and their costs are expressed (data which is going to be used in HOMER software). It is important to highlight that an extensive literature review was carried out in order to acquire data about the local costs of the equipment used.

4.5.1. PV Array

Technical characteristics of the PV module that constituted the photovoltaic array were based on the TSM-PD14 panel of TRINA SOLAR [94]. A tracking system was not considered. The slope and azimuth angles were selected in order to maximize the yearly electricity generation and ended up as 14.99° (latitude of site) and 180° (module facing north), respectively [95]. The ground reflectance was considered as wet soil from the city [96] and the derating factor was 88%, which was the value defined in HOMER library for another TRINA TallMax module. This last factor considers different types of losses in the PV modules such as aging, shading, soiling, and wiring losses [97]. The capital cost and replacement cost of the mentioned PV panel were USD $747 and $344, respectively. Additionally, prices relating to shipping, installation, and a solar inverter were included in the capital cost. The O&M cost of the 320 W photovoltaic module studied was assumed to be USD $18/year.

4.5.2. Battery Bank

In this work, a battery bank was selected to maintain a constant voltage during peak loads or shortfalls. This bank consisted of a determined number of batteries, which were calculated for each system using Homer. The main characteristics of each battery were: A 2 V VRLA gel battery (Victron Energy BAT412101104) with a nominal capacity of 110 Ah and a lifetime throughput of 574.60 kWh [98]. Due to the voltage of 24 V related to DC Bus, the batteries were configured in series of two batteries per string. Furthermore, the depth of discharge (DOD) of the battery was taken as 70%, due to the fact that the manufacturer specified that this type of battery offers a better deep cycle durability and a longer lifetime than AGM batteries [98]. The capital cost and replacement cost of each battery were USD $432 and $376, respectively and USD $8/year was established (2% of acquisition cost) as the O&M cost [99].

4.5.3. Converter

As a consequence of both DC and AC buses existing in the system, there was a need for an inverter and a rectifier. In HOMER, a bidirectional inverter, which has the function of both mentioned components, does the conditioning of power. Therefore, a MultiPlus C-24/1600 W/230 VAC inverter/charger of Victron Energy was utilized as a reference. The lifetime of the bidirectional inverter was assumed to be 15 years, based on the software default value [100] and the efficiency of the inverter and rectifier were taken as 94% and 98%, according to the manufacturer’s datasheet [101]. The capital and replacement cost of the converter were assumed to be USD $1764 and $1604, respectively. The O&M cost was established as USD $16,040/year (10% of acquisition cost) [99].

4.5.4. Diesel Engine Genset

The capital cost, the replacement cost, and the O&M cost of the diesel generator were assumed to be USD $925/kW, $804/kW, and $0.0130/kW/year, respectively. The minimum load ratio was taken as 30% of the nominal power and the generator operating hours were considered as 20,000 [102]. Furthermore, the following maintenance schedule was contemplated: Fuel filter replacement (one hour down time per every 1000 operating hours), air filter replacement (one hour down time per every 500 operating hours), and generator oil change (0.5 h per every 100 operating hours) [103]. Diesel fuel was specified with a price of USD $1.30/L and the default properties of that fuel in the library of the optimization program (lower heating value 43.20 MJ/kg, density 820 kg/m3, carbon content 88%, and sulfur content 0.33%) [104].

4.5.5. CHP Plant with a Stirling Engine

According to Swaminathan [105], a biomass fired power plant based on a Stirling engine had had an investment cost around USD $3918/kW and an O&M cost of USD $0.0099/kWh, by the year 2013. Therefore, these values were actualized to the year of the study (2017), using the average inflation ratio of the last five years in Bolivia and ended up as USD $4200/kW and $0.0118/kWh, which were the parameters utilized for the capital, replacement, and O&M costs. The minimum load ratio was established as 100%, which was equivalent to express that whenever the engine functions, it does at nominal power. The selection of this value was motivated by two studies carried out on the use of a Stirling motor for electrification in the Bolivian rural area [19,20]. In these investigations, it was explained that the “cycle charging” strategy was more appropriate for isolated systems, because the extra energy could be used to charge the batteries. Furthermore, Sugden and Drury [106], who conducted a research with a WhisperGen Stirling engine, stated that “load following” functionality was quite slow as a result of the heat exchange processes. According to various sources, the lifetime of a Stirling engine is around 10 to 15 years [107,108,109]. However, due to the immaturity of the technology, the shorter life expectancy was selected, which was equivalent to a 10 year service with an average 25,000 operating hours [110]. The fuel consumption data was obtained from Inresol AB V2-6 (X) Stirling engine part-load consumption data [111]. The maintenance schedule of this equipment was determined as following: Internal inspection (two hours down time per every 20,000 calendar hours), refill of nitrogen (one hour down time per every 8760 calendar hours), and visual inspection and pressure check (0.5 h per every 100 operating hours per 2160 calendar hours). Related to wood pellets, their properties were established according to the information presented by Cardozo et al. [112] and their price was determined as USD $0.36/kg, which was the actualized value for the price in the local Bolivian market [113].

4.5.6. Other Parameters

The lifetime of the project and the discount rate were considered as 20 years and 10.10%, respectively [114]. Moreover, the inflation rate, which was taken as the average value between the years 2013 and 2016, was considered as 4.05% [115] and annual shortage of 0% was contemplated.
To summarize the information described in this section, an outline of the most important component characteristics is presented in Table 2.

4.5.7. System Control

HOMER performed the optimization using two main dispatch strategies, “cycle charging” and “load following”. The “cycle charging” strategy, whenever a generator is required, operates at nominal capacity and surplus power charges the batteries [116]. Alternatively, the “load following” strategy, when a generator is needed, produces only enough power to cover the demand [117]. Optimization of the PV/diesel/battery system included both control algorithms, but as previously explained, the PV/Stirling/battery only considered the “cycle charging” strategy. The final hybrid power systems’ setup in the software HOMER are shown in Figure 6.

5. Modeling

In this section, elements of the studied hybrid systems were defined with mathematical equations, which were later implemented in Simulink TM 8.9 (MATLAB R2017b). The parameters related to costs and life expectancy of each technology were considered the same as the ones mentioned in the economic optimization (the section on component specifications and inputs to HOMER). Moreover, technical parameters related to the technologies are specified in each of the following sections.

5.1. Photovoltaic Array

The operation of a photovoltaic cell was modeled through the equivalent circuit illustrated in Figure 7. This circuit can be used to represent a single cell, a module formed by several cells, or an array composed of many photovoltaic modules and is called five-parameter single diode model [118].
Thus, the current at the output of the photovoltaic panel (Ipv) can be expressed by the relationship shown in Equation (1) [118].
I p v = I p h I 0 ( e V p v + I p v × R s a × N c e l × V t h 1 ) V p v + I p v × R s R p
where a is the ideality factor of the diode, Io is the diode reverse saturation current, Iph is the photoelectric current, Ncel is the number of cells in the module, Rs is the series resistance, Rp is the shunt resistance, Vpv is the voltage that exists at the output of the photovoltaic module, and Vth is the thermal voltage of the aforementioned solar cell.
The five indefinite parameters of this model were the diode reverse saturation [119], the series resistance [120], the thermal voltage, the photoelectric current, the shunt resistance, and also the cell temperature (Tpv) [118].
To determine the unknown parameters, an iterative method was applied based on Newton–Raphson numerical analysis [121]. Additionally, the model considered a perfect power point tracking (MPPT) controller that maximized the generated power [118].
Lastly, the main parameters related to the photovoltaic array are summarized in Table 3. In this context, technical values correspond to ones presented in the PV module datasheet [94].

5.2. Battery Bank

The proposed model for the electrochemical battery was based on a nonlinear model described in [122] and, at the same time, implemented in the Simulink library [123]. This makes use of a controlled voltage source in series with a constant resistance, as shown in Figure 8.
This model accurately represents the dynamic phenomenon of the voltage when the current varies, and the open circuit voltage is considered as a function of the state of charge of the battery [122,123]. Likewise, the voltage losses associated with the loading and unloading processes are adequately represented, and therefore it is unnecessary to apply a constant efficiency of such processes as in other simplified models [124]. With this approach, the four largest types of batteries used in electricity generation projects could be represented, which were: acid lead, lithium ion (Li-Ion), nickel cadmium (NiCd), and nickel metal hydride (NiMH). However, the mathematical equations vary according to the type of battery described above.
The effect of the temperature on the behavior of battery was modeled by an adaptation made by Wijewardana [125]. The mentioned author stated that the temperature influenced four parameters of the battery, which were the polarization constant (K), the battery voltage constant (E0), the exponential zone amplitude (A), and the exponential zone time constant inverse (B). However, in order to construct a simpler model, the thermal effect on the coefficient A was ignored because the effect on A and E0 are highly related [126].
In this way, the thermal factors that affect the three parameters are summarized in Equations (2)–(4), [125] which are shown below.
x E 0 = 0.986 + 4.97 × 10 4 ( T a m b ) 6.6 × 10 4 ( T a m b 2 )
x K = 0.876 0.028   ( T a m b ) + 4.218 × 10 4 ( T a m b 2 )
x B = 0.733 0.055   ( T a m b ) + 9.63 × 10 4 ( T a m b 2 )
where xEo, xK, and xB are the temperature functions for E0, K, and B respectively.
At the end, the main parameters related to the battery bank are presented in Table 4. Technical factors were based on the information found in the technology’s datasheet [127].

5.3. Converter

The power balance equation through the DC/AC converter can be expressed as a function of equipment efficiency, as shown in Equation (5).
η i n v = P i n v _ a c P i n v _ d c
where ηinv represents the power converter efficiency, Pinv_dc the inverter power input, and Pinv_ac is the inverter power output. As it can be observed, the efficiency depends on the power output of the converter and remains almost constant for output values above 0.3 per unit (pu) [128]. In this way, in order to model this technology, the Jantsch model was used [129] and it is shown in Equation (6).
η i n v = P i n v _ a c P i n v _ n o m P i n v _ a c P i n v _ n o m + k 0 + k 1 P i n v _ a c P i n v _ n o m + k 2 ( P i n v _ a c P i n v _ n o m ) 2
where Pinv_nom is the nominal power of the inverter and k0, k1, and k2 are constants calculated as functions of the efficiency of the converter.
Equations (5) and (6) consider that the converter is kept at an optimal temperature (usually 25 °C). Therefore, the model scaled the experimental values presented in the technical study of Victron BlueSolar inverter [130] in order to incorporate the effect of the ambient temperature on the power output of the technology.
Finally, the main characteristics regarding Victron Energy Inverter Model MultiPlus 24/3000/70 are presented in Table 5. A linear scaling was used in order to represent the operation of converters of other sizes.

5.4. Diesel Generator

The Diesel generator model was based on the one described in the article by Datta et al. [131]. This is a standard model composed of a Diesel engine, a speed governor, and a synchronous generator, which are exemplified in Figure 9.
Figure 9 illustrates that the Diesel engine and the actuator servomechanism of the valve are represented by the first order lags, TD and TSM, respectively. Likewise, HD is equivalent to the inertial constant of the rotor. The parameters of the speed governor are the drop (R) and integral control gain (KI). Related to the synchronous generator, two parameters are considered, KS and KD, which are the synchronization and damping coefficients, respectively. The input data is the demand (Pgd_d) and the velocity ωg, that corresponds to the angular velocity by another generator that could be added. Therefore, in this study, ωg is equal to zero. The final output data is Pgd, the electrical power that comes from the generator.

5.4.1. Operation Modes

Two modes of operation related to the Diesel generator were considered (normal and standby) according to a technical publication made by the UN Refugee Agency [132]. Consequently, the Diesel genset was always considered in standby mode in this work. Thus, the generator was able to start immediately as a result of deficit power and during this state it had a minimum consumption by the electronic control devices.

5.4.2. Fuel Consumption

The estimation of diesel consumption was based on a commonly used methodology, which is an empirical and first order polynomial equation. This approach was studied and widely disseminated by Skarstein and Uhlen [133] and is expressed in Equation (7).
m ˙ d i e s e l = k B P g d _ n o m + k A P g d
where kA and kB are the coefficients of consumption equation and correspond to 0.246 L/kWh and 0.08415 L/kWh, respectively. Pgd_nom is the nominal capacity of the Diesel genset and Pgd is the supplied power at a specific time.

5.4.3. Emissions

The amount of carbon dioxide (CO2) emitted during the operation of the generator was estimated using an average constant value per liter of fuel consumed by the Diesel engine (2.63 kg CO2/L) [134].

5.4.4. Simulation Parameters

Lastly, the main parameters related to the Diesel generator are summarized in Table 6. The values that correspond to the transfer function model were based on the article presented by Papathanassiou and Papadopoulos [135].

5.5. Stirling Engine

Regarding the modeling of the Stirling engine, an implementation was carried out based on the guidelines of Annex 42 of the International Energy Agency (IEA). This annex provides the protocol, set of tests, and interrelated predictions for the modeling and validation of micro-cogeneration technologies such as internal combustion and Stirling engines, providing sufficient computer complexity to study the interaction between the cogeneration system and energy consumption on a residential building [136].
The model presented is a zero order one, in other words, it does not focus on characterizing the thermodynamic behavior of the Stirling engine. Additionally, it is comprised of three control volumes: energy conversion, thermal mass, and cooling water [62]. This distribution can be seen in Figure 10, shown below.
The energy conversion control volume expresses the transformation of fuel into heat and electricity under steady-state conditions. In this context, the determination of the engine’s steady-state net electrical output (PSt_ee), steady-state rate of heat generation which is transferred to thermal mass control volume (qSt_ee), and gross thermal input to the system (qgen) are based on overall efficiencies that include effects of inefficiencies. Therefore, Equations (8)–(10) represent the theory previously provided [62].
q g e n = m ˙ b i o m a s s × L H V b i o m a s s
P S t _ e e = η e × q g e n
q S t _ e e = η q × q g e n
where biomass is the fuel flow, LHVbiomass is the lower heating value of the fuel, ηe and ηq are the net electrical and thermal efficiencies, respectively. Both of the efficiencies are calculated with a 27-term trivariate polynomials expressed by original Annex 42 model, but most of them reduce to zero during calibration [63].
Regarding the thermal control volume which characterizes the thermal mass of the Stirling engine as a whole, the modeling approach englobes two heat transfer processes, one from exhaust gases to the cooling water and the other from the Stirling engine to the ambient. Equation (11) shows the governing energy balance for this control volume [137].
C S T d T S T d t = U A H X   ( T c w o T S T ) + U A l o s s   ( T a m b T S T ) + q n e t _ e e  
Here, the engine is contemplated as a thermal capacity (CST) with an average temperature (TST). Furthermore, UAHX and UAloss are empirically heat transfers coefficients, Tcw_o represents the outlet temperature of the cooling water control volume, and Tamb is the ambient temperature.
Lastly, the cooling water control volume involves the heat exchange between the exhaust gas, the cooling water, and all engine parts in thermal contact. Therefore, the energy balance, corresponding to this control volume, is shown in Equation (12) [62].
C H X d T c w _ o d t = m ˙ c w c p ( T c w _ i T c w _ o ) U A H X ( T c w _ o T S T )
where CHX is a thermal capacity of the control volume (cooling water and encapsulating heat exchangers), cp and cw are the specific heat capacity and water flow rate, respectively. Moreover, Tcw_i represents the temperature of the cooling water entering the control volume.
The main reason for the selection of this modeling approach is that it has a level of intermediate complexity which allows it to adapt to different types of fuels (natural gas and biomass) and simulate the behavior of the engine on a time scale of around one minute [70].

5.5.1. Operation Modes

In addition to the normal or steady operation, the cogeneration unit based on a Stirling engine can operate in three other modes, which are standby, warm-up, and cool-down. During warm-up, the engine generates a partial amount of electrical and thermal power. In this context, Equation (13) exemplifies the amount of power output during the start-up period (PST) [137].
P S T = P S T _ n o m × k p ( T S T T a m b T S T _ n o m T a m b )
where PST_nom is engine nominal electrical power, kp is an empirical coefficient, and TST_nom is the Stirling engine nominal temperature of operation.
Furthermore, regarding cool-down and standby modes, the device does not generate electricity or heat, but consumes electrical power to maintain activation functions or to complete the shutdown [62].

5.5.2. Fuel Consumption

The biomass consumption was estimated using the same equation from the diesel genset (Equation (7)), but the coefficients were calculated with the data from a V2-6 (X) Inresol Stirling engine [111].

5.5.3. Emissions

The CO2 emissions were calculated with the data expressed by Harrison for a Stirling engine working in a cogeneration unit (0.22 kgCO2/kWh of electric power) [110].

5.5.4. Simulation Parameters

Finally, the parameters used to simulate the Stirling engine unit were based on a calibration made by Davis [138]. These factors are summarized in Table 7. Due to the fact that the Stirling engine from the experimental calibration had a net power output of 780 W, a linear scaling in Simulink is performed in order to simulate the technology with a different size.

5.6. Control Strategy

A control algorithm determines the interaction between different components of the system, specifically establishing the start-up and shutdown of the generator (Stirling engine or diesel generator), the operation of the battery, and the generation or curtailment of the photovoltaic system. Thus, an appropriate control strategy increases the availability of electrical energy, system efficiency, battery life, and the amount of electrical power generated [139]. The “load following-frugal” strategy for the PV/diesel/battery system and the “cycle charging-frugal-SOC setpoint” strategy for PV/Stirling/battery system are studied in this work.

5.6.1. Load Following-Frugal Strategy

This dispatch strategy combines two algorithms. On the one hand, the “load following” strategy is based on the supply power of the generator, which only operates to deliver the required power without providing unnecessary energy to charge the batteries. On the other hand, the “frugal strategy” considers a critical discharge power (Ld), which is equivalent to the power at which the cost of deliver of that amount of power with the generator is less than covering that energy with the batteries. Therefore, the generator supplies the net load whenever this is greater than the value of Ld, whether the batteries can cover that electrical demand or not [140]. Figure 11 exemplifies both combined strategies.
The basic principle of the combined strategy is to use the photovoltaic source in order to supply the electrical power demand. Thus, the net power (Pnet) is defined as the subtraction between the power output related to the solar modules and the electric load (Pd). Thus, if there is an excess of power generated by the PV panels (Pnet > 0), then, this is used to charge the batteries. However, prior to evaluation, the actual state of charge of the batteries (SOC) should be revised since there is a minimum value (SOCmin) and a maximum value (SOCmax) of work allowed, and there are also certain limits of charge (Pmax_car) and discharge rates (Pmax_des). Therefore, all limits of battery charging and discharging conditions must be respected. In case the batteries are already fully charged, the excess power is discharged or discarded (Pexc). On the one hand, if the net power is negative (Pnet < 0), the first step is to evaluate if the net power is less than Ld, as well as to revise if the SOC of the batteries is greater than the minimum SOC, then, the batteries can supply part of the demand until they reach their maximum discharge rate (Pmax_des). On the other hand, if the net power required is greater than or equal to Ld, or the current SOC of the batteries has a low value, the possibility of starting the generator is examined, since it also has a working limit (30% of the power rated diesel generator in this analysis), this will secure efficient operation and a longer life time. Therefore, in case the net power is lower than the working limit of the generator this will be activated, and the excess energy will be used to charge the batteries, respecting their limits. In any other situation, the batteries are not charged by the generator, unless the diesel genset output power is higher than the net power. As a last option, if all the technologies are not able to cover the demand power, there is a certain amount of electrical energy not supplied (Pdef).

5.6.2. Cycle Charging-Frugal-SOC Setpoint Strategy

The operation of this strategy combines three different strategies (Figure 12). The “cycle charging” strategy differs from the “load following” strategy, when the batteries are unable to cover the net power, the generator operates at nominal power charging the batteries with the remaining power. The SOC setpoint implies that the generator will continue operating until the batteries reach a state of charge corresponding to SOCstp [140].

6. Performance Indicators

Both systems are evaluated in terms of energy, economic, and environment performance using the fuel saving ratio (FSR), annualized total cost saving ratio (ATCSR), and CO2 emission reduction ratio (CO2ERR), respectively. These criteria are frequently used in comparatives between energy systems [141,142,143,144].

6.1. Energy Efficiency Evaluation

Fuel saving ratio (FSR) represents a measure used to compare the equivalent energy of the fuel consumption of the studied system in relation to the reference system and can be calculated applying Equation (14) [145].
F S R = ( 1 F s i s _ t o t F r e f _ t o t ) × 100 %
where Fsis_tot and Fref_tot are equivalent energy of the fuel consumption by the studied system and by the referential system, respectively.

6.2. Economic Feasibility Evaluation

Regarding the economic comparison of the studied system with the referential system, the annualized total cost saving ratio (ATCSR) is used. This is a measure calculated with Equation (15) [145].
A T C S R = ( 1 A T C s i s _ t o t A T C r e f _ t o t ) × 100 %
where ATCsis_tot and ATCref_tot are the annualized total costs of the system under study and the reference system, respectively. The total annualized cost (ATC) includes all costs during the lifetime of the project.

6.3. Environmental Sustainability Evaluation

The CO2 emission reduction ratio (CO2ERR) is constituted in an environmental index. The value of this factor is calculated as the division between the CO2 emissions during the operation of the studied system (CO2sis_tot) and the CO2 emissions of the reference system (CO2ref_tot). Equation (16) exemplifies the aforementioned relation [145].
C O 2 E R R = ( 1 C O 2 s i s _ t o t C O 2 r e f _ t o t ) × 100 %

6.4. Weighting Factor Method

The three criteria of performance analysis can be integrated into a weighted factor to formulate an integrated saving ratio (ISR), which is defined in Equation (17).
I S R = w 1 · F S R + w 2 · C O 2 E R R + w 3 · A T C S R
where, w1, w2, and w3 represent the weighted factors of each criterion. These factors were assumed to have equal values (1/3). This consideration had been made in several studies of the energy field [146,147,148].

7. Results and Discussion

In this section, the results of the modeling are presented. First, the optimization results are analyzed. Second, the dynamic analysis approach is described. Finally, the performance analysis results are shown and discussed.

7.1. Optimization Results

The autonomous hybrid energy systems were designed to cover the inhabitants’ requirements during the entire year, taking into account electric load and weather conditions. In this way, the top optimized systems are shown in Table 8.
HOMER results expressed that the PV/diesel/battery system would be composed of a 3.54 kW solar array (twelve PV panels in parallel and one PV module in series), a 7.1 kW diesel generator, a 4.62 kW bidirectional inverter, and a 44.88 kWh VRLA gel lead-acid battery bank, which is equivalent to 34 batteries (seventeen batteries in parallel and two batteries in series). The second system (PV/Stirling/battery) would be comprised of 3.56 kW PV array (twelve PV modules in parallel and one PV panel in series), a 6 kW Stirling engine, a 1.65 kW bidirectional inverter, and also, 34 lead-acid batteries (seventeen batteries in parallel and two batteries in series). Furthermore, the levelized cost of electricity (COE) of the PV/diesel/battery and PV/Stirling/battery systems were USD $0.778/kWh and USD $0.726 /kWh, respectively. Both of these values are higher than the average price of electricity in the municipality of San Borja, where “Tacuaral de Mattos” is located. The aforementioned price is about USD $0.142/kWh according to Electricity and Social Control Authority of Bolivia [9], mainly because most electricity in remote areas of Beni comes from internal combustion engines whose fuel is subsidized by the government.

7.2. Dynamic Analysis

For the interest of this article, it was considered to first simulate both systems for a representative solar radiation day (winter solstice) and, then, for one year. The one-season approach was done in order to corroborate whether the systems operate in a reliable, efficient way. Moreover, the one-year simulation was completed in order to obtain the data needed for the performance analysis. Lastly, a comparative analysis between the simulation of the implemented models in Simulink and HOMER simulation was carried out to evaluate the efficacy of the modeling approach.

7.2.1. Simulation of PV/Diesel/Battery System during Winter Solstice

For the winter solstice (June 2), as shown in Figure 13a, the electrical generation by PV modules occurs around 7:00 a.m. to 6:00 p.m. Furthermore, on the one hand, the supply by this technology is intermittent and its peak is reached around noon. On the other hand, the diesel generator only works during the period of high electrical demand (approximately from 7:00 p.m. to 10:00 p.m.), because the value of critical discharge power (Ld) registers a value around 3200 W. In another aspect, peaks of the battery charging and discharging power, during operation of the diesel engine can also be observed. These last around 30 s, which is the time that the diesel generator takes to start-up and stabilize at the required power. Although this is a low solar radiation day, the batteries can cover the electricity demand, and therefore no period of energy deficit nor excess of energy occur, as exemplified in Figure 13b. By the end of the day, the battery bank reaches a state of charge of around 32% (Figure 13c). Lastly, this daily simulation showed a good system operation, which implies that the sizing from HOMER was correct.

7.2.2. Simulation of PV/Stirling/Battery System during Winter Solstice

In comparison, during the winter solstice, it is possible to observe that after the Stirling engine starts (around 7:00 p.m.), it keeps running during the peak load until 10:00 p.m. (Figure 14a). Moreover, the Stirling engine took around 30 min to reach steady-state operation. The electricity demand shown in Figure 13b, is completely covered in this scenario. However, the simulation of this hybrid power system required adding a SOC setpoint for the battery because after the battery had reached the minimum state of charge in a “cycle charging-frugal” strategy, the system reflected an intermittent behavior of the Stirling engine and batteries while the demand was lower than the Ld value. Regarding the Stirling engine, the implication that the engine enters on and off operation in an interval of seconds, could cause thermal stress, leading to damage and reduction of the engine lifetime. Figure 13c illustrates that the batteries finish the day with around 59% of SOC. To sum up, the results of this daily simulation show that the system functions properly and the battery bank can cover the deficit of the power during the system operation, which means that the design from HOMER software was adequate.

7.2.3. Comparison between MATLAB/Simulink and HOMER Models

As the reviewed literature showed, there are no studies that reflect the performance of a PV/Stirling/battery system that includes the dynamical operation of a Stirling engine. Consequently, a post-simulation analysis was made in order to compare the results of the proposed models and the ones from HOMER.
Figure 15a,b illustrates the power output of the PV/Stirling/battery system during winter solstice using the Simulink model developed in this paper and the simulation of the optimal solution found with HOMER software. Although the latter is able to simulate system operation and import input data with any time step, from as long as one hour to as short as one minute [149], it still is not able to simulate electrical transients or dynamic effects because its algorithms are not modifiable [78]. Related to solar power, there is no notable difference between graphs of both approaches (Figure 15a,b). However, the yearly photovoltaic energy generation using Simulink was about 6015 kWh, which represents 9% more than the one obtained from HOMER, as shown in Table 3. A big variance between electric power related to battery bank and Stirling engine from both simulations could be observed. In Figure 15a, the batteries had to cover the load while the Stirling engine started and reached its nominal capacity. Nevertheless, HOMER considered that the start-up period did not exist, and the engine could provide nominal power instantaneously (Figure 15b). Furthermore, the Simulink model took into account two other modes of operation, which were standby (CHP system required electricity for ancillaries’ demand) and cool-down (Stirling engine used electrical energy in order to shut down). In this way, the Stirling engine total electrical production was 8955 kWh/year regarding the Simulink model, which is nearly 19% more than the HOMER results due to the implementation of the “SOC setpoint” strategy to deal with cycling operation of the Stirling engine.
Regarding the simulation of the PV/diesel/battery system, the start-up time of the diesel generator included in the Simulink model also affected the batteries output power as in the case of the Stirling hybrid system. As shown in Figure 16a, there are some peaks in the charging and discharging processes of the battery bank during the operation of the diesel genset. This occurred as a consequence of the time of response of the technology at load changes (around 30 s). In contrast, the HOMER software simulation assumed that the diesel generator could change automatically to a different demand requirement (Figure 16b), which lead to a total electrical power of 6361 kWh/year generated by this technology, according to Simulink model (1% less than the value from HOMER). The solar power behavior presented the same characteristics as the case of the PV/Stirling/battery system. Nevertheless, the solar power output of the Matlab/Simulink simulation was 14% more than the one from HOMER, due to the fact that the Simulink model used the number of photovoltaic modules (12 PV panels) to determine the photovoltaic power, instead of HOMER’s optimal value (3540 W that represented 11.1 PV modules). HOMER does not allow modeling of a system specifying the size of its components.
Table 9 shows the overall comparison chart for the two models. Both fuel consumption (biomass and diesel) and total annualized cost from the Simulink models presented higher values than the ones from HOMER, as a consequence of the also higher electricity production by the generators (diesel genset and Stirling CHP), which leads to more use of batteries in order to cover the energy deficit during thermal transients. Related to the CO2 emissions from the PV/Stirling/battery system, HOMER’s algorithm for emissions calculation is based on average experimental values of internal combustion engines [150], which lead to important inaccuracies when using an external heat machine such as a Stirling engine. Therefore, HOMER is not able to determine carbon dioxide emissions related to external combustion engines.

7.3. Performance Analysis

The evaluation of the performance of the hybrid generation system based on a Stirling engine was carried out in terms of fuel saving ratio (FSR), carbon dioxide emission reduction ratio (CO2ERR), annualized total cost saving ratio (ATCSR), and integrated saving ratio (ISR) as compared with a more common hybrid power system utilized in rural electrification (PV/diesel/battery system). The results of the analysis are shown in Table 10.
As shown in the previous table, the fuel saving ratio (FSR) for the aforementioned microgrid has a value of 5%, which means that the diesel hybrid energy system had a worse performance related to the primary energy used. This occurred due to the high electrical efficiency that the Stirling engine from Inresol presented (approximately 40%) as compared with the typical Stirling engine efficiency which is around 10% to 30% [151,152,153]. Regarding the CO2ERR ratio, the PV/Stirling/battery system was able to reduce 69% more carbon dioxide emissions as compared with the reference system. Vishwanathan et al. stated that a gas fueled Stirling engine combustor produced lower emissions as compared with internal combustion engines [154]. Nevertheless, a specific value was not mentioned. The Stirling engine system represents a cheaper option, and therefore, the ATCSR criterion is 11%. This is mainly related to the low cost of the wood pellets and the approximated cost of a biomass CHP plant manufactured locally [105]. However, there are diverse costs of Stirling engines, which are sometimes greater and lie between €6633 and 7090/kW [36,155]. Additionally, Ashurst established that the offered Stirling engine cost is only 30% of the user’s total installed cost [156]. Therefore, it is worth noting that the cost of the Stirling engine is not completely established and should be included in a sensitivity analysis in future research.
Unfortunately, there are no studies regarding the performance of a PV/Stirling/battery system that works in isolated mode and utilizes biomass as fuel. However, there are two studies of cogeneration systems based on the Stirling engine. The first refers to the analysis of residential cogeneration systems, including two Stirling engines, (WhisperGen and Solo) as compared with a gas combined cycle power plant [157]. While the second research is focused on the performance of a residential cogeneration system based on a natural gas Stirling engine, photovoltaic modules, thermal storage, and refrigeration equipment, both studies are based on different technologies and scenarios. Therefore, they could not be used for a comparison with the simulation of the PV/Stirling/battery system presented in this article. Thus, the comparison is only related to the formulated PV/diesel/battery system.
All models and input data are released in openei.org/datasets/dataset/performance-analysis-of-a-stirling-engine-hybrid-power-system [158], which ensures reproducibility and re-usability of this research.

8. Conclusions

A performance analysis in terms of energy efficiency, economic feasibility, and environmental sustainability of an off-grid hybrid power system for a rural area located in “Tacuaral de Mattos”, Bolivia has been carried out. The generation of electricity covered the daily demand of a community comprised of 102 residential households, two schools, a church, a primary healthcare facility, and a streetlight. The aforementioned hybrid energy system was composed of PV modules, a battery bank and a Stirling CHP set fueled with wood pellets, which were assumed to be produced locally using the abundant biomass resources and forestry waste of the zone. Since using a PV/diesel/battery system is a current solution for remote localities which are not connected to the Bolivian national electric grid, this type of system was used as reference to find the saving ratios related to the performance analysis. Furthermore, as the Stirling engine technology has long thermal transient behaviors, a dynamical modeling approach taking into account the start-up and shutdown periods of it was considered. Related to the other components of the systems, models were implemented in Simulink including also dynamical characteristics.
The economic optimization made in HOMER focused on finding the sizes of the diverse technologies that composed the two hybrid power systems, using techno-economic data and constraints. Although the design of both systems demonstrated reliability during the daily basis simulation, the size of the battery bank had not been contemplated to deal with the dynamic operation of generators (diesel genset and Stirling engine), leading to a reduction of the lifetime of the batteries and an increase in the annualized cost of the systems.
The models were developed for each component of the systems using numerical methods. In this context, each model embodies a physical approach with a sufficient level of complexity to become a tool that can be used in other studies of the energy field such as analyzing other architectures of hybrid systems and developing control strategies. Nevertheless, the simulation of these complex computational models required a high calculation time (one and half minutes for daily simulation and eleven and a half hours for yearly simulation). Furthermore, the ambient temperature effect in the capacity of batteries and converters was incorporated into the modeling approach of these technologies due the fact the power systems were not always kept at an optimal temperature in some electrification projects in Bolivia.
The designed dispatch strategies allowed an economic operation of the systems, when considering a critical power value of battery discharge, and stable operation, in terms of energy deficit and preserving the useful life of all the components. For this purpose and in order to avoid thermal stress by the Stirling engine, the “SOC setpoint” strategy was included. However, this promoted longer working hours for the engine and, consequently, a shorter lifetime expectancy of the technology.
Additionally, a comparison between the daily simulation (winter solstice) of Simulink proposed models and HOMER software was performed as there were no studies to evaluate the methods presented. The post-simulation analysis showed that there is close agreement between both computational tools regarding the results of fuel consumption (biomass and diesel) and total electricity generation of PV panels and generators (Stirling engine and diesel genset). However, there is a major difference regarding the values of the systems’ total annualized cost due to the expenses related to the use of batteries during the start-up periods of the generators.
The performance analysis demonstrated that the hybrid PV/Stirling/battery system represented a better overall option (ISR of 28%) to implement in a rural electrification project as compared with a system made up of a diesel genset, PV modules, and batteries, as a consequence of its good environmental sustainability (69% savings in CO2 emissions), economic criterion (11% savings in annualized total cost), and energy efficiency (5% savings in fuel energy conversion). Hence, there is a great opportunity for systems based on Stirling engines to benefit users of distributed energy systems, as the technology matures, and more developments are made. Nonetheless, as there are various factors involved in the performance evaluation, further studies are required to analyze the effects that electricity demand increase, availability of energy sources such as biomass, and ambient temperature have on the performance of a Stirling engine hybrid power system.

Author Contributions

All authors contributed to the article as follows: Conceptualization, P.J.Z., J.A.A.R., and L.A.C.C.; methodology, P.J.Z., J.A.A.R., and L.A.C.C.; software, P.J.Z.; validation, P.J.Z. and J.A.A.R.; formal analysis, P.J.Z., J.A.A.R., L.A.C.C., and E.C.; investigation, P.J.Z.; resources, P.J.Z., J.A.A.R., L.A.C.C., and E.C.; data curation, P.J.Z.; writing—original draft preparation, P.J.Z. and J.A.A.R.; writing—review and editing, P.J.Z. and J.A.A.R.; visualization, P.J.Z.; supervision, J.A.A.R., L.A.C.C., and E.C. All authors have read and agreed to the published version of the manuscript.

Acknowledgments

This work was carried out as a part of the research cooperation between the Swedish International Development Agency (SIDA) and the Universidad Mayor de San Simon (UMSS). The authors want to thank Lucio Alejo Espinoza (UMSS) for the administrative support and Anders Malmquist (KTH Royal Institute of Technology) for the technical support during the course of this investigation.

Conflicts of Interest

The authors declare no conflict of interest.

Nomenclature

aIdeality factor of the diodePgd_nomNominal power of diesel generator (W)
AExponential zone amplitude of battery (V)Pgen_minMinimum power recommended by manufacturer of diesel generator or Stirling engine (W)
ATCSRAnnualized total cost saving ratio (%)Pgen_nomNominal power of diesel generator or Stirling engine (W)
ATCref_totAnnualized total cost of reference system (USD/year)Pinv_acInverter output power (W)
ATCsis_totAnnualized total cost of studied system (USD/year)Pinv_dcInverter input power (W)
b0b26Empirical coefficients related to the thermal efficiency of the Stirling enginePinv_nomInverter nominal power (W)
BExponential zone time constant inverse of battery (1/Ah)Pmax_carMaximum charge rate by batteries (W)
c0c8Empirical coefficients for the mass flow of cooling waterPmax_desMaximum discharge rate by batteries (W)
cpSpecific heat of water (J/kg·K)PnetDifference between PV power generated and demand of power (W)
CO2ERRCO2 emission reduction ratio (%)PStOutput power of Stirling engine (W)
CO2ref_totEmissions from reference system (kg/year)PSt_eeSteady-state net electrical output of Stirling engine (W)
CO2sis_totEmissions from studied system (kg/year)PST_nomStirling engine nominal electrical power (W)
CHXThermal capacitance of the cooling water control volume (J/K)qgenGross heat rate of Stirling engine (J/s)
CStThermal capacitance of Stirling engine (J/K)qlossHeat loss rate of Stirling engine (J/s)
Exp(t)Voltage function of battery exponential zone (V)qrecHeat recovery rate of Stirling engine (J/s)
E0Battery voltage constant (V)qSt_eeSteady-state rate of heat generation related to Stirling engine (J/s)
FSRFuel Saving Ratio (%)RDrop of speed governor (Hz/pu)
Fref_totEquivalent energy related to fuel consumption by reference system (kWh)RbatInternal resistance of battery (Ω)
Fsis_totEquivalent energy related to fuel consumption by studied system (kWh)RpShunt resistance of PV cell (Ω)
HDInertial constant of the rotor (pu s/Hz)RsSeries resistance of PV cell (Ω)
i*Filtered battery current (A)SOCState of charge of batteries (%)
itCurrent battery charge (Ah)SOCminMinimum state of charge of batteries (%)
IbatBattery current (A)SOCstpSOC setpoint (%)
IoDiode reverse saturation current (A)TambAmbient temperature (°C)
IphPhotoelectric currtent (A)Tcw_iInlet temperature of cooling water (°C)
IpvOutput current of PV panel (A)Tcw_oOutlet temperature of cooling water (°C)
ISRIntegrated saving ratio (%)TDFirst order lag of diesel engine (s)
k0k2Constants of efficiency of converterTSMFirst order lag of servomechanism of the valve (s)
kA–kBConstants of the diesel consumption (L/kWh)TSTAverage temperature of Stirling engine (°C)
kpSensitivity coefficient of the result electrical power to TstTST_nomStirling engine nominal temperature of operation (°C)
KPolarization constant of battery (V/Ah)UAHXHeat transfer coefficient of heat recovery (W/K)
KDDamping coefficient of diesel generatorUAlossHeat transfer coefficient of heat loss (W/K)
KIIntegral control gain of diesel generatoru(t)Process of charge or discharge of battery
KSSynchronization coefficient of diesel generatorVbatBattery voltage (V)
LdCritical discharge power (W)VthThermal voltage of PV cell (V)
LHVbiomassLower heating value of wood pellets (J/kg)ηeElectric efficiency of the Stirling engine in steady state mode
dieselDiesel consumption flow (L/s)ηinvInverter efficiency
biomassPellets consumption flow (kg/s)ηqThermal efficiency of the Stirling engine in steady state mode
cwMass flow of cooling water (kg/s)w1w3Weighted factors
NcelNumber of cells in PV moduleωdGenerator velocity (rad/s)
PdefDeficit power (W)xBTemperature function of B
PexcSurplus power (W)xE0Temperature function of E0
PgdPower supplied by diesel generator (W)xKTemperature function of K

References

  1. Khatib, H. Electricity in the global energy scene. IEE Proc. A Sci. Meas. Technol. 1993, 140, 24–28. [Google Scholar] [CrossRef]
  2. International Energy Agency (IEA) World Energy Outlook 2019—Analysis. Available online: https://www.iea.org/reports/world-energy-outlook-2019 (accessed on 25 December 2019).
  3. Agrawal, A.; Wies, R.; Johnson, R. Hybrid Electric Power Systems: Modeling, Optimization and Control; Omniscriptum Gmbh & Company: Saarbrücken, Germany, 2007; ISBN 978-3-8364-1966-6. [Google Scholar]
  4. Sigarchian, S.G.; Paleta, R.; Malmquist, A.; Pina, A. Feasibility study of using a biogas engine as backup in a decentralized hybrid (PV/wind/battery) power generation system–Case study Kenya. Energy 2015, 90, 1830–1841. [Google Scholar] [CrossRef]
  5. Balderrama, S.; Lombardi, F.; Riva, F.; Canedo, W.; Colombo, E.; Quoilin, S. A two-stage linear programming optimization framework fsor isolated hybrid microgrids in a rural context: The case study of the “El Espino” community. Energy 2019, 188, 116073. [Google Scholar] [CrossRef]
  6. Murphy, J.T. Making the energy transition in rural East Africa: Is leapfrogging an alternative? Technol. Forecast. Soc. Chang. 2001, 68, 173–193. [Google Scholar] [CrossRef]
  7. Pickering, B.; Choudhary, R. District energy system optimisation under uncertain demand: Handling data-driven stochastic profiles. Appl. Energy 2019, 236, 1138–1157. [Google Scholar] [CrossRef] [Green Version]
  8. World Bank. Sustainable Energy for All (SE4ALL) Access to Electricity, Rural Population—Bolivia; World Bank: Washington, DC, USA, 2017. [Google Scholar]
  9. Autoridad de Fiscalización y Control Social de Electricidad (AE). Anuario Estadístico. 2018. Available online: https://sawi.ae.gob.bo/docfly/app/webroot/uploads/IMG-ANUARIO-cpelaez-2019-09-16-Libro%20Anuario%20AE%202018%20FINAL_web.pdf (accessed on 19 December 2019).
  10. Inter-American Development Bank (IDB). Evaluación Financiera y Económica del Proyecto Electrificación Rural Con Energίa Renovable; Inter-American Development Bank (IDB): Washington, DC, USA, 2013. [Google Scholar]
  11. ENDE Guaracachi. Planta Solar Cobija. Available online: http://guaracachi.com.bo/index.php?option=com_content&view=article&id=48&Itemid=251 (accessed on 25 December 2019).
  12. Ministerio de Comunicación de Bolivia. Gobierno Lleva Energía eléctrica a Comunidad Guaraní “El Espino”, en el Chaco Cruceño. Available online: https://www.comunicacion.gob.bo/?q=20151022/19658 (accessed on 25 December 2019).
  13. SMA Energy Systems. Hybrid Energy Supply for the city of Cobija, Bolivia. Available online: https://www.sma.de/es/productos/referencias/cobija-bolivia.html (accessed on 19 December 2019).
  14. ENDE Corporación. Inauguración: Planta Solar Fotovoltaica de Cobija. Available online: https://www.ende.bo/noticia/noticia/7 (accessed on 25 December 2019).
  15. ENERSOL. Planta Solar el Espino. Available online: http://www.enersol-sa.com/planta-solar-el-espino (accessed on 20 December 2019).
  16. Ministerio de Hidrocarburos. Inaguración: Planta Híbrida Solar-Diésel “El Espino”. Available online: https://www3.hidrocarburos.gob.bo/index.php/comunicaci%C3%B3n/prensa/3418-presidente-morales-inaugura-planta-h%C3%ADbrida-solar-di%C3%A9sel-%E2%80%9Cel-espino%E2%80%9D-con-capacidad-de-60-kw.html (accessed on 25 December 2019).
  17. Corria, M.E.; Cobas, V.M.; Lora, E.S. Perspectives of Stirling engines use for distributed generation in Brazil. Energy Policy 2006, 34, 3402–3408. [Google Scholar] [CrossRef]
  18. Cardozo, E. Combustion of Agricultural Residues: Application for Stirling Micro-combined Heat and Power. Ph.D. Thesis, KTH Royal Institute of Technology, Stockholm, Sweden, 2014. [Google Scholar]
  19. Ljunggren Falk, H.; Berg, S. Implementation of a Stirling Engine Generation System for Residential Use in Rural Areas of Beni Department of Bolivia. Bachelor’s Thesis, KTH, School of Industrial Engineering and Management (ITM), Stockholm, Sweden, 2014. [Google Scholar]
  20. Arco Sola, J.; Nelson, O. Applications of Biomass Stirling Engines for Electrification-A Case Study of Rural Areas in Bolivia. Bachelor’s Thesis, KTH, School of Industrial Engineering and Management (ITM), Stockholm, Sweden, 2014. [Google Scholar]
  21. Kylili, A.; Christoforou, E.; Fokaides, P.A. Environmental evaluation of biomass pelleting using life cycle assessment. Biomass Bioenergy 2016, 84, 107–117. [Google Scholar] [CrossRef]
  22. Núñez, C.A.F.; Fajardo, C.A.G.; Vargas, F.E.S. Producción y uso de pellets de biomasa para la generación de energía térmica: Una revisión a los modelos del proceso de gasificación. Iteckne 2012, 9, 21–30. [Google Scholar]
  23. Walker, G. Stirling Engines; Clarendon Press: Oxford, UK, 1980; ISBN 978-0-19-856209-2. [Google Scholar]
  24. Martini, W.R. Stirling Engine Design Manual; University Press of the Pacific: Honolulu, Hawaii, 2004; ISBN 978-1-4102-1604-5. [Google Scholar]
  25. Iwamoto, S.; Hirata, K.; Toda, F. Performance of Stirling Engines. JSME Int. J. Ser. B 2001, 44, 140–147. [Google Scholar] [CrossRef] [Green Version]
  26. Thombare, D.G.; Verma, S.K. Technological development in the Stirling cycle engines. Renew. Sustain. Energy Rev. 2008, 12, 1–38. [Google Scholar] [CrossRef]
  27. Staffell, I.; Brett, D.J.L.; Brandon, N.P.; Hawkes, A.D. Domestic Microgeneration: Renewable and Distributed Energy Technologies, Policies and Economics; Routledge: Abingdon, UK, 2015; ISBN 978-1-317-44884-6. [Google Scholar]
  28. Sultan, U. Stirling Engine Design Methodology with Advanced Optimization Models: Thermodynamics and CFD Analysis; LAP LAMBERT Academic Publishing: Saarbrücken, Germany, 2017. [Google Scholar]
  29. Valenti, G.; Silva, P.; Fergnani, N.; Campanari, S.; Ravidà, A.; Di Marcoberardino, G.; Macchi, E. Experimental and numerical study of a micro-cogeneration Stirling unit under diverse conditions of the working fluid. Appl. Energy 2015, 160, 920–929. [Google Scholar] [CrossRef] [Green Version]
  30. Shaneb, O.A.; Coates, G.; Taylor, P.C. Sizing of residential μCHP systems. Energy Build. 2011, 43, 1991–2001. [Google Scholar] [CrossRef]
  31. Zarinchang, J.; Yarmahmoudi, A. Optimization of thermal components in a Stirling engine. WSEA Trans. Heat Mass Transf. 2009, 1, 1–10. [Google Scholar]
  32. Kongtragool, B.; Wongwises, S. Thermodynamic analysis of a Stirling engine including dead volumes of hot space, cold space and regenerator. Renew. Energy 2006, 31, 345–359. [Google Scholar] [CrossRef]
  33. Costa, S.-C.; Tutar, M.; Barreno, I.; Esnaola, J.-A.; Barrutia, H.; García, D.; González, M.-A.; Prieto, J.-I. Experimental and numerical flow investigation of Stirling engine regenerator. Energy 2014, 72, 800–812. [Google Scholar] [CrossRef]
  34. Rogdakis, E.D.; Antonakos, G.D.; Koronaki, I.P. Thermodynamic analysis and experimental investigation of a Solo V161 Stirling cogeneration unit. Energy 2012, 45, 503–511. [Google Scholar] [CrossRef]
  35. Puech, P.; Tishkova, V. Thermodynamic analysis of a Stirling engine including regenerator dead volume. Renew. Energy 2011, 36, 872–878. [Google Scholar] [CrossRef]
  36. Ferreira, A.C.; Nunes, M.L.; Teixeira, J.C.; Martins, L.A.; Teixeira, S.F. Thermodynamic and economic optimization of a solar-powered Stirling engine for micro-cogeneration purposes. Energy 2016, 111, 1–17. [Google Scholar] [CrossRef]
  37. Ferreira, A.C.; Teixeira, S.; Teixeira, J.C.; Martins, L.B. Design optimization of a solar dish collector for its application with stirling engines. In Proceedings of the ASME 2015 International Mechanical Engineering Congress and Exposition; American Society of Mechanical Engineers Digital Collection, Houston, TX, USA, 13–19 November 2015. [Google Scholar]
  38. Arora, R.; Kaushik, S.C.; Kumar, R.; Arora, R. Multi-objective thermo-economic optimization of solar parabolic dish Stirling heat engine with regenerative losses using NSGA-II and decision making. Int. J. Electr. Power Energy Syst. 2016, 74, 25–35. [Google Scholar] [CrossRef]
  39. Barreto, G.; Canhoto, P. Modelling of a Stirling engine with parabolic dish for thermal to electric conversion of solar energy. Energy Convers. Manag. 2017, 132, 119–135. [Google Scholar] [CrossRef]
  40. Ahmed, F.; Hulin, H.; Khan, A.M. Numerical modeling and optimization of beta-type Stirling engine. Appl. Therm. Eng. 2019, 149, 385–400. [Google Scholar] [CrossRef]
  41. Zhu, S.; Yu, G.; Jongmin, O.; Xu, T.; Wu, Z.; Dai, W.; Luo, E. Modeling and experimental investigation of a free-piston Stirling engine-based micro-combined heat and power system. Appl. Energy 2018, 226, 522–533. [Google Scholar] [CrossRef]
  42. Li, Y.; Xiong, B.; Su, Y.; Tang, J.; Leng, Z. Particle swarm optimization-based power and temperature control scheme for grid-connected DFIG-based dish-stirling solar-thermal system. Energies 2019, 12, 1300. [Google Scholar] [CrossRef] [Green Version]
  43. Ferreira, A.C.; Silva, J.; Teixeira, S.; Teixeira, J.C.; Nebra, S. Analysis of the different renewable energy sources in the performance of a Stirling engine. In Proceedings of the 32nd International Conference on Efficiency, Cost, Optimization, Simulation and Environmental Impact of Energy Systems, Institute of Thermal Technology. Wroclaw, Poland, 23–28 June 2019; pp. 2367–2379. [Google Scholar]
  44. Hachem, H.; Gheith, R.; Aloui, F.; Nasrallah, S.B. Technological challenges and optimization efforts of the Stirling machine: A review. Energy Convers. Manag. 2018, 171, 1365–1387. [Google Scholar] [CrossRef]
  45. Bataineh, K.M. Optimization analysis of solar-powered average temperature Stirling heat engine. J. Energy S. Afr. 2015, 26, 55–66. [Google Scholar] [CrossRef] [Green Version]
  46. Grasse, W.; Hertlein, H.P.; Winter, C.-J.; Braun, G.W. Thermal solar power plants experience. In Solar Power Plants; Springer: Berlin, Germany, 1991; pp. 215–282. [Google Scholar]
  47. Entchev, E.; Gusdorf, J.; Swinton, M.; Bell, M.; Szadkowski, F.; Kalbfleisch, W.; Marchand, R. Micro-generation technology assessment for housing technology. Energy Build. 2004, 36, 925–931. [Google Scholar] [CrossRef]
  48. Cardozo, E.; Erlich, C.; Malmquist, A.; Alejo, L. Integration of a wood pellet burner and a Stirling engine to produce residential heat and power. Appl. Therm. Eng. 2014, 73, 671–680. [Google Scholar] [CrossRef]
  49. Dong, L.; Liu, H.; Riffat, S. Development of small-scale and micro-scale biomass-fuelled CHP systems–A literature review. Appl. Therm. Eng. 2009, 29, 2119–2126. [Google Scholar] [CrossRef] [Green Version]
  50. Maraver, D.; Sin, A.; Royo, J.; Sebastián, F. Assessment of CCHP systems based on biomass combustion for small-scale applications through a review of the technology and analysis of energy efficiency parameters. Appl. Energy 2013, 102, 1303–1313. [Google Scholar] [CrossRef]
  51. Obernberger, I. Trends and opportunities of micro-CHP technologies based on biomass combustion. In Proceedings of the 18th European Biomass Conference, Lyon, France, 3–7 May 2010; pp. 1–9. [Google Scholar]
  52. Liu, H. Biomass fuels for small and micro combined heat and power (CHP) systems: Resources, conversion and applications. In Small and Micro Combined Heat and Power (CHP) Systems; Elsevier: Amsterdam, The Netherlands, 2011; pp. 88–122. [Google Scholar]
  53. Gliński, M.; Bojesen, C.; Rybiński, W.; Bykuć, S. Modelling of the Biomass mCHP Unit for Power Peak Shaving in the Local Electrical Grid. Energies 2019, 12, 458. [Google Scholar] [CrossRef] [Green Version]
  54. ÖkoFEN. Pellematic Condens_e Project. Available online: http://www.okofen-e.com/en/pellematic_condens_e/ (accessed on 31 January 2020).
  55. Inresol, A.B. Company Introduction and Current V2-6 Products. Available online: https://energiforskmedia.blob.core.windows.net/media/22643/4-inresol-introduction-and-products.pdf (accessed on 31 January 2020).
  56. Araoz, J.; Platell, P.; Larsson-Mastonstråle, S. Design Analysis and Control of the V2-6 Stirling Engine. Available online: https://www.researchgate.net/publication/338431073_Design_analysis_and_control_of_the_V2-6_Stirling_engine (accessed on 25 December 2019).
  57. Beausoleil-Morrison, I.; Kelly, N. Specifications for Modelling Fuel Cell and Combustion-Based Residential Cogeneration Device within Whole-Building Simulation Programs; International Energy Agency: Paris, France, 2007; ISBN 978-0-662-47116-5.
  58. Thiers, S.; Aoun, B.; Peuportier, B. Experimental characterization, modeling and simulation of a wood pellet micro-combined heat and power unit used as a heat source for a residential building. Energy Build. 2010, 42, 896–903. [Google Scholar] [CrossRef]
  59. Veitch, D.; Mahkamov, K. Assessment of economical and ecological benefits from deployment of a domestic combined heat and power unit based on its experimental performance. Proc. Inst. Mech. Eng. A J. Power 2009, 223, 783–798. [Google Scholar] [CrossRef]
  60. Alexakis, A.; Gounis, G.; Mahkamov, K.; Davis, J. Experimental and Theoretical Evaluation of the Performance of a Whispergen Mk Vb micro CHP Unit in Typical UK House Conditions. In Proceedings of the World Renewable Energy Congress 2011, World Renewable Energy Congress 2011, Linköping, Sweden, 8–13 May 2011; pp. 810–817. [Google Scholar]
  61. Conroy, G.; Duffy, A.; Ayompe, L.M. Validated dynamic energy model for a Stirling engine μ-CHP unit using field trial data from a domestic dwelling. Energy Build. 2013, 62, 18–26. [Google Scholar] [CrossRef]
  62. Ferguson, A.; Kelly, N.; Weber, A.; Griffith, B. Modelling residential-scale combustion-based cogeneration in building simulation. J. Build. Perform. Simul. 2009, 2, 1–14. [Google Scholar] [CrossRef] [Green Version]
  63. Lombardi, K.; Ugursal, V.I.; Beausoleil-Morrison, I. Proposed improvements to a model for characterizing the electrical and thermal energy performance of Stirling engine micro-cogeneration devices based upon experimental observations. Appl. Energy 2010, 87, 3271–3282. [Google Scholar] [CrossRef]
  64. Ulloa, C.; Míguez, J.L.; Porteiro, J.; Eguía, P.; Cacabelos, A. Development of a Transient Model of a Stirling-Based CHP System. Energies 2013, 6, 3115–3133. [Google Scholar] [CrossRef] [Green Version]
  65. Schulz, S.; Schwendig, F. A General Simulation Model for Stirling Cycles. J. Eng. Gas Turbines Power 1996, 118, 1–7. [Google Scholar] [CrossRef]
  66. Kongtragool, B.; Wongwises, S. A review of solar-powered Stirling engines and low temperature differential Stirling engines. Renew. Sustain. Energy Rev. 2003, 7, 131–154. [Google Scholar] [CrossRef]
  67. Organ, A.J. The Regenerator and the Stirling Engine; Wiley: Hoboken, NJ, USA, 1997; ISBN 978-1-86058-010-9. [Google Scholar]
  68. Mahkamov, K. Design improvements to a biomass stirling engine using mathematical analysis and 3D CFD modeling. J. Energy Resour. Technol. Trans. ASME 2006, 128, 203–215. [Google Scholar] [CrossRef]
  69. Shih, H.-J. An analysis model combining gamma-type stirling engine and power converter. Energies 2019, 12, 1322. [Google Scholar] [CrossRef] [Green Version]
  70. Bouvenot, J.-B. Etudes Expérimentales et Numériques de Systèmes de Micro Cogénération Couplés Aux Bâtiments D’habitation et au Réseau Électrique. Ph.D. Thesis, Université de Strasbourg, Strasbourg, France, 2015. [Google Scholar]
  71. Balcombe, P.; Rigby, D.; Azapagic, A. Environmental impacts of microgeneration: Integrating solar PV, Stirling engine CHP and battery storage. Appl. Energy 2015, 139, 245–259. [Google Scholar] [CrossRef]
  72. Balcombe, P.; Rigby, D.; Azapagic, A. Energy self-sufficiency, grid demand variability and consumer costs: Integrating solar PV, Stirling engine CHP and battery storage. Appl. Energy 2015, 155, 393–408. [Google Scholar] [CrossRef]
  73. Shariatpanah, H.; Zareian Jahromi, M.; Fadaeinedjad, R. Simulation of a new grid-connected hybrid generation system with Stirling engine and wind turbine. J. Renew. Sustain. Energy 2013, 5, 063128. [Google Scholar] [CrossRef]
  74. Kadri, Y.; Abdallah, H.H. New grid connected hybrid generation system using wind turbine and solar Dish/Stirling engine. In Proceedings of the 2017 International Conference on Green Energy Conversion Systems (GECS), Hammamet, Tunisia, 23–25 March 2017; pp. 1–7. [Google Scholar]
  75. Rahman, A.; Saikia, L.C.; Sinha, N. Automatic generation control of an interconnected two-area hybrid thermal system considering dish-stirling solar thermal and wind turbine system. Renew. Energy 2017, 105, 41–54. [Google Scholar] [CrossRef]
  76. Jimenez Zabalaga, P.; Choque, L.; Cardozo, E.; Araoz, A. Performance Analysis of a Stirling Engine Hybrid Power System. In Proceedings of the 32nd International Conference on Efficiency, Cost, Optimization, Simulation and Environmental Impact of Energy Systems, ECOS 2019, Wroclaw, Poland, 23–28 June 2019; pp. 1095–1114. [Google Scholar]
  77. Mandelli, S.; Merlo, M.; Colombo, E. Novel procedure to formulate load profiles for off-grid rural areas. Energy Sustain. Dev. 2016, 31, 130–142. [Google Scholar] [CrossRef]
  78. Farret, F.A.; Simoes, M.G. Integration of Renewable Sources of Energy; John Wiley & Sons: Hoboken, NJ, USA, 2017; ISBN 978-1-119-13736-8. [Google Scholar]
  79. HOMER Energy LLC Welcome to HOMER. Available online: https://www.homerenergy.com/products/pro/docs/latest/index.html (accessed on 21 December 2019).
  80. Lambert, T.; Gilman, P.; Lilienthal, P. Micropower system modeling with HOMER. In Integration Alternative Sources Energy; John Wiley & Sons: Hoboken, NJ, USA, 2006; Volume 1, pp. 379–418. ISBN 978-0-471-75562-3. [Google Scholar]
  81. Engineers in Action. Active Projects. Available online: https://engineersinaction.org/2016/08/25/tacuaral-del-matto/ (accessed on 10 December 2019).
  82. Instituto Nacional de Estadística (INE). Censo Nacional de Población y Vivienda 2012. Available online: http://datos.ine.gob.bo/binbol/RpWebEngine.exe/Portal?BASE=CPV2012COM&lang=ESP (accessed on 12 December 2019).
  83. Meteotest. Meteonorm v.7.1.3. Available online: https://meteonorm.com/en/changelog (accessed on 12 December 2019).
  84. Lucano, M.; Fuentes, I.; Avilés, S. Mapa Solar de Bolivia. Available online: http://www.energetica.org.bo/energetica/publicacionesd.asp?d=278 (accessed on 18 December 2019).
  85. United Nations Department of Economic and Social Affairs (UNDESA); Fernández, M.; Rodriguez, G.; Orellano, R.; Terrazas, E. Cambio Climático, Agua y Energía en Bolivia. Sustainable Development Knowledge Platform. Available online: https://sustainabledevelopment.un.org/index.php?page=view&type=400&nr=1626&menu=1515 (accessed on 18 December 2019).
  86. Plan Para el Desarrollo de Las Energías Alternativas 2025. Available online: https://www.bivica.org/file/view/id/4689 (accessed on 19 December 2019).
  87. Fernández, M.; Saavedra, M. Bolivia. Available online: http://www.fao.org/3/T2363s/t2363s0q.htm (accessed on 19 December 2019).
  88. Gobierno Municipal Autónomo de San Borja. Plan de Desarrollo Municipal (PDM) 2007–2011; CICO-Beni: Beni, Bolivia, 2006.
  89. Hallberg, M.; Hallme, E. Energy Demand in Different Topographical Zones: A Field Study about the Domestic Energy Demand in the Rural Areas of Bolivia. Bachelor’s Thesis, KTH, School of Industrial Engineering and Management (ITM), Stockholm, Sweden, 2015. [Google Scholar]
  90. Subieta, S.L.B.; Tarantino, A.; Sabatini, S.; Riva, F.; Bonamini, G.; Quoilin, S. Feasibility Study of PV & Li-Ion Battery Based Micro-Grids for Bolivian Off-Grid Communities; EUROSOLAR: Düsseldorf, Germany, 2017. [Google Scholar]
  91. Toledo, E.; Arteaga, J.L. Proyecto de Electrificación Rural “Central Caranavi; Gobierno Municipal de Caranavi: La Paz, Bolivia, 2008.
  92. Reddy, Y.J.; Kumar, Y.V.P.; Raju, K.P.; Ramsesh, A. Retrofitted hybrid power system design with renewable energy sources for buildings. IEEE Trans. Smart Grid 2012, 3, 2174–2187. [Google Scholar] [CrossRef]
  93. Palizban, O.; Mekhilef, S. Hybrid Systems Control: With Renewable Energy Sources; LAP LAMBERT Academic Publishing: Saarbrücken, Germany, 2012; ISBN 978-3-659-15846-9. [Google Scholar]
  94. TRINA SOLAR. Módulo TSM-PD14. Available online: http://static.trinasolar.com/sites/default/files/LA_TSM_PD14_datasheet.pdf (accessed on 20 December 2019).
  95. Balfour, J.R.; Shaw, M.; Nash, N.B. Advanced Photovoltaic Installations; Jones & Bartlett Publishers: Burlington, MA, USA, 2011; ISBN 978-1-4496-2471-2. [Google Scholar]
  96. Birhuett García, E. Aprovechamiento de la Energía Solar Entre los Trópicos: Energía Fotovoltaica Para Ingenieros; Energética: Cochabamba, Bolivia, 2016. [Google Scholar]
  97. HOMER Energy LCC. PV Derating Factor. Available online: https://www.homerenergy.com/products/pro/docs/3.10/pv_derating_factor.html (accessed on 26 December 2019).
  98. Victron Energy. Gel and AGM Batteries. Available online: https://www.victronenergy.com/upload/documents/Datasheet-GEL-and-AGM-Batteries-EN.pdf (accessed on 20 December 2019).
  99. Hernández Arrondo, M. Análisis de Factibilidad de la Implantación de Sistemas Aislados Híbridos Eólicos-Diesel en Comunidades Rurales Remotas de Bolivia. Diseño de un Sistema de Este tipo en Una Comunidad Boliviana en la Que Resulte Factible. Master’s Thesis, Universidad Pública de Navarra, Pamplona, España, 2012. [Google Scholar]
  100. HOMER Energy LCC. Converter. Available online: https://www.homerenergy.com/products/pro/docs/3.10/converter.html (accessed on 27 December 2019).
  101. Victron Energy. MultiPlus Inverter/Chargers 2 kVA/3 kVA. Available online: https://www.victronenergy.com/upload/documents/Datasheet-Multiplus-inverter-charger_2kVA-and-3kVA-120V-US-EN.pdf (accessed on 20 December 2019).
  102. Finning International Inc. Technical Information C1.5 Diesel Generator Set 2017; Finning International Inc.: Vancouver, BC, Canada, 2017. [Google Scholar]
  103. KIPOR. Diesel Generator Maintenance Manual. Available online: http://kipor.es/uploads/_productos_kipor/id37/MANUAL_KDE7000.pdf (accessed on 30 November 2019).
  104. HOMER Energy LCC Fuels. Available online: https://www.homerenergy.com/products/pro/docs/3.10/fuels.html (accessed on 28 December 2019).
  105. Swaminathan, R. Cost effective, low capacity, biomass fired power plant. Energy Power 2013, 3, 1–6. [Google Scholar]
  106. Sugden, B.; Drury, T. Investigation into the viability of replacing internal combustion diesel generators with diesel fired stirling engine generators for remote microwave radio telecommunication applications. In Proceedings of the IEEE Intelec 2012, Scottsdale, AZ, USA, 30 September–4 October 2012; pp. 1–8. [Google Scholar]
  107. Inresol AB GENIUS: 10 kW PEAK POWER CHP MULTI FUEL STIRLING. Available online: http://www.skargardarnasriksforbund.se/document/2015-05-12_14314317931.pdf (accessed on 20 December 2019).
  108. Hawkes, A.; Leach, M. Comparison of Fuel Cell and Combustion Micro-CHP under Future Residential Energy Demand Scenarios; Imperial College Centre for Energy Policy and Technology (ICEPT): London, UK, 2007. [Google Scholar]
  109. Walker, S. Potential for Microgeneration: Study and Analysis; Department of Trade and Industry: London, UK, 2005.
  110. Beith, R. Small and Micro Combined Heat and Power (CHP) Systems: Advanced Design, Performance, Materials and Applications; Elsevier: Amsterdam, The Netherlands, 2011; ISBN 978-0-85709-275-5. [Google Scholar]
  111. Inresol, A.B. Data sheet: V2-6 Stirling engine. Available online: www.inresol.se (accessed on 22 December 2018).
  112. Cardozo, E.; Erlich, C.; Alejo, L.; Fransson, T.H. Combustion of agricultural residues: An experimental study for small-scale applications. Fuel 2014, 115, 778–787. [Google Scholar] [CrossRef]
  113. Vargas, N. Emprendimientos: Los Magos de la Cáscara de Castaña. Available online: https://mydokument.com/editor-marco-zelaya.html (accessed on 12 December 2019).
  114. Viceministerio de Electricidad y Energías Alternativas (VMEEA). Manual de Elaboración y Evaluación de Proyectos de Electrificación Rural; Imprenta Sagitario: La Paz, Bolivia, 2014. [Google Scholar]
  115. Banco Central de Bolivia (BCB). Indicadores de Inflación Anual. Available online: https://www.bcb.gob.bo/?q=indicadores_inflacion (accessed on 20 December 2019).
  116. HOMER Energy LCC. Cycle Charging. Available online: https://www.homerenergy.com/products/pro/docs/3.10/cycle_charging.html (accessed on 29 December 2019).
  117. HOMER Energy LCC. Load Following. Available online: https://www.homerenergy.com/products/pro/docs/3.10/load_following.html (accessed on 29 December 2019).
  118. Duffie, J.A.; Beckman, W.A. Solar Engineering of Thermal Processes; John Wiley & Sons: Hoboken, NJ, USA, 2013; ISBN 0-470-87366-3. [Google Scholar]
  119. Villalva, M.G.; Gazoli, J.R.; Ruppert Filho, E. Comprehensive approach to modeling and simulation of photovoltaic arrays. IEEE Trans. Power Electron. 2009, 24, 1198–1208. [Google Scholar] [CrossRef]
  120. Virtuani, A.; Lotter, E.; Powalla, M. Performance of Cu (In, Ga) Se2 solar cells under low irradiance. Thin Solid Film. 2003, 431, 443–447. [Google Scholar] [CrossRef]
  121. Jena, D.; Ramana, V.V. An accurate modeling of photovoltaic system for uniform and non-uniform irradiance. Int. J. Renew. Energy Res. 2015, 5, 29–40. [Google Scholar]
  122. Tremblay, O.; Dessaint, L.-A. Experimental validation of a battery dynamic model for EV applications. World Electr. Veh. J. 2009, 3, 289–298. [Google Scholar] [CrossRef] [Green Version]
  123. MathWorks, Inc. Generic Battery Model—Simulink. Available online: https://www.mathworks.com/help/physmod/sps/powersys/ref/battery.html (accessed on 29 December 2019).
  124. DiOrio, N.; Dobos, A.; Janzou, S.; Nelson, A.; Lundstrom, B. Technoeconomic Modeling of Battery Energy Storage in SAM; National Renewable Energy Lab. (NREL): Golden, CO, USA, 2015.
  125. Wijewardana, S.M. New dynamic battery model for hybrid vehicles and dynamic model analysis using simulink. Eng. J. Inst. Eng. Sri Lanka 2014, 47, 53–61. [Google Scholar] [CrossRef] [Green Version]
  126. Tan, Y.K.; Mao, J.C.; Tseng, K.J. Modelling of battery temperature effect on electrical characteristics of Li-ion battery in hybrid electric vehicle. In Proceedings of the 2011 IEEE Ninth International Conference on Power Electronics and Drive Systems, Singapore, 5–8 December 2011; pp. 637–642. [Google Scholar]
  127. Panasonic. VRLA: Technical Handbook Industrial Batteries for Professionals. Available online: https://eu.industrial.panasonic.com/sites/default/pidseu/files/downloads/files/panasonic-batteries-vrla-for-professionals_interactive.pdf (accessed on 12 December 2019).
  128. Monteiro, L.; Finelli, I.; Quinan, A.; Macêdo, W.N.; Torres, P.; Pinho, J.T.; Nohme, E.; Marciano, B.; Silva, S.R. Implementation and validation of energy conversion efficiency inverter models for small PV systems in the north of Brazil. In Renewable Energy in the Service of Mankind Vol II; Springer: Berlin, Germany, 2016; pp. 93–102. [Google Scholar]
  129. Juárez, R.T.; Fuerte-Esquivel, C.R.; Espinosa-Juárez, E.; Sandoval, U. Steady-state model of grid-connected photovoltaic generation for power flow analysis. IEEE Trans. Power Syst. 2018, 33, 5727–5737. [Google Scholar] [CrossRef]
  130. Victron Energy. Invesor Red BlueSolar. Available online: https://www.victronenergy.com.es/upload/documents/Datasheet%20-%20BlueSolar%20Grid%20Inverter%20-%20rev%2005%20-%20ES.pdf (accessed on 12 December 2019).
  131. Datta, M.; Senjyu, T.; Yona, A.; Funabashi, T.; Kim, C.-H. A frequency-control approach by photovoltaic generator in a PV–diesel hybrid power system. IEEE Trans. Energy Convers. 2010, 26, 559–571. [Google Scholar] [CrossRef]
  132. United Nations Refugee Agency (UNHCR). Diesel Generators: Technical Specification 2017; UNHCR: Geneva, Switzerland, 2017.
  133. Skarstein, Ø.; Uhlen, K. Design considerations with respect to long-term diesel saving in wind/diesel plants. Wind Eng. 1989, 13, 72–87. [Google Scholar]
  134. Holmes, K.; Hughes, M.; Mair, J.; Carlsen, J. Events and Sustainability; Routledge: Abingdon, UK, 2015; ISBN 978-1-317-80027-9. [Google Scholar]
  135. Papathanassiou, S.; Papadopoulos, M. Dynamic characteristics of autonomous wind–diesel systems. Renew. Energy 2001, 23, 293–311. [Google Scholar] [CrossRef]
  136. Beausoleil-Morrison, I. An Experimental and Simulation-Based Investigation of the Performance of Small-scale Fuel Cell and Combustion-Based Cogeneration Devices Serving Residential Buildings: Final Report of Annex 42 of the International Energy Agency’s Energy Conservation in Buildings and Community Systems Programme; Natural Resources Canada: Ottawa, ON, Canada, 2008; ISBN 0-662-47923-8.
  137. Alanne, K.; Söderholm, N.; Sirén, K. Implementation and validation of combustion engine micro-cogeneration routine for the simulation program IDA-ICE. In Proceedings of the Conference Building Simulation, Glasgow, Scotland, 27–30 July 2009. [Google Scholar]
  138. Ribberink, H.; Lombardi, K.; Yang, L.; Entchev, E. Investigation of a hybrid renewable–microgeneration energy system for power and thermal generation with reduced emissions. Proc. Inst. Mech. Eng. Part A J. Power Energy 2013, 227, 62–72. [Google Scholar] [CrossRef]
  139. Barley, C.D.; Winn, C.B.; Flowers, L.; Green, H.J. Optimal Control of Remote Hybrid Power Systems. Part 1: Simplified Model; National Renewable Energy Lab.: Golden, CO, USA, 1995.
  140. Dufo-López, R.; Bernal-Agustín, J.L. Generación de energía eléctrica con fuentes renovables. Optimización de Sistemas Híbridos Renovables Con Almacenamiento Energético Mediante Algoritmos Genéticos; Editorial Académica Española. LAP Lambert Academic Publishing GMBH & Co. KG: Saarbrücken, Germany, 2011. [Google Scholar]
  141. Barbieri, E.S.; Spina, P.R.; Venturini, M. Analysis of innovative micro-CHP systems to meet household energy demands. Appl. Energy 2012, 97, 723–733. [Google Scholar] [CrossRef]
  142. Bianchi, M.; De Pascale, A.; Spina, P.R. Guidelines for residential micro-CHP systems design. Appl. Energy 2012, 97, 673–685. [Google Scholar] [CrossRef]
  143. Sigarchian, S.G.; Malmquist, A.; Martin, V. Design optimization of a complex polygeneration system for a hospital. Energies 2018, 11, 1071. [Google Scholar] [CrossRef] [Green Version]
  144. Wegener, M.; Isalgué, A.; Malmquist, A.; Martin, A. 3E-analysis of a bio-solar CCHP system for the Andaman Islands, India—A case study. Energies 2019, 12, 1113. [Google Scholar] [CrossRef] [Green Version]
  145. Sigarchian, S.G.; Malmquist, A.; Martin, V. The choice of operating strategy for a complex polygeneration system: A case study for a residential building in Italy. Energy Convers. Manag. 2018, 163, 278–291. [Google Scholar] [CrossRef]
  146. Wang, J.; Zhai, Z.J.; Jing, Y.; Zhang, C. Particle swarm optimization for redundant building cooling heating and power system. Appl. Energy 2010, 87, 3668–3679. [Google Scholar] [CrossRef]
  147. Li, L.; Mu, H.; Gao, W.; Li, M. Optimization and analysis of CCHP system based on energy loads coupling of residential and office buildings. Appl. Energy 2014, 136, 206–216. [Google Scholar] [CrossRef]
  148. Zheng, C.Y.; Wu, J.Y.; Zhai, X.Q. A novel operation strategy for CCHP systems based on minimum distance. Appl. Energy 2014, 128, 325–335. [Google Scholar] [CrossRef]
  149. HOMER Energy LCC Simulation Time Step. Available online: https://www.homerenergy.com/products/pro/docs/3.10/simulation_time_step.html (accessed on 22 December 2019).
  150. HOMER Energy LCC How HOMER Calculates Emissions. Available online: https://www.homerenergy.com/products/pro/docs/3.10/how_homer_calculates_emissions.html (accessed on 29 December 2019).
  151. Genoa Stirling Engine ML1000. Available online: https://genoastirling.com/eng/engine-ml1000.php (accessed on 28 December 2019).
  152. Araoz Ramos, J.A. Thermodynamic Analysis of Stirling Engine Systems: Applications for Combined Heat and Power. Ph.D. Thesis, KTH, School of Industrial Engineering and Management (ITM), Stockholm, Sweden, 2015. [Google Scholar]
  153. Momoh, J.A. Energy Processing and Smart Grid; John Wiley & Sons: Hoboken, NJ, USA, 2018; ISBN 978-1-119-37614-9. [Google Scholar]
  154. Srinivasan, K.K.; Agarwal, A.K.; Krishnan, S.R.; Mulone, V. Natural Gas Engines: For Transportation and Power Generation; Springer: Berlin, Germany, 2018; ISBN 9811333076. [Google Scholar]
  155. Genoa Stirling Price List. Available online: https://genoastirling.com/eng/price-list.php (accessed on 30 December 2019).
  156. Ashurst, S. ARPA-E GENSETS Annual Review. Available online: https://arpa-e.energy.gov/sites/default/files/Ashurst_DeltaEE.pdf (accessed on 12 December 2019).
  157. De Paepe, M.; D’Herdt, P.; Mertens, D. Micro-CHP systems for residential applications. Energy Convers. Manag. 2006, 47, 3435–3446. [Google Scholar] [CrossRef]
  158. Zabalaga, J.P. Performance Analysis of a Stirling Engine Hybrid Power System—OpenEI Datasets. Available online: https://openei.org/datasets/dataset/performance-analysis-of-a-stirling-engine-hybrid-power-system (accessed on 31 December 2019).
Figure 1. Methodology and general approach of system analysis.
Energies 13 00980 g001
Figure 2. Global horizontal solar radiation, Tacuaral de Mattos, Bolivia.
Energies 13 00980 g002
Figure 3. Monthly average temperature data, Tacuaral de Mattos, Bolivia.
Energies 13 00980 g003
Figure 4. Average daily load profile, Tacuaral de Mattos, Bolivia.
Energies 13 00980 g004
Figure 5. Overall configuration of the hybrid power systems. (a) Photovoltaic (PV)/diesel/battery; (b) PV/Stirling/battery.
Energies 13 00980 g005
Figure 6. HOMER architecture of the hybrid power systems. (a) PV/diesel/battery; (b) PV/Stirling/battery.
Energies 13 00980 g006
Figure 7. Equivalent circuit of PV cell [118].
Energies 13 00980 g007
Figure 8. Nonlinear model of the battery [122]. The black lines indicate the flow of energy and the red lines indicate the flow of information.
Energies 13 00980 g008
Figure 9. Block diagram of the diesel generator model [131].
Energies 13 00980 g009
Figure 10. Mass and energy flow diagram of the Stirling engine model [62].
Energies 13 00980 g010
Figure 11. Simplified diagram of “load following-frugal” strategy [140].
Energies 13 00980 g011
Figure 12. Simplified diagram of “cycle charging-frugal-SOC setpoint” strategy [140].
Energies 13 00980 g012
Figure 13. Results of the simulation of the PV/diesel/battery system. (a) Generated power; (b) supplied power; and (c) state of charge of the battery bank on June 2.
Energies 13 00980 g013aEnergies 13 00980 g013b
Figure 14. Results of the simulation of the PV/Stirling/battery system. (a) Generated power; (b) supplied power; and (c) state of charge of the battery bank on June 21.
Energies 13 00980 g014aEnergies 13 00980 g014b
Figure 15. Electricity generation during winter solstice by component of the PV/Stirling/battery system regarding (a) Simulink model and (b) HOMER simulation.
Energies 13 00980 g015
Figure 16. Electricity generation during winter solstice by component of the PV/diesel/battery system regarding (a) Simulink model and (b) HOMER simulation.
Energies 13 00980 g016
Table 1. Daily electricity demand in the “Tacuaral de Mattos” community.
Type of LoadActive PowerDuration
Household
Lighting3 × 14 W19:00–22:00
Mobile charging3 × 5 W19:00–21:00
Each of both schools
Computer9 × 50 W07:30–12:30
15:00–18:00
Printer20 W
Mobile charging5 × 2 W
Church
Lighting10 × 26 W20:00–00:00
External Lighting7 × 30 W
Speaker100 W20:00–22:30
Primary healthcare facility
Lighting5 × 26 W08:00–12:00
19:00–22:30
External Lighting30 W18:30–22:30
TV80 W07:00–12:00
Mobile charging2 × 2 W05:00–23:00
Small fridge80 WWhole day
Computer50 WWhole day
Streetlight
Streetlight9 × 70 W19:00–06:00
Table 2. Summary of components’ specification.
ComponentSizeCapital Cost (USD)Replacement Cost (USD)O&M CostLifetime
PV panel0.32 kW747344USD $18/year25 years
Battery110 Ah432376USD $8/year500 cycles
(70% DOD)
Bidirectional Inverter1.6 kW17641604USD $160.40/year15 years
Diesel genset1 kW925804USD $0.0130/h20,000 h
Stirling engine1 kW42004200USD $0.0118/h25,000 h
Table 3. PV array specifications.
ParameterValueUnit
Maximum power point37.1V
Maximum power point current8.63A
Open circuit voltage45.8V
Short circuit current9.10A
Number of cells in the module72
Temperature coefficient of short circuit current0.00455A/°C
Temperature coefficient of open circuit voltage−0.14656V/°C
Normal operating cell temperature (NOCT)44°C
Ideality factor of diode1
Temperature coefficient of power−0.41%/°C
Solar irradiation coefficient0.12
Panel electrical efficiency16.5%
Table 4. Battery bank specifications.
ParameterValueUnit
Battery capacity110Ah
Nonimal voltage12V
Battery voltage constant12.8632V
Internal resistance0.004
Polarization constant0.0028319V/Ah
Exponential zone amplitude0.15876V
Exponential zone time constant inverse32.71541/Ah
Minimum state of charge30%
Reference battery temperature20°C
Battery roundtrip efficiency80%
Maximum charge power10,326W
Maximum discharge power20,955W
Number of equivalent full cycles500
Table 5. Converter specifications.
ParameterValueUnit
Converter efficiency at 100% of its nominal value86.53%
Converter efficiency at 50% of its nominal value91.50%
Converter efficiency at 10% of its nominal value90.00%
Table 6. Diesel genset specifications.
ParameterValueUnit
TD0.5s
TSM0.05s
HD1.5
KI4
R0.05
KS4
KD0.075
Ancillaries’ consumption−3.091Wconsumption/kWrated power
Table 7. Stirling engine specifications.
ParameterValueUnit
Maximum net power of Stirling engine from experimental calibration780W
Engine nominal temperature from experimental calibration465°C
CSt10,950J/K
CHX25,200J/K
UAHX18.9W/K
UAloss0.35W/K
a00.0999959
a4−0.0937248
a5−1.58009 × 10⁻⁶
a6−2.71098 × 10⁻⁴
a161.13114 × 10−3
a1a3; a7a15; a17a260
b00.415454
b3−5.61372
b43.38032
b54.23782 × 10−5
b6−1.94283 × 10⁻³
b16−0.01455
c00.266
c1c80
kp1
Power consumption during standby mode−157W
Power consumption during cool-down mode−36W
Cool-down time1800s
Cooling water temperature55°C
Table 8. Results of HOMER sizing.
ArchitecturePV/Diesel/Battery SystemPV/Stirling/Battery System
PV panels (kW)3.543.56
Stirling CHP module (kW)6.00
Diesel genset (kW)7.10
Batteries3434
Bidirectional inverter (kW)4.621.65
COE (USD/kWh)0.7780.726
Table 9. Comparison of one-year simulation results between Simulink models and HOMER.
ParameterSimulink ModelsHOMER
PV/Diesel/Battery SystemPV/Stirling/Battery SystemPV/Diesel/Battery SystemPV/Stirling/Battery System
Electricity generated by PV array (kWh/year)6013601352975518
Electricity generated by Stirling engine (kWh/year)0895507282
Electricity generated by Diesel Genset (kWh/year)6361064320
Biomass consumption (kg/year)0426403467
Diesel consumption (L/year)2,39502,0600
Annualized cost of the system (USD/year)13,760.8812,249.668314.557758.63
CO2 emissions (kg/year)630019705392
Table 10. Results of the annual performance evaluation of the hybrid PV/Stirling/battery system.
Performance CriterionsRate (%)
FSR5
CO2ERR69
ATCSR11
ISR28

