1. Introduction
Increasing energy demand stimulates economic growth (represented by the gross domestic product (GDP), but energy consumption also causes greenhouse gas emissions. One can see that GDP allows comparing the dynamics of economic development over time and on a cross-country basis but recently one can hardly assess economic growth without attributing attention to the consumption of natural resources and preserving the environment. In was in the past decades that the increasing attention to global warming and climate change has focused on the relationship between environmental pollutants, energy consumption and economic growth [
1,
2,
3]. In order to effectively control greenhouse gas (GHG) emissions and ensure the sustainability of economic development, it is important to better understand the relationships between greenhouse gas emissions, energy consumption and economic growth [
4,
5,
6]. The energy consumption for each mode of transport is calculated as direct energy (consumption of fossil fuels and electricity during transport) and cumulative energy (including the energy consumed during the entire production process (exploration, extraction, transport and production of fuels). The emissions are calculated as carbon dioxide (CO
2) equivalent to taking into account the total GHG potential of emissions from the combustion of fossil fuels. With regard to the above, one can differentiate between the direct CO
2 equivalent, which occurs at the place of energy conversion, and the cumulative CO
2 equivalent, which takes into account the entire production process (exploration, extraction, transport and production of fuel) [
7,
8].
One of the illustrative examples is the transport sector that, together with heating, constitutes one of the mean areas where profound electrification based on the renewable energy source (RES) became an overall target many governments worldwide committed to. Even though we do not base the results of our paper on this sector and do not analyze it or consider its in-depth implications, a simple reference can be useful here. In general, greenhouse gas emissions from the transport sector rose from around 146 megatons of carbon dioxide equivalents in 2000 to 174 megatons in 2017 [
9,
10]. Greenhouse gas emissions from passenger cars rose from 81 megatons in 2000 to 94 megatons in 2017. The largest increase from 50 megatons in 2000 to 72 megatons in 2017 is for freight vehicles [
11]. It is important that the company monitors both intensity and overall emissions. To keep the indicator set small, only the GHG intensity is included in this toolkit. Carbon offsets or other emissions trading programs are not considered in this toolkit.
With all of the above, it has to be mentioned that the EU is on the forefront of electric transportation with an ambitious plan to operate around 250 million electric vehicles (EVs) by 2025, which represents an effective transition to the climate targets [
12]. However, the effective reduction of energy consumption and greenhouse gas emissions that the electric transportation was envisaged to entail, seem to require proper energy policy and careful planning [
13]. The plans for transport electrification meet lots of obstacles and introduce several paradoxes. For example, one can observe that very often the electricity for powering the electric vehicles (EVs) is produced at the coal power stations, which creates a negative overall impact for the environment. Thence, it becomes apparent that the transition to clean electric transport should proceed along the lines of green-to-green paradigm and have to be considered from the point-of-view of the sustainability spectrum. It is not easy to provide a justified opinion on how to avoid the negative impact on the environment related to electromobility implementation. One of the possibilities would be the new advances in EV technology using alternative energy sources or improvements in battery storage technology that would allow to transfer large amounts of energy over large spaces.
Overall, one would probably agree with us that economic development and growth in today’s globalized and cumbersome world should be based on the optimal management of natural resources that would not induce any harm or burden for the future generations to come and to their natural environment. Thence, the attention should be focused on the resource management that would both ensure the global competitiveness of economies without compromising their economic growth and well-being.
This paper focuses on the renewable energy sources in the EU 2020 target for energy efficiency in the two EU Member States, Czech Republic and Slovakia. We scrutinize the EU national energy efficiency targets for 2020 (which represents an important energy policy task, as Newbery at al. [
14] demonstrate) and compare them with those of the two countries in question. Moreover, we employ the Auto Regressive Integrated Moving Average (ARIMA) model to obtain the forecasts for whether the 2020 targets can be achieved.
2. Energy Consumption and Greenhouse Gas Emissions
Household energy consumption is the main reason for the sector’s observed greenhouse gas emissions [
15,
16]. Although the ratio of total energy consumption to GHG emissions is direct, the contribution of electricity consumption to GHG generation compared to other fuels used primarily for thermal purposes is much more significant compared to their share of total energy [
17,
18]. This can be backed up with the fact that the average carbon intensity (in gCO
2-e/kWh) is internationally used in calculating greenhouse gas (GHG) emissions from the electricity system, and the role of GHG in this system is highlighted in many reports and studies covering a wide spectre of countries, including China, Iran as well as other countries (see, e.g., [
19,
20,
21]).
One of the main advantages of efficiency improvements is that they slow down the growth in energy consumption and reduce greenhouse gas emissions [
22,
23]. Energy intensity is the ratio of energy consumption per activity unit (such as floor space and GDP). In a way, energy efficiency is a measure of how effectively energy is used for a specific purpose and an important way of decarbonization [
24,
25,
26]. The energy evaluation makes a major contribution to ensuring that users are where improvements are needed. Lots can be achieved in an energy assessment, from the disclosure of energy consumption to waste identification and efficient energy use. Efficient use of energy is still an important national and international topic in the discussion of political measures, both in European Union and abroad [
27,
28]. The assessment of energy efficiency in different countries is important for each country. To improve the efficiency of anyone’s home, one should first carefully consider her or his options. An audit assesses electricity bills, insulation, heating and cooling systems, electrical systems as well as devices to determine how much energy your house uses and where energy is wasted. Following the recommendations and specially devised strategies can save 5% to 30% of the electricity bill [
29,
30].
Speaking about the penetration of the renewable energy sources into the traditional electricity and power systems, one has to look deeper into the specifics. In many countries, hydro sources are often needed to generate energy for almost all fuels and technologies to generate electricity, and energy is needed to treat and transport both water and wastewater [
31,
32,
33]. A fascinating case study on the subject is the state of California in the United States with its large water supply systems (which require a lot of energy for pumping) that moves water from the relatively humid northern areas of the state to the drier and more populated southern region (including the major metropolitan areas of Los Angeles and San Diego) [
34]. Conversely, the majority of the natural gas used in the water system is used for water heating on the consumer side of the water meter. Savings varied significantly across the state’s hydrological region, with the largest savings in the populous south coast region (237,200 mg) and the lowest savings in the sparsely populated North Lahontan region (1400 mg) [
35]. Since the savings in electricity and greenhouse gas emissions are calculated directly from the water savings, the results of these calculations showed a similar spatial variation.
When it comes to the debate of promoting renewable energy sources (RES) for the future electricity and power systems, one has to consider all possible alternatives [
36,
37,
38]. Apart from the traditional renewables there are also some carbon-based alternatives to oil (e.g., methane hydrates and the conversion of coal into methane gas, or the use of oil reservoirs and shale oil), but other interesting options present themselves too [
39,
40,
41]. One of them is the microbial fuel cells (MFCs) that convert biochemical to electrical energy [
42,
43,
44,
45,
46,
47,
48]. MFCs can be used in biomass-based energy production, even though a plethora of technical challenges has to be solved before they will be practical for renewable energy production [
49,
50,
51]. Nevertheless, their applications and possible deployment show that there are many less explored possibilities of using renewables in electricity generation, many of those not well-known to the general public or less explored by the researcher who might not be aware of all the possible implications for energy security and energy policy they might present [
52,
53,
54,
55,
56].
All in all, energy consumption and greenhouse gas emissions constitute an important problem that all the world’s largest economies are facing today, However, one can also see that this might be a political, rather than a climate protection, energy efficiency or economic issue. World leaders and important stakeholders are interested in re-election or maintaining their leading positions. Therefore, they want to make sure economic stability and growth are delivered at all costs. However, in the same time they have to face the commitments of tackling the climate changes and global warming, as well as introducing more renewable energy sources into the generation of power and electricity. Somehow, a balance should be reached and maintained to keep both the voters and the international partners satisfied. The European Union (EU) is in a specifically difficult position in this situation due to its complex structure, which lacks the traits of the federal state, and has a complex decision-making process as well as evaluation and acceptance procedures.
3. Europe 2020 Strategy and the 3 × 20 Climate and Energy Package
One would probably agree with is that EU plays a crucial role in the world as a powerful actor and leader in sustainable economic growth. The EU serves as a role model for more governments and actors when it comes to taking real and effective action [
57]. The search for ways to increase and improve the use of renewable energies should not stop in 2020. Countries should continue to focus on this area in the coming decades and shape the next steps together. The first deadline for adoption of the package in Parliament was March 2009. However, there have been protests in some countries regarding the modalities to achieve these goals, particularly as a result of the economic and financial crisis that has led to tough negotiations between countries. The European Council of the 11th and 12th of December 2008 finally adopted the package but changed the original measures.
Various EU countries have many issues with meeting their energy efficiency and consumption obligations. For example, the French government admits failing to meet its climate change commitments. In 2017, France achieved 16.3% of its energy consumption from renewable sources, compared to its 23% target for 2020. Wood and hydropower are the main sources of green energy in France, ahead of biofuels [
58,
59]. The legislative proposals concern energy efficiency, the design of the electricity market and the governance rules for the Energy Union.
The climate package recognizes energy poverty as a major challenge in Europe and, with these proposals, aims to protect vulnerable consumers through targeted socio-political and energy-efficient measures [
60,
61]. In the package, one can see only minimum requirements for total energy efficiency. They regulate the maximum permissible energy consumption per floor area or room volume in new and existing buildings.
There are also provisions such as energy performance certificates, indicating the energy consumption of an existing or new building or a new building unit, and usually classify it in steps that differ in terms of energy consumption per square meter [
62,
63]. The certificates are issued by certified energy auditors and must be issued publicly, for example in advertisements for the sale or rental of buildings.
In this regard, the policy stipulates that regular maintenance can lead to significant operational improvements and recommends combining these inspections with certifications. The number of charging stations has been growing faster and faster than the number of EVs that could use them, and their installation is becoming increasingly profitable for electricity suppliers. In order to boost the market for cleaner vehicles, the EU Parliament and the Council agreed in February 2019 to amend the directive on the promotion of clean and energy-efficient vehicles [
64]. The directive stipulates that authorities that procure vehicles (e.g., for public transport) must take their CO
2 emissions and the emissions of other pollutants into account. The EU emissions trading system includes emissions from more than 11,000 power plants and industrial plants and, from 2013, emissions from aviation. Around 40% of total EU emissions are covered by the regulation [
65]. In addition to the EU27, Croatia, Iceland, Norway and Liechtenstein are also part of the ETS. When the EHS was introduced in 2005, it was the first trading system for greenhouse gases. As already mentioned, the EU should achieve its overall GHG target. The EEA’s projections show that it will cut its greenhouse gas emissions by six percentage points above the 2020 target with existing measures and by seven percentage points by adopting additional measures. Since 2016, five EU countries have actually increased their greenhouse gas emissions compared to 1990. Careful monitoring was applied to the primary energy consumption in order to assess progress in energy efficiency in terms of goals and policies for the European Union and its Member States. In 2009, the Europe 2020 Strategy was adapted [
66]. It includes very important and timely targets set for the whole European Union are as follows:
reducing greenhouse gas emissions by at least 20% compared to 1990 levels;
increasing the share of renewable energy in the final energy consumption to 20%;
moving towards a 20% increase in energy efficiency (from 2005 levels).
Table 1 shows the national energy efficiency targets for 2020 for the EU28, Czech Republic and Slovakia.
A little explanation should be made here for better clarity of the explanation of our empirical model and its main results and implications that are presented in the next sections. As opposed to final energy consumption, primary energy consumption refers to energy that has not been subject to any conversion or transformation process. Energy intensity represents the amount of primary energy consumption per unit of GDP. The energy intensity indicator depends on the industrial structure of the economy and thus is not an exact proxy for energy efficiency in the EU Member States.
Moreover, several more methodological issues should be explained about the energy intensity (EI), gross inland energy consumption (GIEC), gross domestic product (GDP) and their relationship. All of the above can be expressed in the formula that follows:
where:
EI—energy intensity;
GIEC—gross inland energy consumption;
GDP—gross domestic product.
4. Methodology
The data used for our empirical models was accessed in December 2019 via Eurostat, a European Statistical Office. Some of the latest data are for 2018 (GDP), but others are for 2017 (e.g., GHG), which is given by the data availability and accessibility.
For forecasting time series, a popular and widely used statistical method called ARIMA [
67,
68,
69] has been used. ARIMA is an acronym for Auto Regressive Integrated Moving Average. AR is a class of linear model where the variable of interest is regressed on its own lagged values. MA is also class of linear model, where the variable of interest is modeled with its own imperfectly predicted values of current and previous times [
70]. The I is an integration—it specifies the number of times the differencing operation is performed on a series to make it stationary.
The Auto Regression (AR) process is written as
where:
ϕt−1—parameters;
yt−i—regressors;
ϵ—error.
Moving Average (MA) can be written in terms of error terms:
where:
θt−1—parameters;
ϵt−i—regressors—imperfections (errors) in predicting previous terms;
ϵ—error.
The ARMA process has the mathematical form:
As a result, the differencing is the ARIMA process. The “predictors” on the right-hand side include both the lagged values of yt and the lagged errors. We call this an ARIMA (p, d, q) model, where parameters (p, d, q) describe:
AR: p—periods to lag;
I: d—the degree of differencing;
MA: q—the lag of the error component.
All figures used hereinafter in this paper and employed for comparing the situation in Czech Republic and Slovakia were prepared separately for Czech Republic and Slovakia due to one simple fact that the scale of data was different and it would not look clear and comparable if placed on the same figure.
Moreover, we should also explain that the confidence interval (Lo-Hi) of a forecast (shadow on figures) is the range within which the value we forecast will lie with a certain probability. For example, if, for GHG for Slovakia in 2018, the Lo.95-Hi.95 percent of the forecast confidence interval is between 40.09 and 48.38, then with a probability of 95%, GHG (greenhouse gas emission) will be at least 40.09 Mt and at most 48.38 Mt.
The empirical models used hereinafter is based on our previous similar studies covering other EU countries (e.g., Poland) and focusing on the same issues (see, e.g., [
71]).
5. Results and Discussions
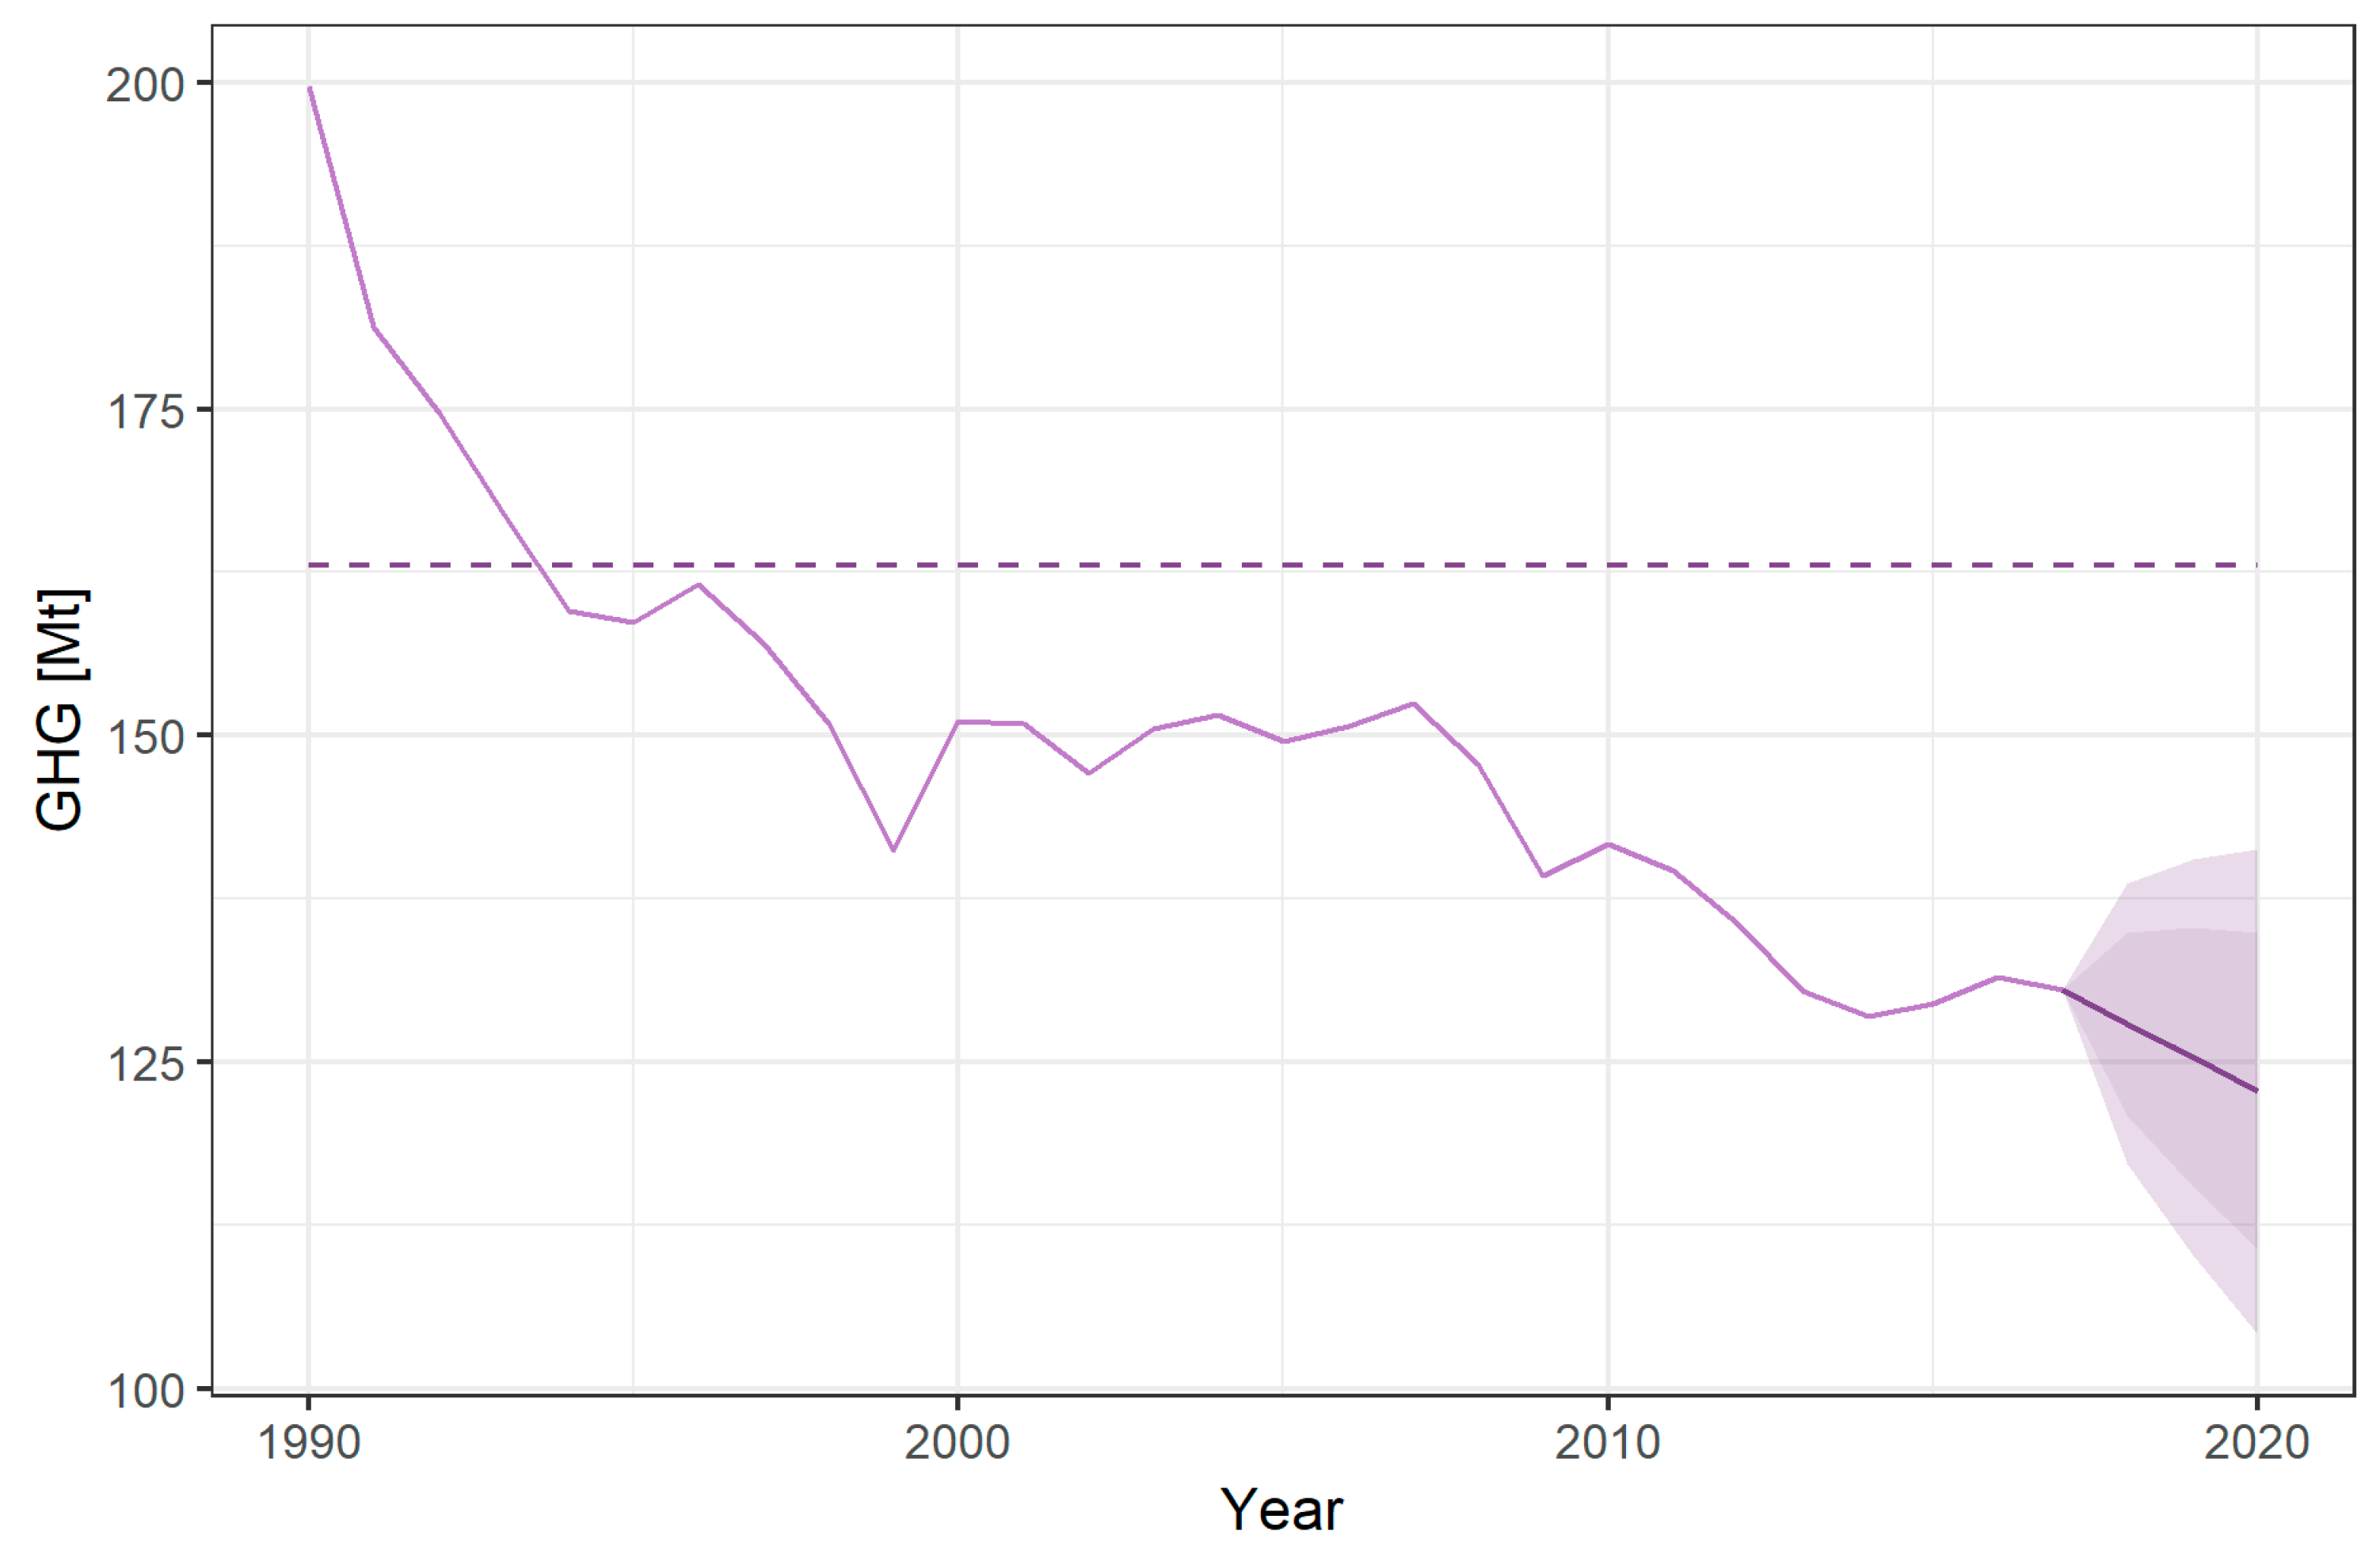
Our results are outlined below as follows: First, let us look at the greenhouse gas emission (GHG) in the Czech Republic. The dashed line in
Figure 1 represents the GHG emission limit for 2020. For the Czech Republic it is no more than 9% comparing to year 2005 (149.53 Mt). It means that the limit for 2020 equals 162.99 Mt. The emissions are decreasing (even taking into the account the high and low forecast as shown in
Figure 1).
Table 2 depicts the values presented in
Figure 1 in more detail, including the forecast, as well as forecast for the values of Hi and Lo at 80% and 95%, respectively, for the Czech Republic.
Our key conclusion stemming from the analysis of GHG emissions in Czech Republic is that the country is likely to meet the requirements of Europe 2020 in terms of greenhouse gas emissions (GHG), because from 2007 onwards the trend is towards a continuous reduction in greenhouse gas emissions.
Looking into the case of Slovakia, one can see the following story (see
Figure 2 that follows). For Slovakia the GHG limit is no more than 13% comparing to year 2005 (51.28 Mt). It means the limit for 2020 equals 57.95 Mt.
Table 3 depicts the values presented in
Figure 1 in more detail, including the forecast, and the Hi and Lo at 80% and 95%, respectively, for Slovakia.
The key conclusions for Slovakia that were obtained appear to be similar to in the situation in the Czech Republic.
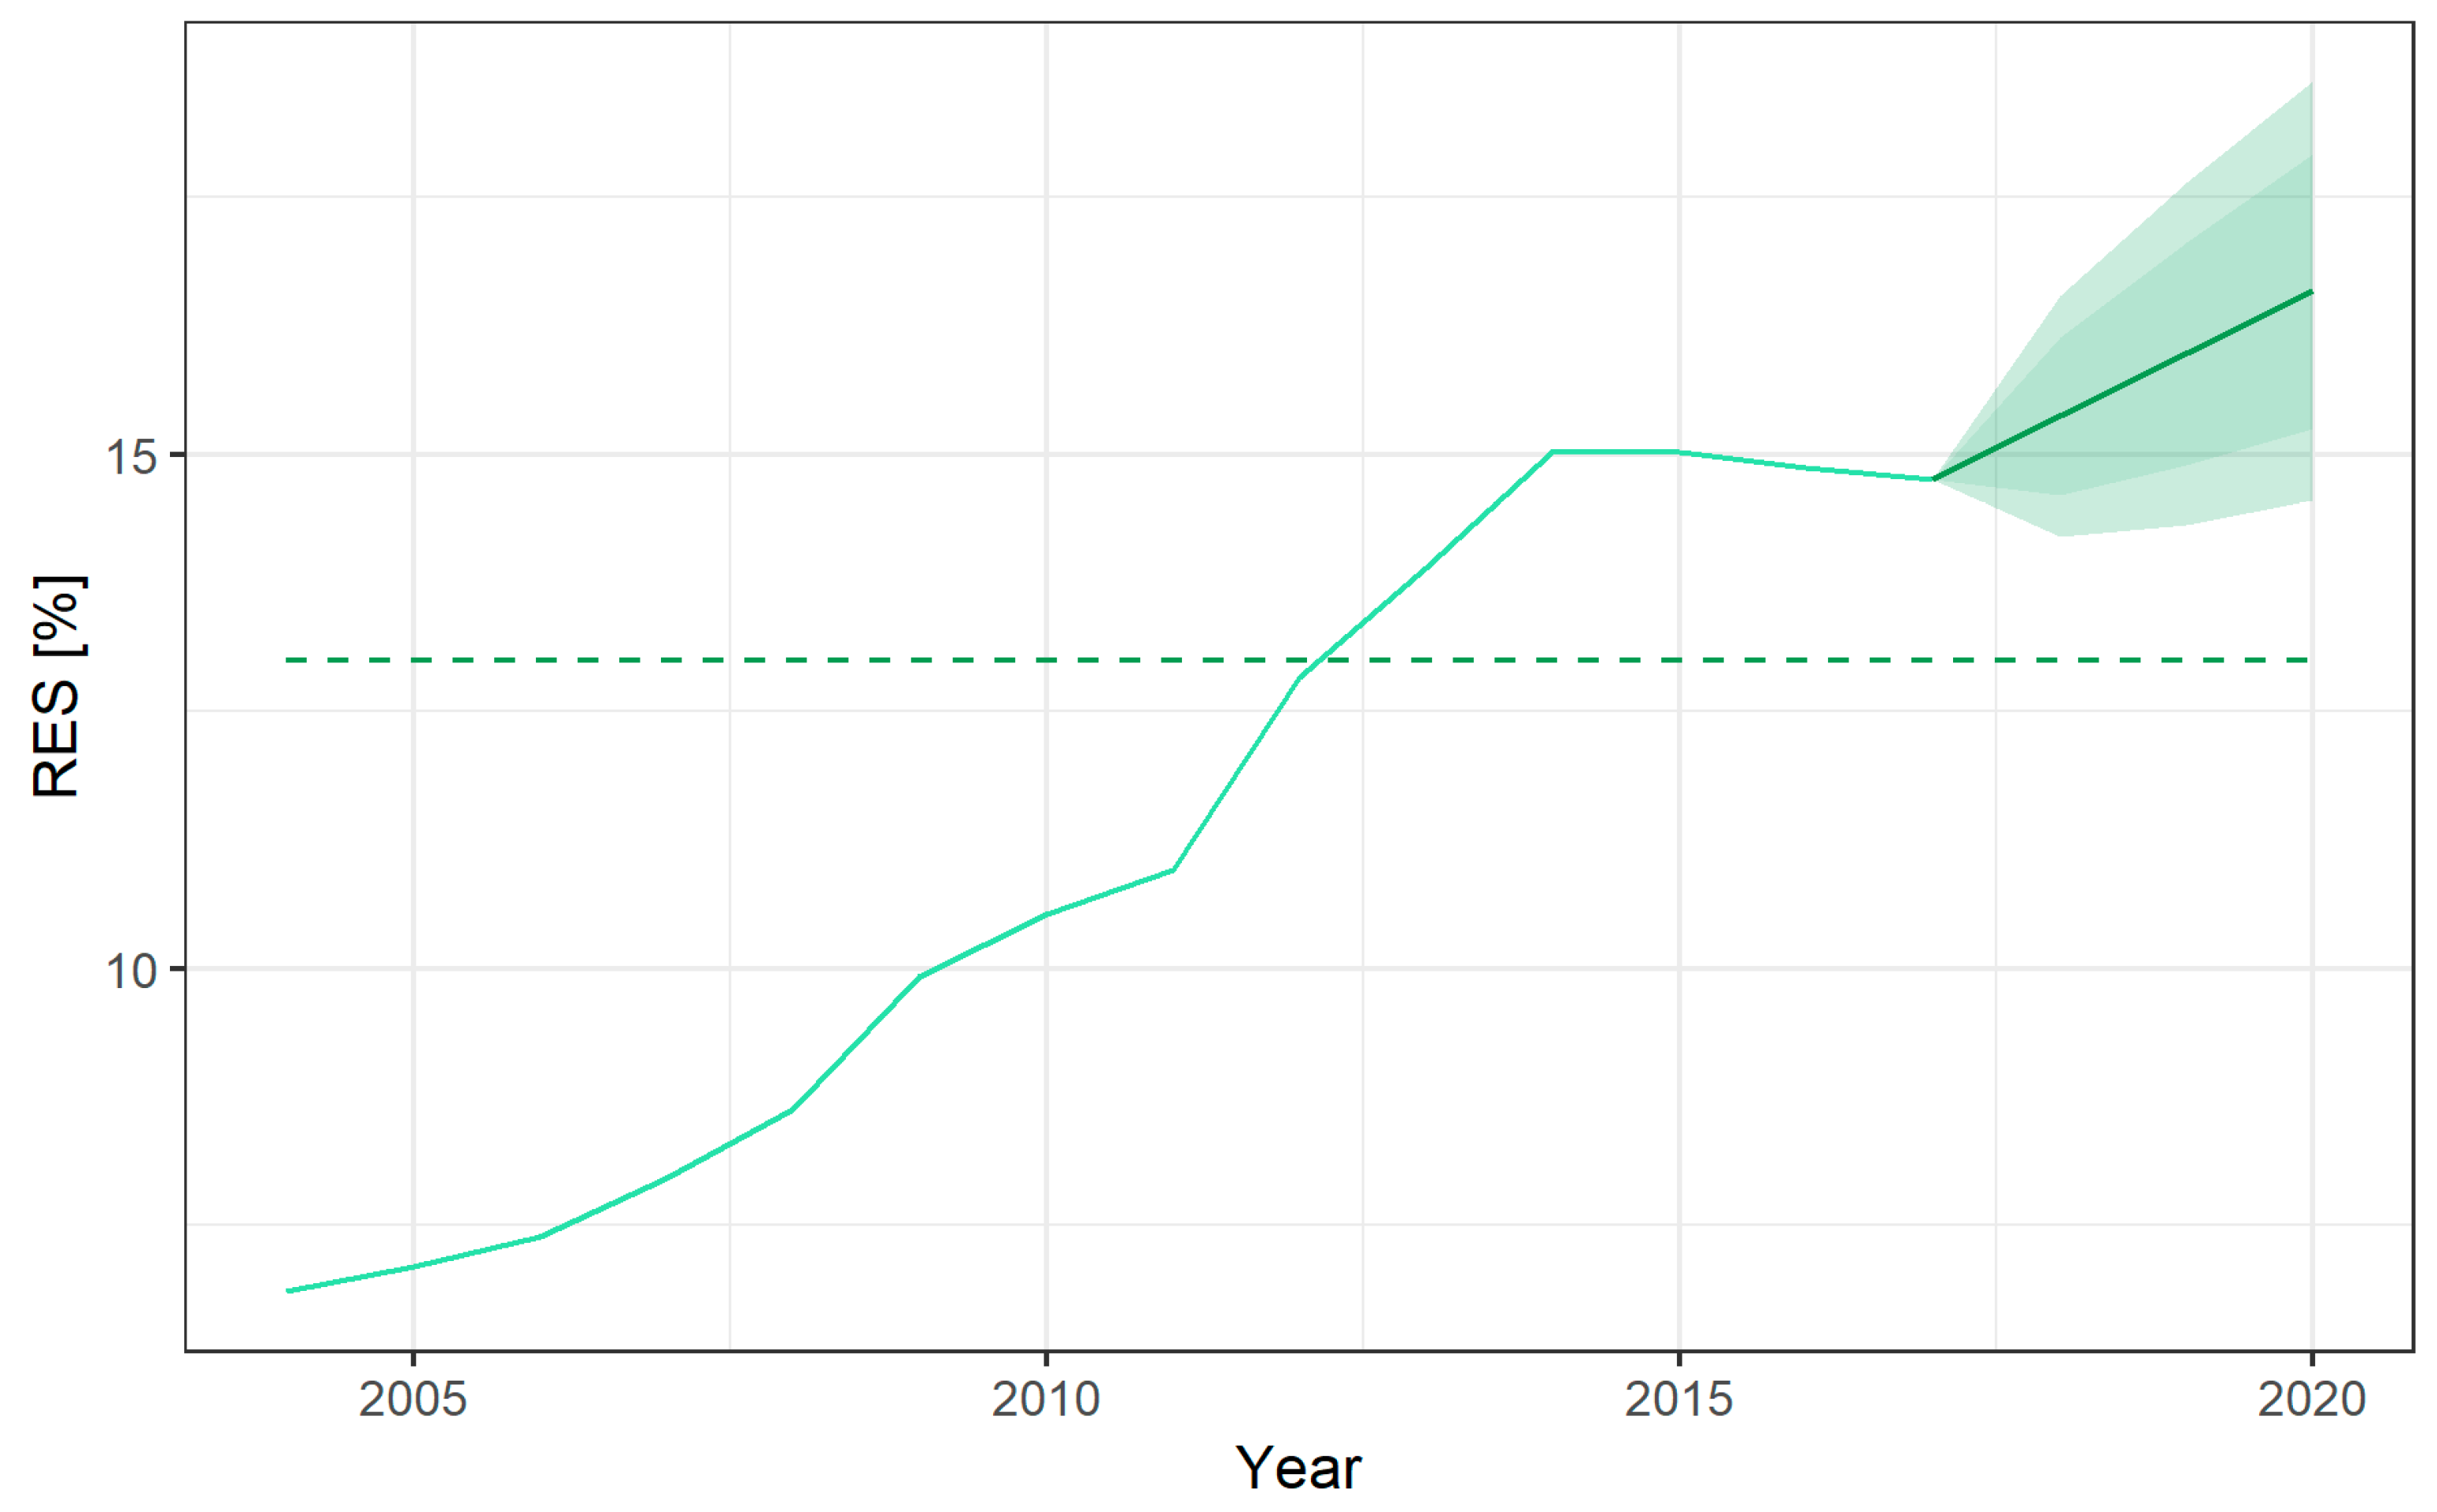
Figure 3 shows the share of renewable energy sources (RES) in the Czech Republic.
The share of renewable energy in Czech Republic has been growing and since 2005 has always been under Europe 2020 target (see
Table 4).
Even the most pessimistic forecasts (Lo.95) show that the RES will be above the assumed level of 13%.
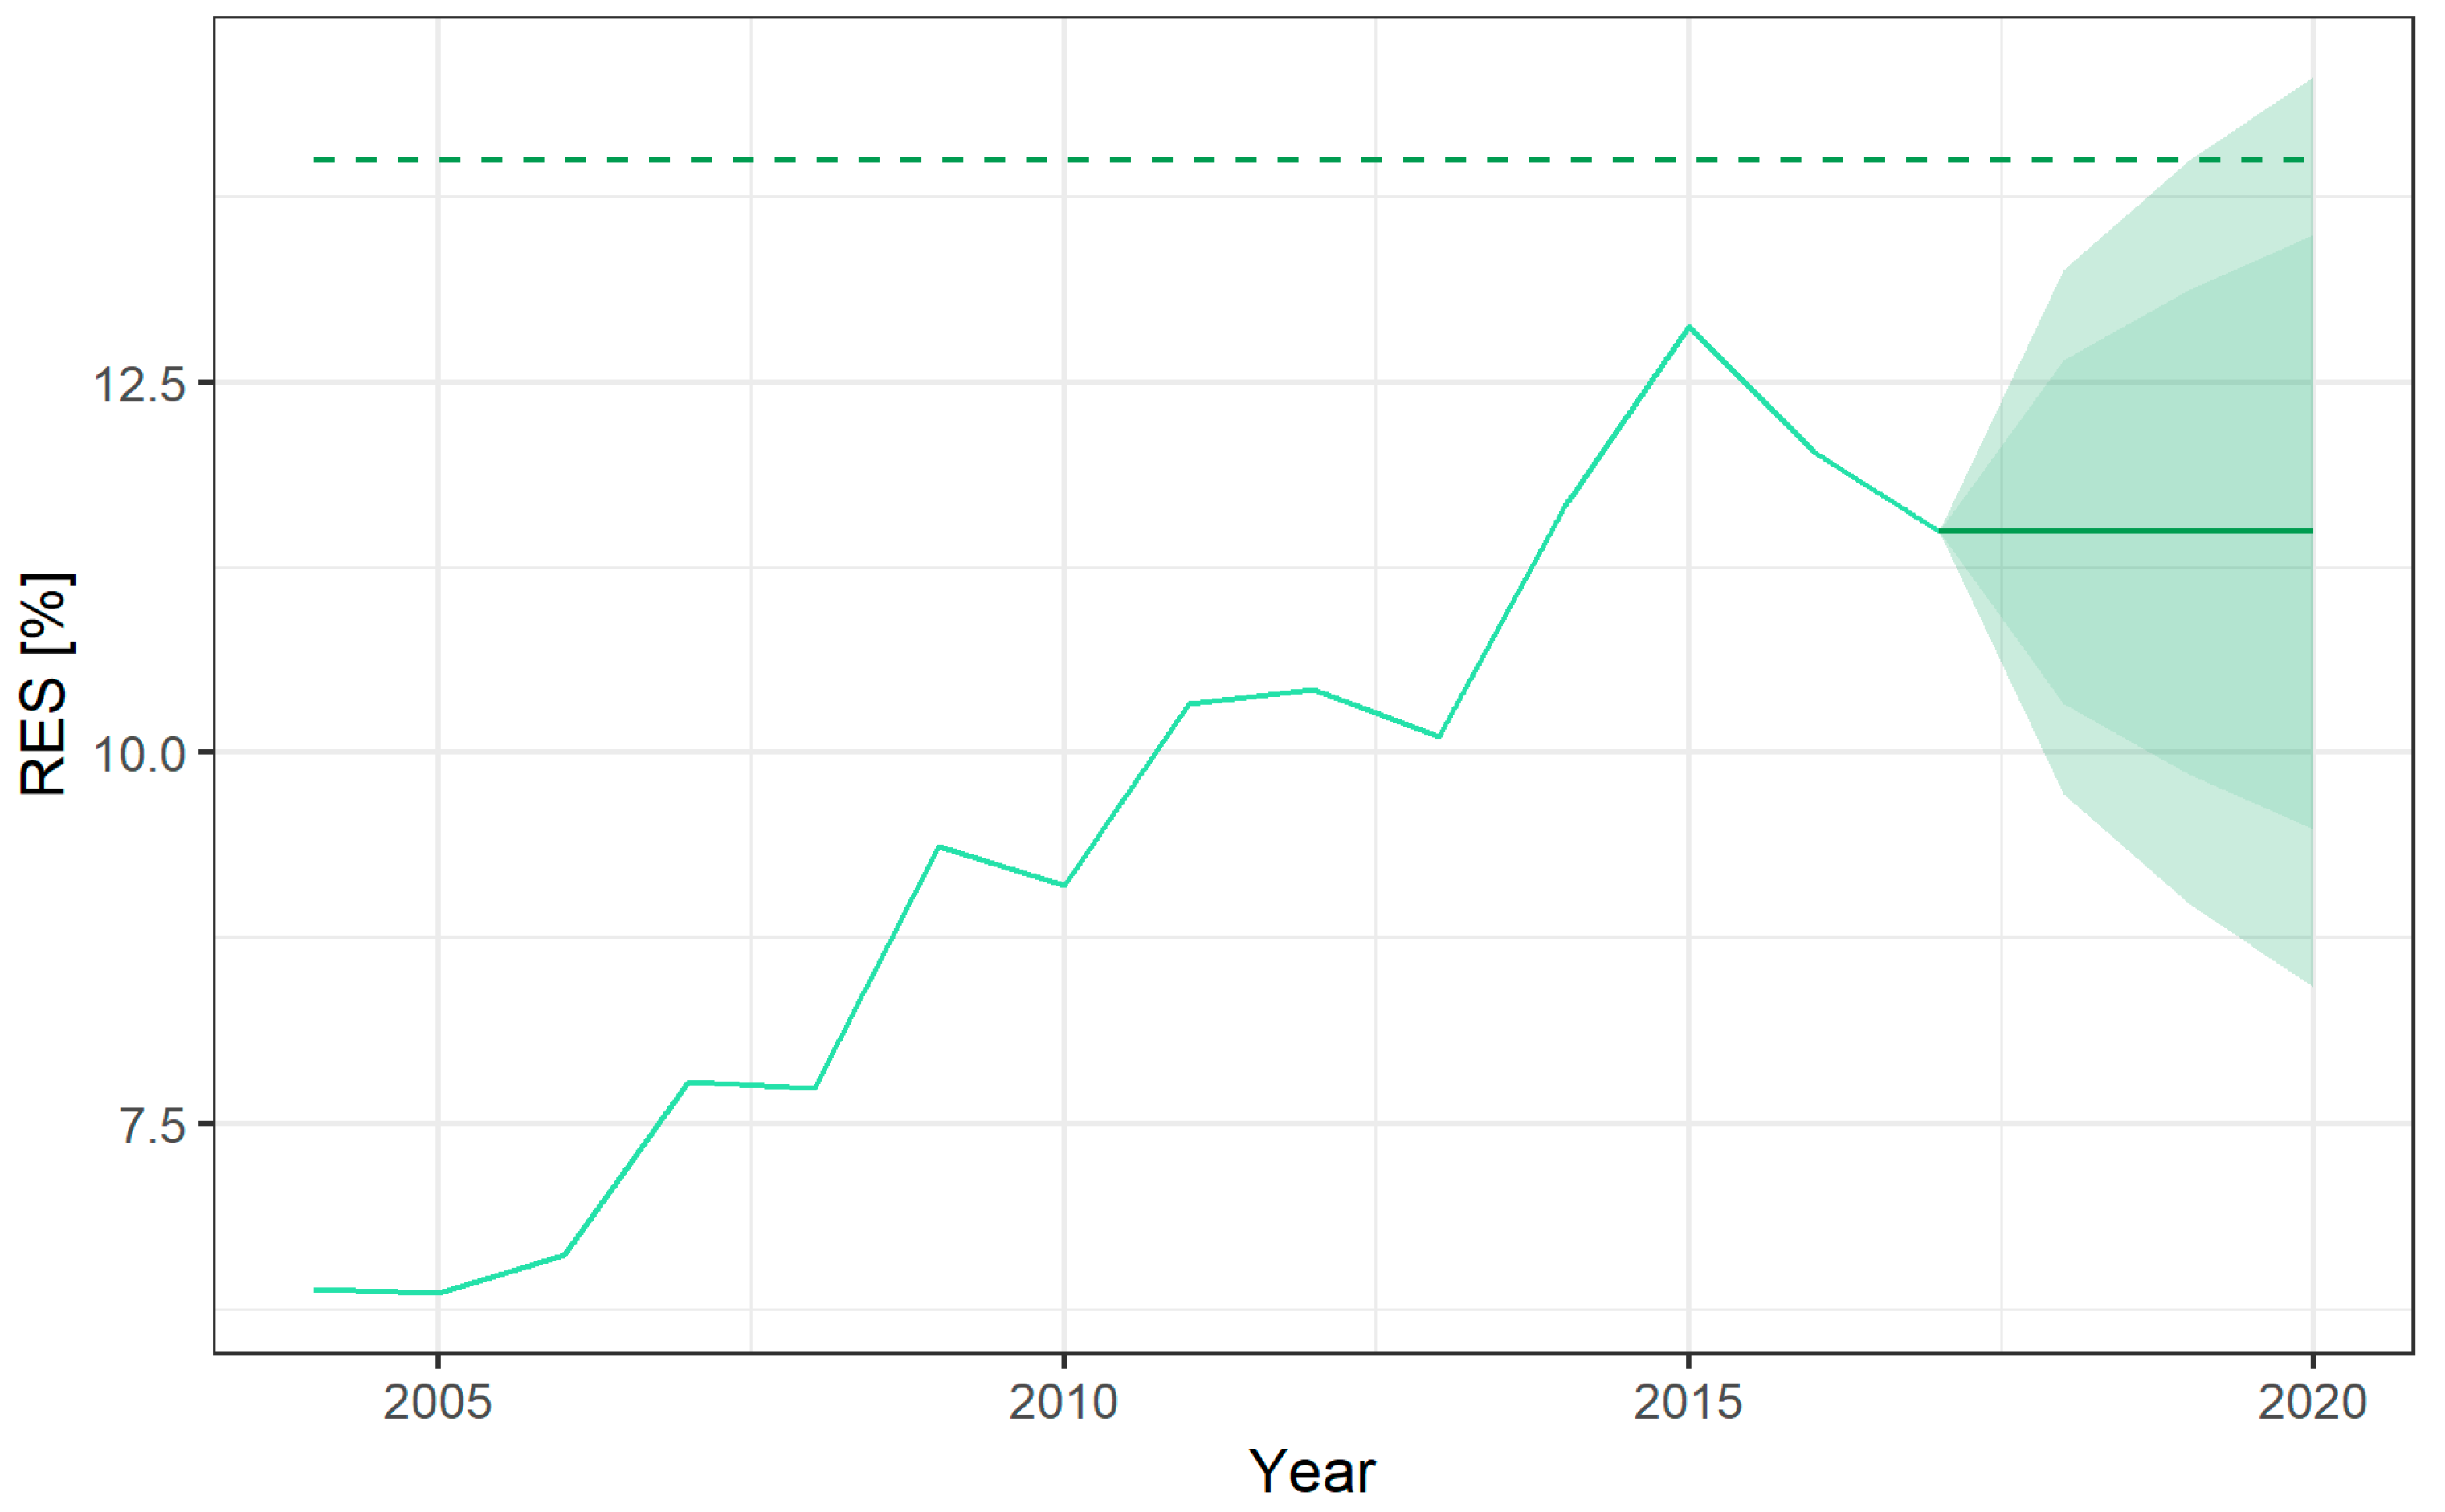
Figure 4 above show the results of the similar simulation for Slovakia.
From
Figure 4 and
Table 5 one can deduct that the maximum share of renewable energy in Slovakia was in 2015, and since this year has been decreasing. Therefore, it is improbable that Slovakia will achieve Europe 2020 goals in the RES indicator.
Figure 5 and
Table 6 shows the primary energy consumption and final energy consumption (PEC, FEC) for the Czech Republic.
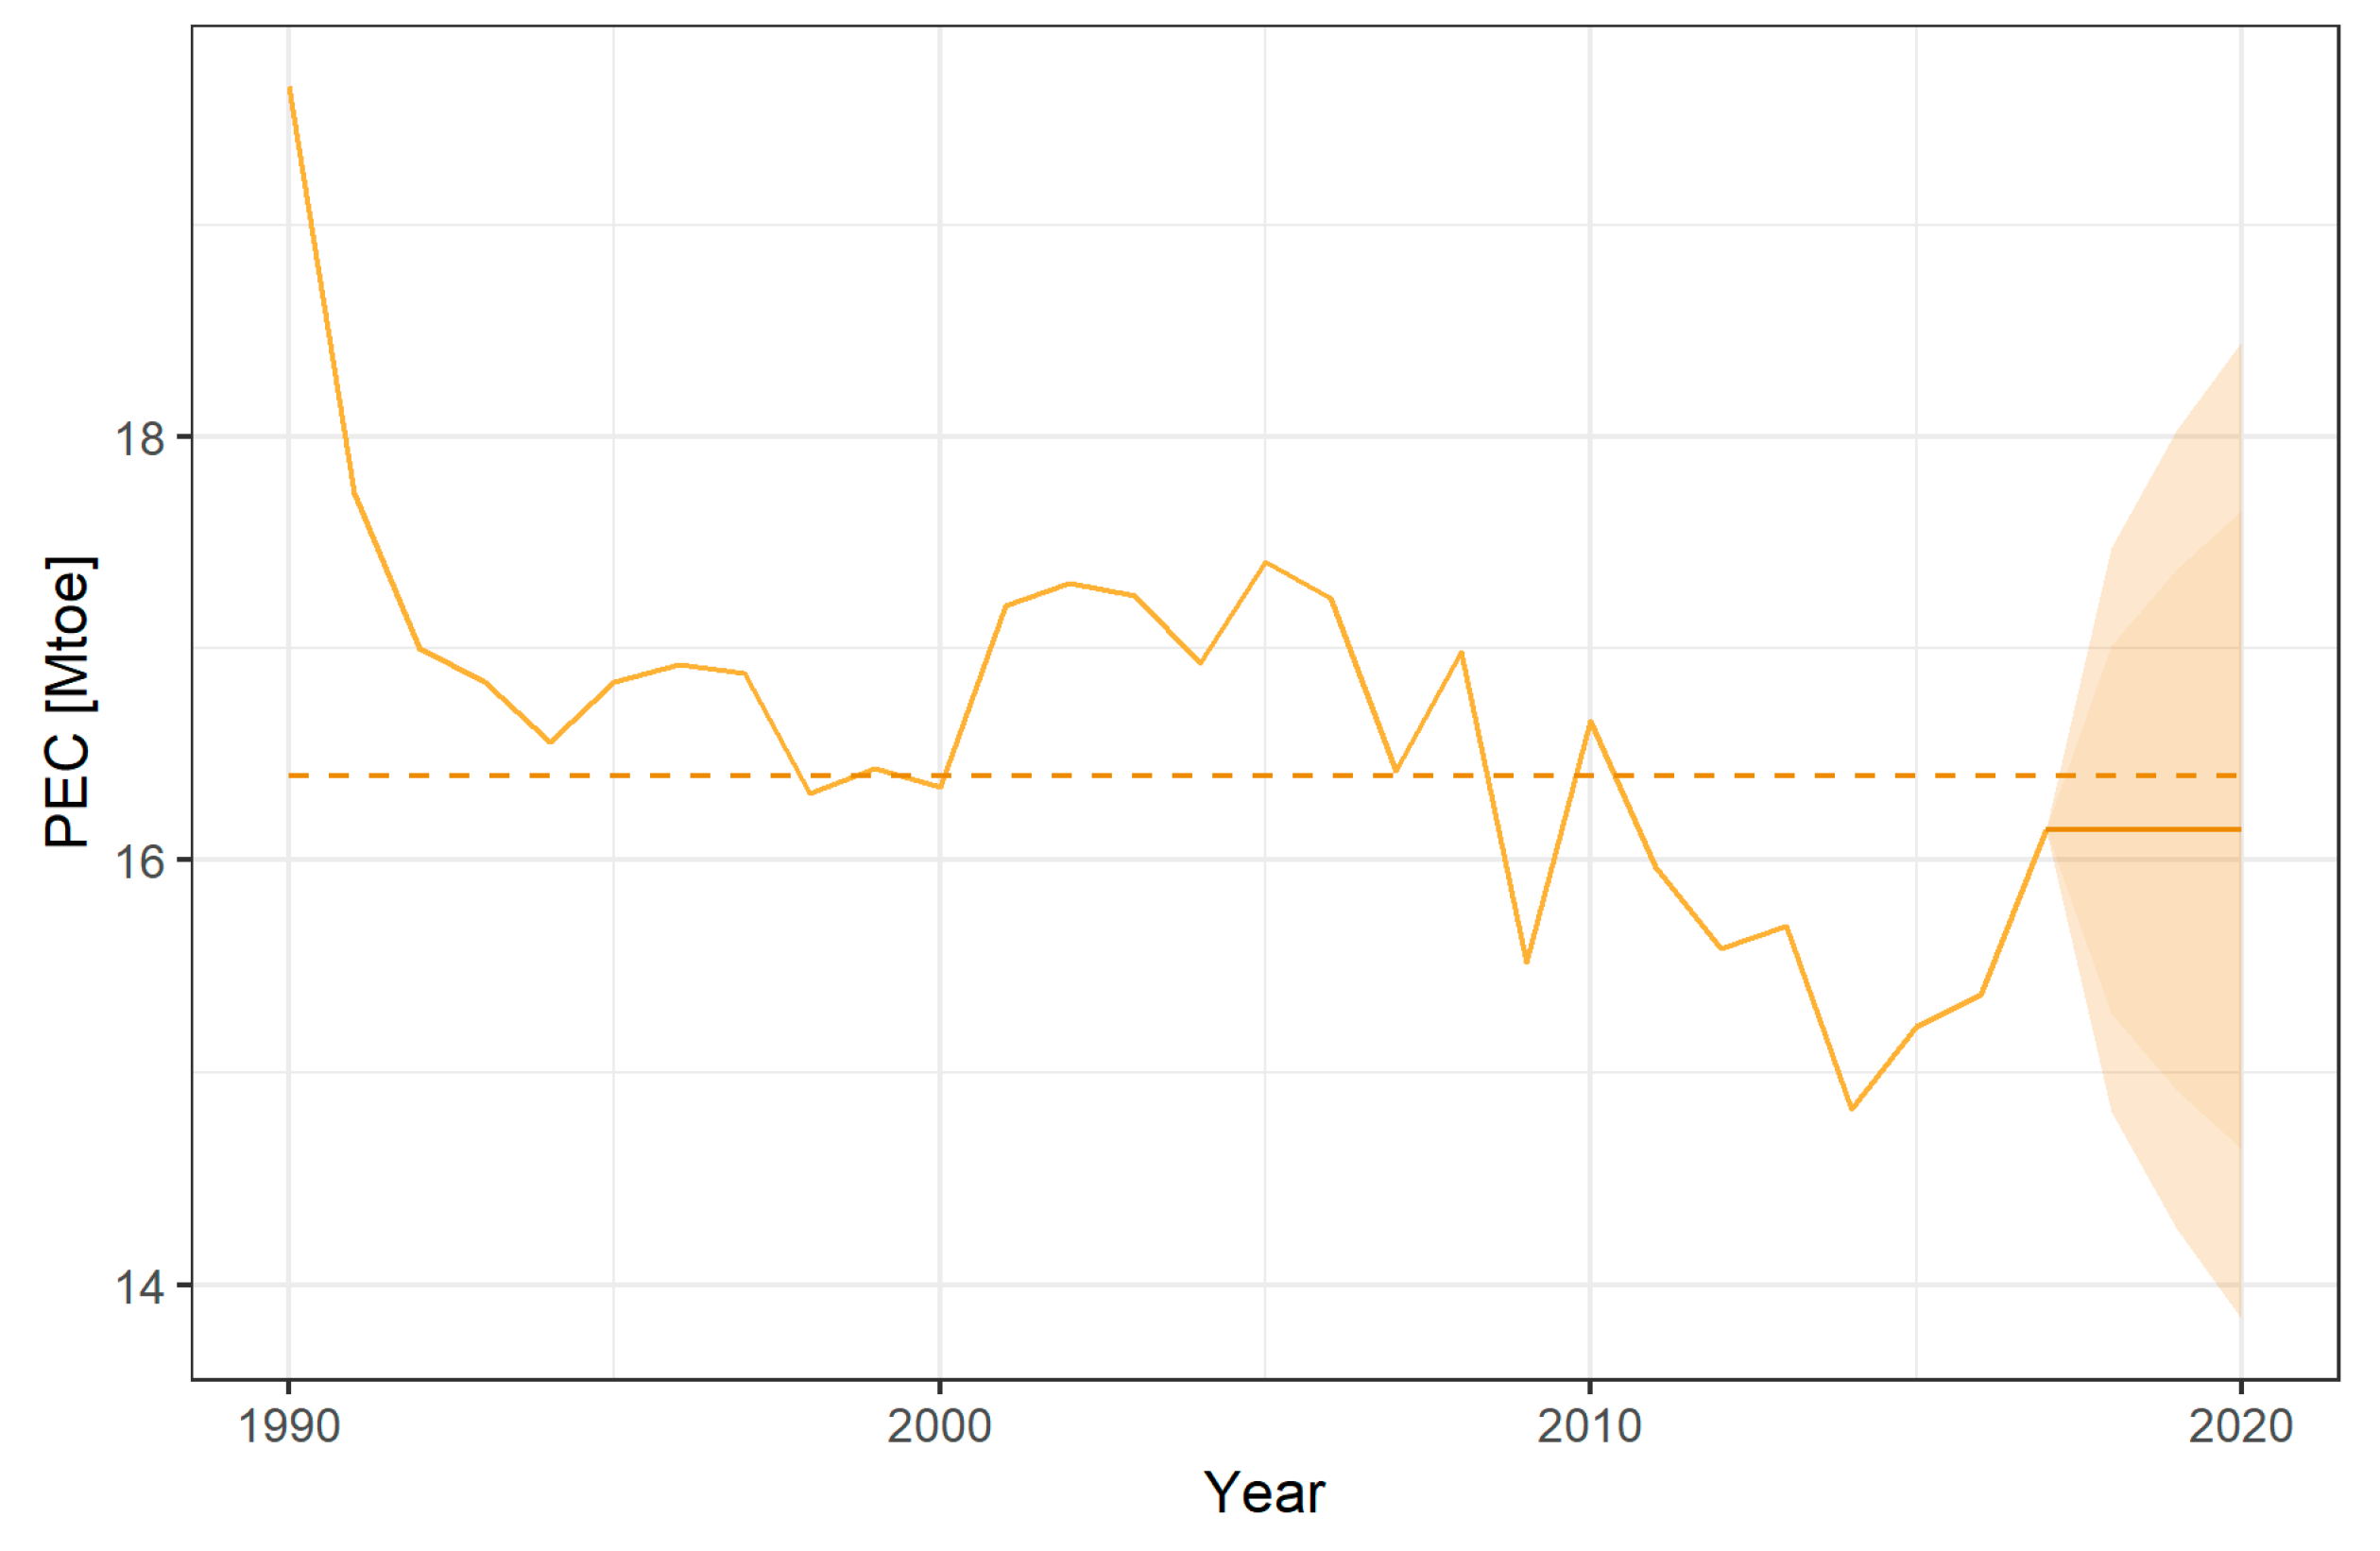
Overall, it seems that for the Czech Republic primary and final energy consumption have both been fluctuating around their Europe 2020 target (see
Figure 6 and
Table 7). Based on the forecast, we can assess that the target will be slightly exceeded, but the confidence interval of the forecast gives hope that it could be under the limit.
Figure 7 and
Table 8 shows the results from a similar simulation for the case of Slovakia.
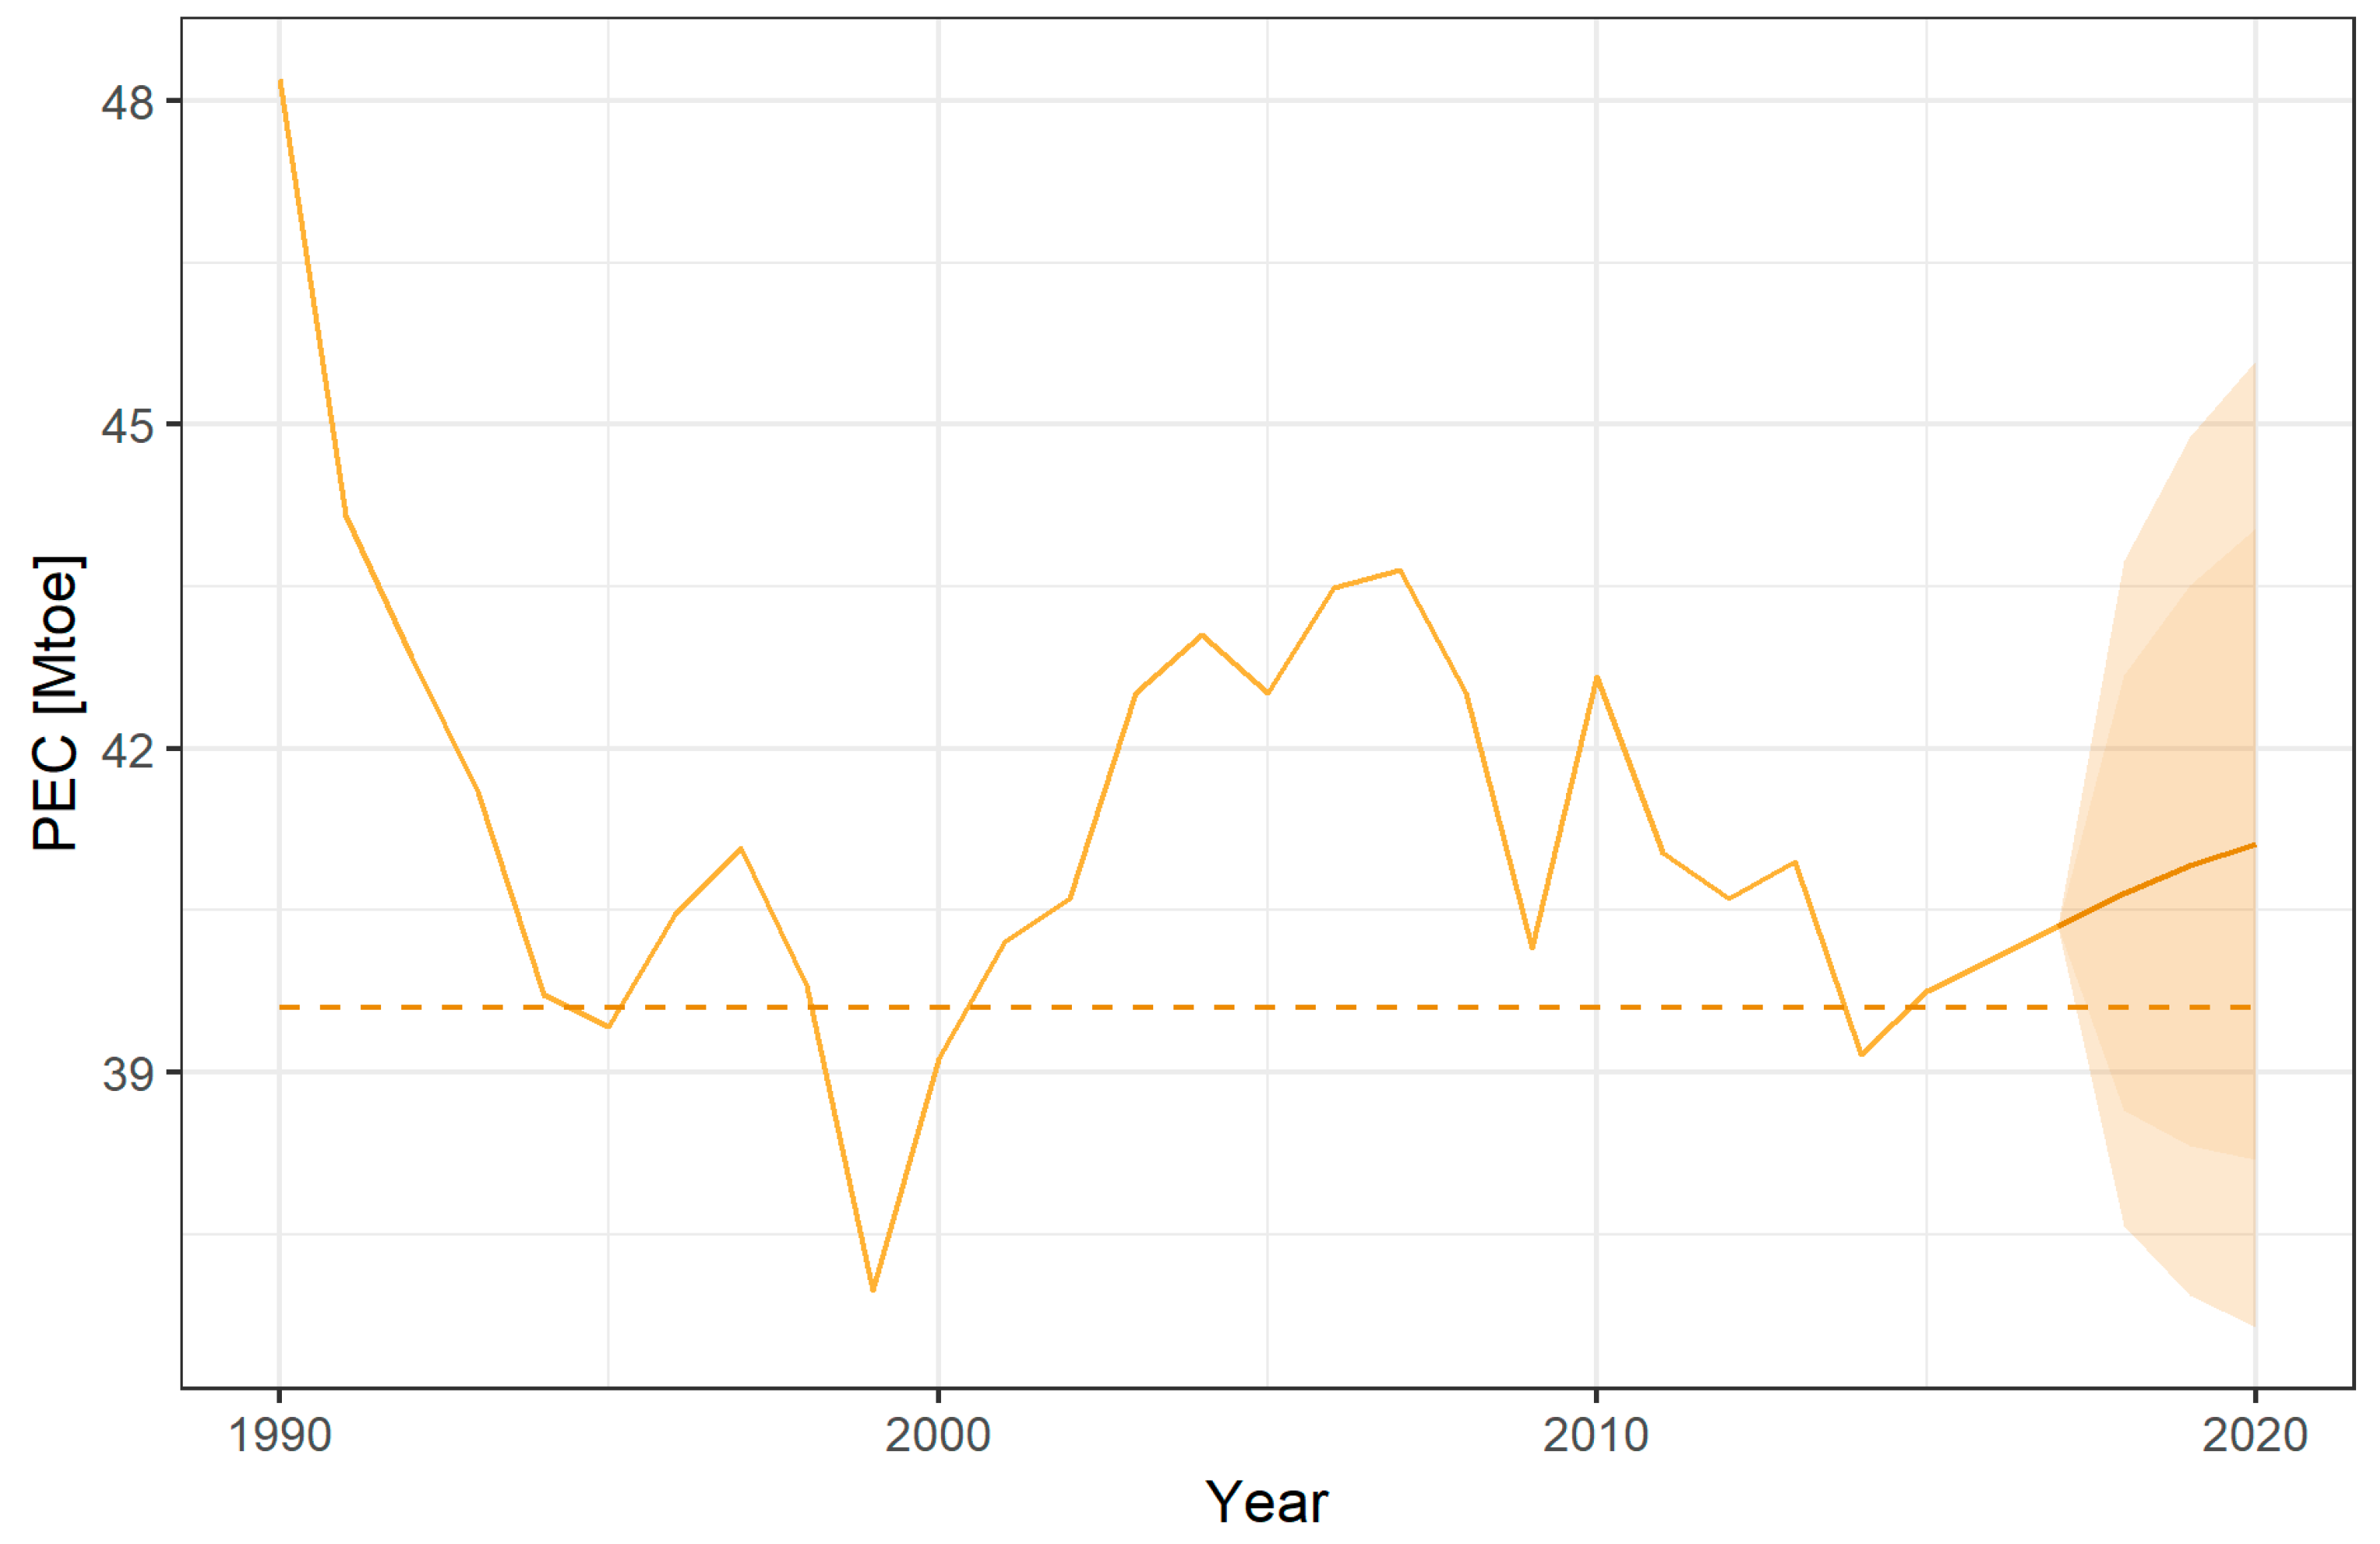
The main conclusions here is that the primary energy consumption in Slovakia has been under the Europe 2020 limit since 2011, but since 2014 we can observe change in the trend—PEC growth. It appears quite difficult to assess what the result in 2020 will be, but our simulations and forecast show it will be very close to the limit.
Final energy consumption for Slovakia was set on an unattainable level for this country. Slovakia has never been close to this level and seems improbable to achieve this level in 2020 (see
Figure 8 and
Table 9).
Figure 9 below shows the levels of the gross domestic product (GDP) in the Czech Republic.
In general, there is no forecast of GDP, because it does not constitute any importance for Europe’s 2020 strategy and its implications. Nevertheless, is seems important to describe how it looked like in the past, because GDP is used for energy intensity calculation and forecast (see the next figures that follow) and is also important for sustainable development.
Figure 10 below shows the gross domestic product in current prices in Slovakia.
The results for Slovakia seem to be very much the same as for Czech Republic. Furthermore, let us look at
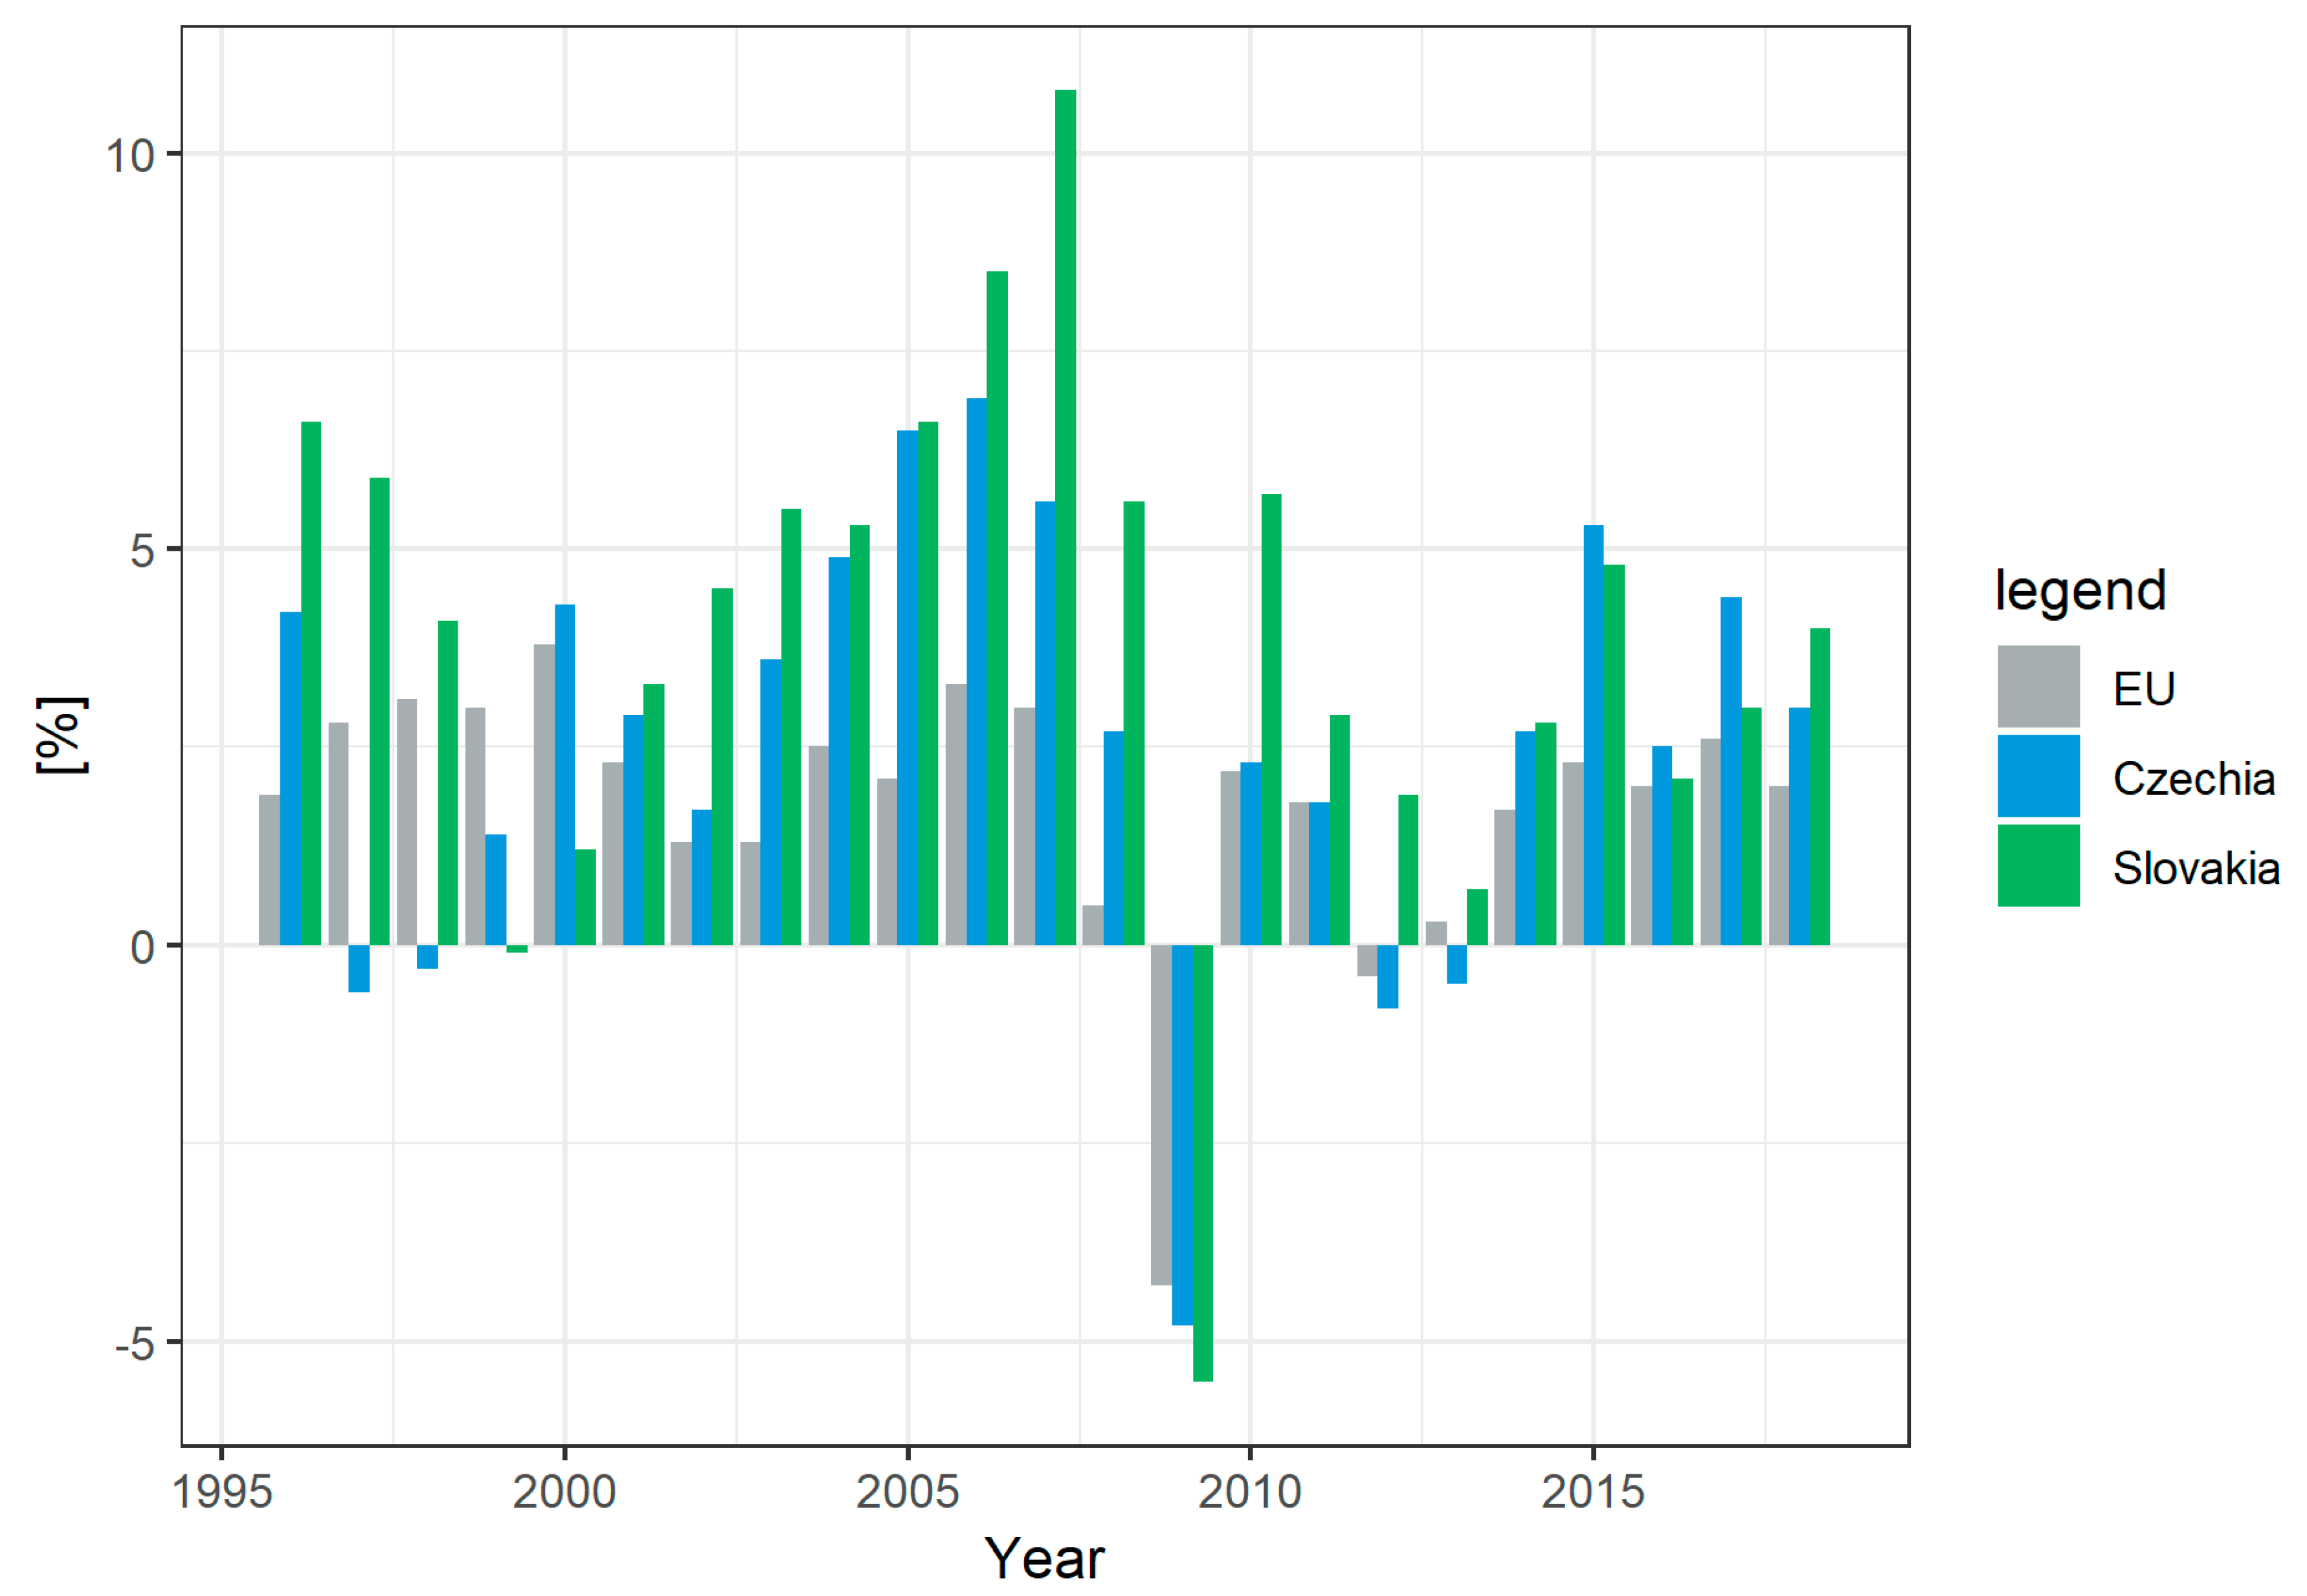
Figure 11 that shows real GDP growth rate in EU compared to the Czech Republic and Slovakia.
The differences between the Czech Republic and Slovakia are quite obvious. Slovakia is growing at a faster pace. This might be attributed to the better and more efficient economic reforms in Slovakia that accepted the Euro as its currency in 2009 while the Czech Republic still keeps its national currency, the Czech koruna.
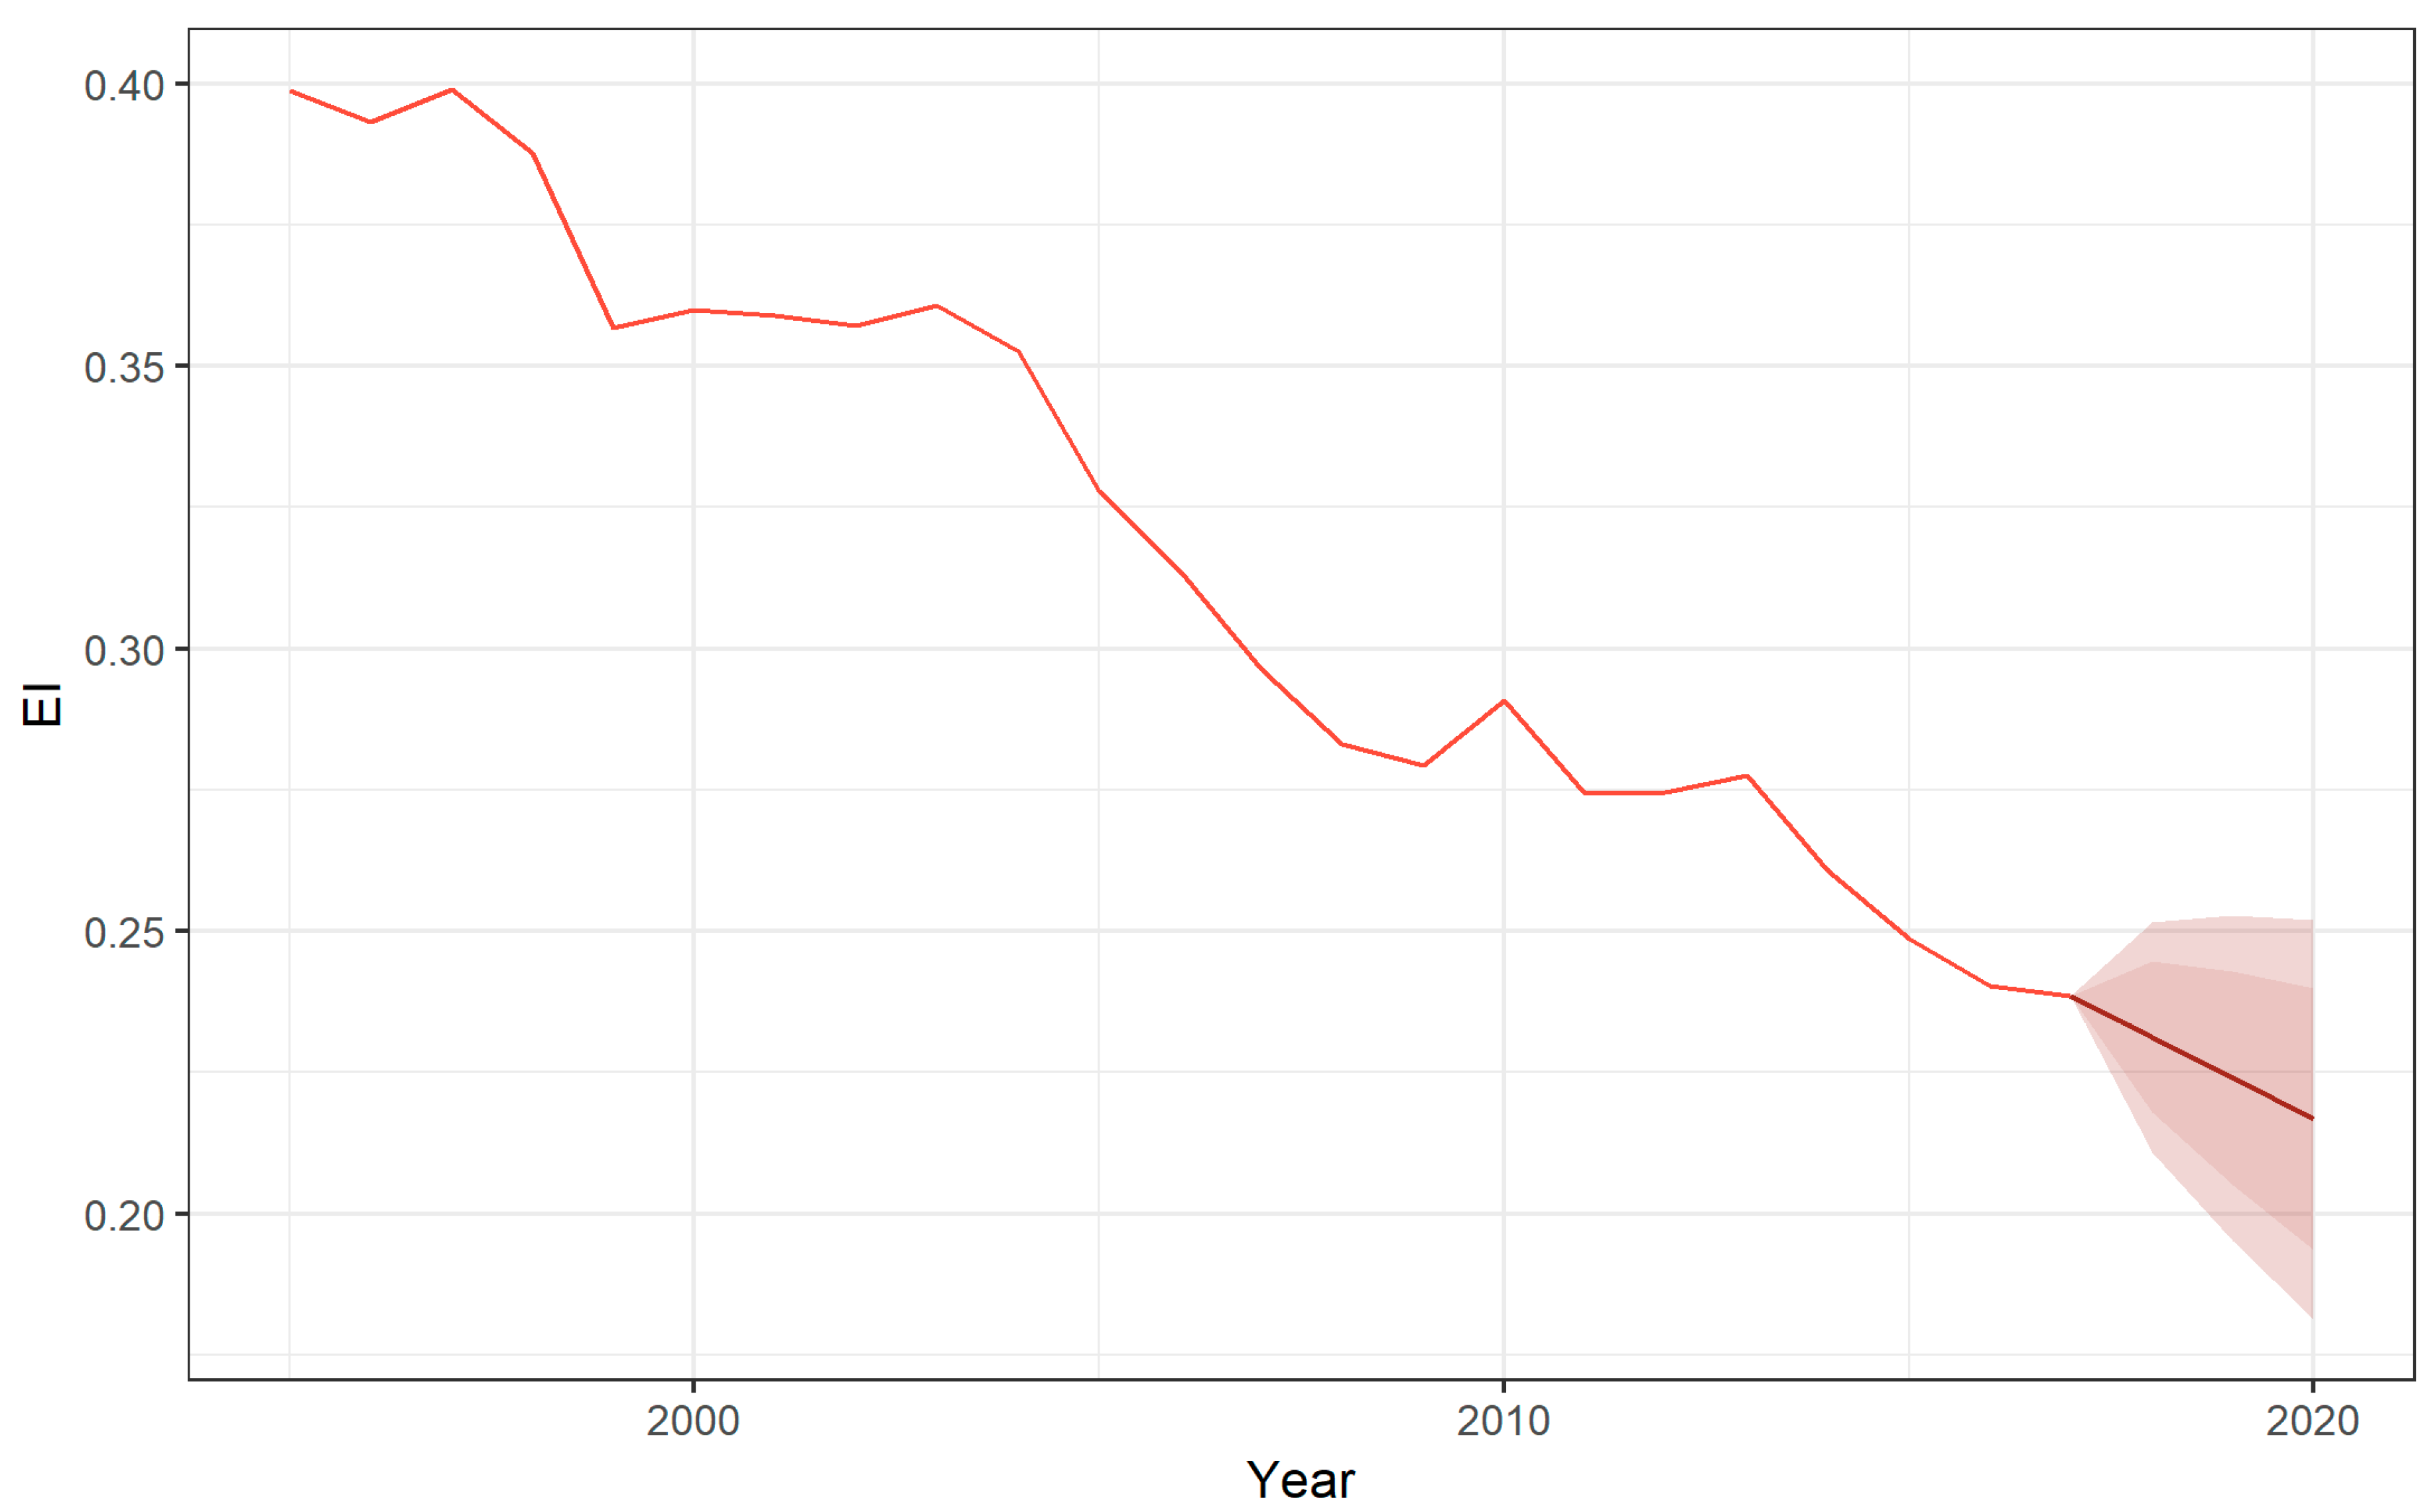
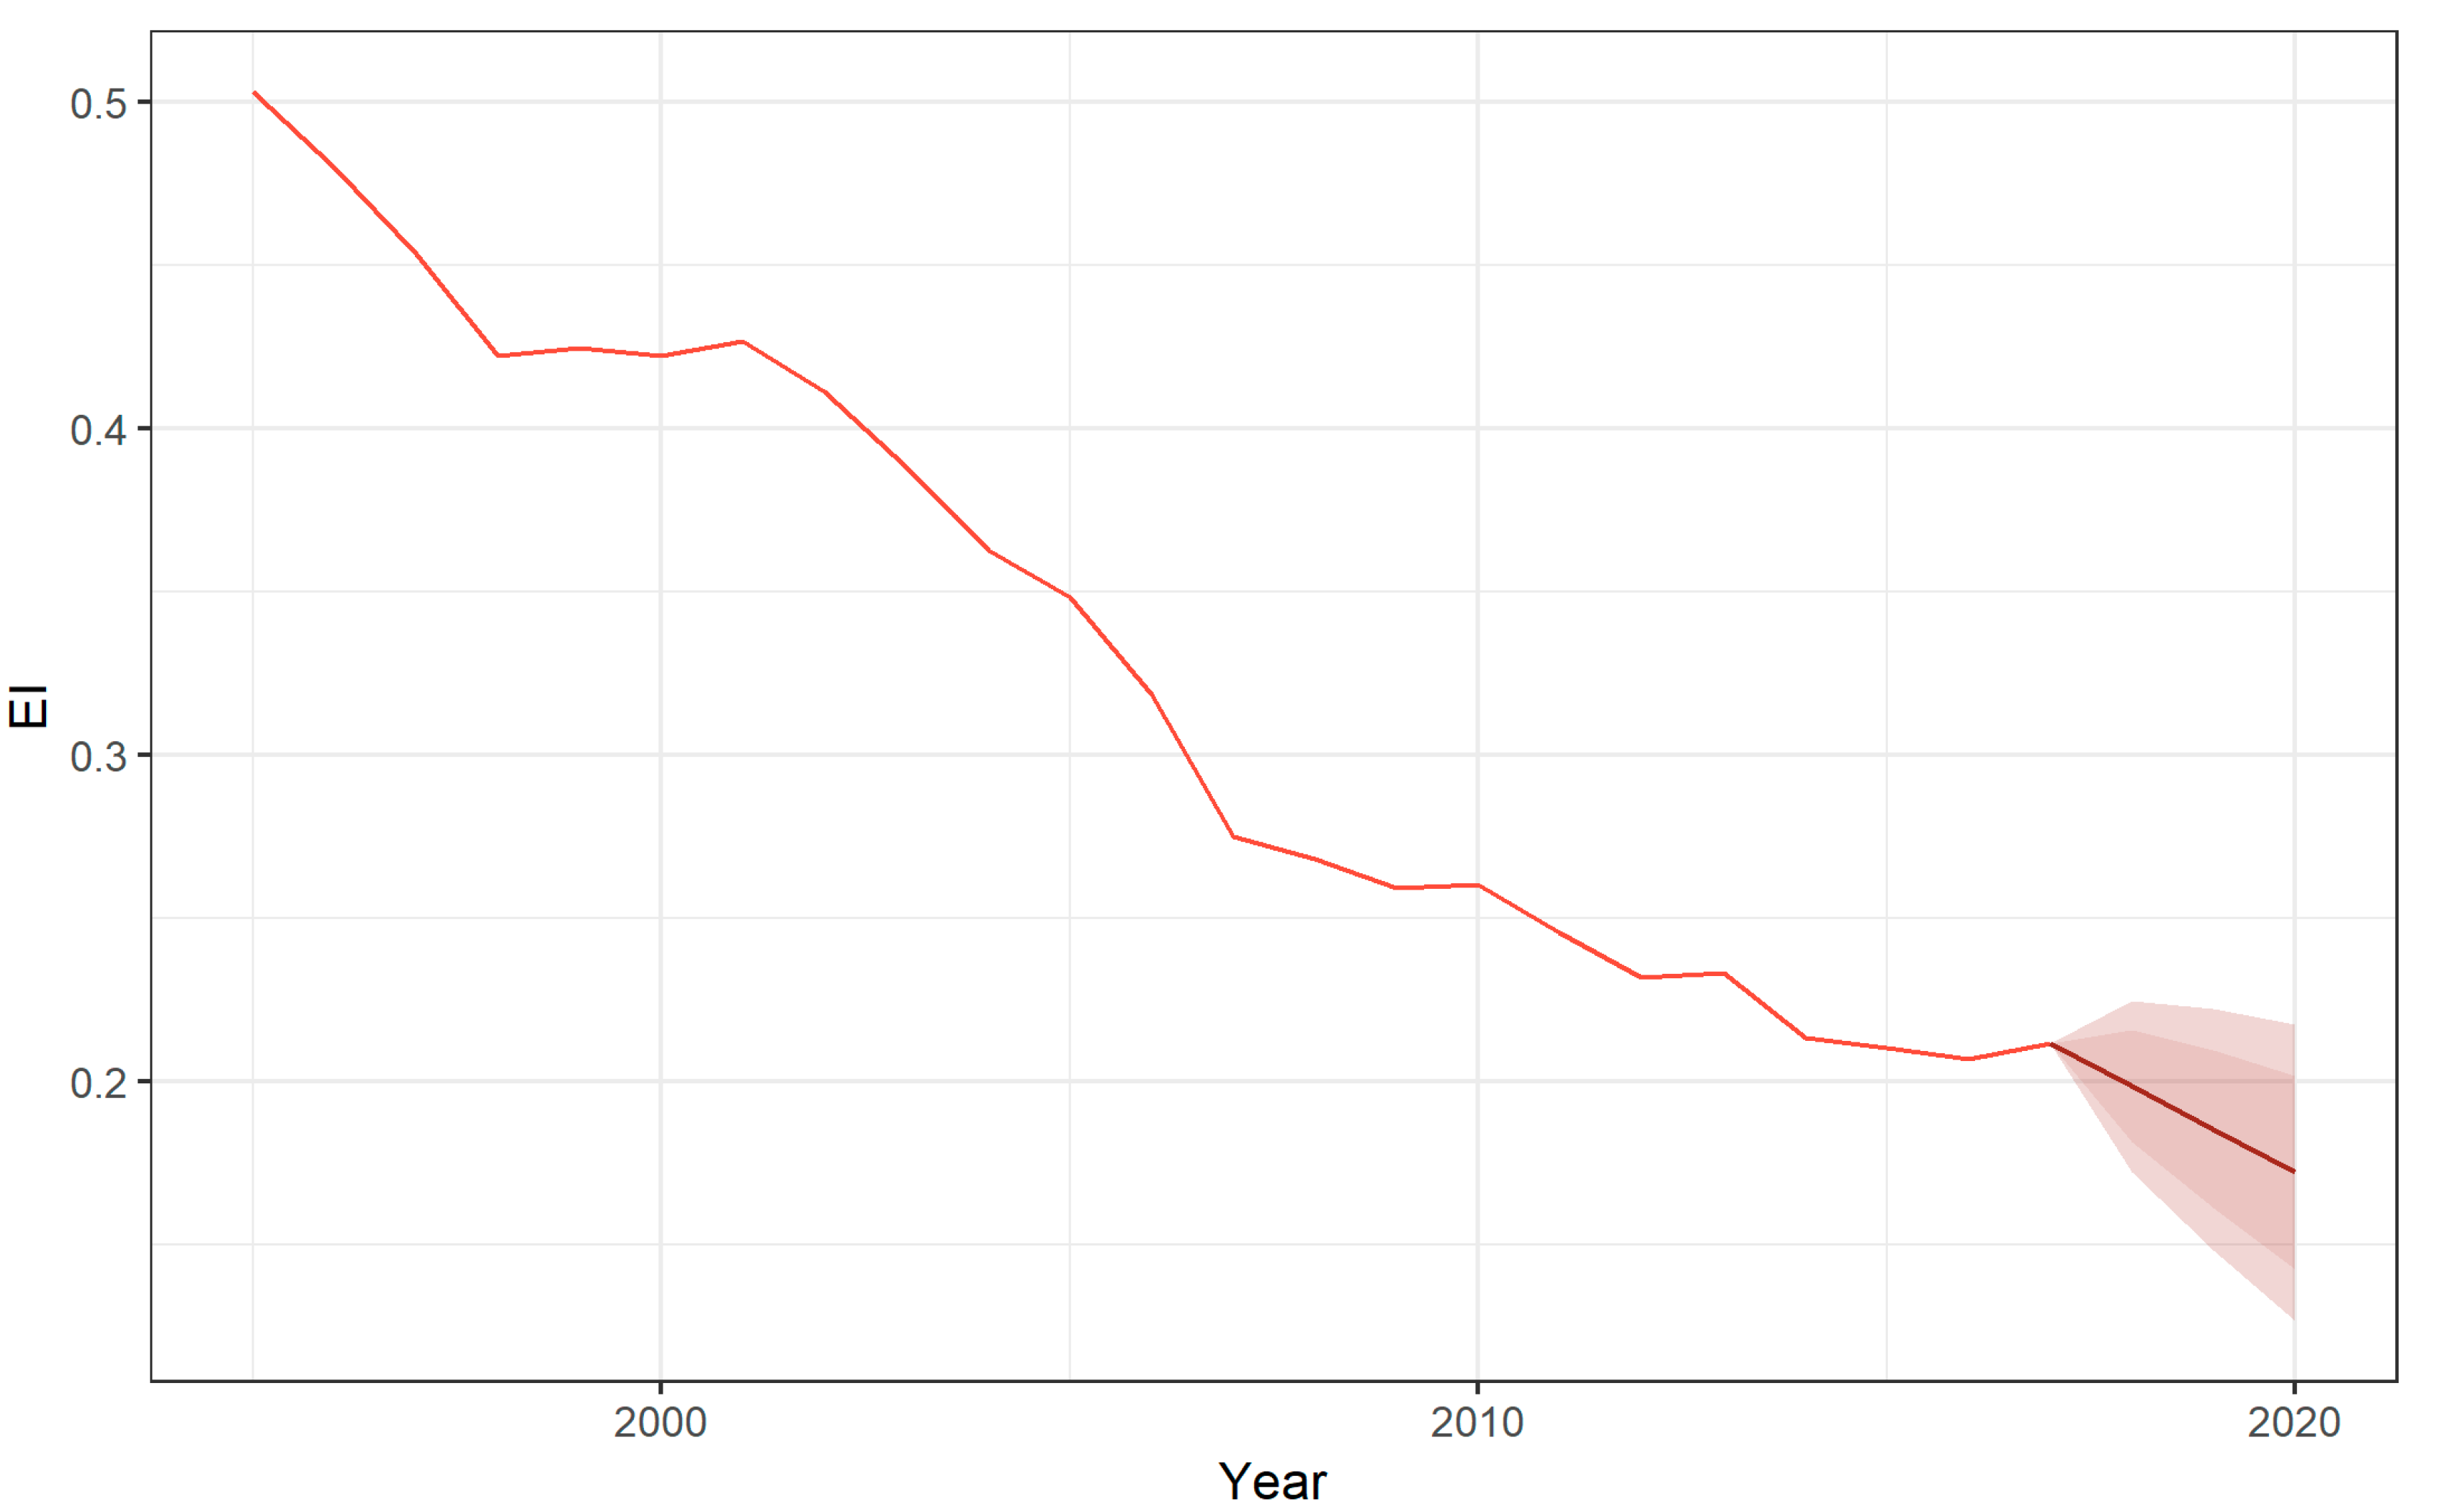
Figure 12 and
Figure 13 that follow shows the energy intensity in the Czech Republic and Slovakia that is calculated as the ratio of gross inland energy consumption (GIEC) to GDP. The two different shapes of energy intensity depict the (i) forecast, (ii) forecast Lo 80% and 95%, as well as (iii) forecast Hi 80% and 95% for each country, respectively (see
Table 10 and
Table 11 for more explanation showing the values for each forecast).
The low value of energy intensity speaks of the level of economic development. The average for the EU equals 0.1097. The energy intensity of Czech Republic is twice larger than the average for the EU but it has a decreasing trend.
Figure 13 below shows the same situation but using the case of Slovakia. It is apparent that the Slovak energy intensity also exceeds the EU average.
The main conclusions stemming from
Figure 12 and
Figure 13 and the accompanying tables are that the low value of energy intensity speaks of the modern economy. The EU average equals 0.1097. Energy intensity of Slovakia is twice larger than the average of the EU and decreased fast between 1995 and 2007, but in the last years the decrease is very slow and looks to be stabilizing.
Figure 14 depicts energy consumption and greenhouse gas emissions for the Czech Republic.
In the case of the Czech Republic, GIEC and GHG are correlated, but we can see that in the last years GHG emission is decreasing faster than the energy consumption. This is, of course, a positive trend that can be attributed to the improvement in energy policy and strategy.
All in all, also in the case of Slovakia, the GIEC and GHG appear to be correlated. It is apparent from
Figure 15 that in the last years, GHG emission is decreasing a little faster than energy consumption, but not as fast as in the case of the Czech Republic that was analyzed above. This was shown on the previous figures describing the renewable energy sharing system.
6. Conclusions
Recent commitments to sustainable development and mitigating climate changes made by most of the world’s governments also found their way into the energy policy of the European Union, becoming the basis of its national energy efficiency targets for 2020 embedded in the Europe 2020 strategy. The Europe 2020 strategy and the 3 × 20 climate and energy package envisage the reduction of greenhouse gas emissions in EU Member States as well as increasing the share of renewable energy for enhancing energy efficiency. Due to the varying level of economic development, different objectives were set for different EU Member States, with the Czech Republic and Slovakia, which constitute the case studies employed in this paper, facing targets that were lower than that in the case of the more economically developed EU countries.
With regard to the above, one has to understand that climate targets were set in order to slow down or even reverse (albeit in the long run) the depletion of natural resources and preventing environmental degradation. In no way were these targets set with a purpose of halting the economic growth (especially when it comes to the economies in transition) but rather to help the countries in question to develop in accordance with the principles of energy efficiency and sustainable economic growth.
Both countries selected for our case study, the Czech Republic and Slovakia, experienced deep system transformation after the fall of Communism in 1989 that are apparent in the GDP, gross inland energy consumption and GHG emissions that constitute the measures of sustainable development used in our research. Our results indicate that it is quite unlikely that the planned increase in renewable energy is going to reach its targets for the Czech Republic and Slovakia (which is similar to the case of other EU Member States that joined after 2004) but it will be possible to reduce energy consumption and greenhouse gas emissions. This is, among other things, due to the fact that gross inland energy consumption and greenhouse gas emissions in the Czech Republic and Slovakia appear to be correlated. Greenhouse gas emissions are going down in both countries in question a little faster than energy consumption, but this pace is more rapid in the Czech Republic than in Slovakia.
In addition, it becomes apparent that implementation of GHG emissions in the Czech Republic and Slovakia may be at risk in case the proper energy policy is not maintained by the stakeholders and governments of the respective countries. Moreover, our findings show that regardless of the mix of fossil and renewable energy, the state of economic development and the geographical location of any EU Member States, a proper energy policy is required for effectively reducing energy consumption and greenhouse gas emissions. The energy intensity of Czech and Slovak economies increased in the early 2000s and then stabilized at a level about twice of the EU average. Our analysis of the energy intensity for the both countries in question shows that in the forthcoming years its value is likely to remain the same.
Overall, our results also demonstrate that maintaining a proper balance between economic development and environmental protection should be kept at all cost regardless of the position of the country. The cases of the Czech Republic and Slovakia scrutinized in this paper confirms that. Both countries have (common) Communist pasts but both underwent a spectacular economic transition and became Member States of the European Union. However, their story might be used by other EU Member States, both constituting the “core” EU and those that joined in 2004 or after. It might be also interesting to study the implications of Brexit and the shift of energy policies during and after the transition period for the United Kingdom. Further progress in maintaining a proper balance between economic development and environmental protection might be ensured by the decisive steps of the Czech and Slovak (as well as other EU) stakeholders and policymakers in terms of investments into renewable energy sources, modernizing the old energy sector and seeking for new solutions for sustainability and energy efficiency.
