Article

Do Real Output and Renewable Energy Consumption Affect CO2 Emissions? Evidence for Selected BRICS Countries

1
Business School, Hunan University, Changsha 410082, China
2
Research Institute of Digital Society and Blockchain, Hunan University, Changsha 410082, China
3
The Energy Centre, University of Auckland, 12 Grafton Rd., Auckland 1010, New Zealand
4
School of Public Administration, Hunan University, Changsha 410082, China
5
Business School, Jiangsu University of Technology, Changzhou 213001, China
*
Author to whom correspondence should be addressed.
Energies 2020, 13(4), 960; https://doi.org/10.3390/en13040960
Submission received: 22 January 2020 / Revised: 11 February 2020 / Accepted: 14 February 2020 / Published: 20 February 2020
(This article belongs to the Special Issue Energy Markets and Economics Ⅱ)

Abstract

:
Climate change is one of the most important global problems faced by the international community. It is generally believed that increasing the consumption of renewable energy is an effective measure to promote CO2 emissions reduction. Therefore, renewable energy consumption has become one of the best alternative strategies for sustainable development. Based on this, this paper employs the 3SLS model to conduct an empirical study on the relations among real output, renewable energy consumption, and CO2 emissions of BRICS countries (except Russia) in 1999–2014. The empirical results support, for BRICS group, the complete tri-variate relationships (energy-output-emission nexus), and renewable energy had a significant positive impact on the real output, and vice versa. Besides, compared with other countries, Brazil also has the same tri-variate relationships as BRICS group. However, China has no relationship from real output to renewable energy consumption and from real output to CO2 emissions; India does not have the relationship from real output to renewable energy consumption and the bilateral relationship between real output and CO2 emissions; the relationship between variables in South Africa only occurs in the energy output chain. Finally, according to the estimation results of the simultaneous equation, the BRICs governments should consider the importance of human capital level and financial development when controlling the real output level and pollution. In addition, it should be noted that effective energy policies help to reduce carbon dioxide emissions without compromising real output.

1. Introduction

As we all know, global climate change caused by carbon dioxide emissions is endangering the sustainable development of the world, and has become a hot topic in international political, economic, and diplomatic discourse debate [1]. The rising total CO2 emissions are not only a threat to the health of the biophysical ecosystem but also has a profound impact on human society. CO2 emissions, which are closely related to climate change, have always been described as a “super wicked problem” [2] that has an impact on human welfare. Therefore, how to formulate a policy of economic, energy, social inclusion, and environmental sustainability is a serious challenge for all countries in the world.
With economic globalization, developing countries are staying in the key economic development period. Especially, developing countries must show a rapid pace of economy growth in order to fight against poverty and improve industrial structure and infrastructure. In recent years, the concept of BRICS is becoming more and more popular in public media and academia. As a typical kind of the developing countries, BRICS countries have significant common characteristics, such as large population, underdeveloped economy but rapid growth, and the willingness to embrace the global market [3]. In the past 60 years, the BRICS economy has become increasingly prosperous [4]. The research of Goldman Sachs [5] found that in less than 40 years, the BRICS may play a more and more important role in the world economy than G6 (United States, Japan, Germany, France, Italy, and United Kingdom), and the size of BRICS economies may account for more than half of G6 by 2025. Especially according to the latest research of Pao and Tsai [6], the gross domestic product (GDP) of BRICS countries is expected to exceed than that of the group of seven (seven developed economies, namely United States, Canada, the United Kingdom, Germany, France, Italy, and Japan) by 2050. More concretely, in 2018, the nominal GDP of BRICS countries was the US $18.6 trillion, accounting for more than 23% of global output [
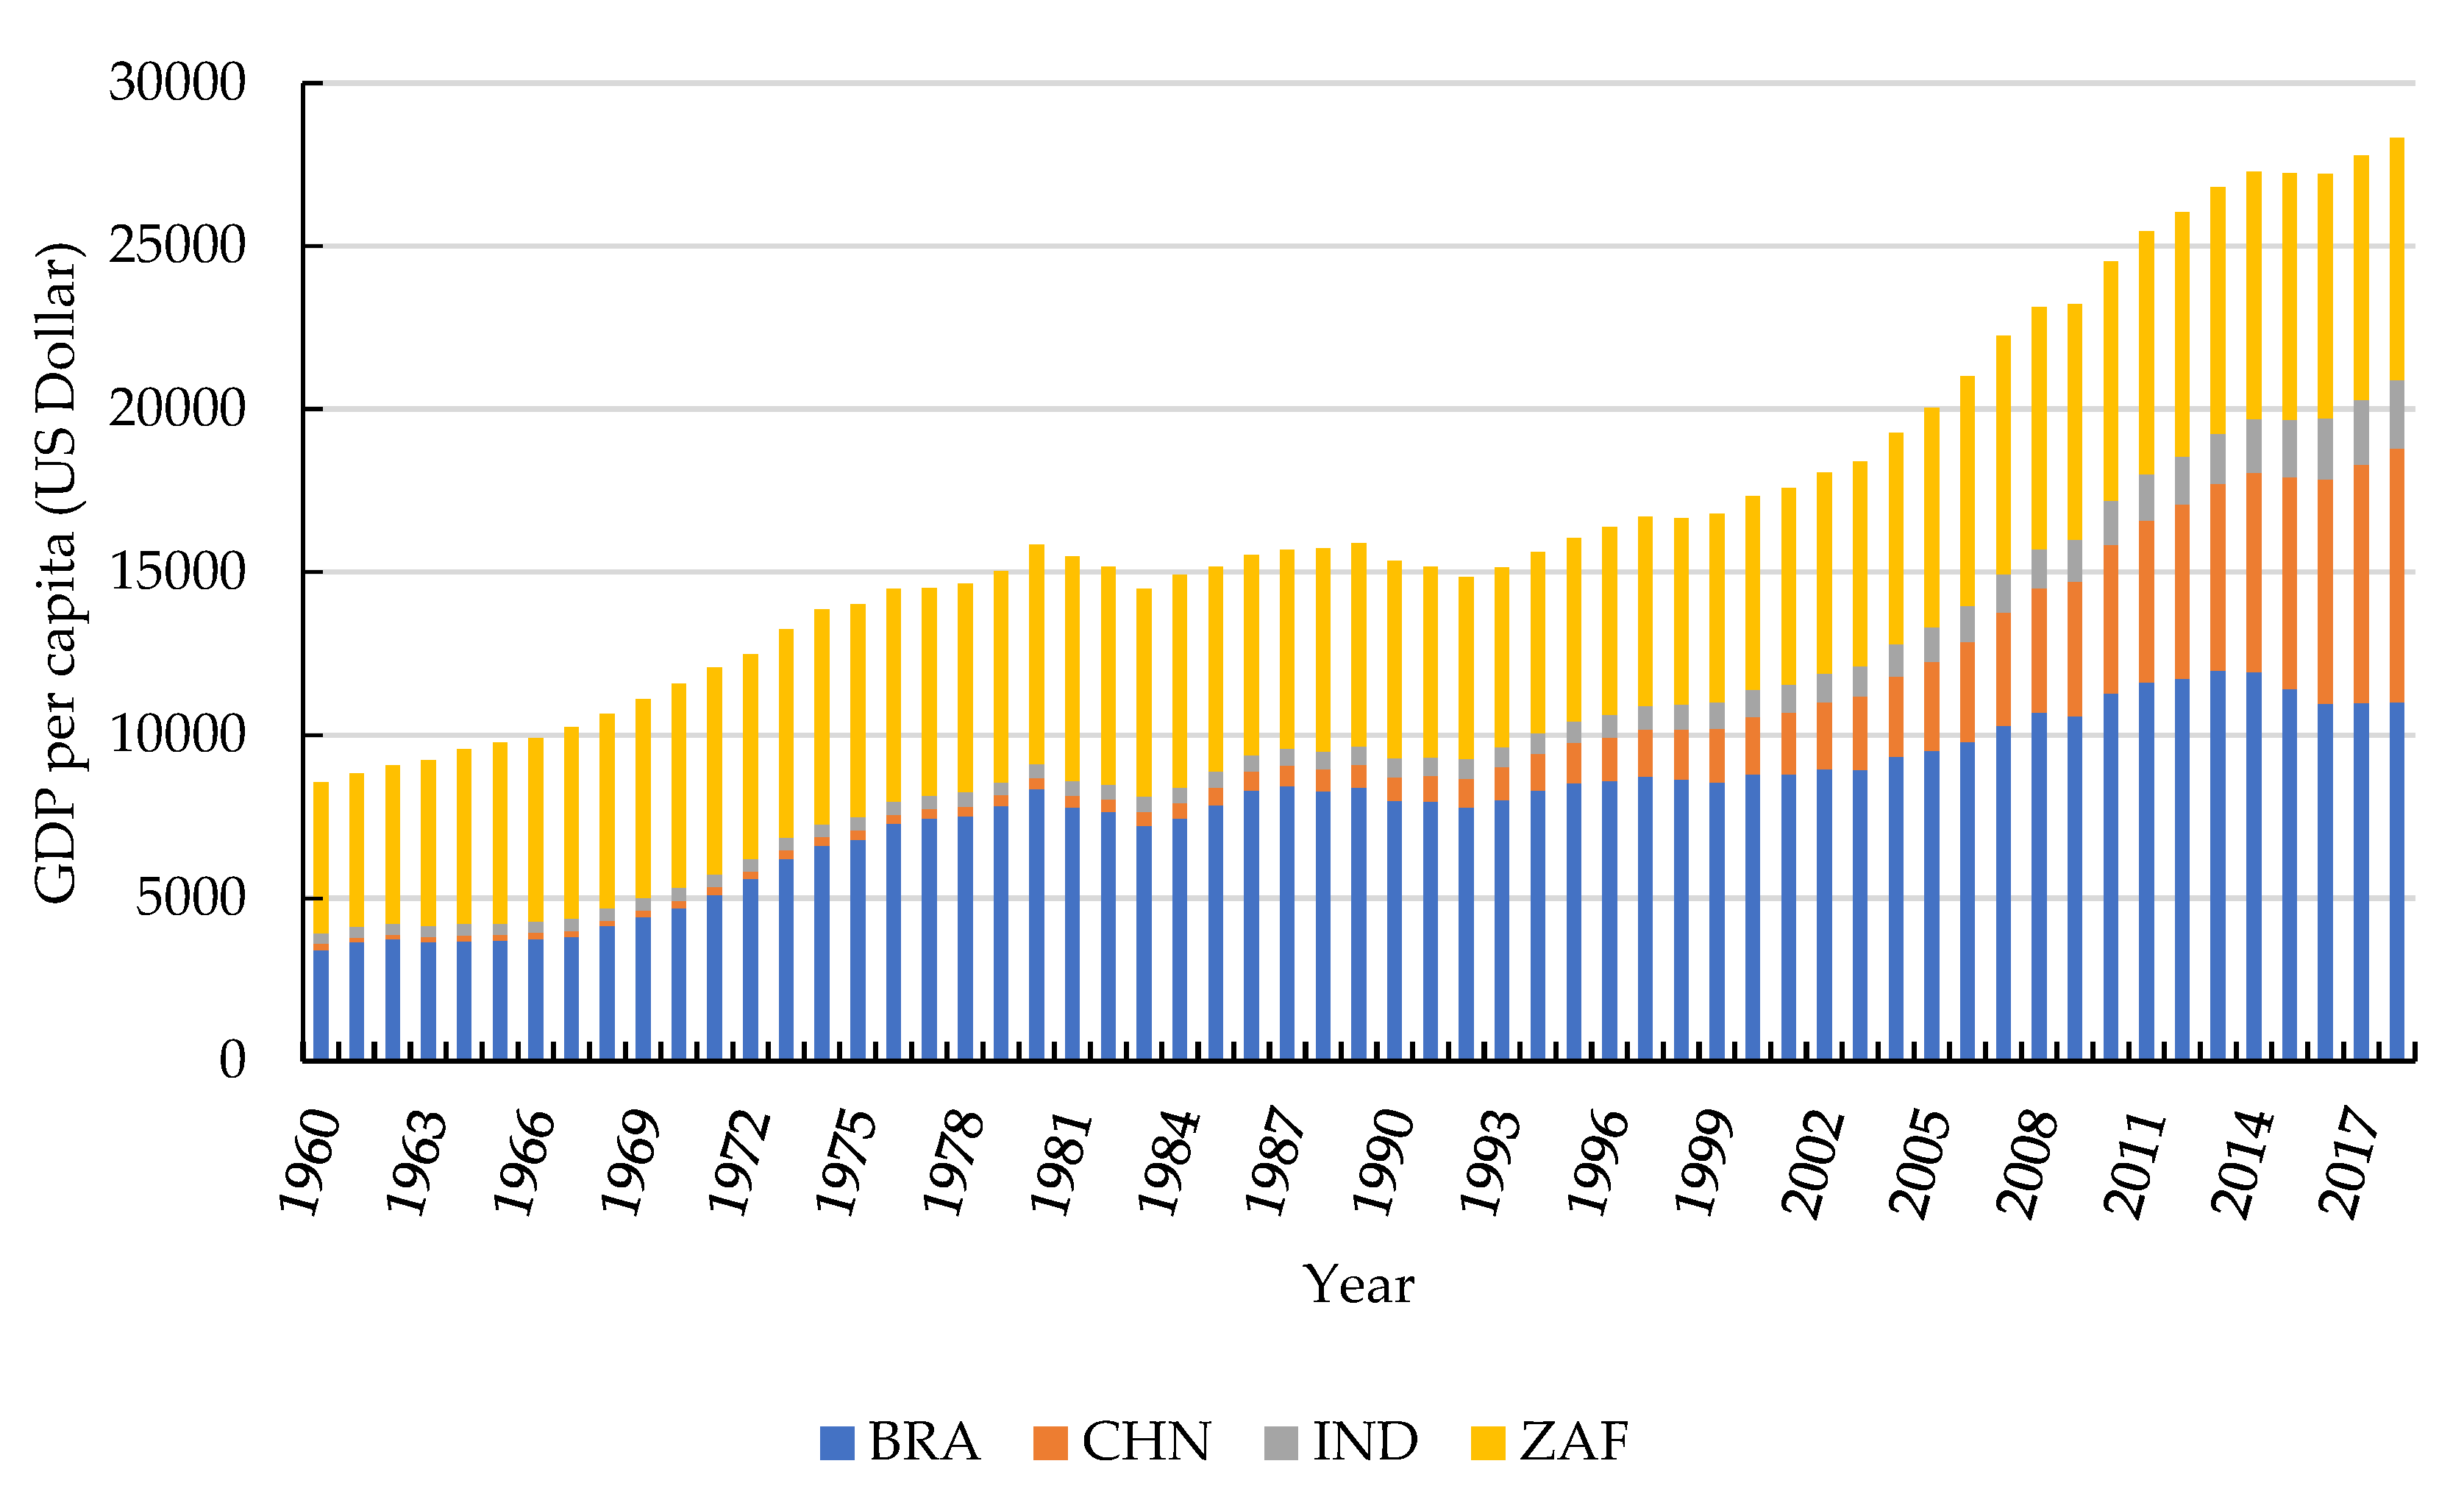
7]. As shown in Figure 1, the GDP per capita of BRICS countries increased from $2140.98 in 1960 (unchanged in 2010) to $7081.32 in 2018, with an average annual growth rate of 2.11%. Its contribution to world economic growth should not be underestimated. With the rapid economic growth, the relationship between economic growth and air pollution in BRICS countries is a widely debated issue. Especially BRICS countries’ economic growth and industrialization level rely heavily on high energy-consuming industries such as construction, mining, and manufacturing [8], which also lead to a sharp rise in CO2 emissions in BRICS countries. As shown in Table 1, BRICS countries occupy an important seat in the list of major carbon emitters in the world. In 2014, the CO
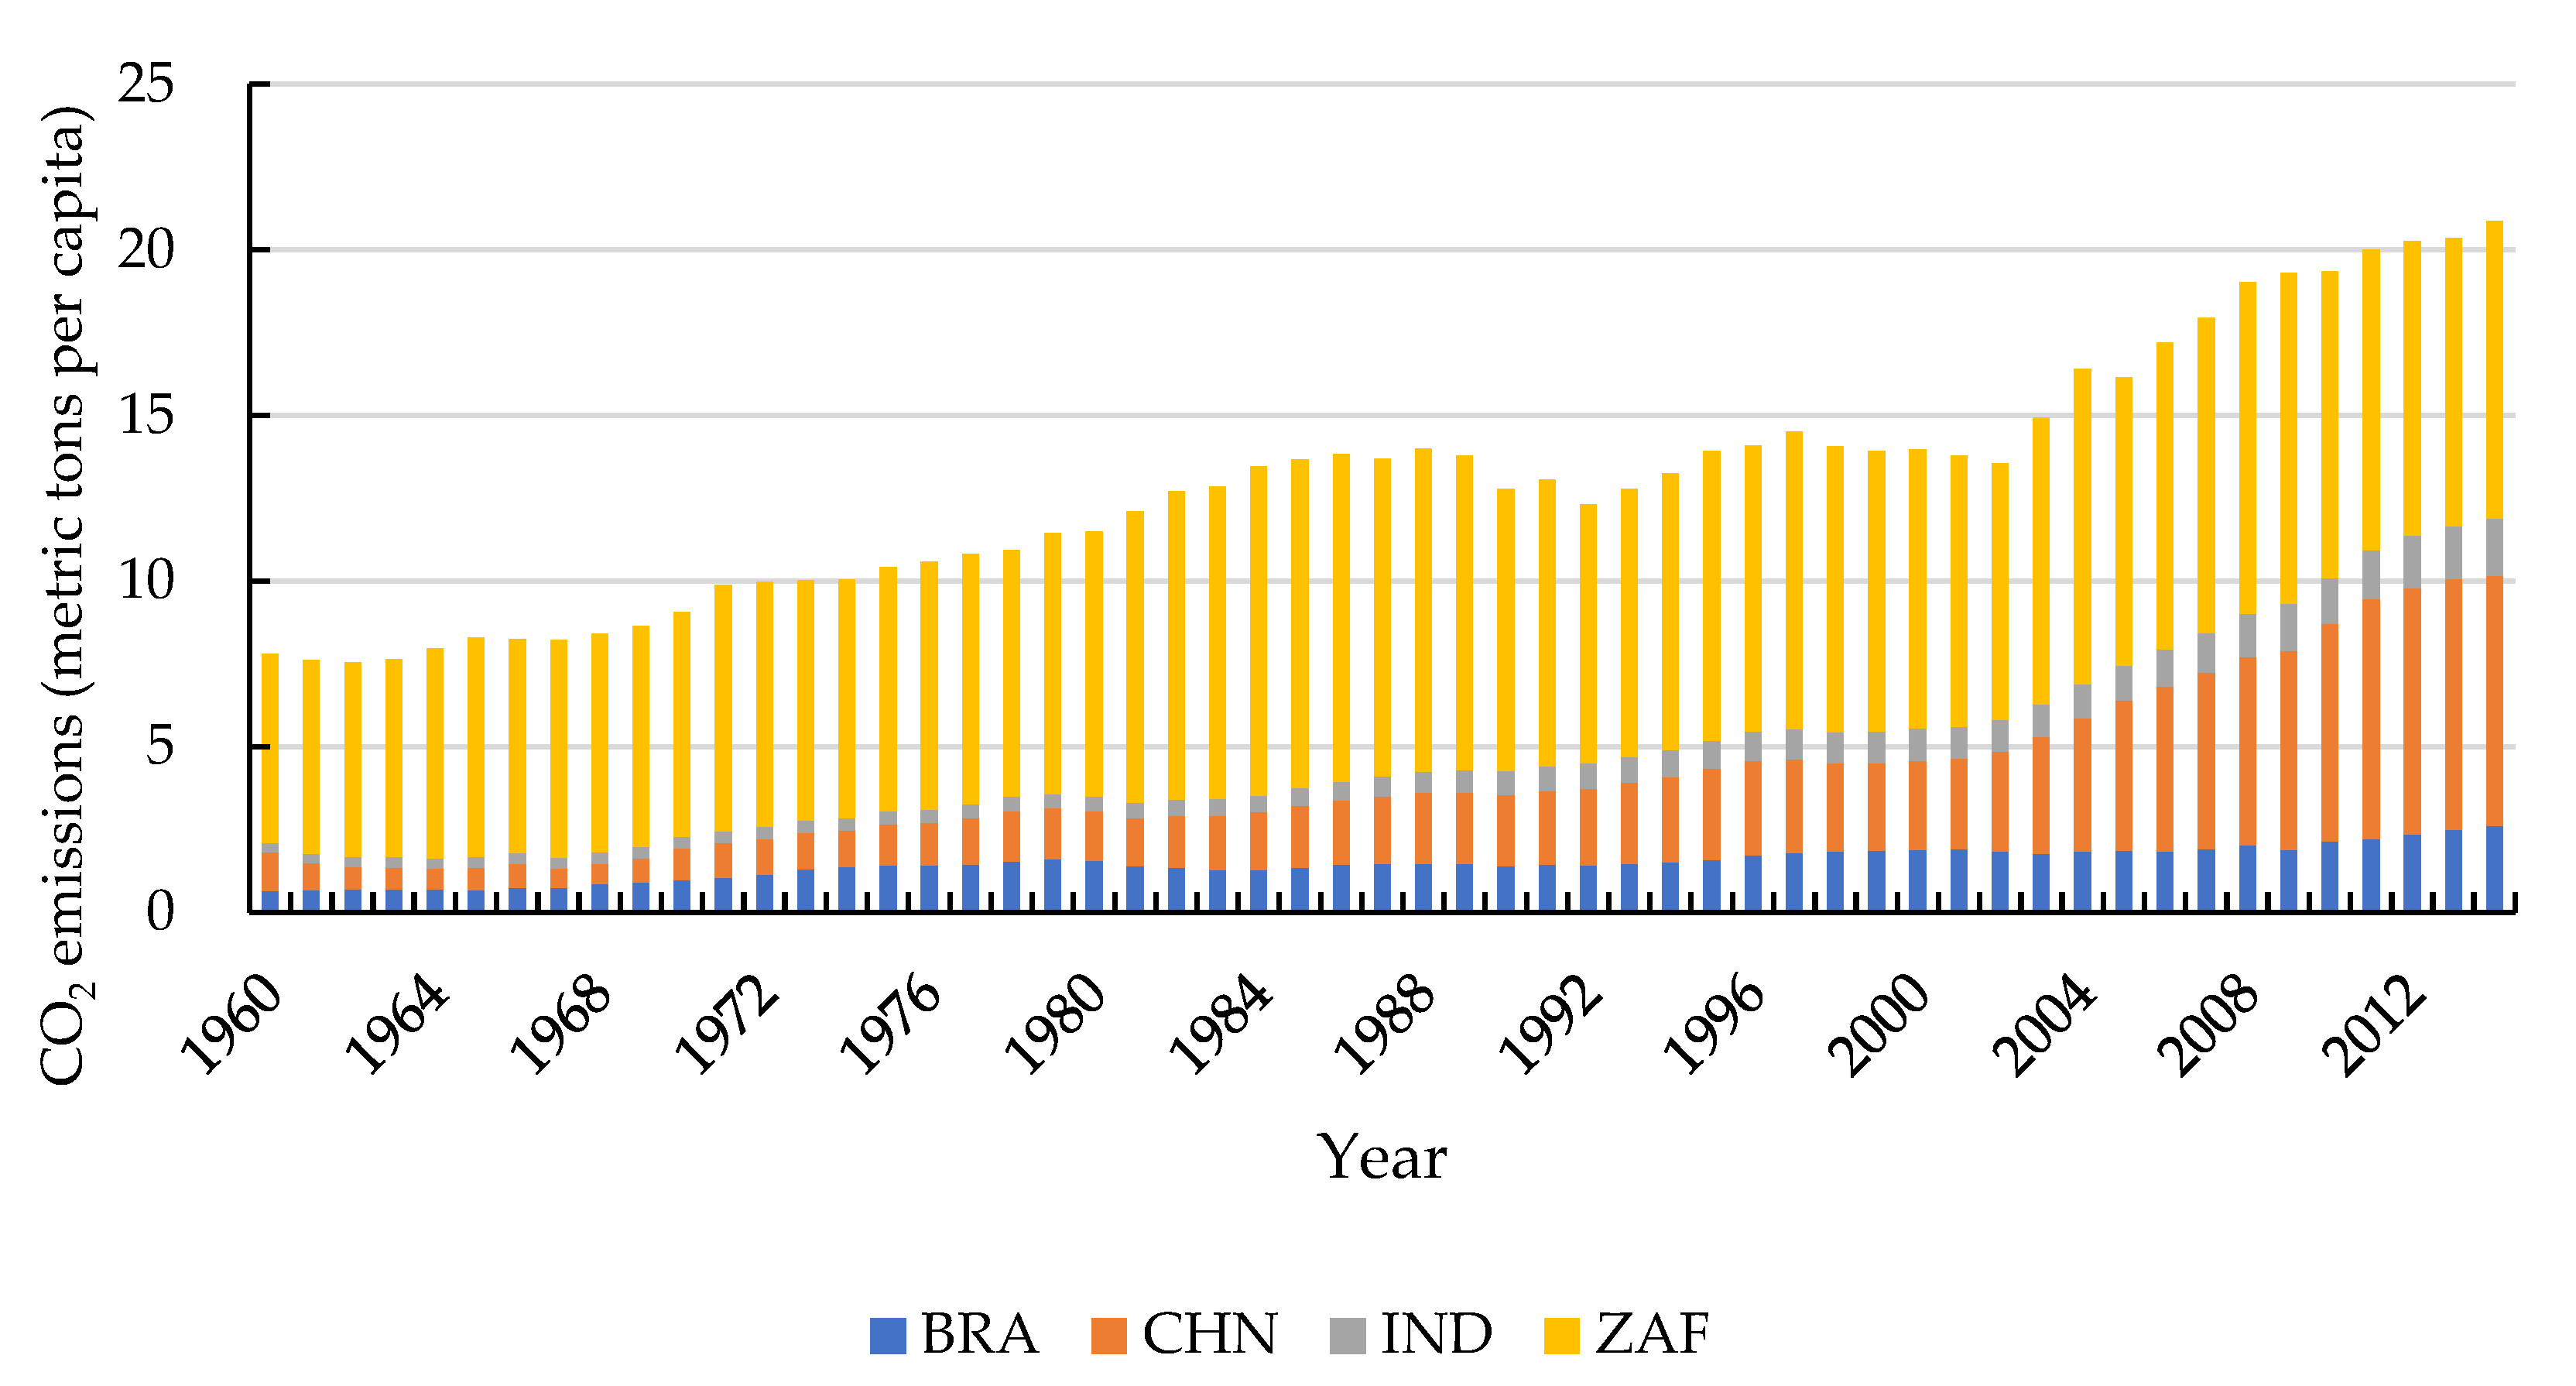
2 emissions of the whole BRICS countries accounted for three-eighths of the world’s total, and of the first three seats, BRICs hold two. It can also be seen from Figure 2 that the per capita CO2 emissions are also rising rapidly with economic development. The deteriorating environment also makes us aware of the consequent excessive CO2 emissions, which play a major role in the global greenhouse effect and the world economic development [9]. During the fifth BRICS summit in 2013, BRICS countries sealed a “multilateral agreement on climate cooperation and the green economy” to ensure the financial support and the technical exchange to cope with the negative effect of climate change on developing countries [8]. BRICS economies are currently located downstream of the global value chain, which means that their environmental costs are high [7], and it is unsustainable to sacrifice environmental quality to maintain economic growth [10].
Under the double challenges of the global climate crisis and economic growth pressure, the concept of low-carbon development and green energy transformation is now essential for the international community [11]. The main energy used by BRICS countries is fossil energy [12], and their dependence on fossil energy has provoked alarm about fossil energy limited supply, energy security, and environmental degradation [13]. The use of fossil energy is identified as a main factor in increasing greenhouse gas emissions, which are the culprit of climate change and global warming [14]. Renewable energy is considered to be the most effective way to reduce carbon dioxide emissions [15]. In order to achieve the goal of sustainable development and protect the environment, renewable energy is promoted to replace the fossil energy. Meanwhile, the use of renewable energy will not only increase environmental benefits, but also help economies increase employment and reduce their dependence on foreign resources [
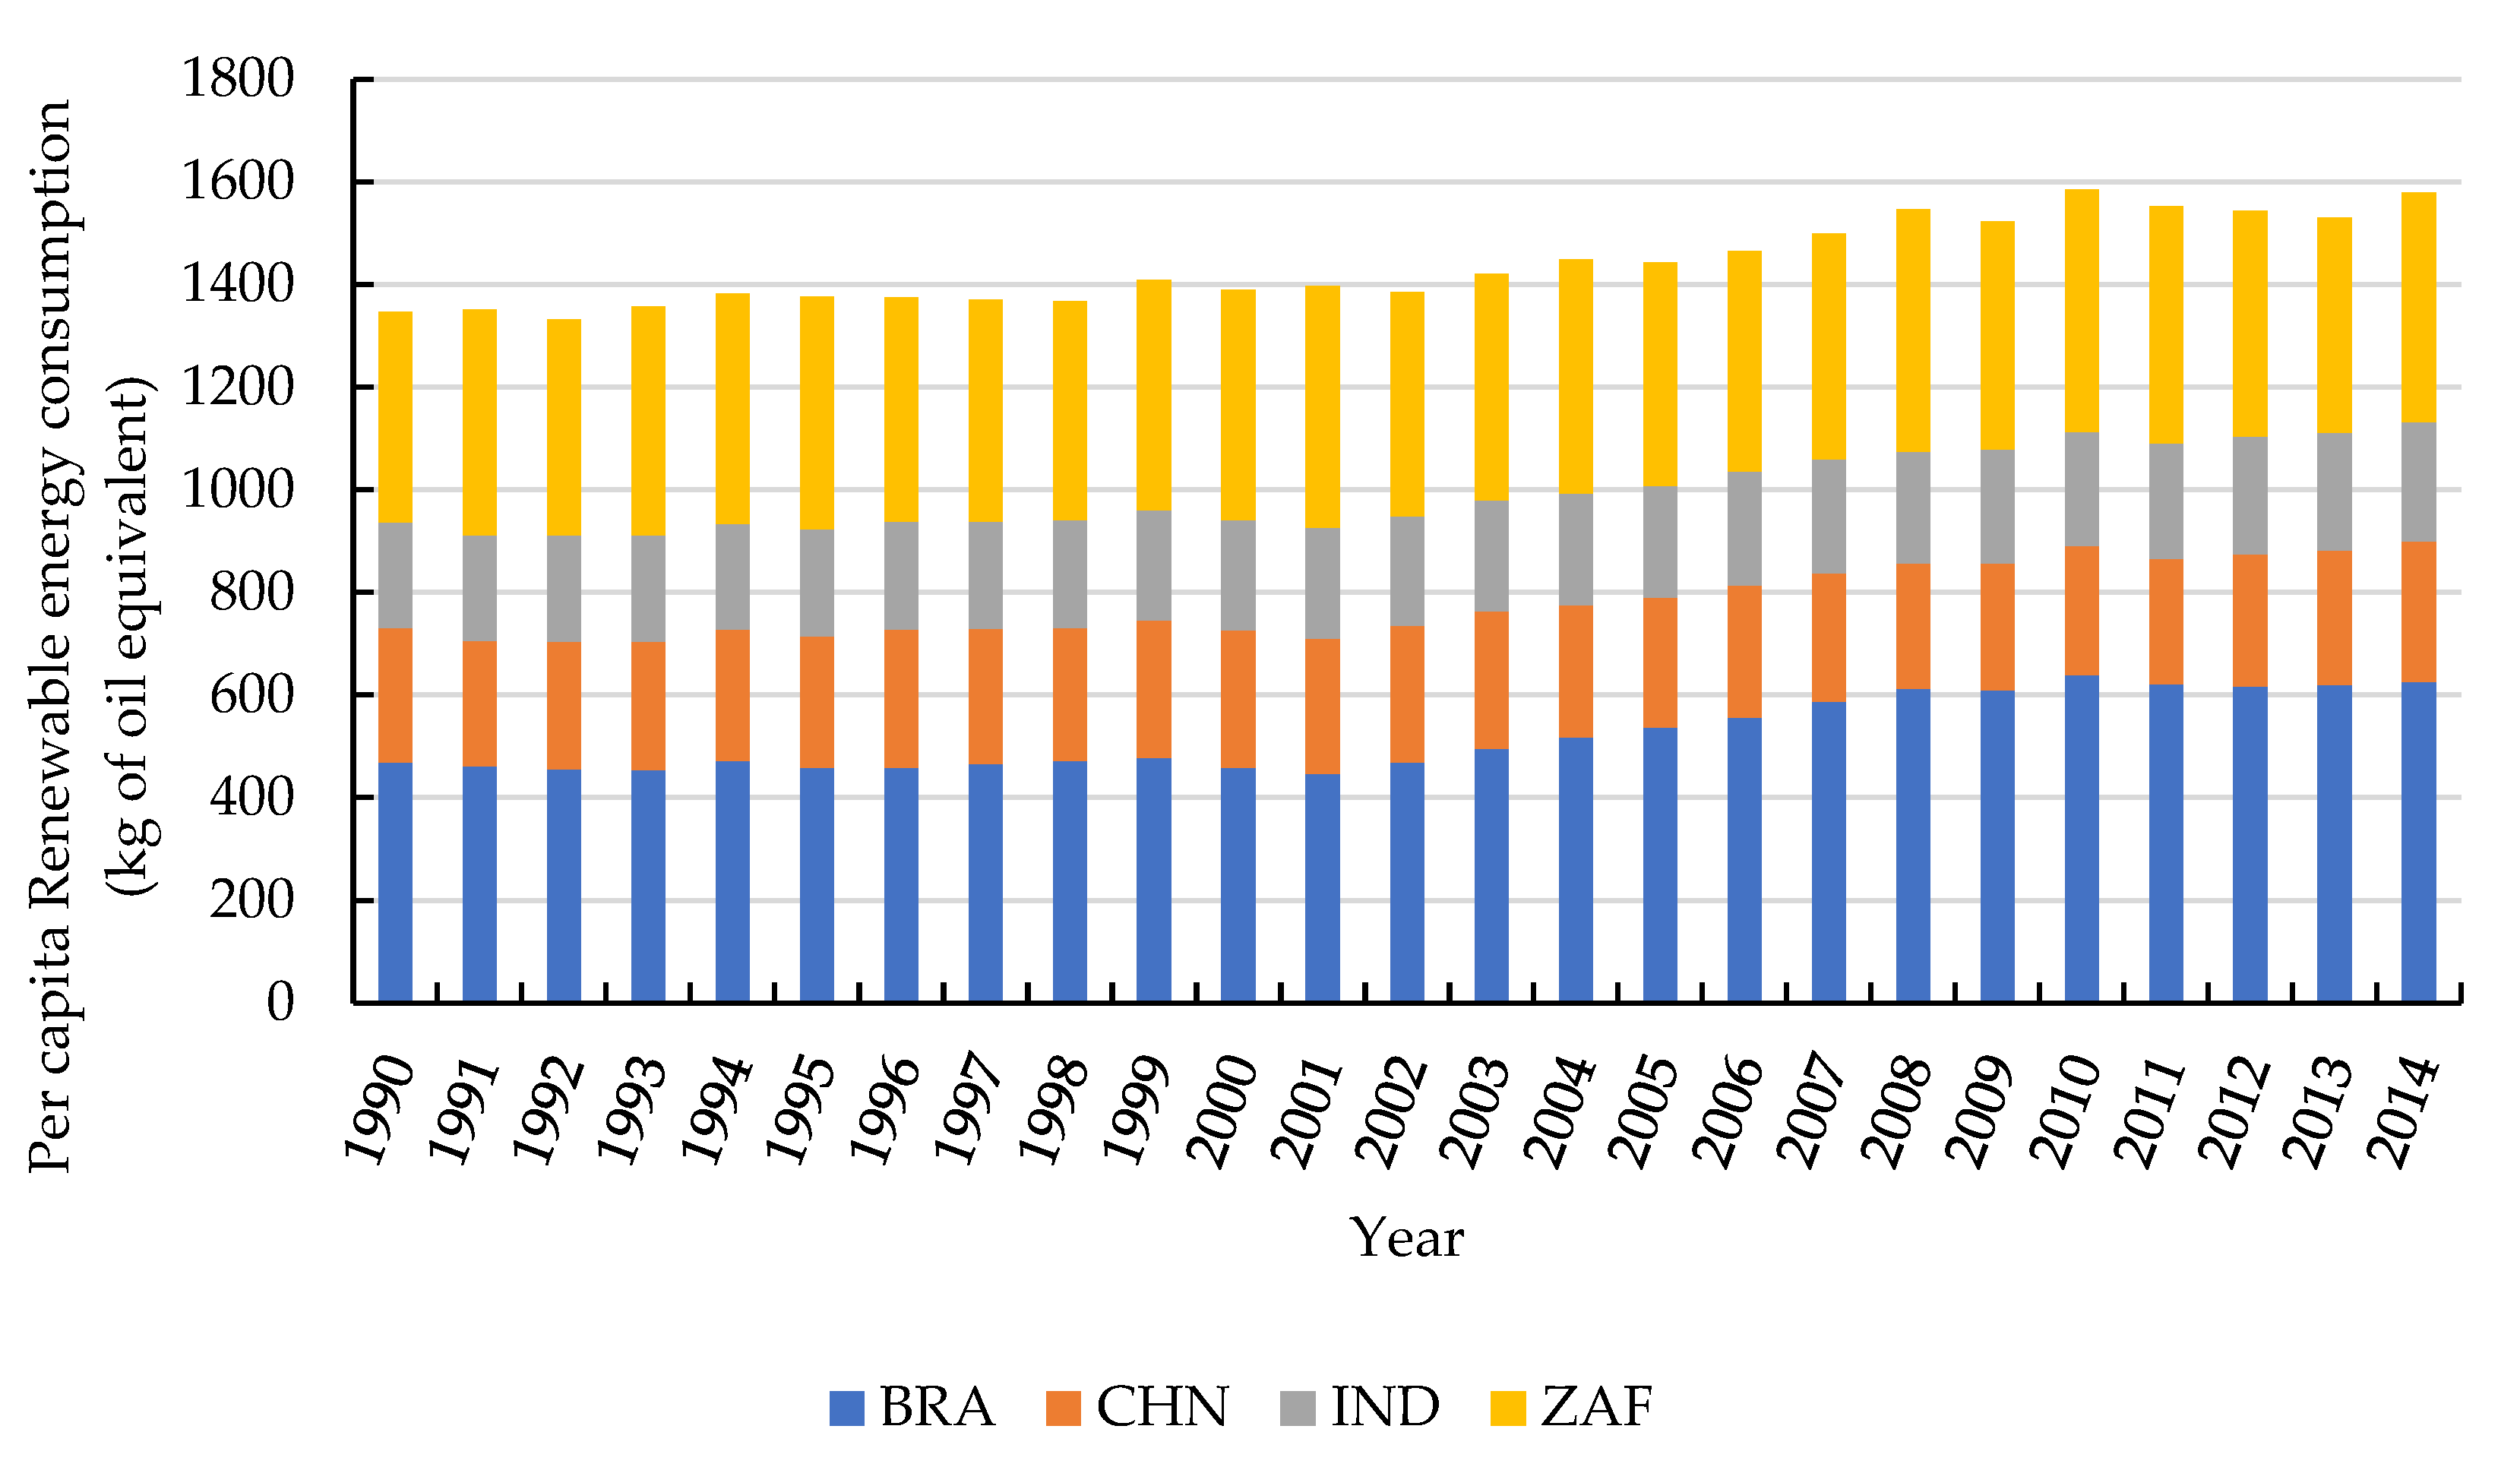
16]. Besides, renewable energy is the fastest-growing energy form. Therefore, as concerns about environmental degradation and energy security grow, the search for and use of renewable energy is considered as a solution for the sustainable development of BRICS countries. The per capita consumption of renewable energy in the BRICS countries has not grown rapidly with the development of the economy, as shown in Figure 3, so renewable energy has a bright future in the BRICS countries. In 2013, four BRICS countries (China, Brazil, India, and South Africa) were among the top 10 renewable energy investment countries [17]. Concern has been raised about the social and environmental sustainability in BRICS countries. It is a top priority for BRICS countries to coordinate the relationship between the economy and environment and mitigate the global greenhouse effect, which is of great significance to the global sustainable development [9,18].
Given that carbon dioxide emissions and sustainable development are the main concerns of policymakers and energy environmentalists, we will take BRICS countries (except Russia) as the research objects based on the 3SLS model and carry out panel analysis on the relationship between real output, renewable energy consumption, and CO2 emissions. To study the nexus between real output and renewable energy consumption and carbon dioxide emissions, and how to adjust the relationship, we will provide strong suggestions for climate change mitigation policies. In order to study this hot issue, we analyzed the existing literature and adopted appropriate methods. Through unit root test, cointegration test, model setting test, and 3SLS regression estimation we have studied the real output, renewable energy consumption, and CO2 emissions of BRICS countries, providing a reference for global sustainable development.
The main contributions of this paper to the existing research are as follows: (1) Although there is a lot of literature on the relationship between per capita GDP (or real output) and energy consumption, the literature on renewable energy consumption in BRICs countries, for example, is very scarce, and the results are uneven [19]. As a potential variable, the consumption of renewable energy is added to the relationship between real output and CO2 emissions. However, the contribution of renewable energy to reducing CO2 emissions without damaging the actual output is ignored in the literature. As the results of previous studies are not clear, further studies on the relationship between real output, renewable energy consumption, and environmental degradation are needed as different comparative opinions. (2) We study the relationship between real output, energy consumption, and CO2 emissions through the energy output emission system, rather than using a simple single econometric model to describe the relationship between them. Moreover, simultaneous equation technology can also effectively avoid some econometric problems (such as endogenous problems and residual simultaneous correlation problems). (3) In addition to real output and renewable energy consumption, financial development, human capital level, physical capital, urban population, and trade openness are also included in the research system to overcome regulatory deviation. It is generally believed that taking more factors related to CO2 emissions into account in the model can ensure the accuracy of the calculation results [20]. (4) To find out the role of renewable energy consumption in real output and CO2 emissions is of great significance to the sustainable development of developing countries, especially BRICs countries. It not only helps policy-makers and governments to reduce carbon dioxide emissions, but also promotes the growth of the renewable energy industry.
The rest of the paper is arranged as follows: Section 2 states a literature review. Section 3 presents an introduction to the research framework and model. Data description, empirical results, and discussion are described in Section 4. Section 5 introduces the conclusions, policy implications, and study limitations.

2. Literature Review

Because of the incentive effect of CO2 emissions reduction policies, in recent years, more and more empirical studies are devoted to the study of the relationship between various factors (such as real output, urbanization, and energy consumption) and CO2 emissions, as well as the impact of these factors on CO2 emissions. This paper reviews the existing literature from the following three aspects.

2.1. Real Output and CO2 Emissions

In the past decades, scholars in economics and environmental science have been focusing on the carbon dioxide emissions caused by real output, which is considered to be the main cause of global warming and climate change. Therefore, there is a large number of literatures extensively discussing the relationship between real output and CO2 emissions. There are two main views on the relationship between real output and CO2 emissions. One is to support the opinion of Grossman and Krueger [21], that is, in the initial stage of economic growth, CO2 emissions will go up, but later, with the increase of income, CO2 emissions will go down in the light of the environmental Kuznets curve (EKC) [22,23,24]. For example, using a panel vector error correction model, Apergis and Payne [22] studied the relationship between carbon dioxide emissions, energy consumption, and output for six Central American countries from 1971 to 2004. The results show that there is an inverted U-shaped relationship between real output and CO2 emissions in long-run equilibrium. Another view is that there is a causal relationship between real output and carbon dioxide emissions [25,26,27]. For example, Apergis and Payne [27] pointed out that long term elasticity estimates are positively correlated with real GDP per capita, CO2 emissions per capita, and real oil prices in 11 South American countries from 1980 to 2010.

2.2. Renewable Energy Consumption and CO2 Emissions

Inspired by the ecological challenges and theoretical debates, a large number of studies have empirically studied renewable energy consumption, one of the determinants of carbon dioxide emissions [28,29,30,31,32,33,34]. For example, Menyah and Wolde-Rufael [28] explored the relations between CO2 emissions, renewable energy and nuclear energy consumption, and real GDP in the United States from 1960 to 2007 through the modified Granger causality test. It is found that the one-way causal relationship from nuclear energy consumption to CO2 emissions has no feedback, however, there is no causal relationship between renewable energy and carbon dioxide emissions. Based on the data of OECD member countries from 1980 to 2011, Shafiei and Salim [29] tried to explore the factors affecting CO2 emissions through the STIRPAT model. The results confirm that nonrenewable energy consumption causes the increase of CO2 emissions, while renewable energy consumption causes the decrease of CO2 emissions. Apergis et al. [34] studied the causality between carbon dioxide emissions, nuclear energy consumption, renewable energy consumption, and economic growth in a group of 19 developed and developing countries from 1984 to 2007. The empirical results show that there is a short-term two-way causal relationship between economic growth and renewable energy and nuclear energy consumption, which supports the feedback hypothesis.

2.3. CO2 Emissions' Factors and CO2 Emissions in BRICS Countries

A large number of studies use statistical tools and regression models to study the impact factors of CO2 emissions in BRICS countries. For example, Wang and Zhang [10] used the least square method to conduct empirical research on R&D investment and CO2 emissions of BRICS countries in 1996–2014. Their results show that increasing R&D investment has a positive impact on the decoupling of economic growth and environmental pressure. Wang and Kubota [18] tried to make an empirical study on the relationship between urbanization and CO2 emissions in BRICS countries over the period 1985 to 2014. The results bored out that there is a long-term equilibrium cointegration relationship between urbanization and CO2 emissions. Table 2 is a summary of empirical research on the relationship between various influencing factors and CO2 emissions in BRICS countries. In general, the findings of the existing literature show that few studies attempt to explore the relationship between the renewable energy consumption and CO2 emissions of BRICS countries (Dong et al. [9]), and the research results are uncertain and mixed. It is necessary to further explore the causality between real output, renewable energy consumption, and CO2 in the BRICS context. As a developing country with a large emerging economy, BRICS countries are concerned about the relationship between these variables, both in policy and academic circles. In order to understand this knowledge gap and contribute to the existing literature, given this motivation, our experience in this area will try to provide profound policy insights to help policymakers develop sustainable energy policies to support efficient or optimal growth paths in BRICS countries.

3. Theoretical Framework and Methodology

3.1. Theoretical Framework

Capital, labor, and energy are essential resources for economic growth and social development of an economy. However, since the industrial revolution, human society has not only promoted economic growth and social prosperity by consuming a lot of energy but also triggered the emergence of global climate change. Therefore, energy input must be used in an environmentally friendly way to achieve sustainable development. The current research mainly focuses on the relationship between overall energy consumption and real output. There are a few kinds of literature on the relationship between renewable energy consumption and real output. Therefore, it is necessary to study the relationship between energy consumption, real output, and ecological environment. We construct an enhanced endogenous growth model that explores in detail the link between renewable energy consumption growth, real output, and CO2 emissions. The endogenous growth model emphasizes the role of human capital and physical capital in economic growth. Since energy plays a vital role in the key inputs of labor and capital, energy should be regarded as an important input in the production process. In this study, an enhanced endogenous growth model [46] is used to describe the role of physical capital (K), the labor force (L), human capital (H), energy (E), and system efficiency (A). System efficiency is the ability to improve environmental quality by reducing CO2 emissions in some ways. Therefore, the specific model is as follows:
Y t = K t L t H t E t CO 2 t
where A t = A ( CO 2 t ) .
In the literature on the relationship between renewable energy consumption and real output, energy consumption has both direct and indirect effects on real output. On the one hand, energy is the main input of the production process and commercial activities. As a result, the increased demand for energy may lead to huge investment by local and foreign investors in the energy sector, which promotes the technical efficiency of renewable energy that needs a higher level of technology and also contribute to the real output in the process. The cost of renewable energy is relatively high, such as wind power and nuclear power. The cost of both is more than twice that of thermal power. However, because of environmental protection and the rapid growth of energy demand, the high demand for renewable energy creates employment opportunities for those directly engaged in green energy production and supply. More importantly, the long industrial chain of the renewable energy industry can drive the increase in employment in all sectors. The increase of real output will increase the per capita real income. The increase of per capita income will make the improvement of people’s quality of life and the requirements of environmental quality will also increase. Green energy has become an alternative to reduce CO2 emissions without reducing the actual output. The demand for renewable energy will rise. On the other hand, for those economies that rely on resource exports, real output may reduce local energy consumption because of social governance and other reasons. Asafu [47] believes that there is a two-way causal relationship between energy consumption and economic growth. The complementary relationship between energy consumption and economic growth, unfortunately, the research results of some countries show that the impact of energy consumption on real output is ignored. Therefore, this hypothesis does not consider that there is a causal relationship between energy consumption and real output.
With the rapid real output growth and increasing global energy consumption, CO2 emissions tend to rise, at least beyond the low-income level (EKC assumption). CO2 emissions may also have a causal impact on GDP. Under the premise of maintaining real output growth, there are two ways to reduce energy consumption: industrial structure adjustment and substitution between input factors. Therefore, the research of high efficiency, low cost, and environment-friendly renewable energy has become a research hotspot. With the highlight of the greenhouse effect and the frequent occurrence of extreme weather, CO2 emissions have a great impact on the global climate and environment. Excessive carbon dioxide emissions also have an impact on the weather conditions in an area, especially in terms of human health and the temperature of agricultural products, while having a negative impact on health and labor productivity. The increase in energy consumption may have more and more impact on carbon dioxide emissions. How to achieve energy conservation and emission reduction while ensuring economic development, and achieve sustainable economic development? Renewable energy alternative fossil energy has huge benefits (Reinhardt and Falkenstein [48]).
The production function of CO2 emissions describes the generation of CO2 emissions as a function of economic activity level (Yt), urbanization rate (U), energy consumption (E), and technical efficiency (At), because the energy efficiency is improved by obtaining foreign investment through economic and trade opening (T).
CO 2 t = A t Y t U t E t
where A tt = A ( T t ) .
Therefore,
CO 2 t = Y t E t U t T t
The production function of CO2 emission conforms to the EKC hypothesis [21]. The production of CO2 emissions mainly depends on the level of output (Y). The growth of output needs a lot of energy, followed by the growth of CO2 emissions. Besides, the level of urbanization is usually closely related to the level of CO2 emissions [18,43]. The cross-regional flow of goods and services brought about by economic opening up also has an important impact on the CO2 emissions level of a specific economy.
Energy demand (Ed) is closely related to economic and social factors. Household energy demand (Ehd) is mainly affected by per capita income level (Y), energy price (P), and urbanization rate (U). The energy demand (Efd) of enterprises is also affected by income (Y), physical capital (K), labor force (L), human capital development (H), financial development (F), and production system efficiency (A).
E hd = E ( Y t , P t , U t )
E fd = E ( A t , Y t , K t , L t , H t , F t )
where A = A ( CO 2 t , ) .
E fd = E ( Y t , K t , L t , H t , F t , CO 2 t , )
Therefore, the energy equation can be written as follows:
E d = E ( Y t , P t , U t , K t , L t , H t , F t , CO 2 t , )
The demand for energy (such as renewable energy) is a function of income levels, real output, and affordable alternatives. The development of the financial sector can simplify the process of capital accumulation and energy procurement financing, and the use of sufficient funds and advanced technology can make more effective use of energy [49]. As a result of real output growth and social development, a large labor force is transferred from agriculture to urban industry, and urban economic activities are more intensive, resulting in the rapid increase of energy use in urban areas [18,43,49,50]. According to the International Energy Agency (IEA) estimate [51], from the perspective of production, about 70% of global energy-related CO2 emissions come from urban areas, and by 2030, this proportion is expected to be as high as 76%. As a result, high population growth or urbanization leads to increased energy demand. Urbanization has become an important factor in climate change management and sustainable development for academics and policymakers. Labor and capital are the main inputs of production activities, which have a crucial impact on the development of enterprises. Improving human capital through education will improve labor productivity and reduce the use of energy-intensive technologies or carbon-intensive energy products. The higher the CO2 emissions of an energy source, the less the demand for it if there are equally affordable alternative energy sources because of the harmful effects of pollution. Therefore, the relationship between energy- output-emission in this paper can be described by a simultaneous equation model based on the combination of Equations (1), (3), and (7), as follows:
Y t = f ( K t , L t , H t , E t , CO 2 t )
CO 2 t = f ( Y t , E t , U t , T t )
E t = f ( Y t , P t , U t , K t , L t , H t , F t , CO 2 t , )

3.2. Methodology

According to the above analysis framework, the EKC equation, real output equation, and energy demand equation are jointly composed of the following simultaneous equations. Thus, the simultaneous equations can be re-specified in the log-linear form as follows:
l n ( P G D P i t ) = 0 + 1 l n ( R E C i t ) + 2 l n ( K i t ) + 3 l n ( H i t ) + 4 l n ( C O 2 i t ) + μ i t
l n ( R E C i t ) = β 0 + β 1 l n ( C O 2 i t ) + β 2 l n ( P G D P i t ) + β 3 l n ( H i t ) + β 4 l n ( K i t ) + β 5 l n ( F D i t ) + β 6 l n ( U R B i t ) + ν i t
l n ( C O 2 i t ) = λ 0 + λ 1 l n ( R E C i t ) + λ 2 l n ( U R B i t ) + λ 3 l n ( P G D P i t ) + λ 4 l n ( O P E N N E S S i t ) + θ i t
where P G D P = G D P per capita; R E C = proportion of renewable energy consumption to total energy consumption.
C O 2 = CO2 emissions per capita; K = physical capital.
H = human capital development; F D = financial development.
U R B = urbanization rate; O P E N N E S S = trade openness.
μ i t , ν i t , and θ i t = Error terms.
Considering the internal correlation between the explanatory variables and the error term in the specified equation, the simultaneous equation model may be biased if it is estimated by the ordinary least square method (OLS). In this study, the three-stage least square method (3SLS) is used. The 3SLS proposed by Zellner and Theil [52] is a kind of complete information estimation method for estimating the simultaneous equation model. Its basic idea is to construct the statistics of the covariance matrix of random disturbance term of the model by using the estimation error of two-stage least square method, so as to carry out the generalized least square estimation for the whole model. Compared with 2SLS, 3SLS allows the correlation between unobserved interferences between different equations to be used in the analysis and has better asymptotic efficiency. In this paper, R software is used to estimate the equations.

4. Results Analysis

4.1. Preliminary Analysis

4.1.1. Descriptive Statistic

As mentioned earlier, CO2 emissions are considered to be the main greenhouse gases that contribute to global warming. This paper aims to study the impact of renewable energy consumption and real output on CO2 emissions of BRICS countries (Brazil, China, India, Russia, South Africa). All data were obtained from the World Bank. Russia’ data on financial development are not available before 2014, thus Russia is excluded from the BRICs sample. Because of data availability constraints, the research period was extended from 1999 to 2014. Before conducting the empirical analysis, all the data were converted to the natural logarithm, see Table 3 for details of selected variables.
CO2 is measured in metric tons per capita. Real output is measured by GDP per capita (constant 2010 US$), and the renewable energy consumption is measured by the percentage of renewable energy consumption in total energy consumption. As the relationship between CO2 emissions, real output, and renewable energy consumption may be affected by other factors, according to the theoretical work, traditional experience and previous literature in Section 3.1 [9,18,45], this model includes additional explanatory variable vectors composed of trade openness, financial development level, urbanization, physical capital, and human capital level.
Table 4 shows the descriptive statistics of the variables. The distribution of all variables is skewed. The kurtosis value indicates that the distribution of the eight sequences is more concentrated than the normal distribution with a long tail. At the same time, the correlation matrix in Table 4 shows that all variables are positively correlated with carbon dioxide except for the proportion of renewable energy, physical capital, and human capital. Descriptive statistics do not reveal the causal relationship but need empirical research on the causal relationship between carbon dioxide and the predicted variables in the study.

4.1.2. Test for Cross-Sectional Dependence

We used the Pesaran [53] test to diagnose whether cross-sectional dependencies exist in our panel variables. The zero hypothesis of this test assumes that the cross-section is independent of the other hypothesis of cross-section dependence. Table 5 shows the cross-sectional correlation test results for all variables. All variables are strongly opposed to the zero assumption of cross-sectional independence. We conclude that cross-sectional dependence exists as expected.
See Table 6 for panel unit root test results. Four-panel unit root tests [54,55,56] are used to determine the stability of the series. The results show that the BRICS panel is integrated with the first stage, i.e., I (1).

4.2. Results and Analysis

Based on the analysis and test of the data, this paper uses the 3SLS model to estimate the relationship between the real output, renewable energy consumption, and CO2 emissions of BRICS countries. The estimation results of the simultaneous equation show that there is a ternary relationship between BRICS group variables (energy—output—emission). We present a detailed analysis of the impact and direction between the specific variables below.

4.2.1. Effects of Renewable Energy Consumption and CO2 Emission on Real Output

Based on the constructed simultaneous equation model (Equation (9)), this paper uses the three-stage least square method (3SLS) to estimate the BRICS group (except Russia) and individual BRICS countries (Brazil, China, India, and South Africa). Table 7 shows the impact of the proportion of renewable energy consumption (REC) and carbon dioxide emissions (CO2) on the per capita GDP (PGDP) of the selected BRICS countries. From the perspective of the BRICS group, renewable energy consumption and per capita CO2 emissions have a significant positive impact on the per capita GDP of BRICS. The share of renewable energy consumption (or per capita CO2 emissions) increased by 1%, and the per capita GDP increased by 2.194% (or 2.077%). At the same time, the increase of CO2 emissions will lead to output growth, which may be because BRICS, as the fastest-growing developing country at this stage, mainly relies on the secondary industry to promote its output growth, and the energy currently used is mainly fossil energy. Therefore, it will lead to a large number of CO2 emissions, to some extent, it is still to sacrifice the environment to promote its rapid output growth. Among the control variables, the impact of physical capital on per capita GDP is not significant, while the impact of the human capital level on per capita GDP is extremely significant. This means that education has a significant effect in promoting the overall output growth of BRICS.
From the empirical results of individual countries, all variables in Brazil (i.e., REC, K, H, CO2) have a significant impact on GDP, among which REC, K, and CO2 have a positive impact on GDP, while H has a negative impact. Consistent with the research results of Fang [57], this paper also confirms that REC and CO2 in China have a significant positive impact on GDP. REC and H of India and South Africa have a significant impact on GDP. The similarity between both countries is that their REC and GDP change in the opposite direction. The difference is that India’s H and GDP change in the same direction, and South Africa’s H and GDP change in the opposite direction. In terms of control variables, the impact of physical capital on per capita GDP only has a significant positive impact in Brazil and South Africa. The impact of human capital development on per capita GDP is significant in Brazil (negative), India (positive), and South Africa (negative). This shows that education promotes India’s real output, but hinders Brazil’s and South Africa’s real output. Of course, education also has a positive impact on China’s real output, but it is not significant.

4.2.2. Effects of Real Output and CO2 Emission on Renewable Energy Consumption

Table 8 shows the impact of GDP per capita and CO2 emissions per capita on the proportion of renewable energy consumption to total energy consumption. In general, from the group’s estimates, GDP per capita has a positive and significant influence on the share of renewable energy consumption, while CO2 per capita has a significant negative impact on the share of renewable energy. The increase in income will require higher environmental quality and increase investment in renewable energy. Of course, the increase in income also increases the consumption of energy. The use of renewable energy and nonrenewable energy together may reduce CO2 emissions. However, it depends on the availability of alternative energy. Besides, high levels of CO2 emissions will damage the quality of the environment, thus affecting human health and productivity, and thus GDP. GDP per capita (or CO2 per capita) increased by 1%, and the proportion of renewable energy increased by 0.158% (or decreased by 0.923%). In terms of control variables, except for physical capital and financial development, the influence of other control variables is not significant. Physical capital has a significant negative impact on the proportion of renewable energy, while financial development has a significant positive effect on the proportion of renewable energy.
At the national level, except that Brazil’s per capita GDP has a significant positive impact on Brazil’s share of renewable energy consumption, the other three countries are not significant. CO2 is different. Except for South Africa, it has a significant negative impact on the share of renewable energy consumption in the other three countries. As far as other variables are concerned, physical capital has a significant negative impact only in Brazil and China. The level of human capital only has a significant impact on India (positive) and South Africa (negative). Financial development and urbanization rate only have a positive and significant impact in China. Therefore, compared with other BRICS countries, China has obvious advantages in the effective use of energy by obtaining funds through financial sector development.

4.2.3. Effects of Real Output and Renewable Energy Consumption on CO2 Emission

The impact of per capita real GDP and renewable energy consumption on per capita carbon dioxide emissions are shown in Table 9. From the perspective of the BRICS group as a whole, GDP per capita and the proportion of renewable energy have a significant impact on per capita CO2 emissions. The proportion of renewable energy increased by 1%, per capita CO2 emissions decreased by 1.144%, while per capita GDP increased by 1%, per capita CO2 emissions increased by 0.696%. This is also in line with the “priority” expectation that as a group of developing countries, the use of energy-intensive technologies (with low per capita income) will generate high pollution (EKC assumption). The influence of control variables on per capita CO2 emissions is not significant. The increase in income leads to an increase in energy consumption, which is closely related to CO2 emissions. The increase in the proportion of renewable energy can significantly reduce per capita CO2 emissions, so for BRICS countries, the feasible way to solve the energy demand and environmental quality is to vigorously develop renewable energy.
From the results of individual countries, although the per capita GDP of BRICS countries has a positive impact on per capita CO2 emissions, only Brazil’s results are significant. Compared with the per capita CO2 emissions, the proportion of renewable energy in all countries has a negative impact on per capita CO2 emissions. Except for South Africa, the impact of the other three countries is very significant. As a control variable, urbanization rate and trade openness have no significant impact on per capita CO2 emissions.

4.2.4. The Relationship between Renewable Energy, Real Output, and CO2 Emissions in BRICS Countries

Table 10 is a summary of the results of the relationship between the three core variables, renewable energy, real output, and CO2 emissions. The BRICS and Brazil variables have a completely significant interaction (simultaneous) effect (energy output emissions). There is an incomplete link between China (no output emission relationship) and India (no output emission relationship) variables. Renewable energy has a positive impact on real output and vice versa, especially in Brazil compared with other countries. For South Africa, only a binary link between energy and output has been found. The rising incomes will require higher environmental quality and increase investment in renewable energy. Of course, the income grew also increases the consumption of energy. The use of renewable energy and nonrenewable energy together may reduce CO2 emissions. However, it depends on the availability of alternative energy. Also, high levels of CO2 emissions will damage the quality of the environment, thus affecting human health and productivity, and thus GDP.

5. Conclusions

This paper studies the relationship between real output, renewable energy consumption, and CO2 emissions in BRICS countries from 1999 to 2014. Through the energy output emission relationship, a simultaneous equation model is established. On this basis, this paper estimates the simultaneous equation model by three-stage least square method (3SLS) and makes an empirical analysis of the results of the BRICS group and individual countries. The empirical results show that for BRICS, there is a complete ternary relationship between BRICS variables (energy—output—emission), and renewable energy has a significant positive impact on real output, and vice versa. Compared with other countries, this result is particularly significant in Brazil. There is an incomplete link (no output emission relationship) between China and India variables. However, the correlation between variables in South Africa mainly occurs in the energy output chain (renewable energy GDP per capita). In addition, financial development plays a significant role in promoting the development of renewable energy. Financial development can simplify the process of capital accumulation and energy procurement financing, contribute to more investment in renewable energy, and enable BRICS countries to benefit from the transfer of “green technology.”
The results show that the relationship among real output, renewable energy consumption, and CO2 emissions is different in different countries. There are also imbalances in the internal development of BRICS countries, so each country should also adapt its energy policies to local conditions. For India and South Africa, increasing renewable energy consumption can reduce CO2 emissions at the expense of real output. For economies such as India and South Africa in urgent need of development, encouraging renewable energy consumption is not necessarily an effective way to reduce CO2 emissions. How to achieve sustainable development is crucial for South Africa and India. In order to make per capita GDP reach the turning point of Kuznets curve, it is necessary to improve citizen consciousness, industrial structure reform, and human capital level. The increase in income will have higher requirements for environmental quality, which will eventually lead to increased investment in renewable energy in India and South Africa. For China and Brazil, how to achieve low-carbon growth by increasing investment in renewable energy and adjusting energy consumption structure without reducing real output. In addition, the positive role of financial development in promoting renewable energy consumption should not be ignored, so it is suggested that BRICS countries can improve the renewable energy financing network and reduce the financing cost of renewable energy. As a group of developing countries with rapid development, sustainable development is the most important, and environmental pollution is the obstacle to sustainable development. Therefore, effective measures must be taken to adapt to local conditions. Finally, BRICS countries should act together, strengthen cooperation, jointly promote the development of renewable energy and energy conservation and emission reduction technologies, and meet the growing energy demand by finding alternative clean energy.
The relationship between real output, renewable energy consumption, and CO2 emissions of BRICS countries is studied in this paper. This research also has some shortcomings, such as: (1) lack of Russia’s data makes the BRICS sample data incomplete. In future studies, enough data samples can be collected for in-depth analysis. Of course, similar groups of countries can repeat this analysis. (2) Although our research focuses on renewable energy, there are many types of renewable energy that were not covered. In future studies, we can analyze the impact of different types of renewable energy on real output and CO2 emissions.

Author Contributions

All authors designed the research and wrote the paper. Conceptualization, Y.-S.R. and J.-L.L.; data curation, Y.-S.R. and J.-L.L.; formal analysis, Y.-S.R. and J.-L.L.; funding acquisition, C.-Q.M. and X.-W.Z.; investigation, C.-Q.M. and X.-W.Z.; methodology, Y.-S.R. and J.-L.L.; software, Y.-S.R. and J.-L.L.; supervision, C.-Q.M.; validation, Y.-S.R.; visualization, C.-Q.M.; writing—original draft, Y.-S.R. and J.-L.L.; writing—review and editing, Y.-S.R., J.-L.L. All authors have read and agreed to the published version of the manuscript.

Funding

This research was funded by the National Natural Science Foundation of China (Nos. 71431008, 71850012, 71790593, 71901108), the National Social Science Fund of China (No. 19AZD014), and the Department of Science and Technology of Hunan province (No. 2018GK1020).

Acknowledgments

The authors would like to thank the anonymous referees for their careful reading of this article and valuable suggestions. We gratefully acknowledge the financial support from the National Natural Science Foundation of China (Nos. 71431008, 71850012, 71790593, 71901108), National Social Science Fund of China (No. 19AZD014), and major special Projects of the Department of Science and Technology of Hunan province (No. 2018GK1020).

Conflicts of Interest

The authors declare no conflict of interest.

References

  1. Destek, M.A.; Sarkodie, S.A. Investigation of environmental Kuznets curve for ecological footprint: The role of energy and financial development. Sci. Total Environ. 2019, 650, 2483–2489. [Google Scholar] [CrossRef] [PubMed]
  2. Levin, K.; Cashore, B.; Bernstein, S.; Auld, G. Overcoming the tragedy of super wicked problems: Constraining our future selves to ameliorate global climate change. Policy Sci. 2012, 45, 123–152. [Google Scholar] [CrossRef]
  3. Chen, L.; De Lombaerde, P. Testing the relationships between globalization, regionalization and the regional hubness of the BRICS. J. Policy Model. 2014, 36, 111–131. [Google Scholar] [CrossRef]
  4. Cassiolato, J.E.; Soares, M.C.C. The Role of the State: BRICS National Systems of Innovation; Routledge: London, UK; New York, NY, USA; New Delhi, India, 2013. [Google Scholar]
  5. Goldman, S. Dreaming with BRICS: The path to 2050. Glob. Econ. Pap. 2003, 99. [Google Scholar]
  6. Pao, H.T.; Tsai, C.M. CO2 emissions, energy consumption and economic growth in BRIC countries. Energy Policy 2010, 38, 7850–7860. [Google Scholar] [CrossRef]
  7. Zhang, Z.; Xi, L.; Bin, S.; Yuhuan, Z.; Song, W.; Ya, L.; Hao, L.; Yongfeng, Z.; Ashfaq, A.; Guang, S. Energy, CO2 emissions, and value added flows embodied in the international trade of the BRICS group: A comprehensive assessment. Renew. Sustain. Energy Rev. 2019, 116, 109432. [Google Scholar] [CrossRef]
  8. Cowan, W.N.; Chang, T.; Inglesi-Lotz, R.; Gupta, R. The nexus of electricity consumption, economic growth and CO2 emissions in the BRICS countries. Energy Policy 2014, 66, 359–368. [Google Scholar] [CrossRef] [Green Version]
  9. Dong, K.; Sun, R.; Hochman, G. Do natural gas and renewable energy consumption lead to less CO2 emission? Empirical evidence from a panel of BRICS countries. Energy 2017, 141, 1466–1478. [Google Scholar] [CrossRef]
  10. Wang, Q.; Zhang, F. Does increasing investment in research and development promote economic growth decoupling from carbon emission growth? An empirical analysis of BRICS countries. J. Clean. Prod. 2019, 10, 119853. [Google Scholar] [CrossRef]
  11. Sterner, T.; Damon, M. Green growth in the post-Copenhagen climate. Energy Policy 2011, 39, 7165–7173. [Google Scholar] [CrossRef]
  12. Wang, Z.; Bui, Q.; Zhang, B. The relationship between biomass energy consumption and human development: Empirical evidence from BRICS countries. Energy 2020, 194, 116906. [Google Scholar] [CrossRef]
  13. Bilgili, F.; Koçak, E.; Bulut, Ü.; Kuşkaya, S. Can biomass energy be an efficient policy tool for sustainable development? Renew. Sustain. Energy Rev. 2017, 71, 830–845. [Google Scholar] [CrossRef]
  14. Baek, J. Do nuclear and renewable energy improve the environment? Empirical evidence from the United States. Ecol. Indic. 2016, 66, 352–356. [Google Scholar] [CrossRef]
  15. Zeng, S.; Liu, Y.; Liu, C.; Nan, X. A review of renewable energy investment in the BRICS countries: History, models, problems and solutions. Renew. Sustain. Energy Rev. 2017, 74, 860–872. [Google Scholar] [CrossRef]
  16. Alper, A.; Oguz, O. The role of renewable energy consumption in economic growth: Evidence from asymmetric causality. Renew. Sustain. Energy Rev. 2016, 60, 953–959. [Google Scholar] [CrossRef]
  17. Zafar, M.W.; Mirza, F.M.; Zaidi, S.A.H.; Hou, F. The nexus of renewable and nonrenewable energy consumption, trade openness, and CO2 emissions in the framework of EKC: Evidence from emerging economies. Environ. Sci. Pollut. Res. 2019, 26, 15162–15173. [Google Scholar] [CrossRef] [PubMed]
  18. Wang, Y.; Li, L.; Kubota, J.; Han, R.; Zhu, X.; Lu, G. Does urbanization lead to more carbon emission? Evidence from a panel of BRICS countries. Appl. Energy 2016, 168, 375–380. [Google Scholar] [CrossRef]
  19. Balsalobre-Lorente, D.; Shahbaz, M.; Roubaud, D.; Farhani, S. How economic growth, renewable electricity and natural resources contribute to CO2 emissions? Energy Policy 2018, 113, 356–367. [Google Scholar] [CrossRef] [Green Version]
  20. Wu, W.; Ma, X.; Zhang, Y.; Li, W.; Wang, Y. A novel conformable fractional non-homogeneous grey model for forecasting carbon dioxide emissions of BRICS countries. Sci. Total Environ. 2019, 707, 135447. [Google Scholar] [CrossRef]
  21. Grossman, G.M.; Krueger, A.B. Environmental impacts of a North American free trade agreement. Natl. Bur. Econ. Res. Work Pap. Ser. 1991, 1–57. [Google Scholar]
  22. Apergis, N.; Payne, J.E. CO2 emissions, energy usage, and output in Central America. Energy Policy 2009, 37, 3282–3286. [Google Scholar] [CrossRef]
  23. Apergis, N.; Payne, J.E. The emissions, energy consumption, and growth nexus: Evidence from the commonwealth of independent states. Energy Policy 2010, 38, 650–655. [Google Scholar] [CrossRef]
  24. Lean, H.H.; Smyth, R. CO2 emissions, electricity consumption and output in ASEAN. Appl. Energy 2010, 87, 1858–1864. [Google Scholar] [CrossRef]
  25. Bowden, N.; Payne, J.E. Sectoral analysis of the causal relationship between renewable and non-renewable energy consumption and real output in the US. Energy Source Part B 2010, 5, 400–408. [Google Scholar] [CrossRef]
  26. Payne, J.E. The causal dynamics between US renewable energy consumption, output, emissions, and oil prices. Energy Source Part B 2012, 7, 323–330. [Google Scholar] [CrossRef]
  27. Apergis, N.; Payne, J.E. Renewable energy, output, carbon dioxide emissions, and oil prices: Evidence from South America. Energy Source Part B 2015, 10, 281–287. [Google Scholar] [CrossRef]
  28. Menyah, K.; Wolde-Rufael, Y. CO2 emissions, nuclear energy, renewable energy and economic growth in the US. Energy Policy 2010, 38, 2911–2915. [Google Scholar] [CrossRef]
  29. Shafiei, S.; Salim, R.A. Non-renewable and renewable energy consumption and CO2 emissions in OECD countries: A comparative analysis. Energy Policy 2014, 66, 547–556. [Google Scholar] [CrossRef] [Green Version]
  30. Long, X.; Naminse, E.Y.; Du, J.; Zhuang, J. Nonrenewable energy, renewable energy, carbon dioxide emissions and economic growth in China from 1952 to 2012. Renew. Sustain. Energy Rev. 2015, 52, 680–688. [Google Scholar] [CrossRef]
  31. Bilgili, F.; Koçak, E.; Bulut, Ü. The dynamic impact of renewable energy consumption on CO2 emissions: A revisited Environmental Kuznets Curve approach. Renew. Sustain. Energy Rev. 2016, 54, 838–845. [Google Scholar] [CrossRef]
  32. Dogan, E.; Seker, F. The influence of real output, renewable and non-renewable energy, trade and financial development on carbon emissions in the top renewable energy countries. Renew. Sustain. Energy Rev. 2016, 60, 1074–1085. [Google Scholar] [CrossRef]
  33. Jaforullah, M.; King, A. Does the use of renewable energy sources mitigate CO2 emissions? A reassessment of the US evidence. Energy Econ. 2015, 49, 711–717. [Google Scholar] [CrossRef]
  34. Apergis, N.; Payne, J.E.; Menyah, K.; Wolde-Rufael, Y. On the causal dynamics between emissions, nuclear energy, renewable energy and economic growth. Ecol. Econ. 2010, 69, 2255–2260. [Google Scholar] [CrossRef]
  35. Adedoyin, F.F.; Gumede, M.I.; Bekun, F.V.; Etokakpan, M.U.; Balsalobre-Lorente, D. Modelling coal rent, economic growth and CO2 emissions: Does regulatory quality matter in BRICS economies? Sci. Total Environ. 2019, 710, 136284. [Google Scholar] [CrossRef]
  36. Baloch, M.A.; Wang, B. Analyzing the role of governance in CO2 emissions mitigation: The BRICS experience. Struct. Change Econ. Dyn. 2019, 51, 119–125. [Google Scholar]
  37. Sinha, A.; Gupta, M.; Shahbaz, M.; Sengupta, T. Impact of corruption in public sector on environmental quality: Implications for sustainability in BRICS and next 11 countries. J. Clean. Prod. 2019, 232, 1379–1393. [Google Scholar] [CrossRef] [Green Version]
  38. Wu, L.; Liu, S.; Liu, D.; Fang, Z.; Xu, H. Modelling and forecasting CO2 emissions in the BRICS (Brazil, Russia, India, China, and South Africa) countries using a novel multi-variable grey model. Energy 2015, 79, 489–495. [Google Scholar] [CrossRef]
  39. Mahalik, M.K.; Mallick, H.; Padhan, H.; Sahoo, B. Is skewed income distribution good for environmental quality? A comparative analysis among selected BRICS countries. Environ. Sci. Pollut. Res. 2018, 25, 1–25. [Google Scholar] [CrossRef]
  40. Khattak, S.I.; Ahmad, M.; Khan, Z.U.; Khan, A. Exploring the impact of innovation, renewable energy consumption, and income on CO2 emissions: new evidence from the BRICS economies. Environ. Sci. Pollut. Res. 2020, 1–16. [Google Scholar] [CrossRef]
  41. Liu, X.; Zhang, S.; Bae, J. The nexus of renewable energy-agriculture-environment in BRICS. Appl. Energy 2017, 204, 489–496. [Google Scholar] [CrossRef]
  42. Pao, H.T.; Tsai, C.M. Multivariate Granger causality between CO2 emissions, energy consumption, FDI (foreign direct investment) and GDP (gross domestic product): Evidence from a panel of BRIC (Brazil, Russian Federation, India, and China) countries. Energy 2011, 36, 685–693. [Google Scholar] [CrossRef]
  43. Haseeb, M.; Hassan, S.; Azam, M. Rural–urban transformation, energy consumption, economic growth, and CO2 emissions using STRIPAT model for BRICS countries. Environ. Prog. Sust. Energy 2017, 36, 523–531. [Google Scholar] [CrossRef]
  44. Dai, S.; Zhang, M.; Huang, W. Decomposing the decoupling of CO2 emission from economic growth in BRICS countries. Nat. Hazards 2016, 84, 1055–1073. [Google Scholar] [CrossRef]
  45. Balsalobre-Lorente, D.; Driha, O.M.; Bekun, F.V.; Osundina, O.A. Do agricultural activities induce carbon emissions? The BRICS experience. Environ. Sci. Pollut. Res. 2019, 26, 25218–25234. [Google Scholar] [CrossRef] [PubMed]
  46. Adewuyi, A.O.; Awodumi, O.B. Biomass energy consumption, economic growth and carbon emissions: Fresh evidence from West Africa using a simultaneous equation model. Energy 2017, 119, 453–471. [Google Scholar] [CrossRef]
  47. Asafu-Adjaye, J. The relationship between energy consumption, energy prices and economic growth: Time series evidence from Asian developing countries. Energy Econ. 2000, 22, 615–625. [Google Scholar] [CrossRef] [Green Version]
  48. Reinhardt, G.A.; Von Falkenstein, E. Environmental assessment of biofuels for transport and the aspects of land use competition. Biomass Bioenergy 2011, 35, 2315–2322. [Google Scholar] [CrossRef]
  49. Tamazian, A.; Chousa, J.P.; Vadlamannati, K.C. Does higher economic and financial development lead to environmental degradation: Evidence from BRIC countries. Energy Policy 2009, 37, 246–253. [Google Scholar] [CrossRef]
  50. Martínez-Zarzoso, I.; Maruotti, A. The impact of urbanization on CO2 emissions: Evidence from developing countries. Ecol. Econo. 2011, 70, 1344–1353. [Google Scholar] [CrossRef] [Green Version]
  51. International Energy Agency (IEA). World Energy Outlook 2008; IEA: Paris, France, 2008. [Google Scholar]
  52. Zellner, A.; Theil, H. Three-stage least squares: Simultaneous estimation of simultaneous equations. Econometrica 1962, 30, 54–78. [Google Scholar] [CrossRef]
  53. Pesaran, M. General diagnostic tests for cross section dependence in panels. J. Econ. 2004, 69, 393–414. [Google Scholar]
  54. Levin, A.; Lin, C.F.; Chu, C.S.J. Unit root tests in panel data: Asymptotic and finite sample properties. J. Econ. 2002, 108, 1–24. [Google Scholar] [CrossRef]
  55. Im, K.S.; Pesaran, M.H.; Shin, Y. Testing for unit roots in heterogeneous panels. J. Econ. 2003, 115, 53–74. [Google Scholar] [CrossRef]
  56. Choi, I. Unit root tests for panel data. J. Int. Money Financ. 2001, 20, 249–272. [Google Scholar] [CrossRef]
  57. Fang, Y. Economic welfare impacts from renewable energy consumption: The China experience. Renew. Sustain. Energy Rev. 2011, 15, 5120–5128. [Google Scholar] [CrossRef]
Figure 1. Per capita gross domestic product (GDP) trends of the BRICS countries from 1960 to 2018. (Source: World Bank. BRA stands for Brazil, CHN stands for China, IND stands for India, ZAF stands for South Africa.)
Energies 13 00960 g001
Figure 2. Per capita CO2 trends of the BRICS countries from 1960 to 2014. (Source: World Bank. BRA stands for Brazil, CHN stands for China, IND stands for India, ZAF stands for South Africa.)
Energies 13 00960 g002
Figure 3. Per capita renewable energy consumption trends of the BRICS countries from 1990 to 2014. (Source: World Bank. BRA stands for Brazil, CHN stands for China, IND stands for India, ZAF stands for South Africa.)
Energies 13 00960 g003
Table 1. CO2 emissions of the BRICS countries in 2014.
RegionAnnual CO2 Emissions (kt)% of World EmissionsRank in the World
Brazil529,808.161.4713
China10,291,926.8828.481
India2,238,377.146.193
South Africa489,771.851.3614
World36,138,285100
Source: World Bank.
Table 2. Summary of the relevant literature of BRICS.
AuthorsPeriodMethod/ModelResults
Wang and Zhang [10]1996–2014FMOLSR&D→CO2
Wang et al. [18]1985–2014PGCURB→CO2
Adedoyin et al. [35]1990–2014ARDLCR→CO2
Baloch and Wang [36]1996–2017WPC, DKSEPR, PMG, and DOLSGovernance→CO2
Sinha et al. [37]1990–2017GMMCorruption→CO2
Dong et al. [9]1985–2016AMGNGC→CO2↓REC→CO2
Wu et al. [38]2004–2010NMVGMEG→CO2↓ in Brazil and Russia, EG→CO2↑ in China and South Africa
Mahalik et al. [39]1980–2013ARDL and VECMII→CO2↑ in Brazil, India and China, II→CO2↓ in South Africa
Khattak et al. [40]1980–2016CCEMG and AMGIC↔CO2↑ in Russia, India, China, and South AfricaREC↔CO2↓in Russia, India, and China
Liu, et al. [41]1992–2013VECMPO→CO2↓, PREC→CO2↓, PNREC→CO2↑, PAE→CO2
Pao and Tsai [42]1992–2007ECM, OLS and VECMFDI↔CO2
Haseeb et al. [43]1990–2014FMOLSURB→CO2↑ (except Russia); GDP→CO2↓ in Brazil, Russia, and South Africa, GDP→CO2↑ in India and China; EC→CO2↑ in Brazil, India, and China, EC→CO2↓ in Russia
Dai et al. [44]1995–2014LMDIEI→CO2
Balsalobre et al. [45]1990–2014DOLS and FMOLSAO→CO2↑, TO→CO2↑, ELC→CO2
Adewuyi et al. [46]1980–20103SLSBIO↔CO2, GDP↔CO2 in West Africa
Note: “↑”: positive effect, “↓”: negative effect, “↔”: bidirectional causality effect. Variables: Research and development (R&D), urbanization rate (URB), coal rents (CR), natural gas consumption (NGC), renewable energy consumption (REC), economic growth (EG), income inequality (II), innovation activities (IC), per capita output (PO), per capita renewable energy consumption (PREC), per capita nonrenewable energy consumption (PNREC), per capita agriculture exert (PAE), foreign direct investment (FDI), energy consumption (EC), per capita gross domestic product (GDP), energy intensity (EI), agriculture output (AO), trade openness (TO), biomass consumption per capita (BIO), electricity consumption (ELC). Methods: Fully modified OLS (FMOLS), Panel Granger causality (PGC), additional autoregressive distributed lag (ARDL), Westerlund panel cointegration (WPC), Driscoll-Kraay standard error panel regression (DKSEPR), pooled mean group (PMG), dynamic ordinary least square (DOLS), generalized method of moments (GMM), augmented mean group (AMG), novel multi-variable grey model (NMVGM), vector error correction model (VECM), Common correlated effect mean group (CCEMG), error-correction model (ECM), ordinary least squares (OLS), log mean Divisia index (LMDI), three-stage least squares (3SLS).
Table 3. Variable description and data sources.
VariableDefinitionSource
CO2Carbon dioxide emissions (metric tons per capita)World Development Indicators
RECRenewable energy consumption (% of total final energy consumption)World Development Indicators
FDDomestic credit to the private sector (% of GDP)World Development Indicators
HSchool enrollment, primary (% gross)World Development Indicators
KGross fixed capital formation (% of GDP)World Development Indicators
PGDPGDP per capita (constant 2010 US$)World Development Indicators
URBUrban population (% of the total population)World Development Indicators
OPENNESSTrade (% of GDP)World Development Indicators
Notes: All of the data are annual over the period 1999–2014. Data source: World Development Indicators (https://data.worldbank.org).
Table 4. Results of descriptive statistics and correlation matrix.
VariableLNCO2LNRECLNFDLNHLNKLNPGDPLNURBLNOPENNESS
Mean1.1603.3274.2774.7113.2368.2873.9253.7185
Median0.9683.5104.4084.6743.1748.6764.0133.840
Maximum2.3013.9475.0765.1103.8229.3924.4484.289
Minimum−0.0422.4603.2364.5282.7186.6973.3123.044
Std. Dev.0.8090.5180.62090.1320.3560.8820.3910.362
Skewness0.087−0.242−0.2381.2450.215−0.487−0.158−0.407
Kurtosis1.5041.3851.4563.8511.5751.7401.6561.691
Jarque-Bera6.053 **7.577 **6.960 **18.456 ***5.909 *6.764 **5.080 *6.338 **
Correlation matrix
LNCO21
LNREC−0.9341
LNFD0.909−0.9091
LNH−0.3220.508−0.5081
LNK−0.106−0.2210.172−0.4761
LNPGDP0.530−0.2800.2580.510−0.5791
LNURB0.383−0.1190.0970.626−0.6350.9831
LNOPENNESS0.639−0.7460.746−0.6220.327−0.159−0.3101
Note: *** Statistical significance at the 1% level, ** statistical significance at the 5% level, and * statistical significance at the 10% level.
Table 5. Cross-section dependence test.
VariableBreusch-Pagan LMPesaran Scaled LMBias-Corrected Scaled LMPesaran CD
LNCO245.015 ***11.263 ***11.129 ***6.072 ***
LNREC37.518 ***9.098 ***8.965 ***2.083 **
LNPGDP91.315 ***24.628 ***24.495 ***9.554 ***
LNFD34.692 ***8.283 ***8.149 ***5.322 ***
LNH36.331 ***8.756 ***8.622 ***−1.274
LNK42.545 ***10.550 ***10.416 ***6.404 ***
LNOPENNESS21.467 ***4.465 ***4.332 ***4.039 ***
LNURB95.525 ***25.844 ***25.710 ***9.774 ***
Note: The null hypothesis is no cross-section dependence (correlation). **, *** represent 5%, and 10% significant levels respectively.
Table 6. Unit root tests results (panel).
VariableLevin, Lin and Chu t *Lm, Pesaran, and Shin W-StatADF-Fisher Chi-SquarePP-Fisher Chi-SquareDecision
LevelFirst DifferenceLevelFirst DifferenceLevelFirst DifferenceLevelFirst Difference
LN CO2−1.315 *−5.261 ***1.941−3.548 ***5.78026.662 ***2.54925.337 ***I(1)
LNREC−0.836−2.877 ***0.661−1.927 **4.67516.083 **2.98715.600 **I(1)
LNPGDP−1.158−3.440 ***1.798−2.433 ***3.68919.955 **2.72329.999 ***I(1)
LNFD−2.222 **−4.706 ***−0.130−2.187 **6.70519.280 **7.00135.075 ***I(1)
LNH−1.160−5.103 ***0.101−4.089 ***7.61330.081 ***6.10526.536 ***I(1)
LNK−1.609 *−4.529 ***0.160−3.040 ***5.05222.695 ***8.15322.025 ***I(1)
LNOPENNESS−2.131 **−7.230 ***−1.248−4.143 ***11.83830.165 ***13.815 *39.459 ***I(1)
LNURB−38.368 ***−4.301 ***−30.394 ***−10.735 ***46.387 ***31.148 ***20.269 ***44.984 ***I(0)
Note: *, **, *** represent 1%, 5% and 10% significant levels respectively.
Table 7. Estimation results of the renewable energy and CO2 emissions on GDP (3SLS).
Dependent Variable: GDP per Capita (PGDP)
VariablePanelBRACHNINDZAF
(Intercept)−15.405 ***5.060 ***−5.8435.694 **19.274 ***
LNREC2.194 ***0.990 ***1.979 ***−0.829 **−0.990 ***
LNK0.0700.252 **−0.364−0.0920.366 **
LNH2.919 ***−0.183 **1.0141.016 **−1.860 **
LNCO22.077 ***0.793 ***3.128 ***0.388−0.023
Adjusted R-Squared0.8030.9830.9770.9820.853
Note: **, *** represent 5%, and 10% significant levels respectively.
Table 8. Estimation results of GDP and CO2 emissions on renewable energy consumption (3SLS).
Dependent Variable: Renewable Energy Consumption (REC)
VariablePanelBRACHNINDZAF
(Intercept)3.604 ***−0.2763.621 **4.02413.998 ***
LNCO2−0.923 ***−0.837 ***−0.879 ***−0.402 ***−0.324
LNPGDP0.158 **0.984 ***−0.320−0.240−0.414
LNH−0.0060.080−0.1690.381 **−1.216 *
LNK−0.470 ***−0.200 *−0.554 **−0.0350.147
LNFD0.326 ***0.0370.365 **−0.0220.024
LNURB−0.092−0.9851.133 *−0.008−0.413
Adjusted R-Squared0.9940.9000.9980.9820.735
Note: *, **, *** represent 1%, 5% and 10% significant levels respectively.
Table 9. Estimation results of GDP and renewable energy consumption on CO2 emission (3SLS).
Dependent Variable: CO2 Emissions per Capita (CO2)
PanelBRACHNINDZAF
(Intercept)1.998 **−0.6820.7953.4372.377
LNREC−1.144 ***−1.148 ***−0.728 ***−1.240 ***−0.574
LNPGDP0.696 **1.033 ***0.1910.2611.199
LNURB−0.827−0.8210.336−0.075−2.026
LNOPENNESS0.119−0.0450.010−0.029−0.208
Adjusted R-Squared0.9520.9760.9970.9830.632
Note: **, *** represent 5% and 10% significant levels respectively.
Table 10. Summary of results of the relationship between real output, renewable energy consumption and CO2 emission.
CountryREC→PGDPPGDP→RECCO2→PGDPPGDP→CO2CO2→RECREC→CO2
Panel++++--
BRA++++--
CHN+×+×--
IND-×××--
ZAF-×××××
Note: + Signifies positive relationship exists; - signifies negative relationship exists. × signifies no relationship exists.

