Abstract
This paper investigates the use of Li-LSX-zeolite catalyst over three regeneration cycles in presence of non-treated and acid pre-treated Isochrysis sp. microalgae. The spent and regenerated catalysts were characterised by surface analysis, elemental analysis (EA), SEM-EDS, and XRD to correlate their properties with the bio-oil yield and quality. The acid pre-treatment removed alkali metals, reducing gas yield in favour of bio-oil, but, at the same time, led to catalyst deactivation by fouling. Differently, the non-treated microalgae resulted in a bio-oil enriched in C and H and depleted in O, compared to the pre-treated ones, denoting higher deoxygenation activity. After 3 pyrolysis/regeneration cycles, the analyses suggest that there are no major changes on catalyst using non-treated microalgae. Regeneration at 700 °C has been shown to be able to remove most of the coke without damaging the Li-LSX zeolite structure. In summary, Li-LSX zeolite was effective in maintaining deoxygenation activity over three cycles in the pyrolysis of non-treated Isochrysis microalgae, while the algae pre-treatment with sulphuric acid was detrimental on the catalyst activity.
1. Introduction
The use of biomass as renewable energy source can reduce the dependence on fossil fuels as well as reduce the impacts of global warming. Microalgae to biofuel represents a sustainable pathway due to the microalgae capacity to grow in marginal lands, using wastewater and CO2 as source of energy and nutrients [1,2]. Among microalgae, Isochrysis sp. has shown to be a promising contender as feedstock for a biorefinery setting, due to the possibility to convert it in several bio-products. Microalgae with very high lipid contents are suitable for producing biodiesel through transesterification processes, but Isochrysis microalgae, which is rich in carbohydrates and proteins, is more suitable for thermochemical conversion processes, such as pyrolysis [3].
Only few studies are available on Isochrysis sp. catalytic pyrolysis literature review. Wang et al. (2015) investigated the pyrolysis of defatted and not-treated Isochrysis sp. [4]. The defatted pyrolysis at 475 °C produced lower bio-oil yield (36.9 wt %) compared to the whole microalgae (41.3 wt %) and phenols (from 19.99% to 31.18%) enriched bio-oil [4]. Catalytic pyrolysis of Isochrysis sp. using seven ceria-based catalyst was investigated by Aysu et al. [5], who obtained a significant increase in the bio-oil yield in the presence of Ni-Ce/Al2O3 and Ni-Ce/ZrO2 (26 wt %) compared to the non-catalytic pyrolysis (15 wt %). In addition, the presence of catalyst increased the energy content and decreased oxygen and nitrogen content of the bio-oils. Moreover, the catalytic pyrolysis of Isocrysis microalgae in the presence of Li-LSX-zeolite under different operating conditions was studied [6]. This work showed that Li-LSX-zeolite promoted aromatisation, deoxygenation and denitrogenation of the bio-oil. Compared to the commonly used ZSM-5, Li-LSX zeolite gives rise to a higher bio-oil denitrification, principally as NH3, but also HCN in the gas phase [7,8,9]. However, the high-level of macro-minerals (Na, K, Ca) in Isochrysis sp. ash affect the mechanism of pyrolysis and decreases the pyrolysis oil yield [10,11]. Ash content also affects the pyrolysis process design and operations (causing fouling, slagging and corrosion in the reactors), as well as the product purification process. As a result, the removal of inorganics from microalgae can benefit their intrinsic quality.
So far, only a limited number of works are available, in which the effect of chemical pre-treatment has been evaluated on the catalytic pyrolysis of microalgae. Bae et al. investigated the effect of treatment on bio-oil production by pyrolysis of macroalgae Undaria pinnatifida, which has high ash content (38 wt % on dry basis) [12]. Treatment by acid washing (2 M HCl, mix on hot stirrer at 60 °C for 6 h) was able to remove most of ash content to 0.76 wt %. As a result, the bio-oil yield increased after acid treatment from 40 to 46 wt % at 500 °C. Ross et al. studied the pyrolysis behaviour of 2 M acid (HCl) treated seaweeds (6 h at 60 °C) [13]. Pre-treatment in acid removed over 90% of the Mg, K, Na and Ca and resulted in furfural reach bio-oil [13]. Choi et al. showed that acid sulphuric treatment of brown microalgae (Saccharina Japonica) was able to remove active inorganic minerals by reducing the ash content from 18.3 to 3.3 wt % [14].
Catalyst deactivation is also a big concern in industrial catalytic processes. Oxygen-containing chemical species such as aromatic and nitrogenated compounds in the pyrolysis oil tend to form coke formation during the upgrading process [15]. Fouling or coking is the main reason for zeolite deactivation in catalytic cracking [16]. Catalyst deactivation on zeolite occurs due to coke formation and strong adsorption of oxygenates compounds on the surface of catalyst support [17]. In order to improve catalyst lifetime and reduce operation cost on the catalyst, the regeneration or recycling of catalyst becomes essential. Zeolite catalyst can be recovered by oxidation regeneration at high temperature through coke combustion.
A lot of attention has been paid to the kinetic study of coke formation and catalyst regeneration in various processes [18,19]. Zhang et al. carried out a study on the fresh, spent and regenerated ZSM-5 catalyst during biomass catalytic pyrolysis [17]. The study was conducted on the pyrolysis of corn stover using Py-GC/MS at 500 °C. The catalysts in this study were indicated as FZ (fresh catalyst), SZ (spent catalyst) and RZ (regenerated catalyst). From the catalyst characterisation, FZ had the highest value of total acid sites and BET surface area compared to other catalysts. The results show that the catalyst produced vapour yield in the following order: (FZ > RZ > SZ). Besides, the highest coke yield was obtained by FZ followed by RZ and SZ.
Despite numerous studies investigated the cyclic stability of ZSM-5 catalyst for biomass pyrolysis indicating loss of catalytic activity (denoted by a decrease in aromatics and Poly Aromatic Hydrocarbons (PAH) formation) [17,18,19], to our knowledge, the cyclic stability and regeneration of Li-LSX zeolite and its behaviour in the presence of pre-treated microalgae has not been studied yet. Therefore, this work investigates the activity of Li-LSX-zeolite catalyst over three pyrolysis/regeneration cycles in the presence of non-treated and 1% H2SO4 acid treated Isochrysis sp. microalgae. This work contributes to the understanding of the deactivation process over Li-LSX zeolite and in defining strategies to reduce it.
2. Materials and Methods
2.1. Materials
Isochrysis 1800 microalgae were purchased from Varicon Aqua Solutions Ltd (Hallow, Worcester, UK). The received microalgae were dried at 60 °C in an oven for 1 week to remove about 90 wt % of the moisture and then milled for 1 min using a Fristch Pulverisette 2 to a particle size less than 177 µm. Li-LSX-zeolites was acquired (in pellets form) from Shanghai Hengye Chemical Industry Co. and then grounded using a pestle and mortar. Sulphuric acid (96% extra pure) was purchased from Fisher Scientific UK Ltd (Loughborough, UK). The pre-treatment of microalgae was performed by adding the dried microalgae (3 g) to 30 mL of 1% H2SO4 solution and stirring for 30 min (350 rpm) at 25 °C. After the treatment, the mixture was rinsed with deionized water to achieve a pH of 7 and centrifuged for 3 h to separate out the leached microalgae. Since the remaining wastewater after the separation of the leached microalgae still contained some algae in suspension, a micro-filtration stage (22 µm) was carried out. The residual solid was then oven dried at 60 °C to obtain constant weight.
2.2. Characterisation Techniques
XRF analyses were carried out to quantify the elemental composition of raw and acid treated microalgae using a Philips PW1480 XRF spectrometer and SemiQ semi-quantitative analysis software. Approximately, 5 mg of sample was placed between two layers of mylar film, mounted into a two-part holder system that is normally used for liquid samples. The X-ray scans identified and quantified the elements phosphorus, sulphur, chlorine, potassium and calcium in all the samples.
The elemental analysis, EA, (C, H, N, S) of the biomass samples and the solid/liquid products from pyrolysis reaction was determined using an Exeter CE-440 Elemental analyser. The oxygen (O) content was determined by difference (O = 100 − C + H + N + S).
The higher heating values (HHV) of the feedstocks and liquid/solid products were calculated based on the Equation (1), which is a correlation reported to be valid for solid and liquid fuels [20]:
GC-MS analysis was performed by a Shimadzu GCMS QP2010 SE equipped with a Restek RXI-5HT column [6]. The column (length: 30 m, inner diameter: 0.250; film: 0.25 µm) had temperature limits between 40 and 300 °C. The oven was programmed to hold at 40 °C for 10 min, ramp at 5 °C/min to 200 °C and hold for 10 min, ramp at 10 °C/min to 250 °C and hold for 10 min and ramp at 10 °C/min to 295 °C and hold for 10 min. Helium was used as the carrier gas with a constant flow rate of 1.7 mL/min and injector split ratio at 1:20 ratio. The end of the column was directly introduced into the ion source detector of VG Trio 1000 series. Typical mass spectrometer operating conditions were as follows: transfer line 270 °C, ion source 250 °C and electron energy of 70 eV. The chromatographic peaks were identified according to the NIST library to identify bio-oil components.
Proton NMR (1H NMR) was selected to give an overall picture of the bio-oil composition in terms of the proton distribution in the different chemical functionalities using a Bruker Avance III operating at 400 MHz. The instrument was equipped with 60 samples position autosampler, with a 5 mm dual 1H/12C pyro probe. For samples preparation, bio-oils were diluted in 99.9% of dichloromethane (CDCl3) (Merck, Germany) with ratio 1:1 by volume and poured into 5 mm NMR tubes. All the acquired NMR spectra were processed through Topspin version 2.1 software.
Gas analyses were carried out using a Cirrus MKS Mass Spectrometer controlled by Process Eye view software. Before starting the analysis, the capillary heater and system heater were switched on at least 1 day in advance to achieve stable conditions and remove any potential moisture from the capillary.
Total surface area (BET), external surface area, micropore volume and micropore area were all calculated using the software supplied with the Micrometrics Gemini VII 2390 V3.03 surface area/porosity analyser. Firstly, the catalyst was degassed for 12 h at 200 °C under N2 gas using a Micromeritics Flowprep 060. About 0.2 to 0.4 g of materials were weighed before and after degassing. Then, the catalysts underwent analysis using nitrogen as an adsorption gas. Sample evacuation was conducted at a rate of 760.9 mmHg/min and equilibrated for 5 min. The BET surface area was analysed on the adsorption isotherm using ten data points within the P/P0 range of 0.05 to 0.3.
XRD analyses were carried out using a Bruker D8 Advance powder diffractometer, operating with Ge-monochromated copper Kα1 radiation with a wavelength of 0.15406 nm and a LynxEye linear detector in reflectance mode. Prior to the analysis, the catalyst sample were ground using pestle and mortar and oven-dried at 110 °C overnight. Data were collected over the angular range 5° to 85° in two-theta under atmospheric pressure.
SEM/EDS analyses were carried out using Carl Zeiss Sigma HD VP Field Emission SEM and Oxford Aztec ED X-ray analysis and electron backscatter Diffraction (EBSD) system. The patterns were imaged and analysed using an Oxford instrument software to perform the compositional analysis on the catalyst.
2.3. Pyrolysis Apparatus and Procedure
A down-stream vertical configuration pyrolysis setup having a reactor-tube (1.27 cm inner diameter and 15 cm length) inserted in a high temperature tube furnace (GVA/GVC from Carbolite; max. heating rate: 100 °C/min, max. temperature: 1000 °C) was used. The N2 flow rate was set at 345 mL/min (8 sec gas residence time) and temperature to 500 °C. The temperature inside the furnace was measured by a K-type thermocouple. The condensation system was made of three 125 mL Dreschel bottles connected with high temperature resistant Viton tubing and placed in a salt-ice bath.
The sample inside the reactor was held by a sample holder (stainless steel tube), a SS316 wire mesh (with 0.45 mm wire diameter) and quartz wool. The reactor was set-up for ex-situ pyrolysis experiments, where the metal mesh and quartz wool were alternated between samples and catalyst to avoid mixing of the two materials and allowing only the released volatiles pushed by the nitrogen stream to flow across the catalyst bed. A catalyst to microalgae weight ratio of 1:1 g/g was used in the experiments. A schematic diagram of the vertical pyrolysis set-up used in this work is presented in Figure 1.
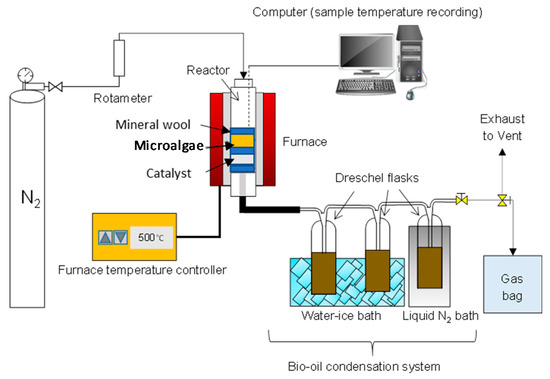
Figure 1.
Schematic diagram of the catalytic pyrolysis setup.
Before each experiment, the reactor was purged with nitrogen flow for 10 min in order to remove the remaining air impurities in the reactor. The reaction was run for 20 min to ensure maximum decomposition of all microalgae during pyrolysis.
The liquid product (bio-oil) was recovered from the Drechsel bottles by washing with 50 mL acetone. Then, the solvent was evaporated at room temperature for 20 h. The non-condensable gaseous were sampled in a 1 L gasbag and then analysed by mass spectrometry analysis. The bio-char left behind in the reactor was taken out, weighed and stored for further analysis.
The gas yield (wt %) was calculated by the difference from overall mass balance (Gas = 100 − (Bio-oil + Bio-char).
Pyrolysis experiments and products analyses (proximate and EA) were carried out by triplicates to measure the experimental error, which was assessed to be lower than 5%.
2.4. Catalysts Regeneration Procedure
The catalysts were regenerated to evaluate the activity and deactivation of the catalyst after a number of cycles. After the pyrolysis tests, the spent catalyst was recovered and a small fraction was submitted to SEM/EDS and XRD analyses; meanwhile the rest of the catalyst was calcined to remove the coke from the catalyst surface. The catalyst was heated up in the muffle furnace (Carbolite) at 500 °C for 1 h in the presence of air. Then, the catalyst was kept in the desiccator for the 2nd cycle of pyrolysis. The same method was applied to the 3rd cycle regeneration. Moreover, a set of calcinations at 700 and 950 °C were carried out to evaluate the maximum temperature for calcining the Li-LSX zeolite and their effect in removing coke. After calcination, the catalysts were sieved to remove the ash from coke combustion and characterised by SEM, XRD and EA.
3. Results
3.1. Microalgae Pre-Treatment
XRF analysis of the raw microalgae and of those treated with 1% H2SO4 are reported in Table 1. As can be seen, the XRF results indicate that 69.4% of P, 58.6% of Na and 38.8% of K were removed using 1 wt % H2SO4. XRF confirms that the acid pre-treatment is effective in removing Na, K and P, but at the same time other species increased in % (Ca, S), most likely due to the combination of leached species (Ca, Na, K) with S and the re-precipitation of sulphates. The effectiveness of the alkali and alkaline earth removal was somehow lower than those obtained in previous work [12,13,14] and this can be ascribed to the lower microalgae:acid ratio used in this work 1:5.5 compared to the ~1:1 previously used.

Table 1.
XRF analysis of microalgae after chemical pre-treatment.
3.2. Characterisation of Pyrolysis Products
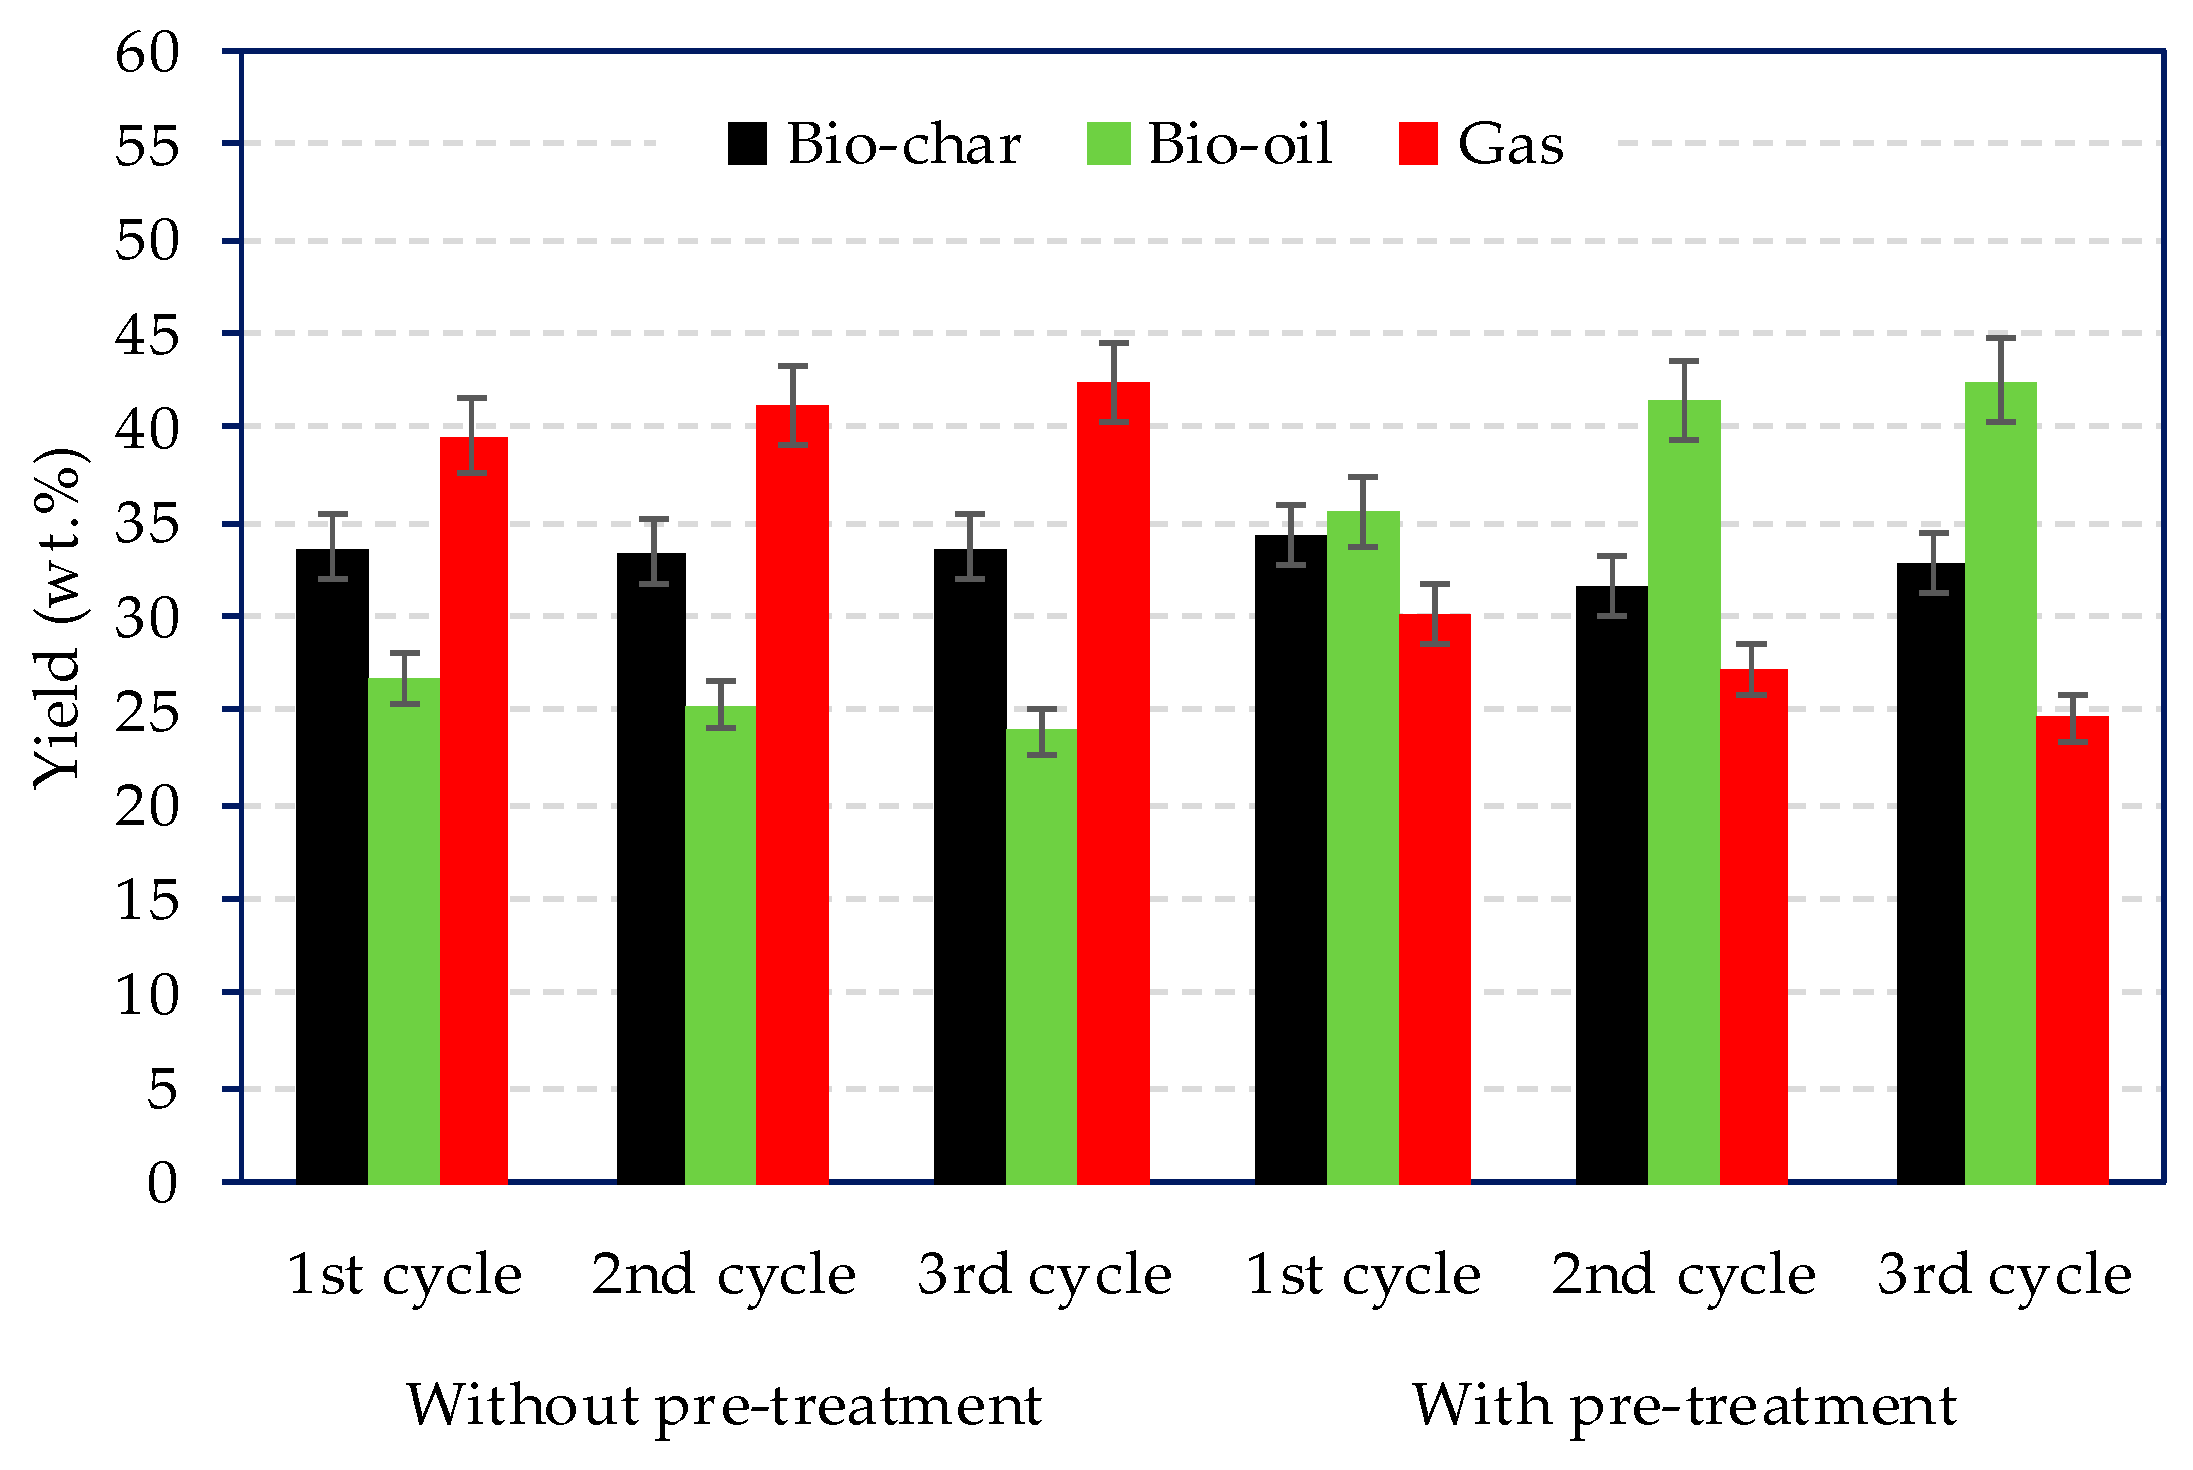
The product yields distribution for the three cycles for the treated and non-treated microalgae are summarised in Figure 2. On one hand, for the non-treated microalgae, the gas yield was the largest and slightly increased as the cycle number increased, passing from 39.6 wt % (1st cycle) to 42.4 wt % after the 3rd cycle. On the other hand, the pre-treated microlagae consistently reduced the gas yield and favoured the formation of liquid compounds.

Figure 2.
Products yield distribution with and without pre-treatment over three consecutive cycle catalyst regeneration.
Moreover, the bio-oil yield increased from 35.5 wt % (1st cycle) to 42.6 wt % (3rd cycle). This was associated to the removal of alkali metals that catalyse gasification reactions. Lopez et al. discussed on the pyrolysis yields from catalytic pyrolysis of plastic wastes using ZSM-5. Despite spent ZSM-5 catalyst reduced the bio-oil yields from 40 wt % (fresh catalyst) to 22 wt %. Due to coke formation, the regenerated catalyst was able to maintan the same oil yield as the fresh catalyst [21].
3.2.1. Elemental Analyses (EA) of Bio-Chars and Bio-Oils
An indication of the activity of the catalyst can be extrapolated from the EA and HHV data. Table 2 reports the elemental analyses and high heating value (HHV) of the bio-chars and bio-oils obtained from the pyrolysis. The EA of bio-chars indicate that the C content was higher when the pre-treated microalgae were used in the three cycles. Moreover, an increase of H and N resulted after three cycles for the non-treated microalgae. This is associated to the absence of alkali metals that promote gasification reactions.
Table 2.
Elemental analysis, H/C and O/C molar ratios and high heating value (HHV) of bio-chars and bio-oils obtained from treated and non-treated microalgae pyrolysis.
The HHV of the bio-chars obtained using the pre-treated microalgae were relatively high, ranging from 27.5 to 27.8 MJ/kg. Remarkable differences were visible from the EA of the bio-oils, as shown in Table 2. The non-treated microalgae resulted in a lower O content, suggesting better deoxygenation activity for the Li-LSX zeolite in that case. Moreover, the bio-oils from the pyrolysis of the non-treated microalgae contained high C and H contents, which were even higher after the 3rd cycle (76.0 wt % and 10.3 wt %, respectively). This demonstrates that the Li-LSX zeolite maintained a good deoxygenation activity after the three consecutive cycles. The nitrogen content of the bio-oils decreased according to the increase in all cases, indicating that the denitrogenation activity was partially inhibited.
3.2.2. 1H-NMR of Bio-Oils
Table 3 reports the integration of the 1H-NMR spectra of the treated and non-treated Isochrysis sp. bio-oils. The results suggest that there are clear differences in the overall chemical composition of the bio-oils. The most up-field region (0.0 to 1.6 ppm) represents aliphatic protons. This region was shown to be more populated for all the bio-oils obtained from the pre-treated microalgae. The aliphatic protons in the bio-oils from non-treated microalgae showed a decrease in intensity with the increase of the cycle number. Therefore, the pre-treatment led to a more aliphatic bio-oil. The integrated region from 1.6 to 2.2 ppm and 2.2 to 3.0 ppm represent protons on aliphatic carbon atoms bonded to C=C double bond (aromatic or olefinic) or C two bonds away from heteroatom. Percentage of these group increased after the 2nd and the 3rd cycle of regeneration for the non-treated microalgae, while remained constant for the pre-treated ones. The next integrated region of the spectra (3–4.2 ppm) represents protons on carbon atoms next to aliphatic alcohol/ether/ester, or methylene group joining two aromatic rings. The highest percentage of protons was observed after the 3rd cycle, in both cases. The region between 4.2 to 6.4 ppm represents oxygenated compounds such as carbohydrates, phenolic OH or olefinic protons. In this region, lowest proton percentage was observed for the bio-oil from the non-treated microalgae, suggesting higher deoxygenation activity, which corroborate with the EA. Next regions between 6.4 and 6.8 and from 6.8 to 8.0 are assigned to aromatic protons. Clearly, the non-treated microalgae produced high aromatics compounds in the bio-oil compared to the pre-treated microalgae.
Table 3.
1H-NMR integrations of treated and non-treated Isochrysis pyrolysis bio-oils versus specific chemical shift ranges.
3.2.3. GC-MS Analyses
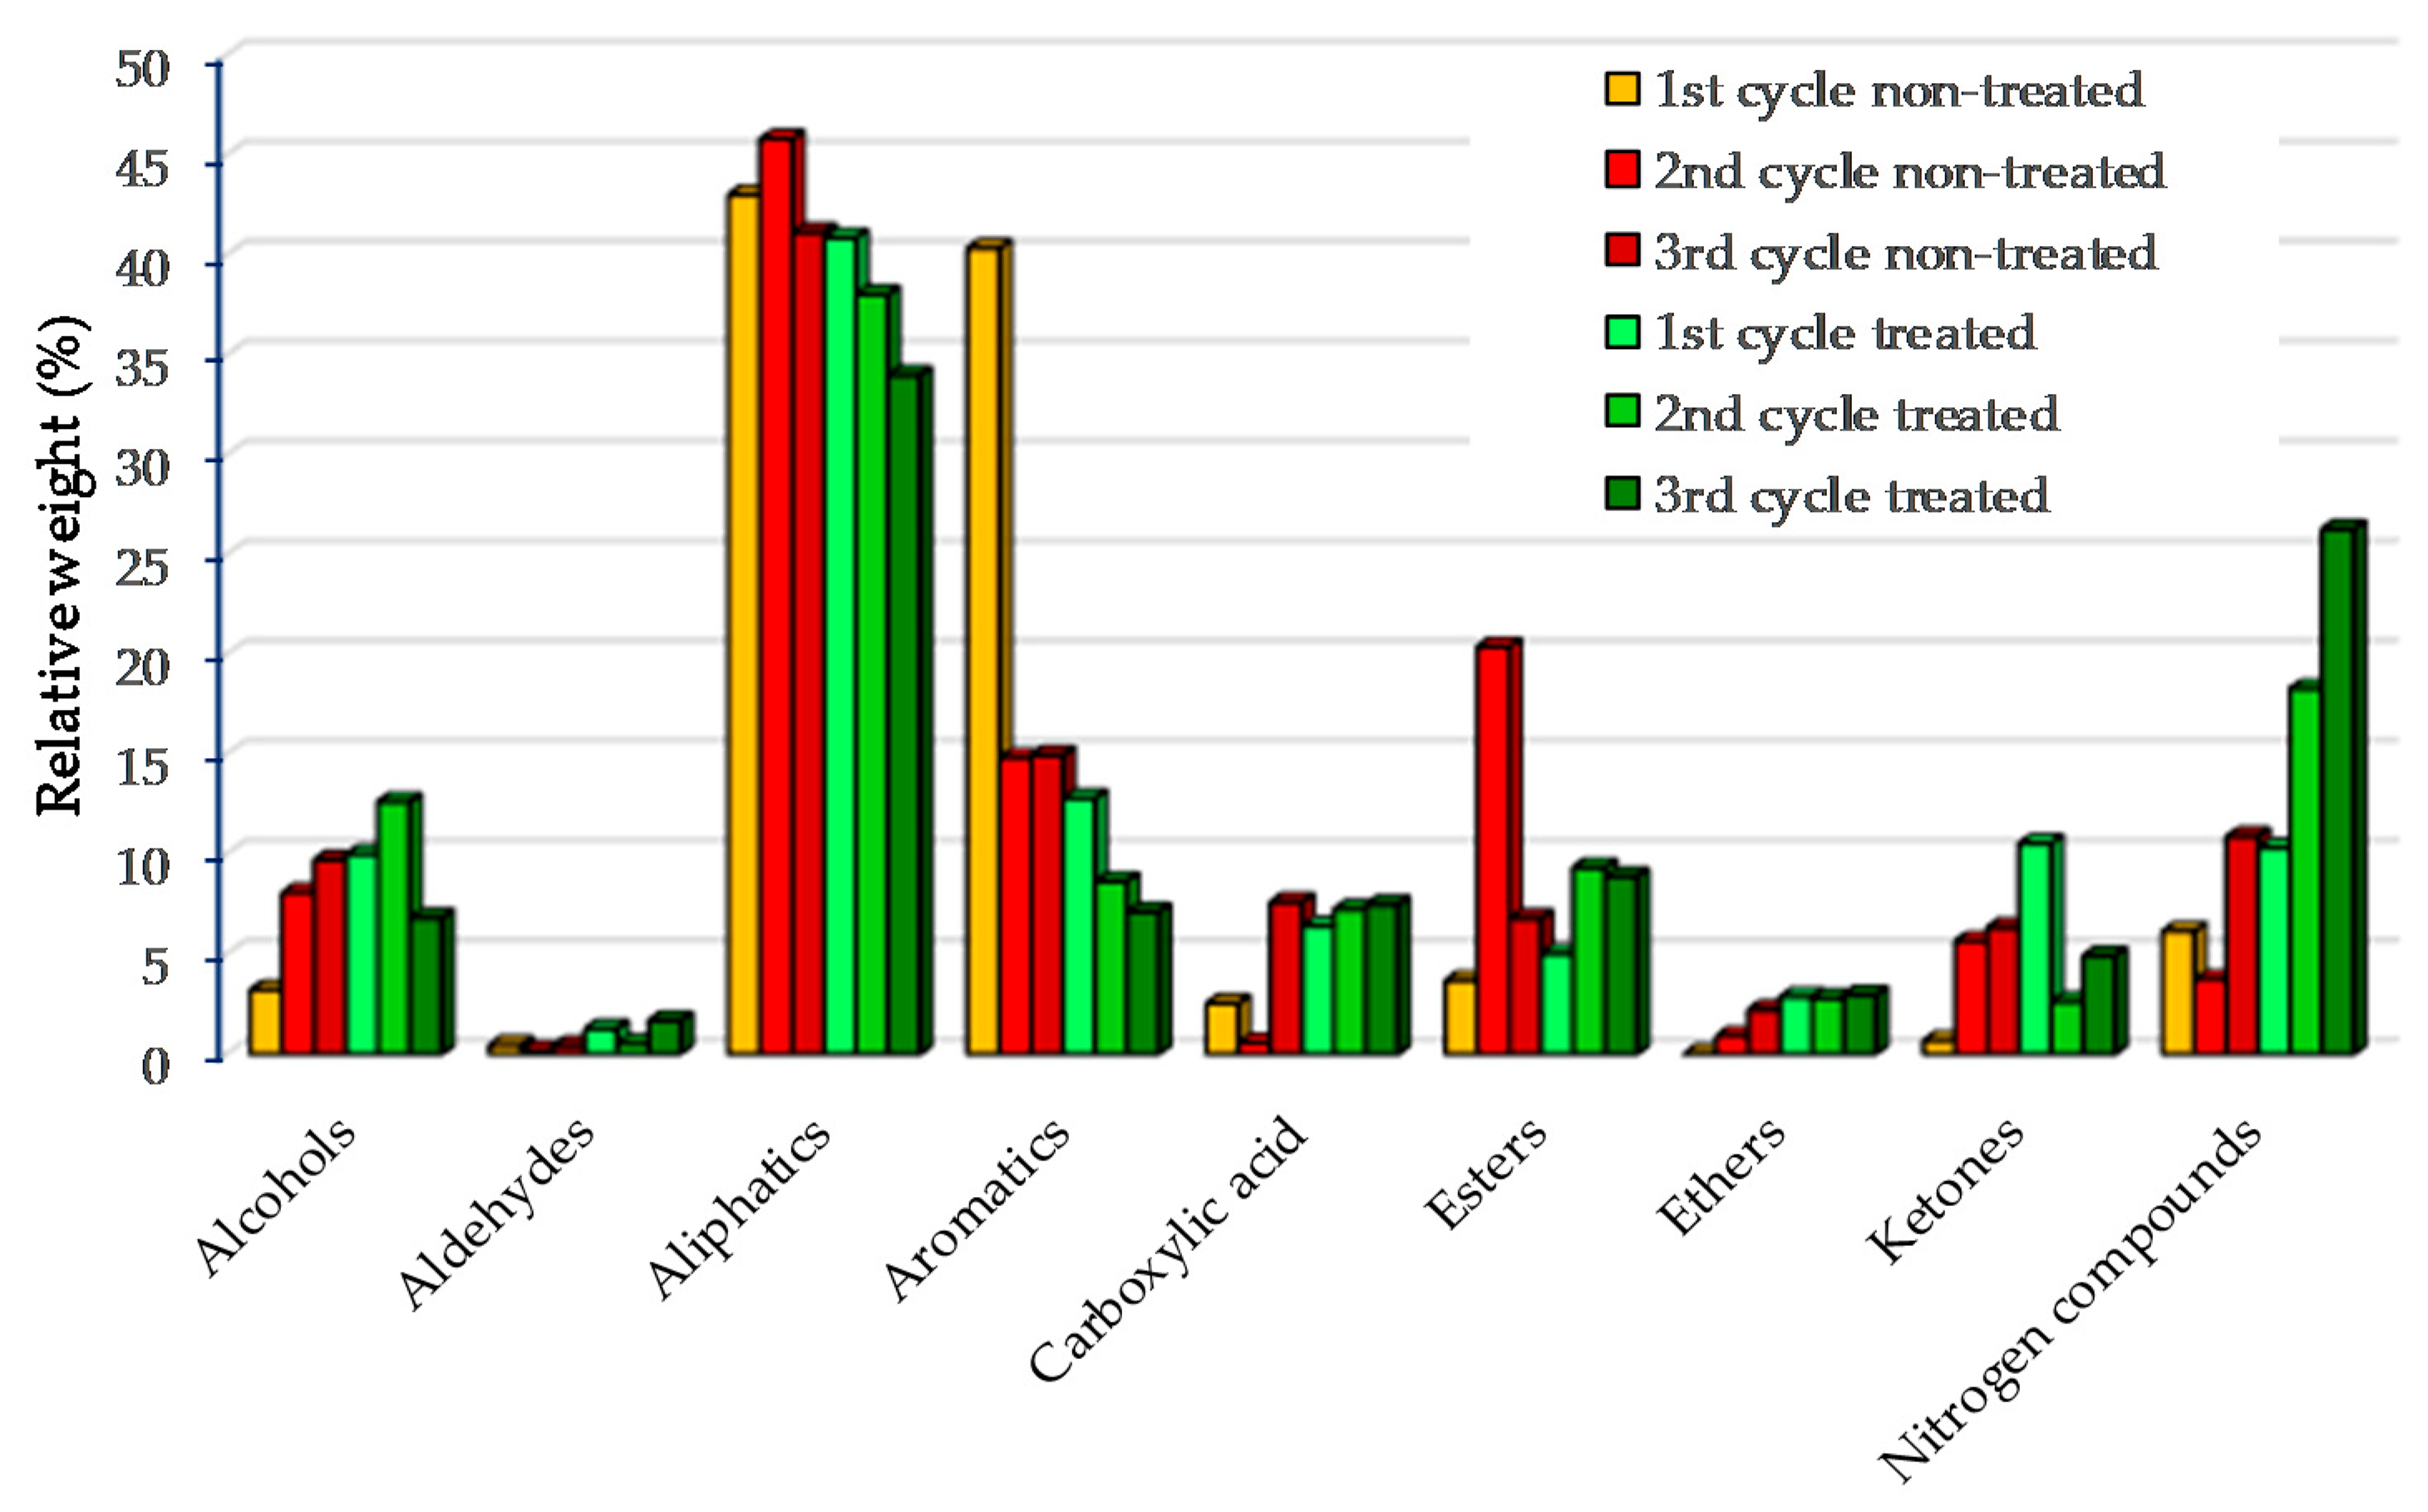
The compounds present in the bio-oils were identified by GC-MS and divided into nine groups: alcohols, aldehydes, aliphatic, aromatics, carboxylic acid, esters, ethers, ketones and nitrogen compounds, as illustrated in Figure 3. Most of the compounds present in bio-oils were aliphatic (as indicated by 1H-NMR), followed by aromatic groups. Three types of compounds were identified in the aliphatic group: n-alkanes, alkenes and branched hydrocarbons. Most of chain alkanes were distributed in the range from C9 to C22. Among the alkane, nonadecane, hexadecane, cyclo-hexadecane and docosane were the most abundant. Alkenes such as octadecene, heptadecene and hexadecene were also identified. Though alkenes were present in the bio-oils, n-alkanes were dominant. Aromatic hydrocarbons were also identified in the bio-oils for both the treated and non-treated microalgae, with the latest having the highest content in agreement to the 1H-NMR (see Section 3.2.2). Monoaromatics such as benzene and polyaromatics such as naphthalene were the most abundant in the bio-oils. Aromatics were reduced after the second and the 3rd cycles, possibly due to reduced catalyst surface. The nitrogen compounds in bio-oils such as indole, nitriles, pyridines and pyrimidines, which were derived from the degradation of microalgae proteins, consistently increased after the pyrolysis cycles in the presence of pre-treated microalgae, from 10.3% to 26.3%. The results confirmed the EA analyses, where N content increased after three cycles.

Figure 3.
GC-MS bio-oil based on groups for catalyst regeneration of treated and non-treated microalgae.
3.2.4. Gas Analyses
Gas analyses are shown in Table 4. For the non-treated microalgae, the gas yield was in the range 39.6–42.4 wt %, which was higher compared to the pre-treated microalgae, 24.7–30.2% (see Figure 2).
Table 4.
Gas product distributions with catalyst regeneration cycles.
This has to be ascribed to the removal of alkali metals in the latter case. Overall, the regenerated catalyst behaved differently in the non-treated and pre-treated microalgae cases. The nitrogenated compounds such as HCN and NH3 lessens for the pre-treated microalgae with the increase of the regeneration cycles confirming that the catalyst experienced reduced N removal activity. The deoxygenation pathways were dehyration, followed by decarbonylation and decarboxylation. Dehydration and decarbonylation deoxygenation pathways remained almost unchanged after three cycles, corroborating EA and NMR analyses, while decarboxylation decreased for the pre-treated microalgae. A similar trend can be observed from the work done by Williams and Horne using HZSM-5 catalyst [22].
3.2.5. Pyrolysis Mechanism
The effect of the zeolite structure on the spectrum of products formed during the microalgae pyrolysis is discussed here. Li-LSX zeolite contains a low Si/Al ratio (1.0), large surface area and pores size between 7 and 12 Å. The addition of a metal to large pores Faujalite zeolites was linked to enhanced hydrocracking and alkylation activity by providing a large surface area and interactions between Lewis and Bronsted acid sites [23]. Deoxygenation occurred mostly via dehydration and decarbonylation as shown by the gas analysis. In addition, carbon and hydrogen were lost during coke formation over the catalyst and in the production of gaseous hydrocarbons because of cracking of the bio-oil vapours. Algal fatty acids were thermally decomposed to long-chain ketones, aldehydes and esters, while carbohydrates decomposed to anhydrosugars, furans etc., which then diffused into the pores of the Li-LSX zeolite where they underwent cracking to generate light olefins. Finally, aromatic hydrocarbons were produced from the olefins pool in the zeolite’s pores through a series of reactions such as oligomerisation, cyclisation and aromatisation [24]. PAH were also formed due to the large size of the pores. GC-MS and proton-NMR analyses showed that pre-treated microalgae inhibited the conversion of alkanes into olefins and aromatics. Protein degradation instead proceeded through aldol condensation reaction forming free radicals resulting in pyridine and pyrroles. Deamination and rupturing of C–C bonds (radical formation) pathways resulted in NH3 and HCN in gas phase and aromatics in liquid phase [25].
3.3. Catalyst Characterisation
3.3.1. Surface Analyses
The impact of the pre-treatment of microalgae on the catalyst Li-LSX-zeolite after three cycles of regeneration is presented in Table 5. Initially, the BET surface area of the raw Li-LSX-zeolites was 662.1 m2/g. After the 1st cycle of pyrolysis of both the treated and non-treated microalgae, the BET surface area was reduced to 353.3 m2/g (non-treated microalgae) and 409.1 m2/g (pre-treated microalgae). The catalyst surface area was drastically reduced after the 2nd and the 3rd cycles, with the smallest surface area recorded after the 3rd cycle with the pre-treated microalgae, 121.5 m2/g.
Table 5.
The physicochemical properties of Li-LSX-zeolites before (raw) and after catalytic pyrolysis and regeneration cycles.
The same trend is shown by the micropore volume and surface. The raw catalyst had a micropore volume of 0.31 cm3/g. After the 3rd cycle, the micropore volume was reduced to less than half of the start value (0.10 cm3/g). Similarly, the catalyst from the pyrolysis of non-treated microalgae showed a gradual decrease of the pore volume to 0.05 cm3/g after the 3rd cycle. The reduction of BET surface area and micropore volume and surface was probably due to accumulation of carbon or inorganic deposits on the surface of the Li-LSX zeolite, which hinders the further diffusion of gas/vapour species in the catalysts micropores.
3.3.2. SEM-EDS Analysis of Spent Catalysts
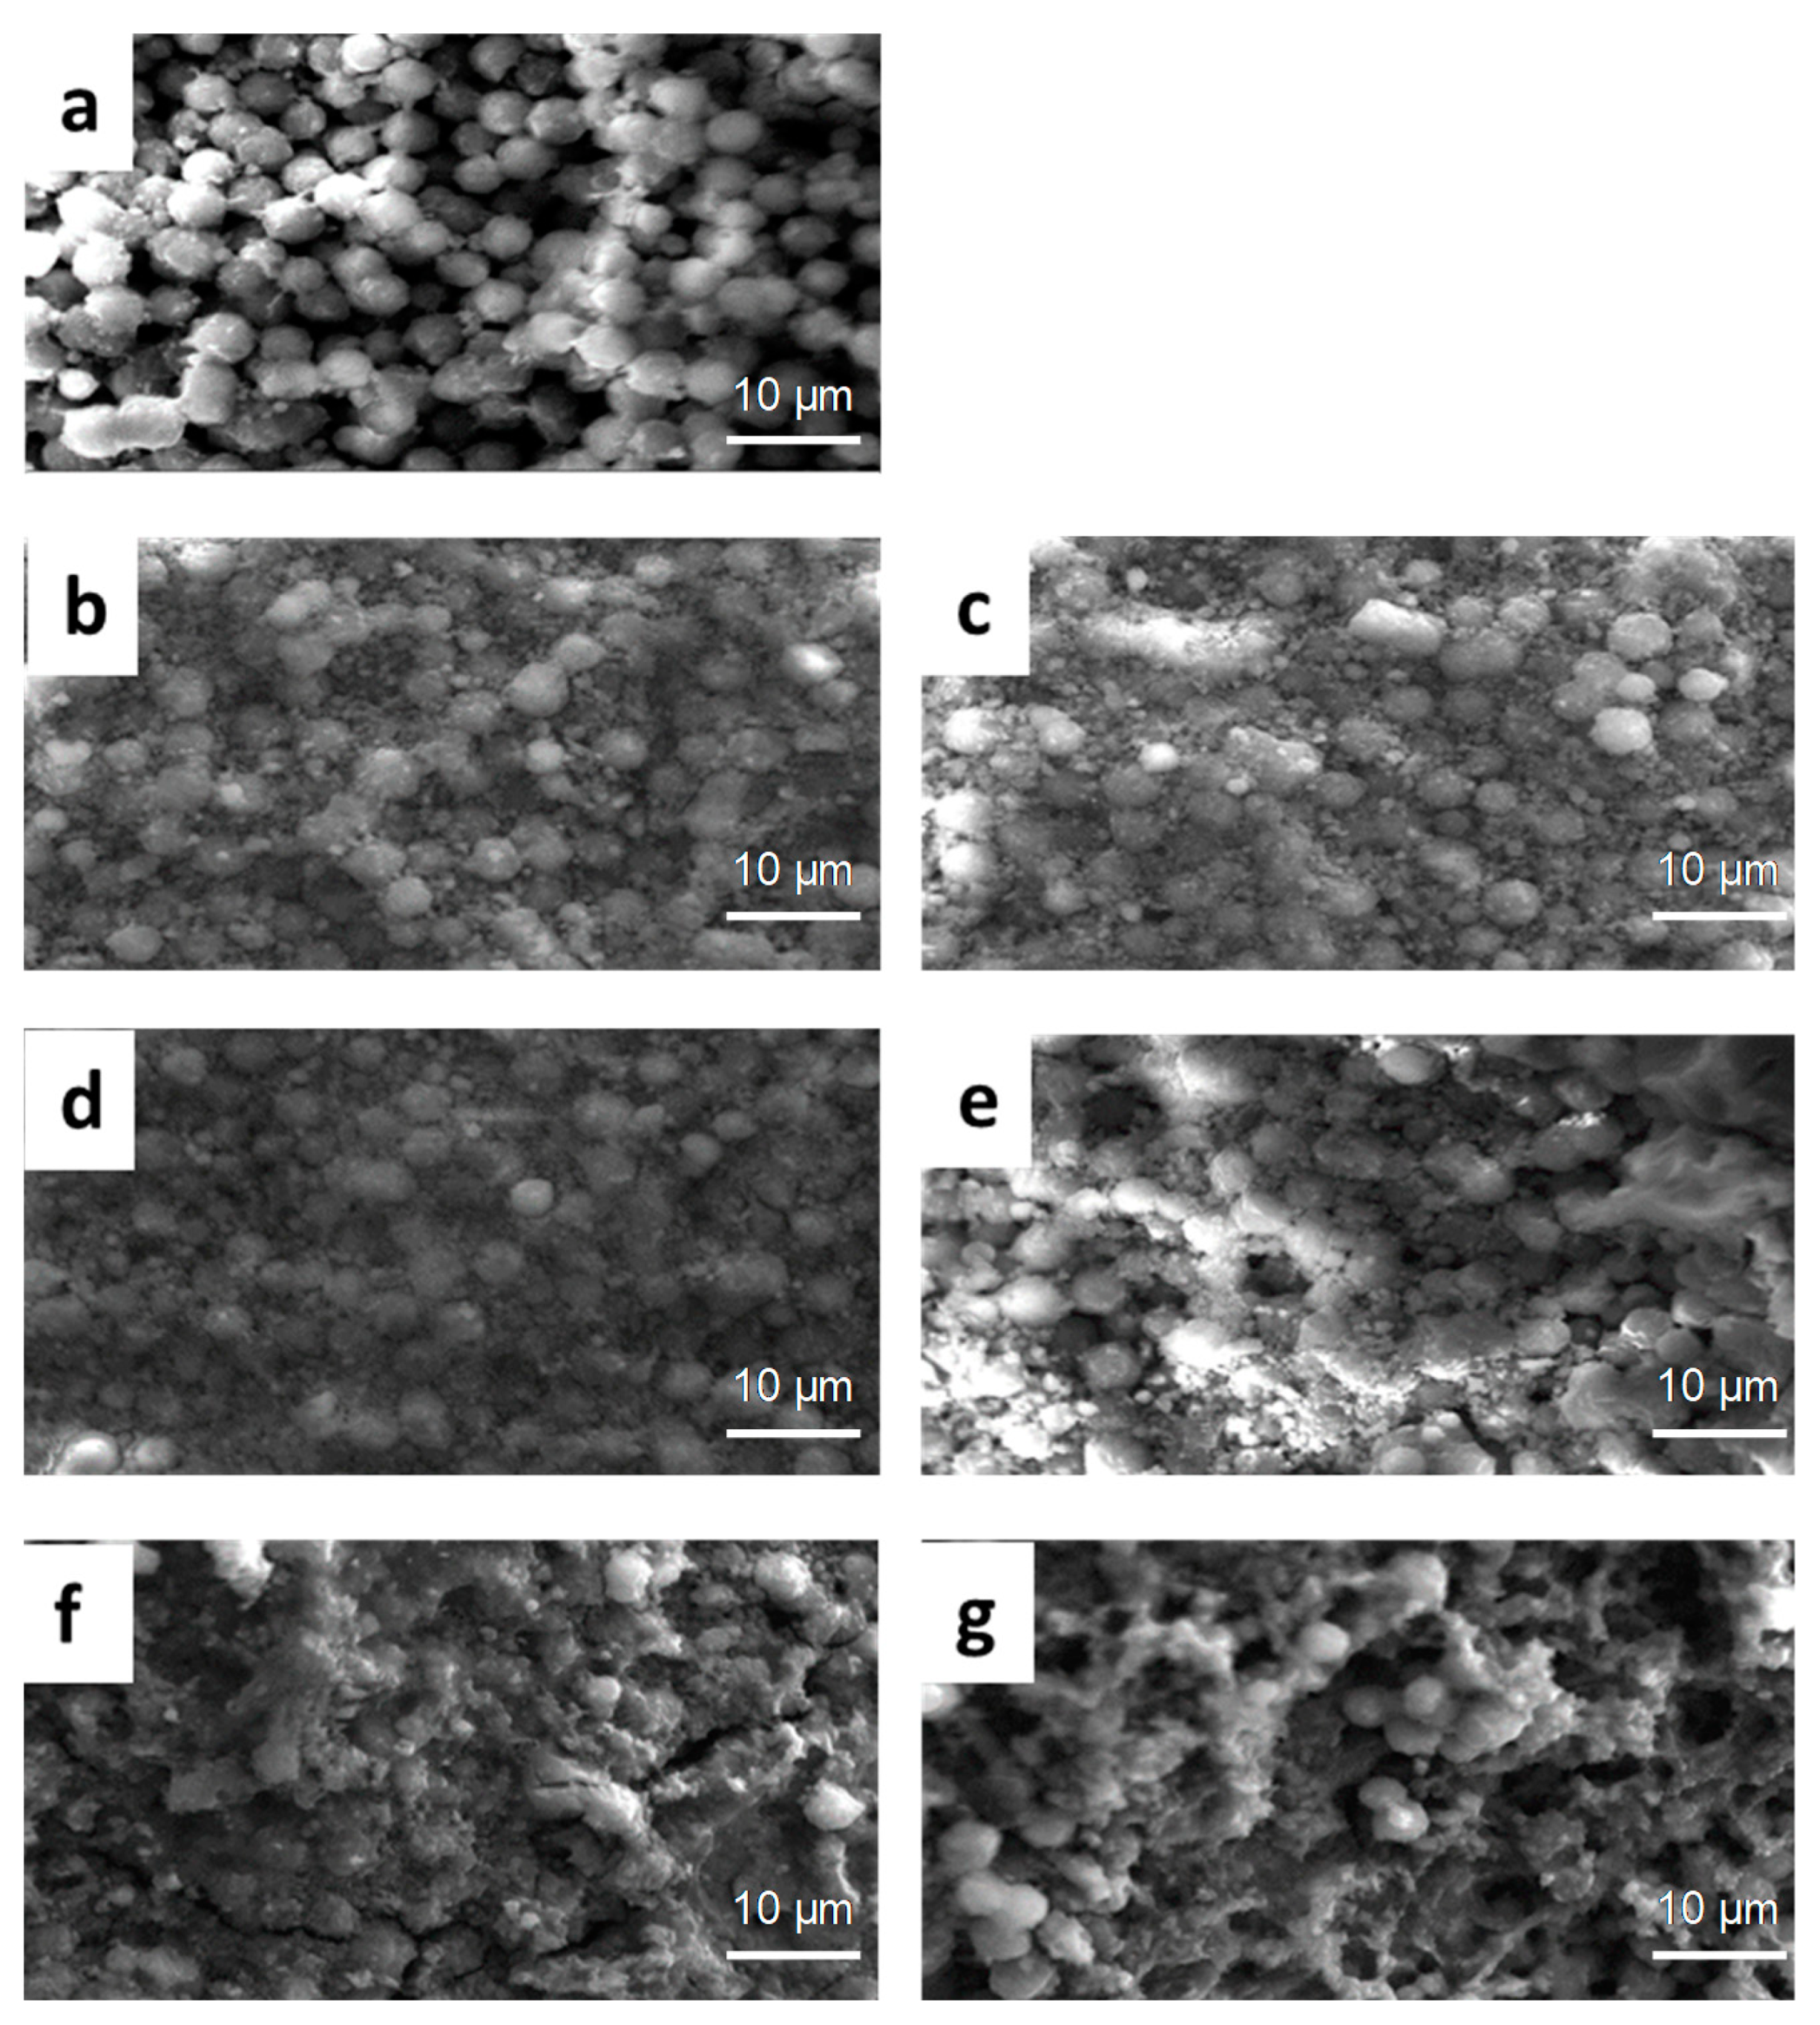
SEM patterns of the spent catalyst after the three pyrolysis cycles are shown in Figure 4. A fresh catalyst sample was shown for comparison with the used ones. The raw Li-LSX-zeolite (Figure 4a) presents a relatively clean surface, while the Li-LSX from pre-treated microalgae (Figure 4e–g) shows a spread coverage of the catalyst surface compared to the non-pre-treated ones (Figure 4b–d) after each of the three cycles.

Figure 4.
SEM micrograph of fresh (a) and spent catalysts after 1st, 2nd and 3rd pyrolysis experiments with (b–d) non pre-treated and (e–g) pre-treated microalgae.
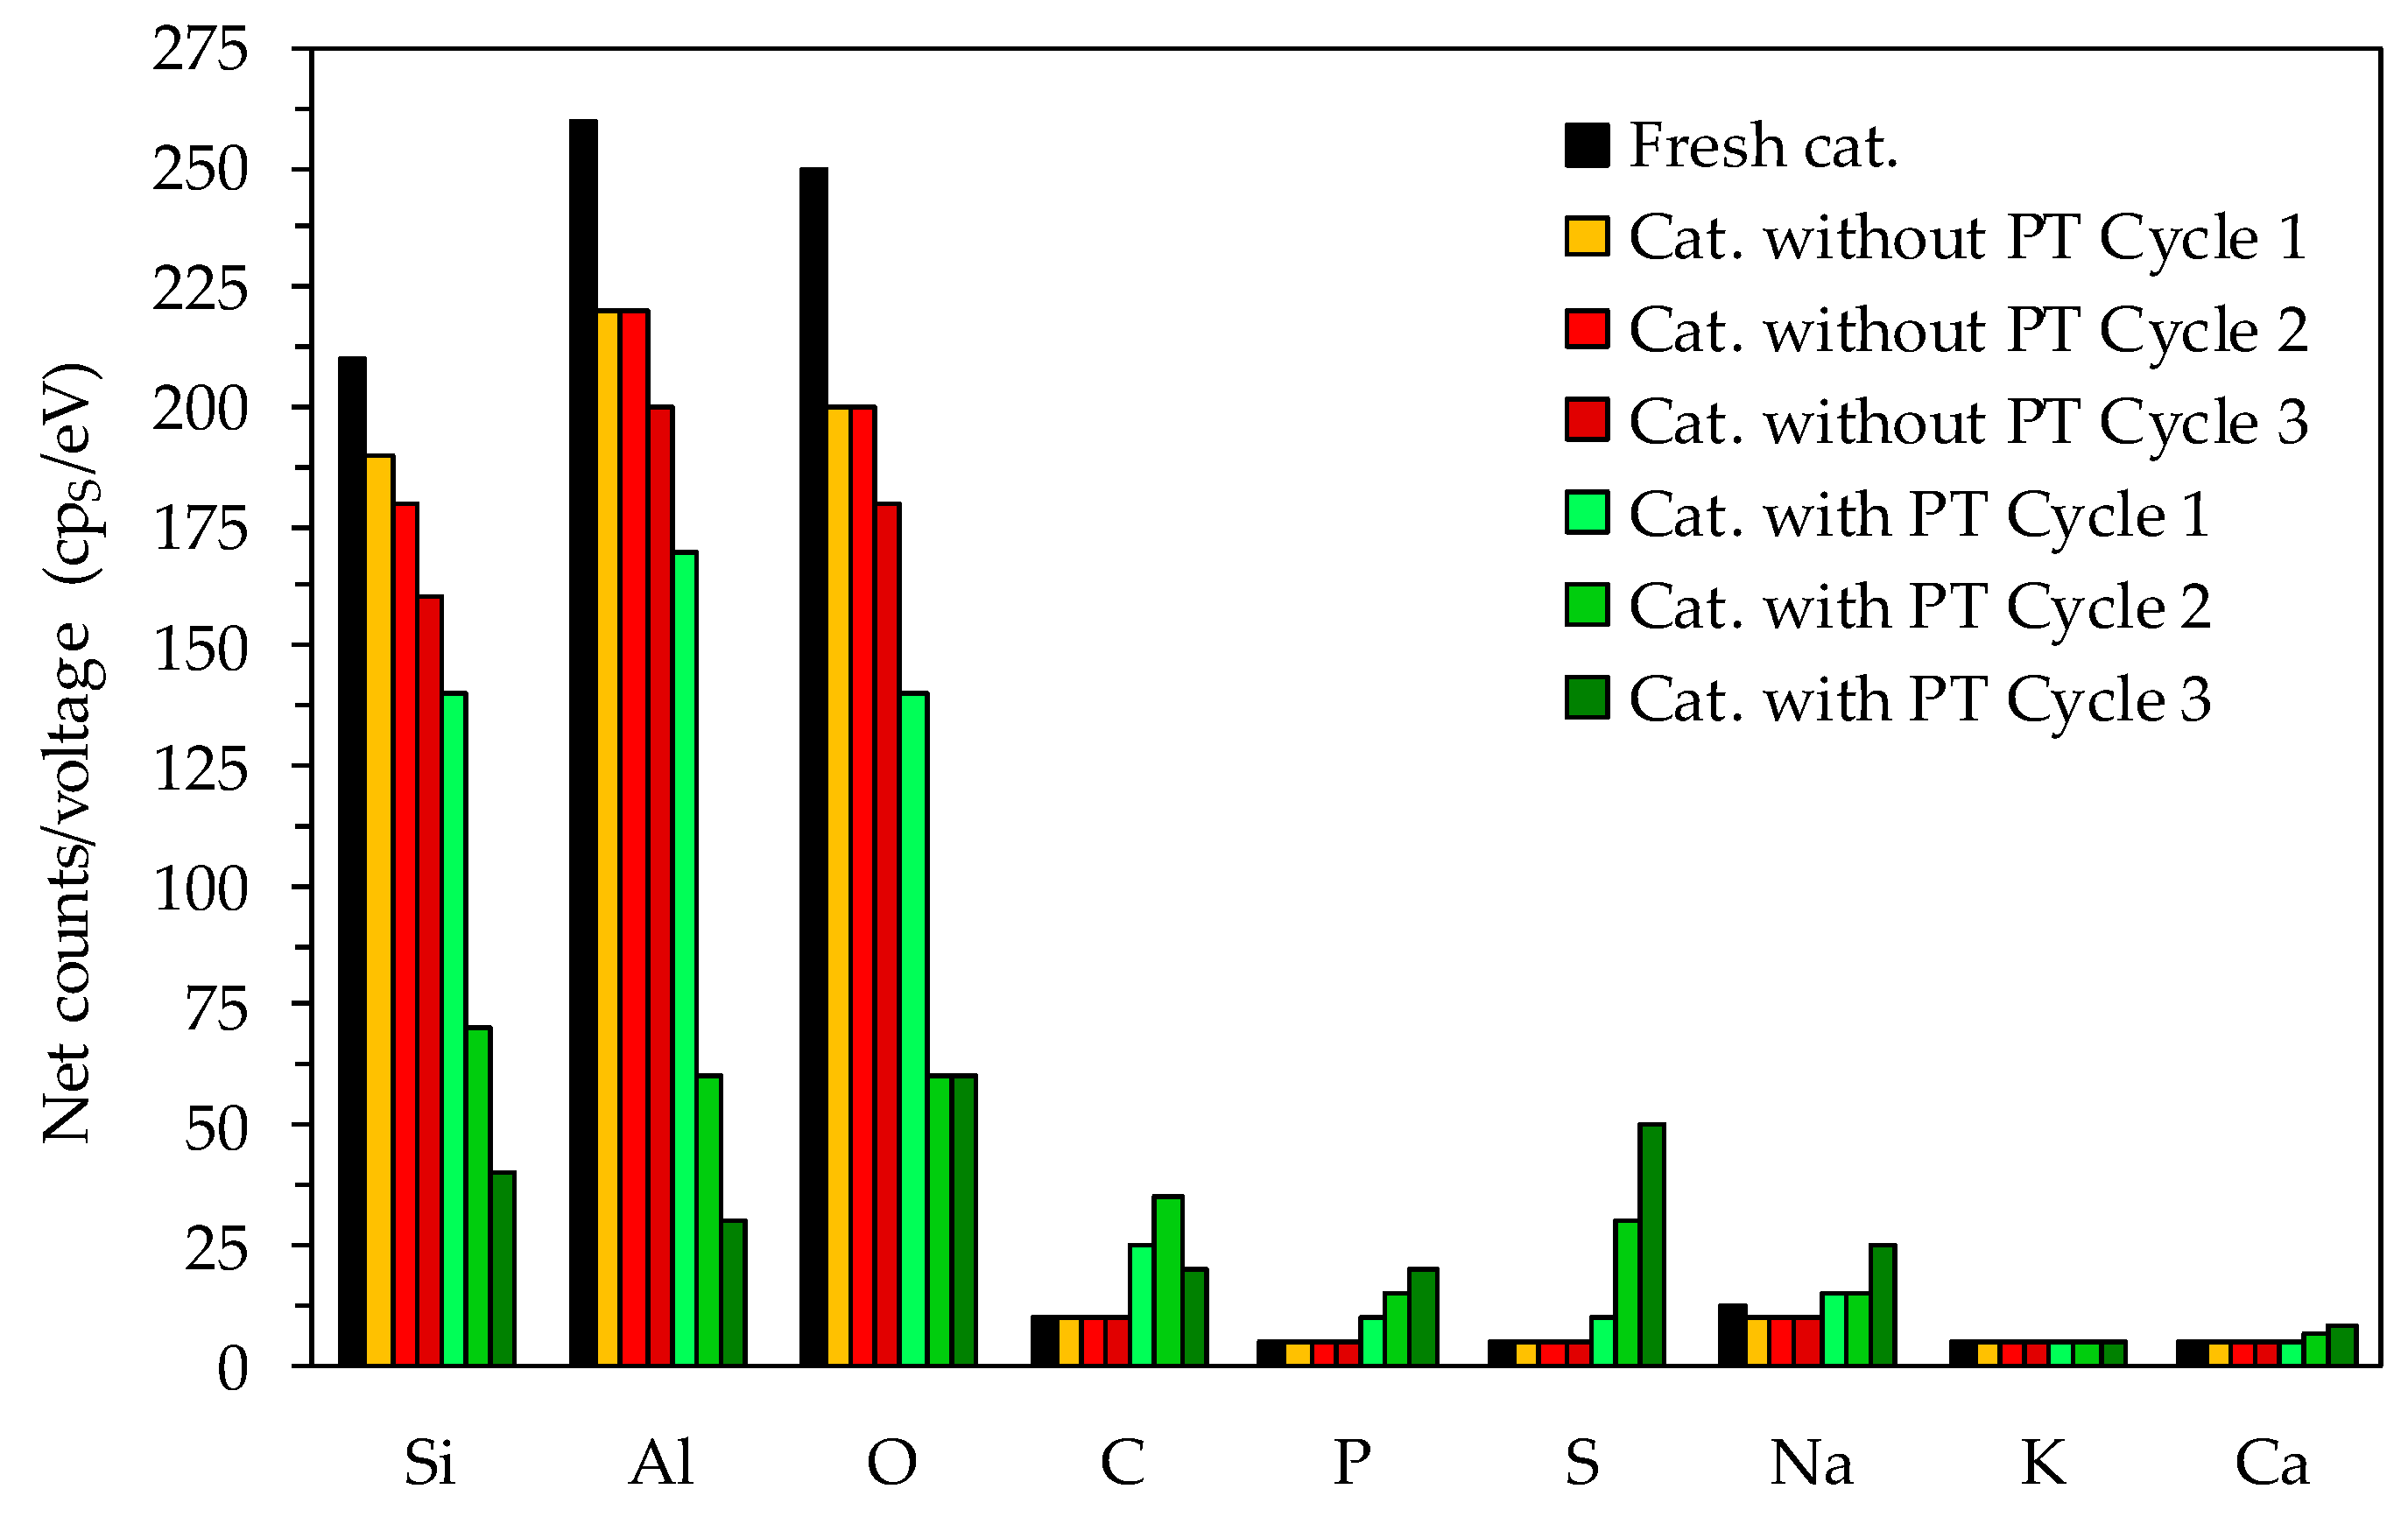
The elemental analysis of the material surface (Figure 5) was carried out to identify if the deposits on the catalyst surface were carbonaceous as assumed or of another nature. The fresh catalyst contained high Si and Al, as well as O compounds as expected for the Li-LSX-zeolite. Nevertheless, the Si, Al and O compounds were reduced after catalytic pyrolysis and steadily decreased after each cycle. Regarding the non-treated microalgae, the reuse of the regenerated Li-LSX-zeolite did not result in noticeable changes compared to the raw Li-LSX zeolite, in particular, in terms of Na, C, P and S content. Diversely, the EDS of the Li-LSX-zeolite when the pre-treated microalgae were used show remarkable changes compared to the raw catalyst. First, the EDS analyses indicate a much more dramatic decrease in Al, Si and O content in the catalyst surface and second, it further reveals that other elements such as Ca (in less extent), Na, C, P and S increased double fold or more compared to the fresh catalyst. Therefore, the presence of clusters of deposits on the catalyst surface (see Figure 5) can be referred to the formation of sulphate species (e.g., Ca/Na2SO4), phosphorus species and carbonaceous species (coke). Sulphur from the sulphuric acid reacted with the Na+ (removed from the microalgae during the acid leaching) forming Na2SO4, which precipitated and therefore was recovered together to the leached microalgae. Similarly, phosphorus species accumulated by the pre-treatment. These deposits were responsible for the lost surface blocking the access to the pores and therefore to the acid sites, with the consequent decrease of the aromatisation activity of the Li-LSX zeolite in presence of pre-treated microalgae.
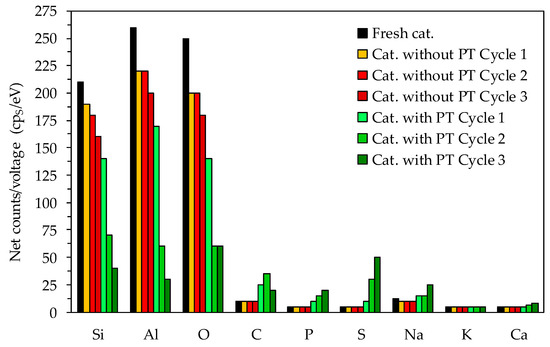
Figure 5.
EDS of the spent catalysts after the pyrolysis experiments.
3.3.3. Regeneration Temperature Study
Since regeneration at 500 °C was not able to remove coke form the catalyst surface, a set of calcination experiments were carried out at higher temperatures to establish the optimal calcination temperature for Li-LSX zeolite. Table 6 shows the C, H and N content on the catalyst surfaces after pyrolysis reactions on successive cycles.
Table 6.
Elemental analysis of regenerated catalyst (non-treated) at 500, 700 and 950 °C.
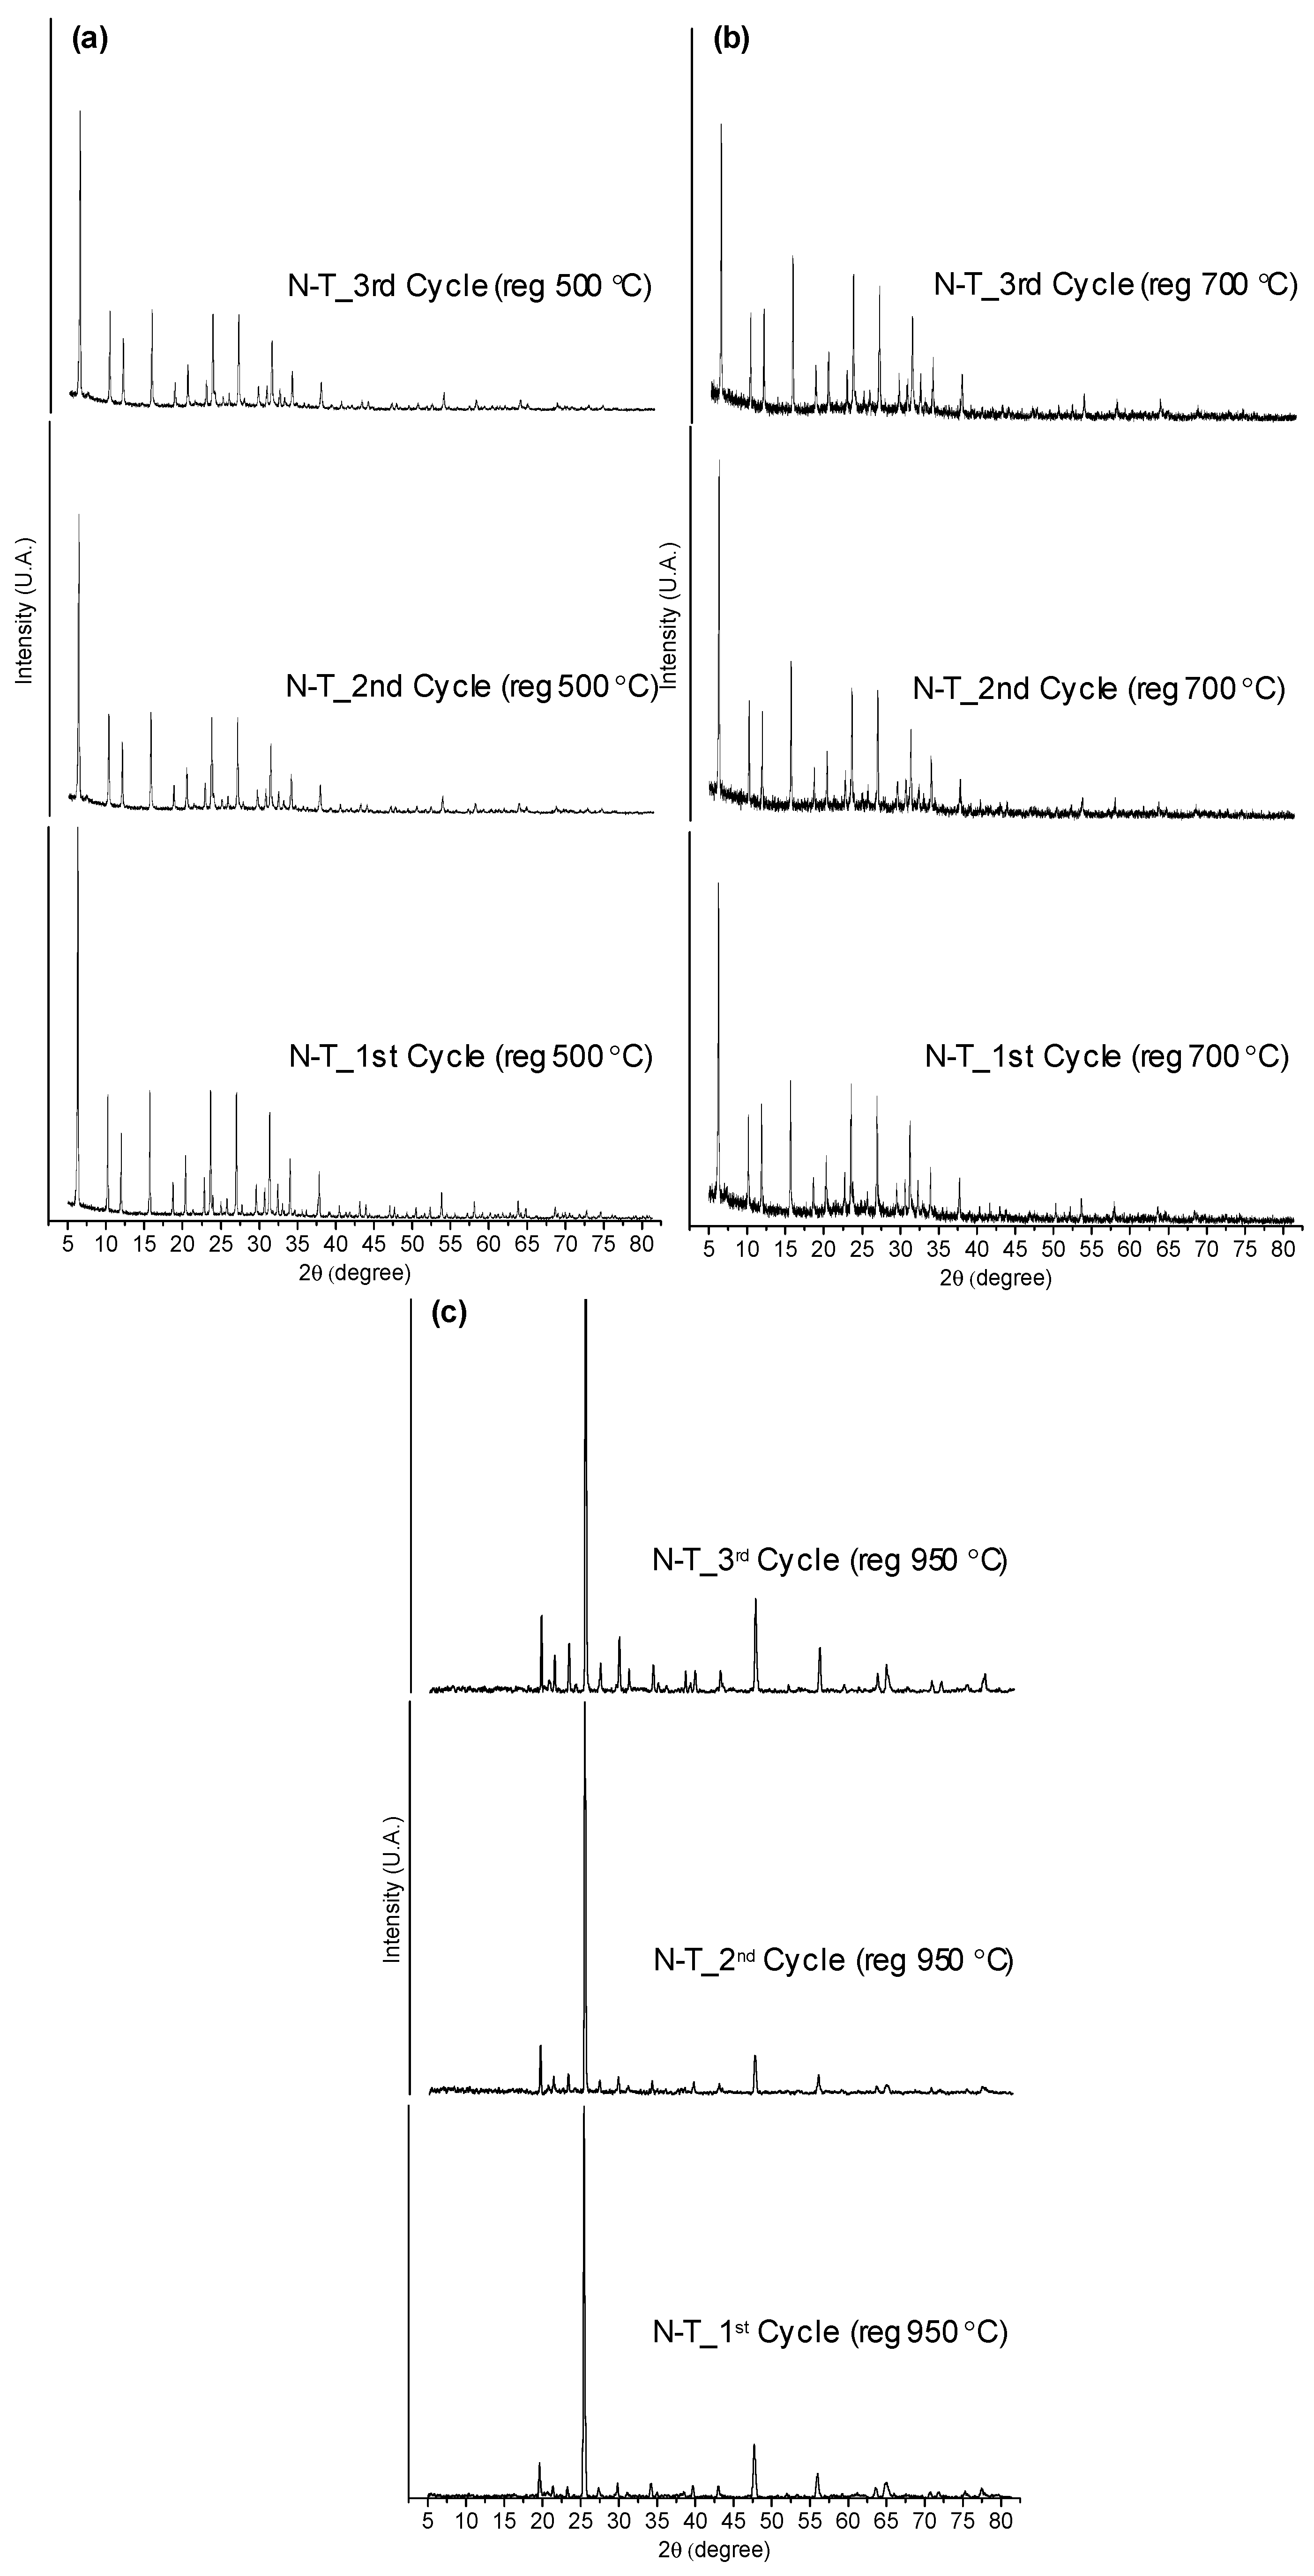
The catalyst regenerated at 500 °C showed a high carbon deposited on the surface (6.4 to 7.3 wt %). Most of the C, H and N deposits were removed after calcination at 700 °C and completely disappeared at 950 °C, showing that the latest temperature would be ideal for the complete removal of the coke. However, it has to be noticed that previous studies suggest that the structure of Li-LSX zeolite is retained unchanged up to 700 °C, so that calcination at 950 °C cannot be done without damaging the catalyst [26]. To confirm this, XRD patterns of the regenerated catalysts at 500, 700 and 950 °C were collected after 1st, 2nd and 3rd regeneration cycles in the presence of non-treated microalgae (Figure 6). The XRD patterns of the Li-LSX regenerated at 500 and 700 °C did not present significant differences with the typical XRD patterns of Li-LSX-zeolite [26], confirming that the crystalline structure was retained after the thermal treatment. The catalysts regenerated at 950 °C instead presented completely different XRD patterns compared to the fresh Li-LSX zeolite suggesting a modification of the crystalline structure.
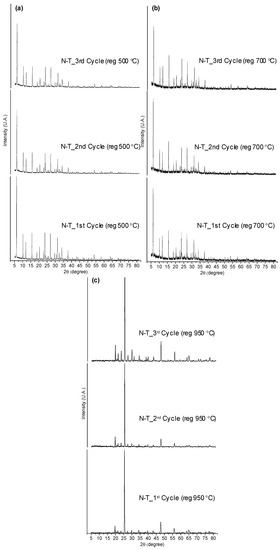
Figure 6.
XRD of Li-LSX zeolite (non-treated microalgae) regenerated at (a) 500 °C, (b) 700 °C and (c) 950 °C.
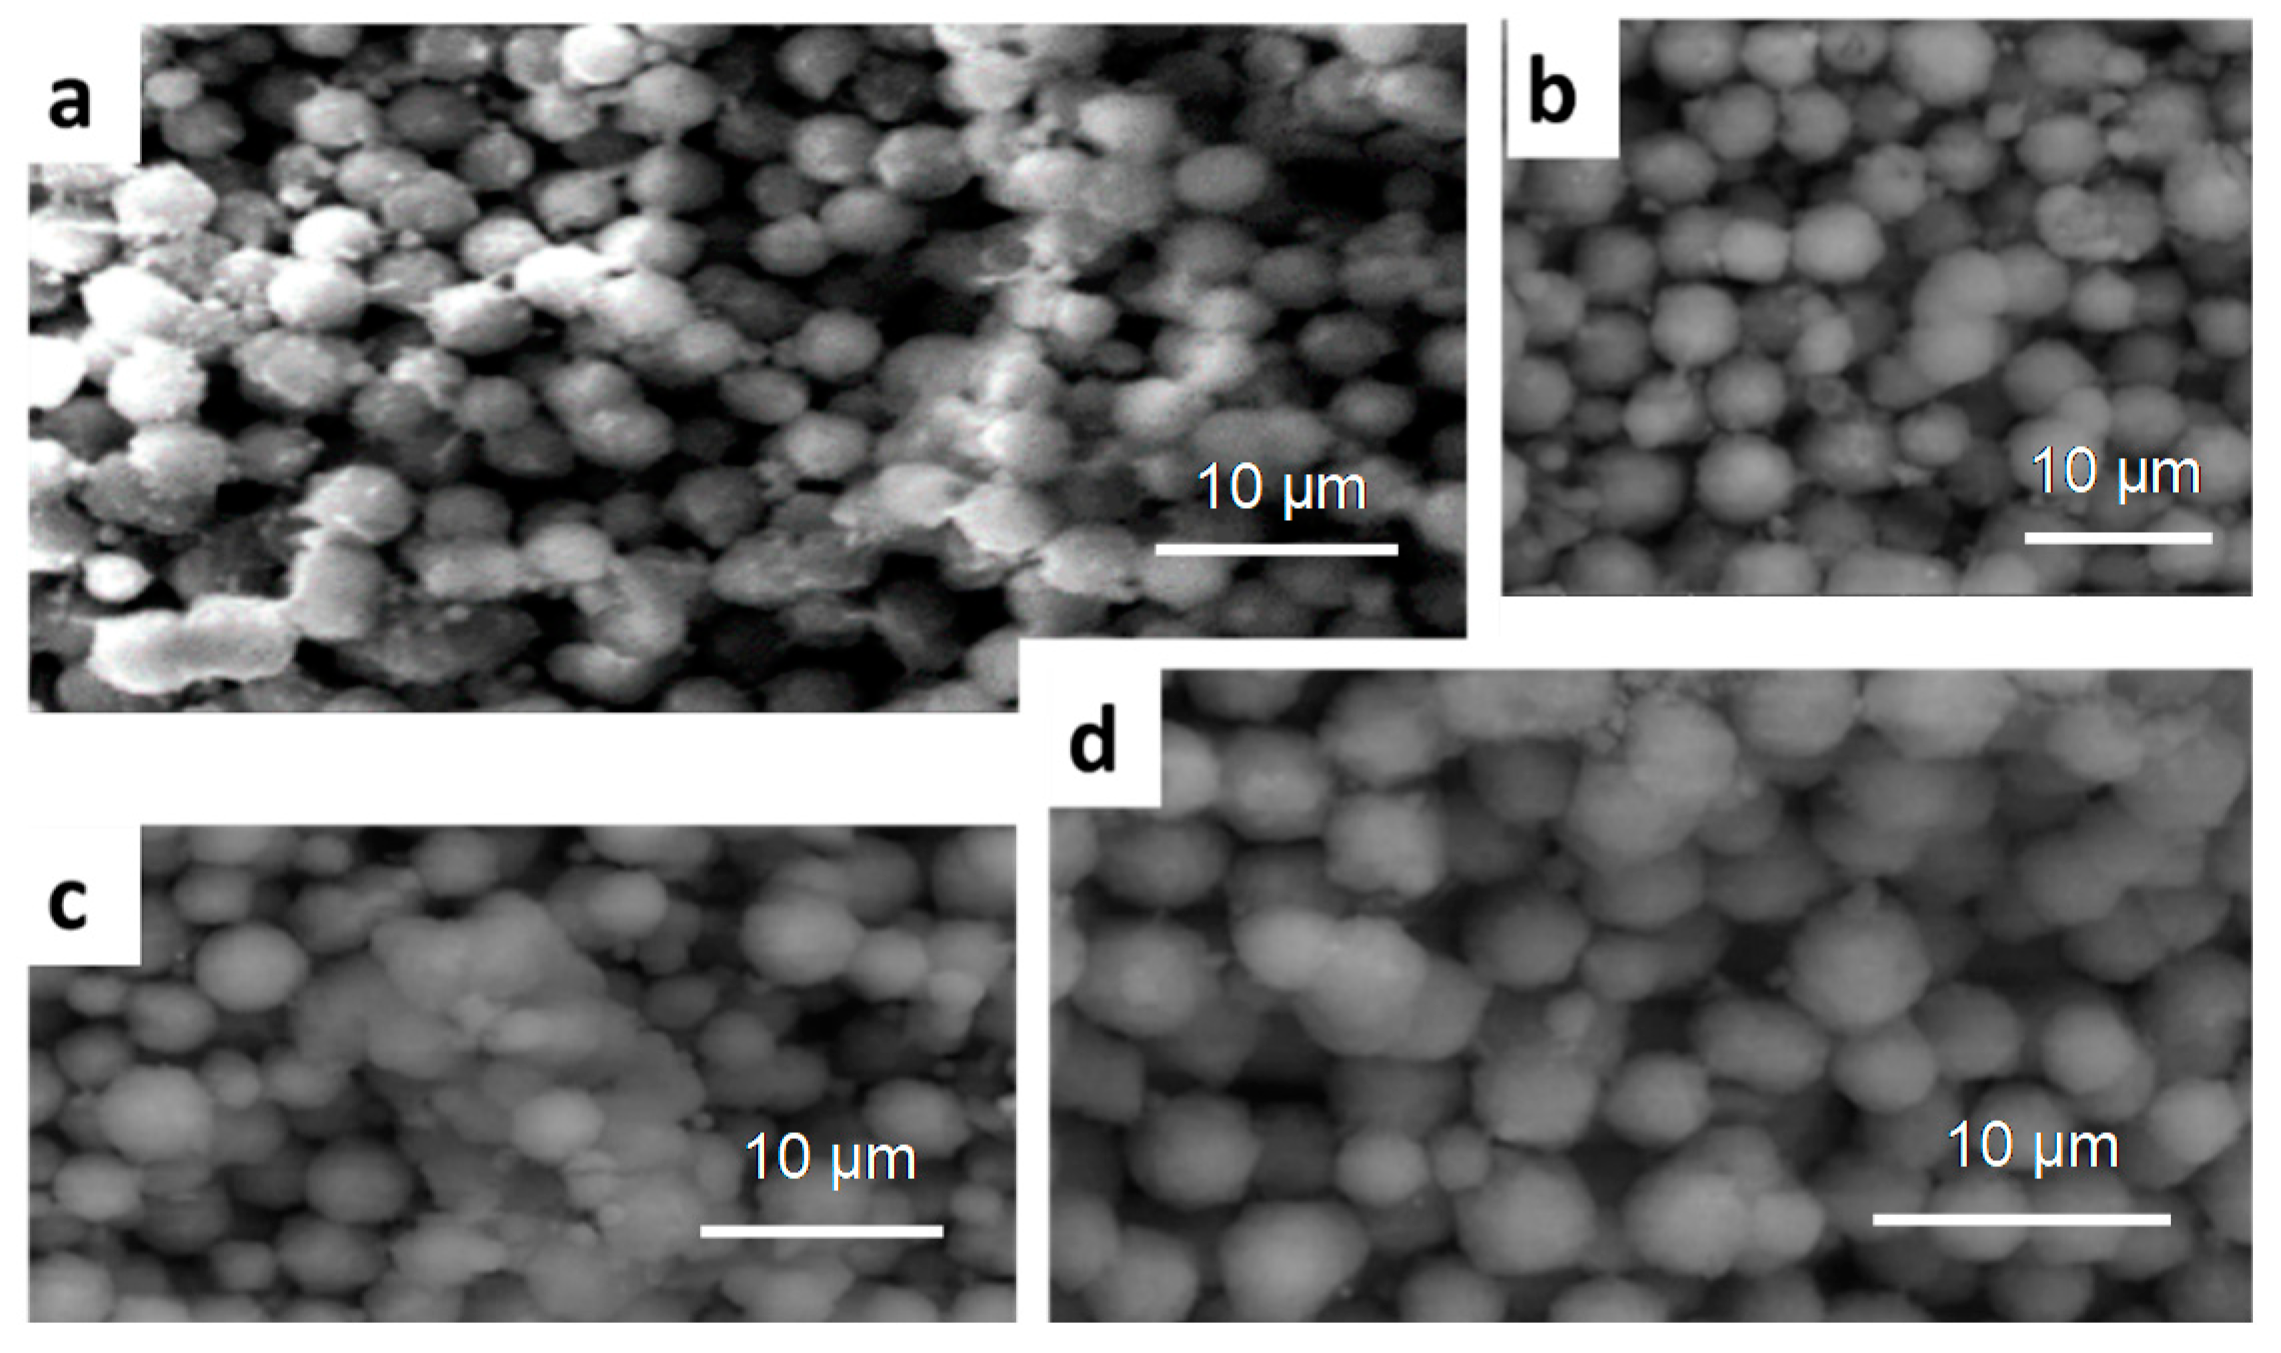
Figure 7 shows the Li-LSX zeolite after the calcination at 700 °C. The fresh Li-LSX zeolite is formed by uniform particles with sizes within 500–600 nm. SEM images of the regenerated zeolite after 2 (c) and 3 (d) cycles are very similar to that of the fresh one, which corroborate the XRD findings that Li-LSX zeolite retains its textural appearance after the regeneration process at 700 °C.
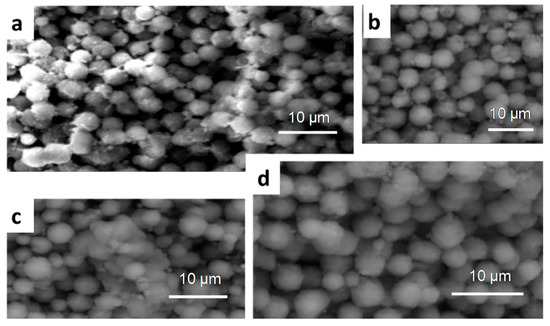
Figure 7.
SEM-EDX of raw (a), spent (b) and regenerated catalyst (non-treated) after 2 cycles (c) and 3 cycles (d) at 700 °C.
4. Conclusions
The activity of Li-LSX-zeolite catalyst on the pyrolysis of non-treated and acid pre-treated Isochrysis sp. microalgae after three consecutive pyrolysis/regeneration cycles was investigated. Overall, a very different behaviour was noticed in the pyrolysis process when non- or pre-treated microalgae where used. For the pyrolysis of non-treated microalgae, the bio-oil yield slightly decreased after three cycles, while the bio-oil yield for the pre-treated microalgae increased at the expense of gas, due to the removal of alkali metals in the pre-treatment. The products’ distribution, 1H-NMR and the EA analyses showed that the catalyst maintained its catalytic activity for cracking and deoxygenation over three cycles in presence of non-treated microalgae, while strong deactivation occurred when pre-treated microalgae where processed due to fouling (70% surface lost), with trace amount of P, S, Na deposited on the regenerated catalyst surface. In summary, Li-LSX zeolite was effective in maintaining deoxygenation activity over three cycles in the pyrolysis of non-treated Isochrysis microalgae, while the algae pre-treatment with sulphuric acid was detrimental on the catalyst activity.
Author Contributions
N.A.A.R. performed the experiments; all authors designed the experiments, discussed the results and contributed to the final manuscript. All authors have read and agreed to the published version of the manuscript.
Funding
This research was partially funded by EPSRC, grant number EP/P018955/1.
Acknowledgments
Authors acknowledge EPSRC, through grant EP/P018955/1, for the financial support and Dr Georgina Rosair, Heriot-Watt University, for XRD analysis and Jim Buckman, Heriot-Watt University, for SEM-EDS analysis.
Conflicts of Interest
The authors declare no conflict of interest.
References
- Sanna, A.; Abd Rahman, N.A. Conversion of Microalgae Bio-oil into Bio-diesel. Algal Biorefin. Prod. Refin. Des. 2015, 2, 493–510. [Google Scholar]
- Bridgwater, A.V. Review of fast pyrolysis of biomass and product upgrading. Biomass Bioenergy 2012, 38, 68–94. [Google Scholar] [CrossRef]
- Chisti, Y. Biodiesel from microalgae. Biotechnol. Adv. 2007, 25, 294–306. [Google Scholar] [CrossRef] [PubMed]
- Wang, X.; Zhao, B.; Tang, X.; Yang, X. Comparison of direct and indirect pyrolysis of micro-algae Isochrysis. Bioresour. Technol. 2015, 179, 58–62. [Google Scholar] [CrossRef]
- Aysu, T.; Abd Rahman, N.A.; Sanna, A. Catalytic pyrolysis of Tetraselmis and Isochrysis microalgae by nickel ceria based catalysts for hydrocarbon production. Energy 2016, 103, 205–214. [Google Scholar] [CrossRef]
- Rahman, N.A.A.; Fermoso, J.; Sanna, A. Effect of Li-LSX-zeolite on the in-situ catalytic deoxygenation and denitrogenation of Isochrysis sp. microalgae pyrolysis vapours. Fuel Process. Technol. 2018, 173, 253–261. [Google Scholar] [CrossRef]
- Thangalazhy-Gopakumar, S.; Adhikari, S.; Chattanathan, S.A.; Gupta, R.B. Catalytic pyrolysis of green algae for hydrocarbon production using H +ZSM-5 catalyst. Bioresour. Technol. 2012, 118, 150–157. [Google Scholar] [CrossRef]
- Pan, P.; Hu, C.; Yang, W.; Li, Y.; Dong, L.; Zhu, L.; Tong, D.; Qing, R.; Fan, Y. The direct pyrolysis and catalytic pyrolysis of Nannochloropsis sp. residue for renewable bio-oils. Bioresour. Technol. 2010, 101, 4593–4599. [Google Scholar] [CrossRef]
- Zainan, N.H.; Srivatsa, S.C.; Bhattacharya, S. Catalytic pyrolysis of microalgae Tetraselmis suecica and characterization study using in situ Synchrotron-based Infrared Microscopy. Fuel 2015, 161, 345–354. [Google Scholar] [CrossRef]
- Fahmi, R.; Bridgwater, A.V.; Donnison, I.; Yates, N.; Jones, J.M. The effect of lignin and inorganic species in biomass on pyrolysis oil yields, quality and stability. Fuel 2008, 87, 1230–1240. [Google Scholar] [CrossRef]
- Ross, A.B.; Jones, J.M.; Kubacki, M.L.; Bridgeman, T. Classification of macroalgae as fuel and its thermochemical behaviour. Bioresour. Technol. 2008, 99, 6494–6504. [Google Scholar] [CrossRef] [PubMed]
- Bae, Y.J.; Ryu, C.; Jeon, J.K.; Park, J.; Suh, D.J.; Suh, Y.W.; Chang, D.; Park, Y.K. The characteristics of bio-oil produced from the pyrolysis of three marine macroalgae. Bioresour. Technol. 2011, 102, 3512–3520. [Google Scholar] [CrossRef] [PubMed]
- Ross, A.B.; Anastasakis, K.; Kubacki, M.; Jones, J.M. Investigation of the pyrolysis behaviour of brown algae before and after pre-treatment using PY-GC/MS and TGA. J. Anal. Appl. Pyrolysis 2009, 85, 3–10. [Google Scholar] [CrossRef]
- Choi, J.; Choi, J.W.; Suh, D.J.; Ha, J.M.; Hwang, J.W.; Jung, H.W.; Lee, K.Y.; Woo, H.C. Production of brown algae pyrolysis oils for liquid biofuels depending on the chemical pretreatment methods. Energy Convers. Manag. 2014, 86, 371–378. [Google Scholar] [CrossRef]
- French, R.; Czernik, S. Catalytic pyrolysis of biomass for biofuels production. Fuel Process. Technol. 2010, 91, 25–32. [Google Scholar] [CrossRef]
- Cheng, S.; Wei, L.; Zhao, X.; Julson, J. Application, deactivation, and regeneration of heterogeneous catalysts in bio-oil upgrading. Catalysts 2016, 6, 195. [Google Scholar] [CrossRef]
- Zhang, B.; Zhong, Z.-P.; Wang, X.-B.; Ding, K.; Song, Z.-W. Catalytic upgrading of fast pyrolysis biomass vapors over fresh, spent and regenerated ZSM-5 zeolites. Fuel Process. Technol. 2015, 138, 430–434. [Google Scholar] [CrossRef]
- Paasikallio, V.; Kalogiannis, K.; Lappas, A.; Lehto, J.; Lehtonen, J. Catalytic Fast Pyrolysis: Influencing Bio-Oil Quality with the Catalyst-to-Biomass Ratio. Energy Technol. 2017, 5, 94–103. [Google Scholar] [CrossRef]
- Shao, S.; Zhang, H.; Xiao, R.; Li, X.; Cai, Y. Controlled regeneration of ZSM-5 catalysts in the combined oxygen and steam atmosphere used for catalytic pyrolysis of biomass-derivates. Energy Convers. Manag. 2018, 155, 175–181. [Google Scholar] [CrossRef]
- Channiwala, S.A.; Parikh, P.P. A unified correlation for estimating HHV of solid, liquid and gaseous fuels. Fuel 2002, 81, 1051–1063. [Google Scholar] [CrossRef]
- López, A.; de Marco, I.; Caballero, B.M.; Adrados, A.; Laresgoiti, M.F. Deactivation and regeneration of ZSM-5 zeolite in catalytic pyrolysis of plastic wastes. Waste Manag. 2011, 31, 1852–1858. [Google Scholar] [CrossRef] [PubMed]
- Williams, P.T.; Horne, P.A. The influence of catalyst regeneration on the composition of zeolite-upgraded biomass pyrolysis oils. Fuel 1995, 74, 1839–1851. [Google Scholar] [CrossRef]
- Liu, C.; Van Santen, R.A.; Poursaeidesfahani, A.; Vlugt, T.J.H.; Pidko, E.A.; Hensen, E.J.M. Hydride Transfer versus Deprotonation Kinetics in the Isobutane-Propene Alkylation Reaction: A Computational Study. ACS Catal. 2017, 7, 8613–8627. [Google Scholar] [CrossRef] [PubMed]
- Kumar, G.; Shobana, S.; Chen, W.-H.; Bach, Q.-V.; Kim, S.-H.; Atabani, A.E.; Chang, J.-S. A review of thermochemical conversion of microalgal biomass for biofuels: Chemistry and processes. Green Chem. 2017, 19, 44–67. [Google Scholar] [CrossRef]
- Li, H.; Liu, Z.; Zhang, Y.; Li, B.; Lu, H.; Duan, N.; Liu, M.; Zhu, Z.; Si, B. Conversion efficiency and oil quality of low-lipid high-protein and high-lipid low-protein microalgae via hydrothermal liquefaction. Bioresour. Technol. 2014, 154, 322–329. [Google Scholar] [CrossRef]
- Kodasma, R.; Fermoso, J.; Sanna, A. Li-LSX-zeolite evaluation for post-combustion CO2 capture. Chem. Eng. J. 2019, 358, 1351–1362. [Google Scholar] [CrossRef]

© 2020 by the authors. Licensee MDPI, Basel, Switzerland. This article is an open access article distributed under the terms and conditions of the Creative Commons Attribution (CC BY) license (http://creativecommons.org/licenses/by/4.0/).