Abstract
Planning the operation scheduling with optimization heuristic algorithms allows microgrids to have a convenient tool. The developments done in this study attain this scheduling taking into account the impact of energy storage useful life in the microgrid operation. The scheduling solutions, proposed for the answer of an optimization problem, are obtained by using a metaheuristic algorithm called Differential Evolutionary Particle Swarm Optimization (DEEPSO). Thanks to the optimization that is conducted in this study, it is possible to formulate dispatches of the existent microgrid (MG) by always looking for the ideal dispatch that implies a lower cost and provides a greater viability to any project related to renewable energy, electric vehicles and energy storage. These advances oblige the battery manufacturers to start looking for more powerful batteries, with lower costs and longer useful life. In this way, this paper proposes a scheduling tool considering the energy storage useful life.
1. Introduction
The engineering discipline does not only focus on the development of technologies and solutions for practical challenges, but it also looks for the most optimal ones. In the business world, this solution is determined by making a balance between both the cost of the alternative and the benefits obtained with it. In the case of microgrids (MGs), the goal is always to minimize the cost of operation while the services for customers are maintained in proper conditions [1].
In recent efforts, different algorithms have been used to find the optimal operating point in a MG. For example, in the reference [1], the hybrid differential evolution and harmony search (hybrid DE-HS) algorithm was used, while in reference [2], the objective function intends to minimize the operation cost of the MG considering the AC and DC grids. Other studies [3,4] have considered the time slots in which the energy costs are higher or lower depending on the user’s consumption. On the other hand, some researchers have considered electric vehicles in the MG, including the Vehicle2Grid option (V2G), a technology with the capability of being charged using the energy supplied from the grid and sometimes returning the stored energy to the grid. Nevertheless, this feature has a series of power and energy restrictions. These ones have been handled by using the most effective strategy to reduce the peak load and increase the power consumed in the valley of the demand curve of the customers. In order to get a solution, the methodology (in references [5] and [6]) focused on different energy prices at different time slots.
In a MG, electric vehicles are not only considered, but also all of their components (renewable and traditional generators, energy storage, and controllable loads), their basic architecture, and the smart energy management as it can be seen in [7,8,9]. A vital part of the MG operation is the power storage. For this, there are two important characteristics for defining the cost associated with the use of this system. The first is the cost of energy utilizing the storage banks, and the second is the battery life loss cost over time. Different models were presented in [8], where a multi-objective problem looks for optimizing the mentioned characteristics in the same proportion.
The use of renewable energies to minimize the fuel consumption and the cost of conventional energy generation are valuable features in MGs, as it has been shown in [9,10,11,12,13,14,15]. In different moments, renewable energies have the help from power storage banks [10,11], in order to supply the most convenient power to the network. Considering the operation as a whole, some studies have looked for the optimization of different objectives such as the optimization of the power-flow [12], smart energy management [13], reduction of carbon emissions [14,15], and unmet load [15]. All these studies of multi-objective problems use the Pareto diagrams to find the most optimal operating point for the system that is evaluated in each case, although all of them use different algorithms. The same occurs in mono objective problems, as it is presented in the [16] and [17], where the objective is to minimize the total losses of the grid using the MOSEK algorithm. As it can be seen, most of the researches apply a great variety of metaheuristic algorithms, genetic algorithms, among others.
One of the problems when deploying renewable energies is the uncertainty associated with its availability. For that, the modeling of smart grid elements must be taken into account. These elements are: renewable energy sources, the life cycle of the energy storage using batteries [18], and finally, the hybrid vehicles that can provide and return energy to the grid [19]. For these analysis, an availability model is considered for eolic power [20,21] and photovoltaic power [21], that is to say, dispatchable renewable power using back-up systems (controllable renewable systems). This model is also involved in electric vehicles scheduling [22].
In order to solve the scheduling problem of MGs, in this paper, the MG operation will be determined, minimizing the cost of operation during a 24 h time horizon, which represents a normal day of the MG. The use of the plug-in hybrid electric vehicles, the use of wind and solar renewable energies, the energy storage and the uncertainty modeling through uncertainty cost functions of the availability of solar and wind power will be considered in an optimization formulation. All this optimization approach is solved using the DEEPSO algorithm, which has obtained recognition because it has been the best algorithm when solving problems regarding optional power-flows an energy management in electric grids [20,21,22,23].
Since surplus from renewable energy generation is anticipated, storing such energy is recommended. To accomplish this objective, it is necessary to have battery energy storage [23]. Developing batteries that are safer, powerful, economical and with a longer useful life [24,25,26,27,28,29] has been a technological challenge in the last decade. Most battery banks are made of lithium batteries. Such batteries have specific features: its degradation rate is susceptible to the operating conditions such as temperature, State of Charge (SOC), tension, Depth of Discharge (DOD), and magnitude of the current which is the one that has more influence, and the ageing factor [30,31,32]. For this reason, the scenarios that will be used in this study are when the batteries are in 30%, 60%, and 100% of their useful life. In this way, the main contribution of this research is to investigate the impact of the ageing factor of the energy storage system on the optimal scheduling operation of the MG.
2. Scheduling Formulation
The development of microgrids has a great potential due to the presence and availability of solar and wind energy, however, its successful operation is constrained by the efficient utilization of such energy resources. In other words, renewable energy is variable in nature. During the day, there could be moments of where the energy generation could exceed the demand and vice versa [2,12,16].
One way to solve this issue is to create a planning approach that allows not only using the storage system in a basic way, but also scheduling a dispatch of controllable renewable systems for the specific characteristics of the MG. The planning approach would also consider the area where the system is implemented and would allow the reduction of costs at the critical hours for the system, like when the energy demand is the highest.
In this proposed study, the calculation of the operation cost of the whole system is proposed in a modular way combining all the proposed costs that will turn into an objective function. In this particular case, regarding the costs, there are four main components considered in the study of MG. The first cost is associated with the operation of the backup system that the whole system has. The second is associated with the usage cost of electric vehicles. The third depends on the battery banks and their degradation throughout the time and the last is the uncertainty functions with the monetary penalization due to the uncertainty of the renewable energies.
The backup system cost, through the conventional energy sources is represented with a polynomial function [5,6,7,8,9,10,11,12,21]. Electric vehicles depend on the state of charge mostly, as well as on the restrictions of energy and power that are part of the distribution grid where these elements are connected [4,20]. The battery cost is represented with an equation that depends on the batteries’ useful life loss and the cost that was initially invested in the storage system [4,21]. In the case of the uncertainty of the renewable energies, the cost of having planned a dispatch of renewable energies higher than the existent one is taken into account, as well as the cost of dispatching less energy than the one available (underestimation and overestimation conditions) [5,6].
In general terms, the problem lies in the different costs associated with the MG operation. These costs, in general, are described and expressed in Equation (1), where F1(x) is the traditional power generation cost, F2(x) is the electric vehicles operation cost, F3(x) is the bank batteries operation cost, and F4(x) is the uncertainty cost of renewable energies.
2.1. Cost of Conventional Energy Sources (F1(x))
The cost of generators of conventional and hydraulic energy are modeled using a polynomial function, which is of second degree most of the cases. The Equation (2) shows the model according to [6,7,21]:
where αi, βi, γi are the cost coefficients, and Ps,i is the power to be scheduled in the generator i.
Ci (Ps,i) = αi + βi Ps,i + γi Ps,i2
2.2. Cost of the Electric Vehicles Operation (F2(x))
For the analysis of the costs associated with electric vehicles, this study considers a certain number of Plug-in Electric Vehicles (PEVs) that are grouped in aggregators [23,33,34]. These aggregators are defined as a place that groups an amount of electric vehicles, which supplies PEVs charging when is more appropriate in economic terms, as reference [23,33,34] presents. Each one of the aggregators is associated with the power values and the amount of kilometers that the vehicles, which depend on the aggregator, can travel. Then, the arrival time of the vehicle to the charging station and the departure time are estimated. The purpose is to calculate the vehicles charging during low cost time slots and during those of high cost, to be able to supply the grid with the energy available, hence minimizing the PEVs operation management cost.
All this information regarding the function that models the operation cost and the vehicles charging, beside their limits and approach, was adapted from [23,33,34]. The first process that the aggregators do is to calculate the maximum energy dispatch for an electric vehicle to see if its operation and charge are feasible. The aggregated load boundaries are computed per each aggregator. This is achieved by describing each PEV charging need in terms of its energy and power boundaries. In any case these boundaries must not exceed the rated charging power at any given charging port. The state of charge of the vehicles is found on hourly basis during the whole day bearing in mind the initial state of charge (), as Equation (3) shows:
A PEV has upper and lower limits in the interval [tk,t(k+Hi−1)], expressed analytically in Equation (4). emin and emax are the same in that time instance where the EV is already charged, this remains until the vehicle is disconnected. In Equation (5), it is considered the maximum and minimum limits after its departure, and the minimum energy of the PEV is specified in the interval [k + j], which can be at least ·Pmax·∆t lower than the energy of the interval [k + j + 1], and at the same time it will never be lower than its state of energy when it initially arrives. Equation (6) implies that the initial state of the energy and Equation (7) guarantees that the maximum value of energy of the PEV after different charging time periods is not higher than the maximum energy of the PEV ().
As there are energy limits, there are also power limits, which are shown in Equation (8) when the vehicles are plugged, and in Equation (9) when the vehicles are not present anymore during the time horizon when they are being charged.
According to the previous equations, this research contemplates the energy limits in the Equations (10) and (11) and the power limits in the Equation (12), considering in all of them the grouping of the vehicles.
The function F2(x) is given in Equation (13), which represents the operation cost of the MG. This cost is to be minimized bearing in mind the restrictions presented in Equations (14)–(17), symbols are in Table 1.

Table 1.
Notations of operation cost of electric vehicles.
2.3. Operation Cost of The Battery Banks (F3(x))
The operation cost of the battery banks is similar as the cost of life of the renewable energy generation equipment (Cbl) [8,15,35,36,37,38,39,40]. This is presented in Equation (18), where Lloss is the battery life loss and Cinit-bat is the initial investment cost [8]. By convention, it is assumed that battery’s power is represented with a negative sign when they are charging and with a positive one when they are discharging [15].
The battery life loss (Lloss) is given in Equation (19), where Ac is the cumulative performance in Ah, effective in some periods of the time, and Atotal is the cumulative performance in Ah during the life cycle [8].
Ac is given in Equation (20), and it depends on the State of Charge (SOC) and the current performance in Ah.
where λ_SOC is the effective weighting factor. In case that this value is higher, it will behave linearly, approximately (Equation (21), k and d battery constants).
Ac = λ_SOC
λ_SOC = k × SOC + d
To find this cost, it is necessary to take into account the constraints of the minimum and maximum state of charge of the batteries, and the battery’s power that has to be higher or equal to the maximum load power and lower than the maximum discharge power. This is shown in Equation (22).
2.4. Uncertainty Costs (F4(x))
According to [21], the uncertainty cost can be represented as in Equation (23), where CPV is the photovoltaic generator cost, and Cw is the wind power generation cost. The development of these terms (CPV and Cw) are in Equations (24) to (33), and they are coming from [23].
2.4.1. Photovoltaic Generator
The photovoltaic generator’s cost (CPV) is presented in Equation (24), and it depends on two functions that are given in [21] and are developed in [23,24]. The first function occurs because the generator is underestimated and it is represented in CPV,u,i. The other function appears because the generator is overestimated and it is represented with CPV,o,i. These two functions depend on the power programmed in the photovoltaic generator WPV,s,i and the power available in it WPV,i.
The power of a solar panel is given depending on the work area, as in the Case A or B, as describe below:
where:
- WPV (G) is the photovoltaic power generated as the Irradiance function.
- G is the solar irradiance.
- Gr is the standard irradiance in the environment.
- Rc is the reference value of the irradiance.
- WPV,r is the output power rating of the photovoltaic cell.
• Underestimated Case [23]
• Overestimated Case [23]
2.4.2. Wind Power Generator
The wind power generator cost Cw is presented in Equation (29). It depends on two functions that are given in [21] and are developed in [23,24]. The first function occurs because the generator is underestimated (see Equation (32) for underestimated case) and it is represented as . The other function appears because the generator is overestimated (see Equation (33) for overestimated case) and it is represented with . These two functions depend on the power programmed in the wind power generator and the power available in it .
The power of the wind generator is defined as a function of the wind speed as shown below:
where:
- is the wind power generated in function of the wind speed.
- is the low cut-in speed of the wind of the aerogenerator.
- low cut-in speed of the wind of the aerogenerator.
- rated wind speed of the aerogenerator.
- is the high cut-in speed of the wind of the aero generator
- is the power rating of the aerogenerator.
• Underestimated Case [23]
• Overestimated Case [23]
3. Methodology Solution Using Metaheuristic Algorithms
3.1. Heuristic and Metaheuristic Algorithms
For non-polynomial mathematical problems, most of the times, great computational efforts are needed to find their answers or simply they do not have an analytical solution since they are non-convex problem. This means that the high-quality solutions of the problem are not uniformly distributed in the region of solutions. The heuristic method uses a set of simple procedures, which most of the times come from the experience and which permits solving the system with less computational efforts. These methods give place to find a local optimum that is not necessarily the optimal global solution, since from the theoretical point of view, these algorithms renounce to find the global optimum solution. Unlike the metaheuristic algorithms, these ones have the inconvenience of being designed to find fair solutions and not the global optimal, because their solution algorithms do not have the mechanisms so as to avoid the local optimums in the region of solutions [25].
On the other hand, metaheuristic algorithms have a series of techniques that can avoid local solutions. Nevertheless, it is difficult to achieve the value of the global optimal, though close values can be obtained. The metaheuristic algorithms are based on the heuristic theory and are combined with other algorithms, for instance the genetic algorithms, among others.
3.2. DEEPSO Algorithm
DEEPSO is the result of the combination of different optimization methods. Each combined method to give place to DEEPSO presents a series of difficulties in relation to the analysis of a specific problem and the processing and precision of the obtained results. For this reason, different methods are combined so as to create a more general and robust method [22,23,24,25].
This algorithm comes from the Evolutionary Particle Swarm Optimization (EPSO) method and the Particle Swarm Optimization (PSO) method, which provide the ability of self-adaptation of Evolutionary Algorithms (EA), in order to obtain the best results from the two worlds [26].
3.2.1. DE (Differential Evolution)
In the Differential Evolution, there is a swarm with different individuals (particles, vectors) and this generates a new existent individual solution optimizing it with a combination of two other points. In other words, in every new created population, an additional recombination is established, and it guarantees a wider variety and a selection process to create the next generation. This is an elitist selection and is based on one to one, which means that every father competes directly with his only child for the survival, and only the best option is selected [26].
3.2.2. PSO (Particle Swarm Optimization)
Particle Swarm Optimization (PSO) is based on a movement rule that generates new individuals in the search space, given a group of solutions previously known. With this basic movement rule, a new individual vector of solutions X is produced for iteration (K + 1):
where V is the particle speed and is represented as:
where bG is the best position found by the swarm so far, and bi is the best direct ancestor of the particle, with bi, I = 1, …, N particles that is equal to the population of solutions, and the algorithm creates the group of the best ancestors during the historical behavior of each particle. This method considers the population of not only the active particles but also those particles that are immediate ancestors and the group of the best ancestors. In this way, the movement of the particles is evaluated considering the recent changes [22].
3.2.3. EPSO (Evolutionary Particle Swarm Optimization)
It is an adaptive evolutionary recombination. As in [26], the purpose of the EPSO algorithm is to provide the adaptive ability to the recombination parameter. For that, the elements of the equation are shown below:
This equation is constrained to mutation and selection, so as to obtain the best rate of progress. If there is a population integrated by a group of particles, the general structure of EPSO is [22]:
- Replication: each particle is cloned r times (normally r = 1).
- Mutation: in each particle r, parameters A, B, C are mutated.
- Reproduction: each particle r + 1 (original and cloned) produce a descendant through recombination.
- Evaluation: the aptitude of each population is evaluated.
- Selection: through the process of a stochastic tournament selection, a new generation with the best descendant of each ancestor is formed. This is possible since each individual that belongs to a previous generation has a descendant.
4. Result of Operation Scheduling in the Test Microgrid
This study developed an intelligent methodology based on the DEEPSO heuristic algorithm, (Differential Evolutionary Particle Swarm Optimization), to find the scheduling that provides the best possible cost efficiency of the microgrid. DEEPSO algorithm was chosen because it has had good results when having problems related to optimal power flows [22,23,24,25].
The development of algorithms and their applications in real systems has been a process of different stages where more powerful and faster algorithms for this kind of problems have been improved. Participating in different optimization competences permits seeking for the improvement of the algorithm using the experiences learned in different contests and where great results have been obtained. This constant improvement accomplishes good results in the mentioned competences [23,24,25].
On that perspective, today there is the possibility of modeling any type of MG and being able to identify how the optimal dispatch would be for each specific case. The objective is to reduce the operation cost in order to be close to the global optimum. It can be profitable, as the results of the article [4].
With the technology advances, this optimization system does not lag behind since it can keep up with the new advances at the same pace the new systems do. Thanks to the modular system, it could progressively update the different equations that are part of the objective function cost without having an effect on other parts of the system [21,22].
The capacity of the generators inside the MG was determined (Table 2) for the development of these simulations. Similarly, the treatment of each one of the existing systems had a series of values that had to be used to carry out the simulation. The parameters are specified in Table 3, Table 4, Table 5, Table 6 and Table 7.

Table 2.
Power sources capacities (for F1(x), F2(x), F3(x), and F4(x) calculation).

Table 3.
Battery parameters (for F3(x) calculation).

Table 4.
Costs (for F1(x), F2(x), F3(x), and F4(x) calculation).

Table 5.
Wind power system parameters (for F4(x) calculation).

Table 6.
Parameters of the photovoltaic system (for F4(x) calculation).

Table 7.
Parameters of electric vehicles (for F2(x) calculation).
The DEEPSO (Section 3.2) optimization algorithm was tuned and applied to the problem formulation (Table 2, Table 3, Table 4, Table 5, Table 6 and Table 7). The population size in each generation of the algorithm was 20, and the algorithm had a stop criterion according to the improvement of the target function (the algorithm stop after 10 iteration of less of 0.5% of improvement in the target function). Bearing in mind that the system started operation up until now, after the implementation of all the equations and parameters associated with the costs of the MG under study, the position where the operation cost is minimum is identified (Figure 1).
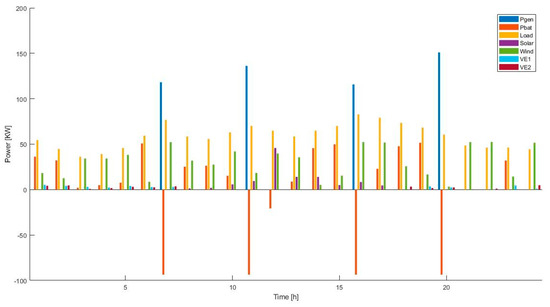
Figure 1.
Microgrid (MG) operation during 24 h when the system is new.
In Figure 1, the system under analysis is considered new. It can be seen that the use of the batteries for some moments of the day is the most attractive option so as to reduce the MG operation cost, without considering that they have a shorter life time. Under these conditions, it is observed that the battery recharges 6 times a day using the diesel generator, which starts to provide really high power. This occurs because apart from providing the power needed by the load, it also supplies the power to charge the battery banks.
Having in mind the participation of renewable energies, the use of photovoltaic energy in every hour of the day starts to be evaluated. For this analysis, the available power during every hour of the day is represented in Figure 2, and it is compared with the power dispatched directly to the grid. It is observed that at certain hours of the day, there are high quantities of power coming from solar radiation, where the best option is to dispatch a bit less of the maximum power so the surplus is stored in the battery banks of the system. In addition, the opposite characteristic is visible, where the power obtained from the solar radiation is lower than the power dispatched, since the power missing can supply the storage system of the solar power system.
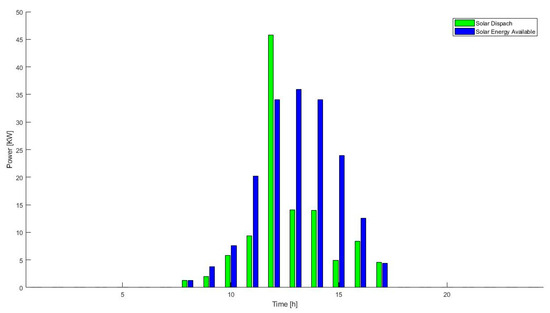
Figure 2.
Photovoltaic power dispatched (green) vs. the most probable power curve (blue) during 24 h every day.
On the other hand, Figure 3 shows that the wind energy behavior is different to the solar energy behavior (Figure 2), since the wind energy dispatch curve is much lower in some hours of the day with respect to the most probable energy curve of the wind power generators. This behavior can be attributed to the costs of the under- and overestimation of the wind energy availability. In this way, in certain moments of the day, the algorithm determines that the least expensive option is to store the wind energy in a storage system and supply the grid with an amount of energy that helps to reduce the cost by under- or overestimation. Additionally, in different periods, the supplied wind energy is higher than the available one, due to the stored wind energy in other moments which is supplied in the appropriate moment to reduce the costs associated at the hours with more demanding needs of power.
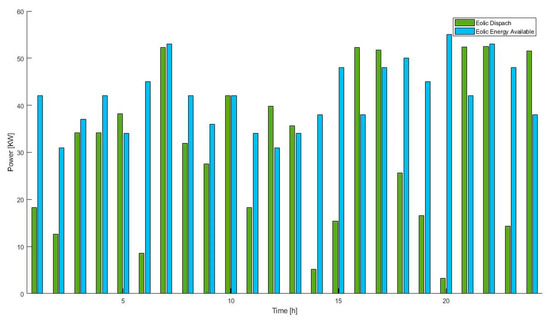
Figure 3.
Wind power dispatched (green) vs. most probable power (blue) during the 24 h of the day.
Figure 4 shows the periods when the two aggregators of electric vehicles are charged. As it was expected, the aggregators take advantage of the periods of time when the energy cost is lower (10 pm–6 am) and in the periods when it is more expensive (2–10 pm). The full load of electric vehicles is guaranteed once the time horizon is finished and the vehicle leaves the power socket.
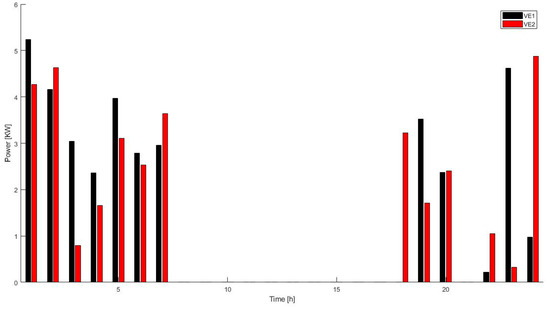
Figure 4.
Load of the two electric vehicles of the two aggregators under study.
As it was mentioned at the beginning, the minimization of the operation cost was considered taking into account that the MG elements were new. In the case these requirements are not fulfilled and that the battery is at the end of its life cycle, the behavior of the load and the unload cycles is pretty different. In Figure 5, the number of loads went from 6 during a day to only 1 a day. The aging of the storage system is produced by the load and unload cycles that it experiences during its operation. Similarly, the operation cost of the MG is also affected by this behavior, because as the time goes by, there is a higher cost due to the batteries operation, which means that the cost increases approximately 3 times more than when the system is new.
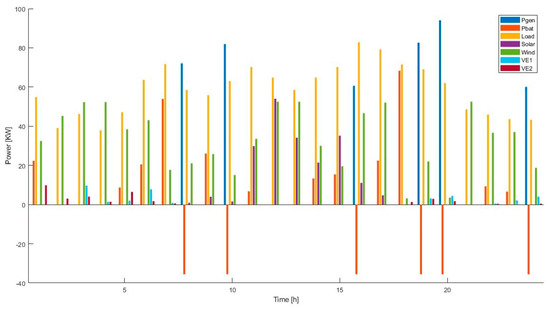
Figure 5.
MG Operation during 24 h when the battery storage system is getting to the end of its useful life.
4.1. Solar Dispatch
When the energy storage system is new, according to Figure 1, during every hour the solar energy is available, not all the energy available is directly dispatched. The rest of the energy is stored in the batteries of the system, and it is used in the hours when there is going to be a higher impact in the reduction of operation costs of the system, as the 24 h operation shows (Figure 6).
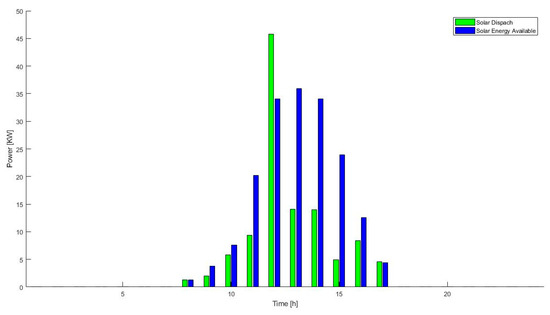
Figure 6.
Availability and dispatch of the solar energy system of the MG when the storage system is new.
As the storage system gets old, it can be seen that the amount of energy stored decreases daily. This phenomenon is observed when comparing the existent dispatch when the storage system is at 30% of its useful life (Figure 7), at 60% of its useful life (Figure 8), and when the system is almost at the end of its useful life (Figure 9).
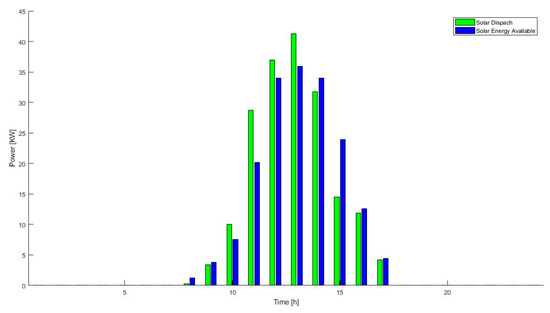
Figure 7.
Availability and dispatch of the solar energy system of the MG when the storage system is after the 30% of its useful life.
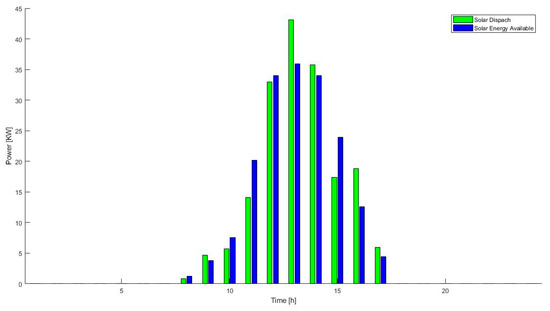
Figure 8.
Availability and dispatch of the solar energy system of the MG when the storage system is after the 60% of its useful life.
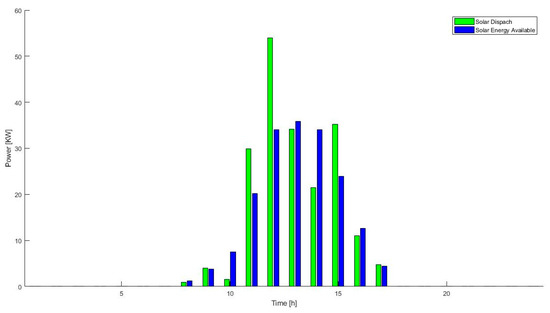
Figure 9.
Availability and dispatch of the solar energy system of the MG when the storage system is at the end of its useful life.
The dispatch curve is increasingly more similar to the availability curve. The usual behavior of the current implemented systems has the characteristic of dispatching all the renewable energy available at each moment without paying attention to the matter that storing or dispatching this energy in other moments can have higher monetary benefits.
4.2. Wind Energy Dispatch
In Figure 10 where the system is already at the 30% of its useful life, it is observed that during the time intervals when the demand of energy is supplied by the diesel generator, the wind energy storage system takes advantage of these intervals to store the greatest amount of wind energy available avoiding its waste.
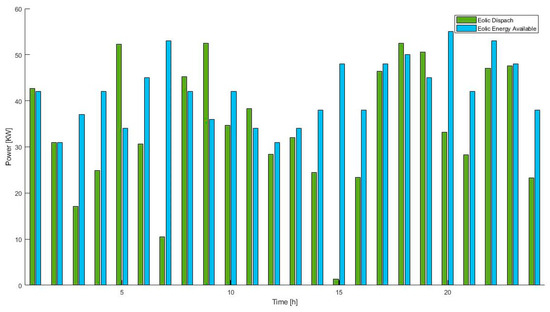
Figure 10.
Availability and dispatch of the wind energy system of the MG when the storage system is at 30% of its useful life.
When the system is at 60% of its useful life (Figure 11), the dispatch of wind energy is lower than the one available, since the algorithm used to program the system strongly such that it penalizes the overestimation of wind energy dispatch and in this way the algorithm underestimates the available power, minimizing the costs due to the possibility of not having the resource, in this case, the wind speed.
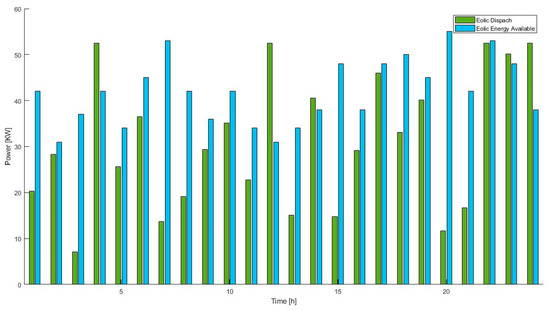
Figure 11.
Availability and dispatch of the wind energy system of the MG when the storage system is at 60% of its useful life.
At this point when the system is almost getting to the end of its useful life (Figure 12), it is determined that the best option is to dispatch a very close value to the one available. This is because the cost that needs to be overestimated is higher than the benefits the system can have storing the energy in the batteries.
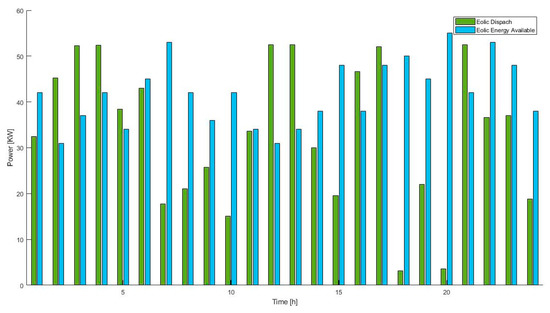
Figure 12.
Availability and dispatch of the wind energy system of the MG when the storage system is at the end of its useful life.
4.3. Dispatch of the Whole System
As it can be seen during the dispatch of the MG, four daily load and unload cycles are used in the storage system when the latter is new. This occurs because the cost of use is lower given that the system is new (Figure 13). The solar energy tries to supply the energy that is proportional to the one planned to be available (Figure 13), while the wind energy seeks to maintain a daily energy average dispatching at least a small portion of power in every moment (Figure 13).
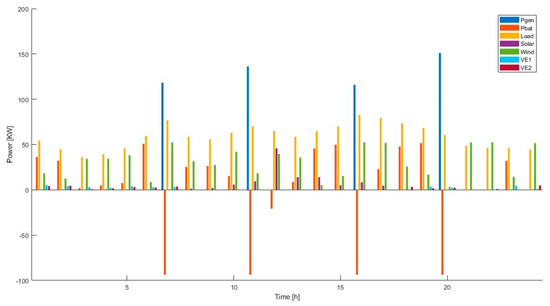
Figure 13.
Availability and dispatch of the MG when the battery bank is new.
Figure 13, Figure 14, Figure 15 and Figure 16 show the behavior of the storage system during their useful life (new, 30%, 60%, and end of useful life). Using this system is more expensive over time. This behavior can be observed taking into account the number of times the storage system is charged (power is negative) and discharged (power is positive) in a day.
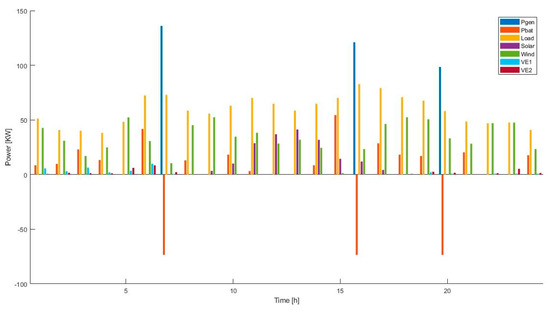
Figure 14.
Availability and dispatch of the MG with the storage system after the 30% of its useful life.
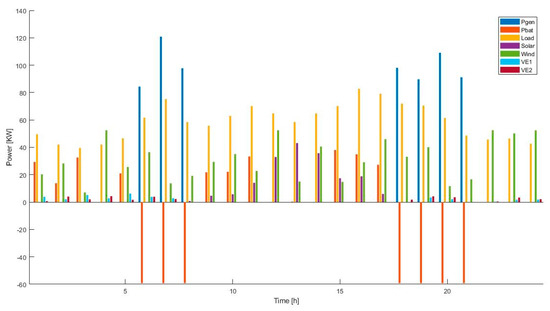
Figure 15.
Availability and dispatch of the MG with the storage system after the 60% of its useful life.
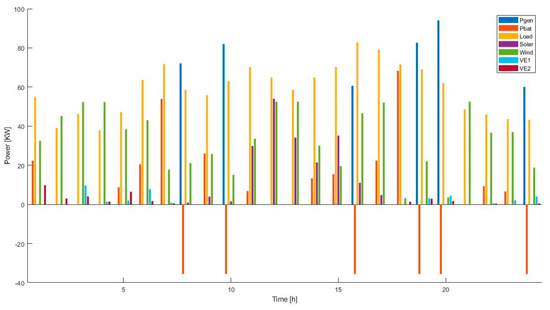
Figure 16.
Availability and dispatch of the MG with the storage system at the end of its useful life.
4.4. Total Operation Cost in Function of the Batteries Useful Life
As the storage system ages, the operation cost progressively increases (Figure 17). The increase is not necessarily linear, since there are some variations. These variations occur because the metaheuristic algorithms depend on the initial operating point that is required to be solved, and where one of the key factors is the batteries useful life, which makes that better or worse solutions appear in comparison with the expected ones.
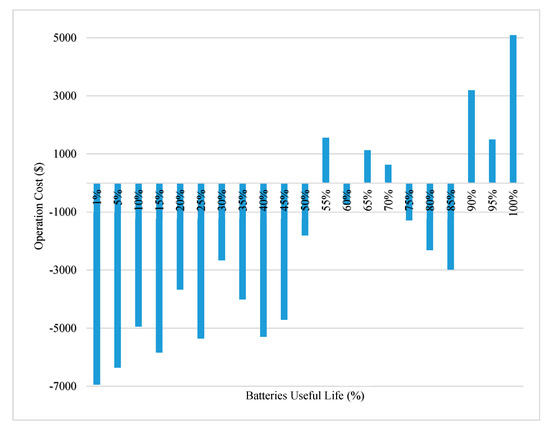
Figure 17.
Total optimal operation cost vs. batteries useful life.
The values presented in Figure 17 would be the costs incurred by operating the MG according to ageing of the storage system. In Figure 17, the negative values in the Y axis “cost” show that the dispatch is so efficient that it enables to supply the energy in a convenient cost (here, it is not considered the capital cost), and in doing so, it generates profits for the grid owner. On the other hand, the positive values of the cost imply operation charges to the owner of the grid. That is to say, as time passes, it is necessary to further refine the costs of overestimating and underestimating conditions in the uncertainty costs.
5. Conclusions
The development of the proposal in this paper is convenient for the people behind the operational planning of the MGs so as to improve MG’s functionality and to plan the power dispatch more appropriately. Giving this case, the operation of the system available can be optimized and can provide a better service for the customers.
Nowadays and due to the incentives to increase the use of renewable energies, the inclusion of the costs associated with the under- and overestimation costs makes this study relevant in the practical world, since it solves and avoids as far as possible the losses of money due to the intermittency of these types of energies.
Having in mind the objective of achieving an appropriate MG performance, future research should aim to expand the definition of the scheduling in these types of grids, especially when the system ages. For instance, it could include the cost associated with the loss of life of the energy storage to the operation cost and finding an appropriate operating point to obtain a longer life period.
When the storage system is new, the scheduling done by the proposed algorithm favors dispatching a greater part of the load of the MG with the storage system. On the other hand, the dispatch uses renewable energy sources and conventional ones but moderately. Nevertheless, when the system starts to age, it is noticed that the dispatch changes, since a greater dispatched amount of energy is renewable.
The penalization indicators associated with the under- and overestimation of the renewable energy availability is a key factor when looking for the minimum operating point. For that, in future studies, it would be necessary to evaluate which cost in the real life is associated with the under- and overestimating of the availability of these energies to implement improvements to the model used to find the minimum operation cost.
It can be seen that over time, and when the batteries deteriorate, the system is prone to behave as currently, dispatching all the renewable energy available and avoiding storage systems since there is a high cost for using them. It is worth mentioning that this behavior was seen in both wind and solar generation systems. In this way, this research gives a tool to the planning operator able to schedule the optimal operation point of the MG considering different time instances of the useful life of batteries.
Author Contributions
Conceptualization, C.B., S.R. and A.S.A.-S.; methodology, C.B., S.R. and A.S.A.-S.; validation, C.B.; formal analysis, C.B., S.R. and A.S.A.-S.; investigation, C.B., S.R. and A.S.A.-S.; resources, S.R.; data curation, S.R.; writing—original draft preparation, C.B., S.R. and A.S.A.-S.; writing—review and editing, C.B., S.R. and A.S.A.-S.; visualization, C.B., S.R. and A.S.A.-S.; funding acquisition, S.R. and A.S.A.-S. All authors have read and agreed to the published version of the manuscript.
Funding
Khalifa University.
Acknowledgments
This work was supported by Universidad Nacional de Colombia. Also, it is supported by Khalifa University under Award FSU-2018-25. Additionally, the authors would like to thank the Cyted Network: RED IBEROAMERICANA PARA EL DESAR-ROLLO Y LA INTEGRACION DE PEQUE ÑOSGENERADORES EOLICOS (MICRO-EOLO) for the data of micro wind modeling.
Conflicts of Interest
The authors declare no conflict of interest.
References
- Reddy, S.S.; Park, J.Y.; Jung, C.M. Optimal operation of microgrid using hybrid differential evolution and harmony search algorithm. Front. Energy 2016, 10, 355–362. [Google Scholar] [CrossRef]
- Bharothu, J.N.; Sridhar, M.; Rao, R.S. Modified adaptive differential evolution based optimal operation and security of AC-DC microgrid systems. Int. J. Electr. Power Energy Syst. 2018, 103, 185–202. [Google Scholar] [CrossRef]
- Kristoffersen, T.K.; Capion, K.; Meibom, P. Optimal charging of electric drive vehicles in a market environment. Appl. Energy 2011, 88, 1940–1948. [Google Scholar] [CrossRef]
- Li, H.-L.; Bai, X.-M.; Tan, W. Impacts of plug-in hybrid electric vehicles charging on distribution grid and smart charging. In Proceedings of the 2012 IEEE International Conference on Power System Technology (POWERCON), Auckland, New Zealand, 30 October–2 November 2012; pp. 1–5. [Google Scholar]
- Ma, Z.; Callaway, D.S.; Hiskens, I.A. Decentralized Charging Control of Large Populations of Plug-in Electric Vehicles. IEEE Trans. Control Syst. Technol. 2013, 21, 67–68. [Google Scholar] [CrossRef]
- Sheikhi, A.; Bahrami, S.; Ranjbar, A.; Oraee, H. Strategic charging method for plugged in hybrid electric vehicles in smart grids; a game theoretic approach. Int. J. Electr. Power Energy Syst. 2013, 53, 499–506. [Google Scholar] [CrossRef]
- Lasseter, R.H. MicroGrids. In Proceedings of the 2002 IEEE Power Engineering Society Winter Meeting. Conference Proceedings (Cat. No.02CH37309), New York, NY, USA, 27–31 January 2002; Volume 1, pp. 305–308. [Google Scholar]
- Zhao, B.; Zhang, X.; Chen, J.; Wang, C.; Guo, L. Operation Optimization of Standalone Microgrids Considering Lifetime Characteristics of Battery Energy Storage System. IEEE Trans. Sustain. Energy 2013, 4, 934–943. [Google Scholar] [CrossRef]
- Hernandez-Aramburo, C.; Green, T.C.; Mugniot, N. Fuel Consumption Minimization of a Microgrid. IEEE Trans. Ind. Appl. 2005, 41, 673–681. [Google Scholar] [CrossRef]
- Ross, M.; Hidalgo, R.; Abbey, C.; Joós, G. Energy storage system scheduling for an isolated microgrid. IET Renew. Power Gener. 2011, 5, 117–123. [Google Scholar] [CrossRef]
- Morais, H.; Kadar, P.; Faria, P.; Vale, Z.; Khodr, H. Optimal scheduling of a renewable micro-grid in an isolated load area using mixed-integer linear programming. Renew. Energy 2010, 35, 151–156. [Google Scholar] [CrossRef]
- Chen, S.X.; Gooi, H.B. Jump and Shift Method for Multi-Objective Optimization. IEEE Trans. Ind. Electron. 2011, 58, 4538–4548. [Google Scholar] [CrossRef]
- Chen, C.; Duan, S.; Cai, T.; Liu, B.; Hu, G. Smart energy management system for optimal microgrid economic operation. IET Renew. Power Gener. 2011, 5, 258–267. [Google Scholar] [CrossRef]
- Katsigiannis, Y.; Georgilakis, P.; Karapidakis, E. Multiobjective genetic algorithm solution to the optimum economic and environmental performance problem of small autonomous hybrid power systems with renewables. IET Renew. Power Gener. 2010, 4, 404. [Google Scholar] [CrossRef]
- Dufo-Lopez, R.; Bernal-Agustín, J.L. Multi-objective design of PV-wind-diesel-hydrogen-battery systems. Renew. Energy 2008, 33, 2559–2572. [Google Scholar] [CrossRef]
- Li, J.; Liu, F.; Wang, Z.; Low, S.H.; Mei, S. Optimal Power Flow in Stand-alone DC Microgrids. IEEE Trans. Power Syst. 2018, 33, 5496–5506. [Google Scholar] [CrossRef]
- IEEE PES Working Group on Modern Heuristic Optimization. Competition on ‘Application of Modern Heuristic Optimization Algorithms for Solving Optimal Power Flow Problems’. 2014. Available online: https://www.uni-due.de/imperia/md/content/ieee-wgmho/panel.pdf (accessed on 1 December 2019).
- Sauer, D.U.; Wenzl, H. Comparison of different approaches for lifetime prediction of electrochemical systems—Using lead-acid batteries as example. J. Power Sources 2008, 176, 534–546. [Google Scholar] [CrossRef]
- Kamankesh, H.; Agelidis, V.; Kavousi-Fard, A. Optimal scheduling of renewable micro-grids considering plug-in hybrid electric vehicle charging demand. Energy 2016, 100, 285–297. [Google Scholar] [CrossRef]
- Hetzer, J.; David, C.Y.; Bhattarai, K. An economic dispatch model incorporating wind power. IEEE Trans. Energy Convers. 2008, 23, 603–611. [Google Scholar] [CrossRef]
- Arévalo, J.; Santos, F.; Rivera, S. Application of Analytical Uncertainty Costs of Solar, Wind and Electric Vehicles in Optimal Power Dispatch. Ingeniería 2017, 22, 324–346. [Google Scholar] [CrossRef]
- Zhao, J.; Wen, F.; Dong, Z.Y.; Xue, Y.; Wong, K.P. Optimal Dispatch of Electric Vehicles and Wind Power Using Enhanced Particle Swarm Optimization. IEEE Trans. Ind. Informatics 2012, 8, 889–899. [Google Scholar] [CrossRef]
- Xu, Z.; Hu, Z.; Song, Y.; Zhao, W.; Zhang, Y. Coordination of PEVs charging across multiple aggregators. Appl. Energy 2014, 136, 582–589. [Google Scholar] [CrossRef]
- Liu, C.; Wang, X.; Wu, X.; Guo, J. Economic scheduling model of microgrid considering the lifetime of batteries. IET Gener. Transm. Distrib. 2017, 11, 759–767. [Google Scholar] [CrossRef]
- Katiraei, F.; Iravani, R.; Dimeas, A.; Hatziargyriou, N. Microgrids management. IEEE Power Energy Mag. 2008, 6, 54–65. [Google Scholar] [CrossRef]
- Arévalo, J.; Santos, F.; Rivera, S. Uncertainty cost functions for solar photovoltaic generation, wind energy generation, and plug-in electric vehicles: Mathematical expected value and verification by Monte Carlo simulation. Int. J. Power Energy Convers. 2019, 10, 171–207. [Google Scholar] [CrossRef]
- Garcia-Torres, F.; Bordons, C. Optimal Economical Schedule of Hydrogen-Based Microgrids with Hybrid Storage Using Model Predictive Control. IEEE Trans. Ind. Electron. 2015, 62, 5195–5207. [Google Scholar] [CrossRef]
- Arabali, A.; Ghofrani, M.; Fadali, M.S.; Baghzouz, Y. Genetic-Algorithm-Based Optimization Approach for Energy Management. IEEE Trans. Power Deliv. 2013, 28, 162–170. [Google Scholar] [CrossRef]
- Bahramirad, S.; Reder, W.; Khodaei, A. Reliability-Constrained Optimal Sizing of Energy Storage System in a Microgrid. IEEE Trans. Smart Grid 2012, 3, 2056–2062. [Google Scholar] [CrossRef]
- Carpinelli, G.; Mottola, F.; Proto, D.; Russo, A. A Multi-Objective Approach for Microgrid Scheduling. IEEE Trans. Smart Grid 2017, 8, 2109–2118. [Google Scholar] [CrossRef]
- Teleke, S.; Baran, M.E.; Huang, A.Q.; Bhattacharya, S.; Anderson, L. Control Strategies for Battery Energy Storage for Wind Farm Dispatching. IEEE Trans. Energy Convers. 2009, 24, 725–732. [Google Scholar] [CrossRef]
- Mercier, P.; Cherkaoui, R.; Oudalov, A. Optimizing a Battery Energy Storage System for Frequency Control Application in an Isolated Power System. IEEE Trans. Power Syst. 2009, 24, 1469–1477. [Google Scholar] [CrossRef]
- Hussain, A.; Kim, H.-M.; Baek, J.-W.; Kim, H.-M. Stationary Energy Storage System for Fast EV Charging Stations: Simultaneous Sizing of Battery and Converter. Energies 2019, 12, 4516. [Google Scholar] [CrossRef]
- Serpi, A.; Porru, M. Modelling and Design of Real-Time Energy Management Systems for Fuel Cell/Battery Electric Vehicles. Energies 2019, 12, 4260. [Google Scholar] [CrossRef]
- Berglund, F.; Zaferanlouei, S.; Korpås, M.; Uhlen, K. Optimal Operation of Battery Storage for a Subscribed Capacity-Based Power Tariff Prosumer—A Norwegian Case Study. Energies 2019, 12, 4450. [Google Scholar] [CrossRef]
- Sikorski, T.; Jasiński, M.; Ropuszyńska-Surma, E.; Węglarz, M.; Kaczorowska, D.; Kostyla, P.; Leonowicz, Z.; Lis, R.A.; Rezmer, J.; Rojewski, W.; et al. A Case Study on Distributed Energy Resources and Energy-Storage Systems in a Virtual Power Plant Concept: Economic Aspects. Energies 2019, 12, 4447. [Google Scholar] [CrossRef]
- Castellazzi, A.; Gurpinar, E.; Wang, Z.; Suliman Hussein, A.; Garcia Fernandez, P. Impact of Wide-Bandgap Technology on Renewable Energy and Smart-Grid Power Conversion Applications Including Storage. Energies 2019, 12, 4462. [Google Scholar] [CrossRef]
- Martinez, N.; Benchaabane, Y.; Silva, R.E.; Ilinca, A.; Ibrahim, H.; Chandra, A.; Rousse, D. Computer Model for a Wind–Diesel Hybrid System with Compressed Air Energy Storage. Energies 2019, 12, 3542. [Google Scholar] [CrossRef]
- Zhang, Q.; Ren, Z.; Ma, R.; Tang, M.; Wang, X. Research on Double-Layer Optimized Configuration of Multi-Energy Storage in Regional Integrated Energy System with Connected Distributed Wind Power. Energies 2019, 12, 3964. [Google Scholar] [CrossRef]
- Jankowiak, C.; Zacharopoulos, A.; Brandoni, C.; Keatley, P.; MacArtain, P.; Hewitt, N. The role of domestic integrated battery energy storage systemsfor electricity network performance enhancement. Energies 2019, 12, 3954. [Google Scholar] [CrossRef]
© 2020 by the authors. Licensee MDPI, Basel, Switzerland. This article is an open access article distributed under the terms and conditions of the Creative Commons Attribution (CC BY) license (http://creativecommons.org/licenses/by/4.0/).