1. Introduction
After global consensus on transforming our world at the Summit of the United Nations (UN) on September 25, 2015, consisting of 17 sustainable development objectives and 169 targets to be obtained until 2030 by all 193 countries, it is the researchers’ mission to step into this road map and materialize its goals. In this way, the first step is to stop wasting energy or harvesting energy from a source of wasting energy. By surveying through industries, one may identify many of them, but indeed, the city gate stations (CGS) and/or town border stations (TBS) that are responsible for providing natural gas (NG) to the domestic or industrial consumer at required consumption pressure can be recognized as the most important one. The reason has lied behind the huge amount of NG consumption all over the world. Just in the US, NG consumption increased by 12 percent in 2018, reaching a record high of 82.1 billion cubic feet (about 2.32 billion cubic meters) per day [
1]. In the era of renewable energy, NG is still playing an important role in driving the gears of industries and domestic usage as well. Actually, the reason is not limited to the high rate of consumption but also supported by a large amount of exergy loss occurring in regulators in CGS. Although fluid potential in the form of kinetic and pressure can produce mechanical work or equivalently electrical energy, except a few prototypes, however, a major part of industries including CGS/TBS and letdown stations still have used regulators or throttling valves to reduce pressure. Until 2007, in all of Iran’s CGSs, with a yearly average mass flow rate of 90.5 kg/s and average energy destruction is 13,240 kW, enormous pressure exergy was wasted to the environment in regulators [
2]. Seeking into very recent researches for the most relevant studies results in the following works.
Several analyses on high-pressure pipeline NG exergy was started from 1995 by Bisio [
3]. According to his work, the use of NG pressure exergy to compress recovery steam and the use of the refrigeration thermal energy of compressed air to heat NG were two possible utilizations that can be considered for the NG transportation pipeline. In 2016, Jie et al. [
4] also developed and tested cryogenic hydraulic turbines as a replacement of Joule-Thomson valves and reported that it improves Liquified Natural Gas (LNG) production by an average of 2% and generates a power of 8.3 kW. However, the idea of exploiting expansion turbines and/or turboexpanders in NG CGS/TBS to generate electricity has been presented in some studies [
5,
6,
7,
8,
9]. Taleshian et al. [
10] presented a simple model for turboexpanders in a MATLAB environment to investigate electrical waveforms flicker due to variation in input pressure or mass flow rate. The implementation of energy harvesting from high-pressure NG pipelines goes back to only one decade ago. There were no known commercial turboexpander installations generating electricity at city gates in the U.S. pipeline system until 2008, according to the Interstate Natural Gas Association of America, Washington DC, USA (INGAA) [
11]. With a techno-economic appraisal on turboexpander applications in NG pipelines, Kuczyński et al. [
12] concluded that the key item that negatively affects the turboexpander application economy is seasonal fluctuations in NG consumption. Their assessment showed that, by a deviation of NG flow rate from its nominal value (in summer less and in winter more than the nominal value) at which expander efficiency is maximum, the electricity generation drastically drops down due to the decrease in turboexpander efficiency. Neseli et al. [
13] analyzed a case study of the electricity generation with turboexpanders in a CGS located in Izmir, Turkey with an energy and exergy assessment while considering steady state calculations based on a set flow rate, inlet and outlet gas conditions for conventional boilers, heat exchanger, and turboexpander. In addition, Kostowski et al. [
14] integrated the thermo-economic analysis with the theory of thermo-ecological costs for thermodynamic evaluations of the electricity production in the process of NG transmissions at CGS. They added a combined heat and power (CHP) module with a performance ratio of 89.5% and an exergy efficiency of 49.2% to existing plants and concluded that the thermo-ecological cost of the expanders’ electricity generation was at 2.42 kJ. Kostowski and Usón [
15] also surveyed an expansion system in CGS integrated with a co-generation unit consisting of two turboexpander stages. They reported that, since the unit cost of electricity produced in turboexpanders is higher than the unit cost of electricity generated in the CHP module, attention should be focused on the former. The combined heat and power (CHP) scenario was also among the remedies for energy harvesting from CGS/TBS [
16]. Borelli et al. [
17], likewise, investigated a system of turboexpander-generators combined in a CHP plant that supplies a district heating network built in Genoa in order to save energy and reduce CO2 emissions. By using a numerical modeling simulator, they showed that almost 2.9 GWh/year electricity will be generated in the turboexpanders from the pressure drop between the main supply line and the city natural gas network. In more recent work, Borelli et al. [
18] studied the possibility of integrating a CGS with low-temperature heat sources for energy harvesting from NG by implementing turboexpander technology. For this purpose, they presented a novel plant configuration consisting of a two-stage expansion system and analyzed it by numerical dynamic simulations. Babasola [
19] studied the direct fuel cell waste energy recovery and power generation system for pressure letdown stations. He considered integrated turboexpanders and a direct internal reforming molten carbonate fuel cell system in a combined circle to replace traditional pressure regulating systems on city gates. He also reported that the power output of the turboexpander strongly depends on the NG flowrate, temperature, and pressure. Some studies also dealt with the expander-depending NG pressure regulation configuration [
20] and screw expander [
21], which can regulate the NG pressure and harvest the pressure energy as well. With a multi-objective optimization model, Cascio et al. [
22] integrated electrical, thermal, and NG grids in which the main system consisted of a retrofitted NG CGS where a turboexpander was employed for energy harvesting from the process. Their numerical simulation results, obtained with the commercial proprietary software Honeywell UniSim Design Suite, showed that an operational costs reduction of about 17% can be achieved with respect to thermal-load-tracking control logic. Arabkoohsar et al. [
23] also proposed a turboexpander and solar heating set to reduce the heater fuel consumption for a new design of NG letdown stations, and thereby, the net present value analysis method would result in 3.5 years of payback ratio for investment period. Ghaebi et al. [
24] presented a new combination system for energy harvesting from NG letdown stations. They analyzed combined systems of CGS and the Rankine cycle for simultaneous power and hydrogen production. In their thermodynamic modeling, outlet energy of NG is used for power and hydrogen production by employing Rankine cycle (RC), absorption power cycle (APC) and proton exchange membrane PEM electrolyzers. They calculated the overall exergy efficiency of the combined CGS/PEM-RC system up to 47.9%. Zabihi and Taghizadeh [
25] simulated a CGS with a nominal capacity of 120,000 SCMH using HYSYS software for energy harvesting by turboexpanders and concluded that the pressure energy of NG lost during regulation was 7.1 GWh, and the annual turboexpander electricity production was computed to be 3.2 GWh. The reciprocating expansion engines were also proposed by Farzaneh-Gord et al. [
26] as well for energy harvesting from the pressure reduction process in TBS. After a comprehensive survey in scientific repositories, however, Tesla turbines are still missed from being a candidate for energy harvesting tools in CGS/TBS, and hence, it became the motivation of this study to check its capability in the sought specific application. As it is also approved by the experimental investigation [
27], the Tesla turbine (TT) has also low power applications, which made this motivation stronger. Actually, this feature confers flexibility to TTs and makes it applicable to a wide range of operating powers.
The main objective of this research is to show, for the first time, the TT capability as one of the sturdy alternatives for throttling/expansion valves (TV/EV), particularly for those industries possessing high-pressure lines such as NG CGS in which high-pressure gas has to be delivered to the consumers at low specified pressure levels. This objective is also aligned with two pillars of sustainable development, namely economic and environment, while it intends to manage the consumption of energy resources by harvesting wasted energy through EV. Due to having higher exergy, industries having high-pressure lines, such as CGS/TBS/letdown stations, cold stores, heat pump/refrigeration cycles (both vapor compression and absorption cycles), and air condition systems, have more priority to serve as the best candidates for wasted-energy harvesting. It should be mentioned that, in industries, EV may have other names, such as regulators, capillary tubes, and throttling valves, as well.
In addition, the inherent operational/commissioning problems of high-pressure EV contributed to the motivation of this study to propose TT in order to be substituted with EV. The maintenance and troubleshooting of EV are time-consuming, complicated, and costly. Most of the time, high-pressure carrier fluid is flammable or toxic, and the leakage in EVs can result in a terrible disaster. In order to avoid these problems, EV manufacturing requires higher technology, more sophisticated considerations, and/or spend more money on different architectures and material selections, which indeed affect their cost and price. Hence, to retrieve wasted energy, and at the same time, to leave no probability for hazardous risky conditions and eliminate all the involving problems related to EV, a TT is introduced to be employed for this situation and produce power. For the industries having a refrigeration cycle as well as an air-conditioning system, implementation of a TT will help to also enhance the coefficient of performance (COP).
Moreover, by focusing on important investigations tackling TT applications from when Nikola Tesla patented his masterpiece as a bladeless turbine in 1913 [
28] until now, one may reveal that the TT would be one of the best choices for an organic Rankine cycle (ORC) [
29,
30,
31] and can serve as a green energy generator inside water supply systems [
32,
33]. Literature has mentioned its application as a power generation [
34,
35], as well as its utilization in geothermal energy [
36]. Surprisingly, as it is reported [
37], before 2006, the TT was not commercially employed. It implies that the TT emerged from computations on articles to the real world in around only one decade. Incompressible carrier fluid were employed to establish a performance relationship with other design parameters in experimental [
38] and computational [
33,
39] studies. Additionally, a closed-form analytical solution was extracted for 2D analysis of incompressible fluid flow through rotating discs as a simplified form of TT configuration [
40]. In this way, in two separate experimental-analytical studies, Rice [
41,
42] addressed a TT and Tesla pump/compressor, which are now considered as a benchmark work in literature.
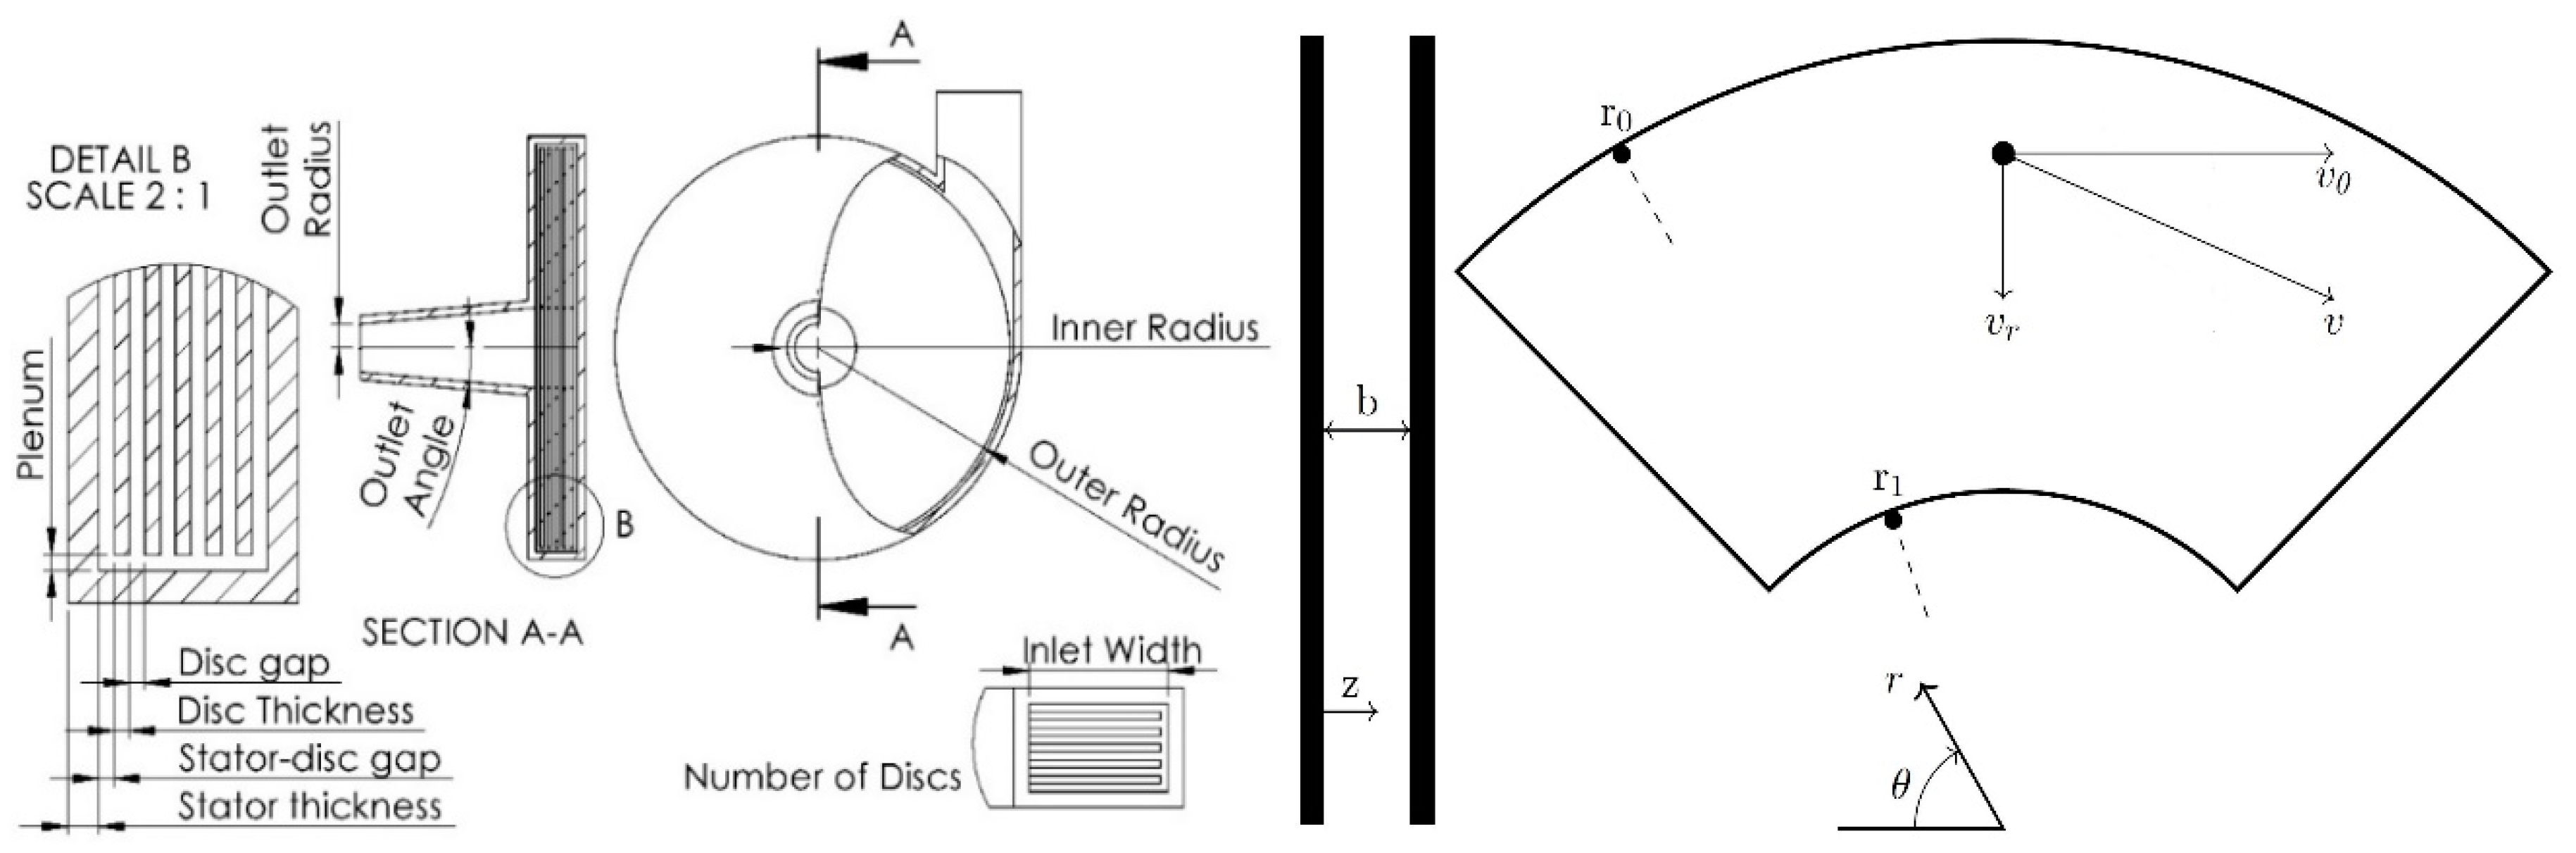
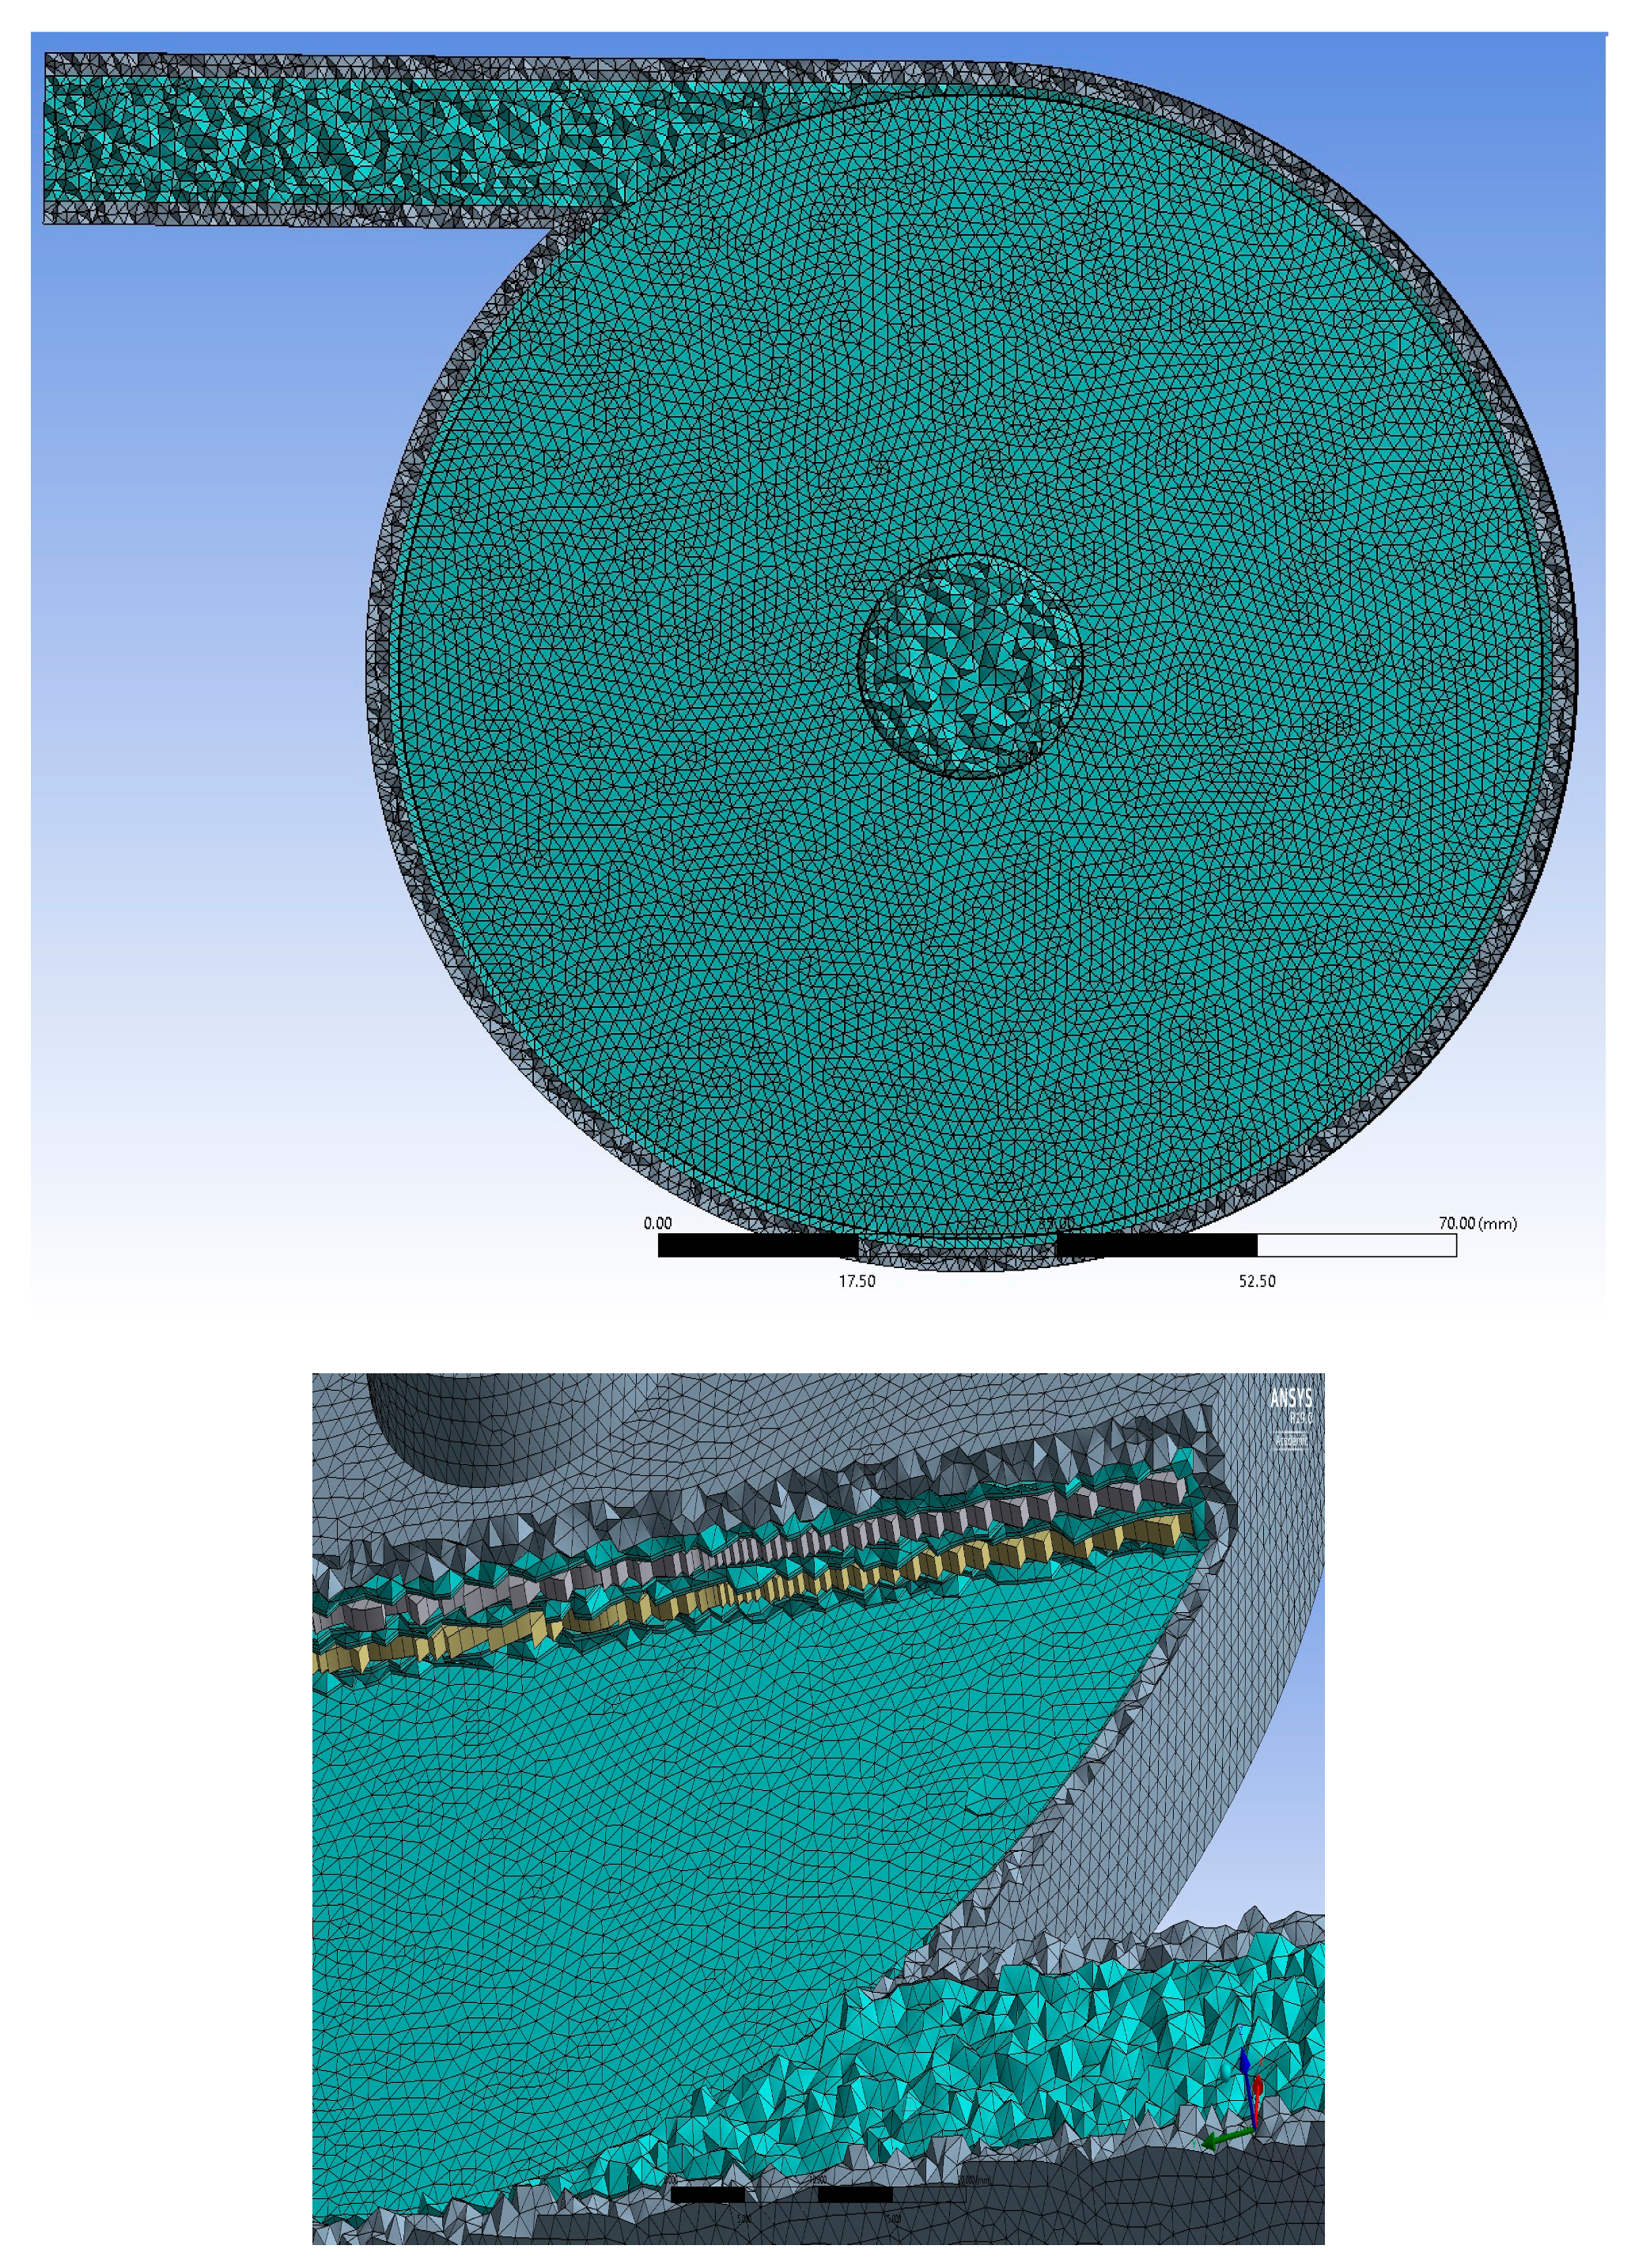
The most important innovation proposed in this article is the use of a Tesla turbine (TT) as an alternative to a conventional expansion valve (EV), namely those used in city gate stations on high-pressure NG pipelines. The advantages of the TT, when compared with the conventional, passive EV, are the possibility to produce useful power as a result of the expansion process (instead of just dissipating it, as happens with the EV). In addition, the expanded gas temperature reduction is not so dramatic as in the EV due to the friction between the gas and the turbine discs, minimizing the need for defrosting, a well-known handicap of the currently used EV. In summary, the use of a TT as a high-pressure gas expansion device not only reduces energy consumption (for defrosting) but even increases its production through the useful work produced. Hence, this study proposes the TT as one of the sturdy candidates to be substituted with EVs, especially on high-pressure lines for harvesting energy, which, at the same time, eliminates all maintenance, troubleshooting, and operational problems, as well as the risks of EVs at the same time. In order to show the TT’s potent and capability for this situation, thermohydrodynamic analysis of a Tesla turbine (TT) operated with high-pressure compressible NG (60 bar) under different configurations and operational conditions was developed, and the results were organized in order to support the turbine design aiming to maximize the output power. For this reason, a 3D geometric configuration was developed, and different variations were considered by changing the disk diameter, as well as the size of the inter-disc gap. A computational fluid dynamics (CFD) model was implemented on a well-established software package (ANSYS Fluent) capable of reproducing the TT geometrical configuration for a simulation of steady-state compressible fluid flow and heat transfer by the finite volume method (FVM) under different operational conditions. The TT geometry and the definition of its different components, as well as coordinate system and some dynamic variables, are presented in
Figure 1. For reporting the result, a 3D cylindrical coordinate system was adopted.
The inlet duct has a square cross-section area of 120 mm
2 and guides fluid flow tangential to the rotor, while a conical outlet duct has an angle 5°, and the outlet radius is set to be 0.6r
1. The values of the design parameters are given in
Table 1.
3. Results and Discussion
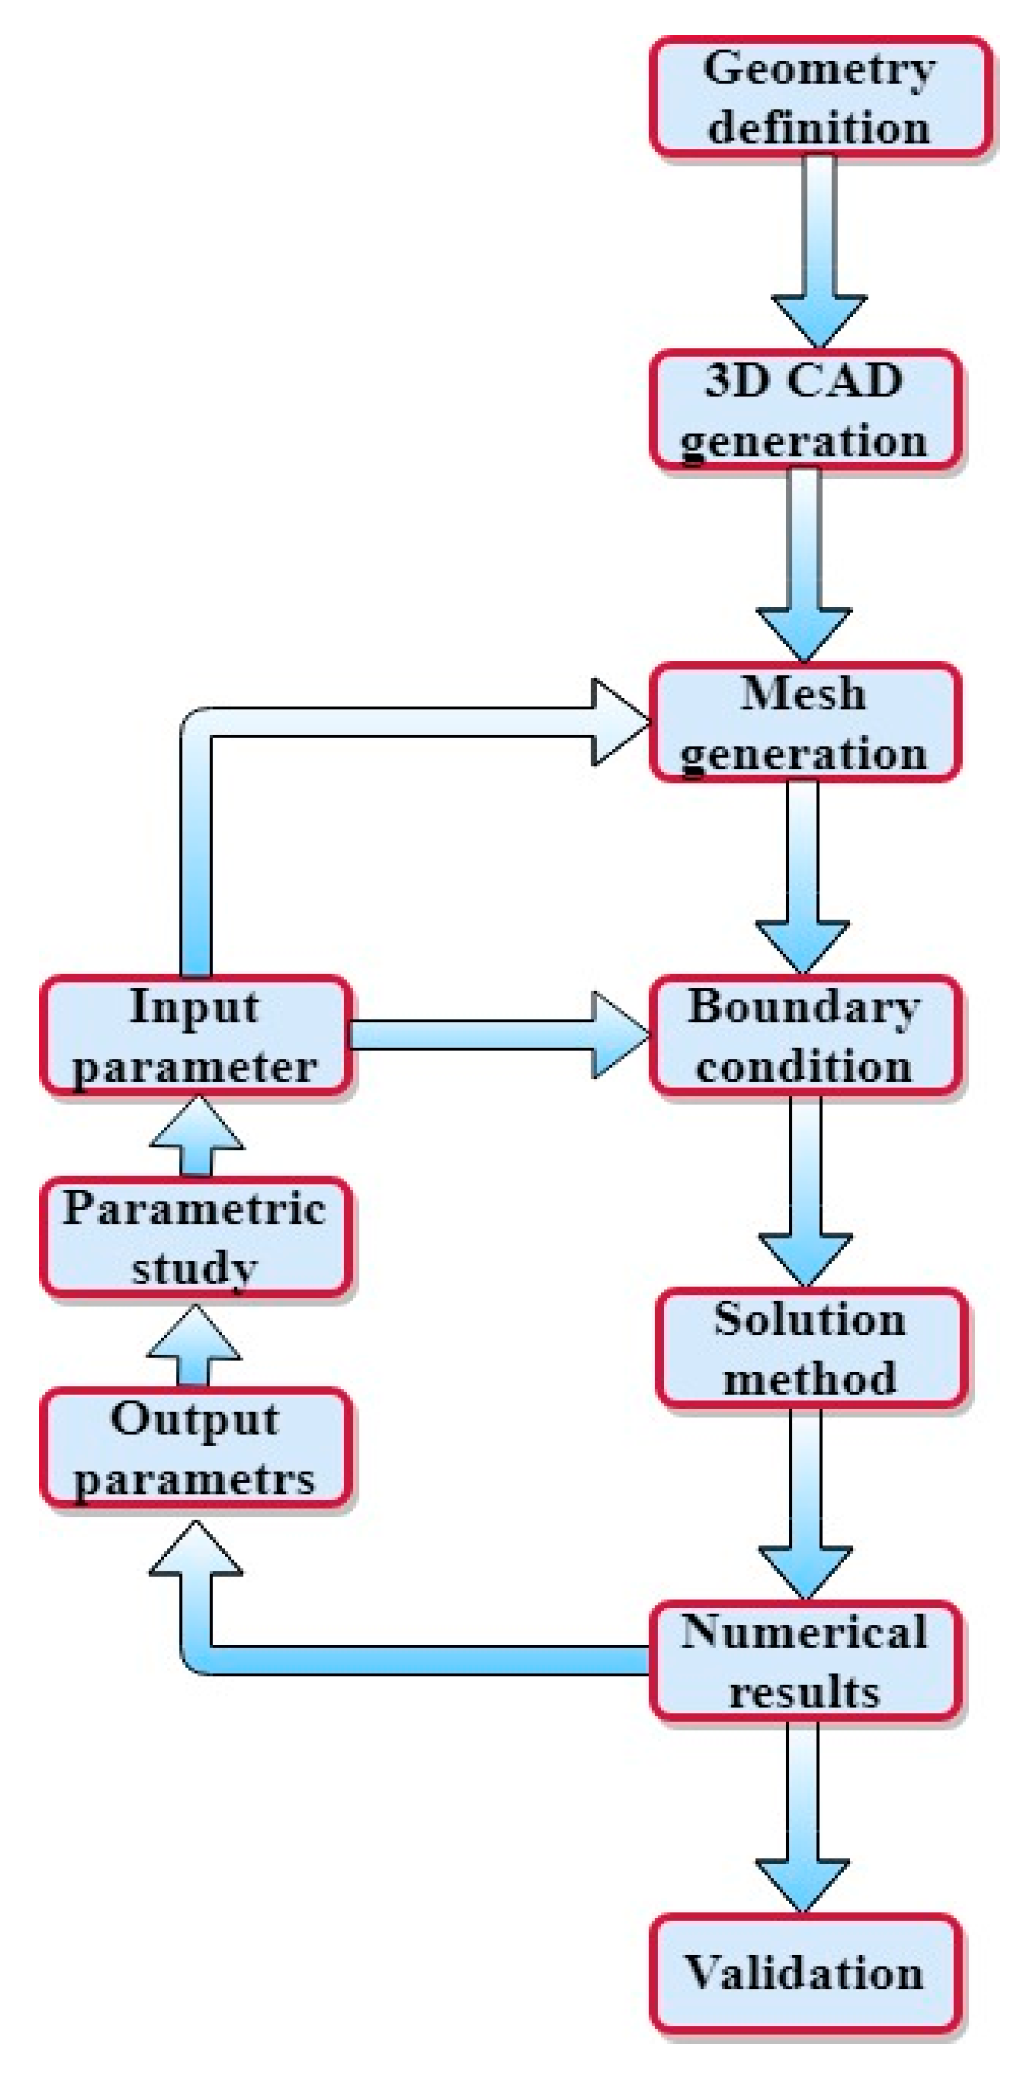
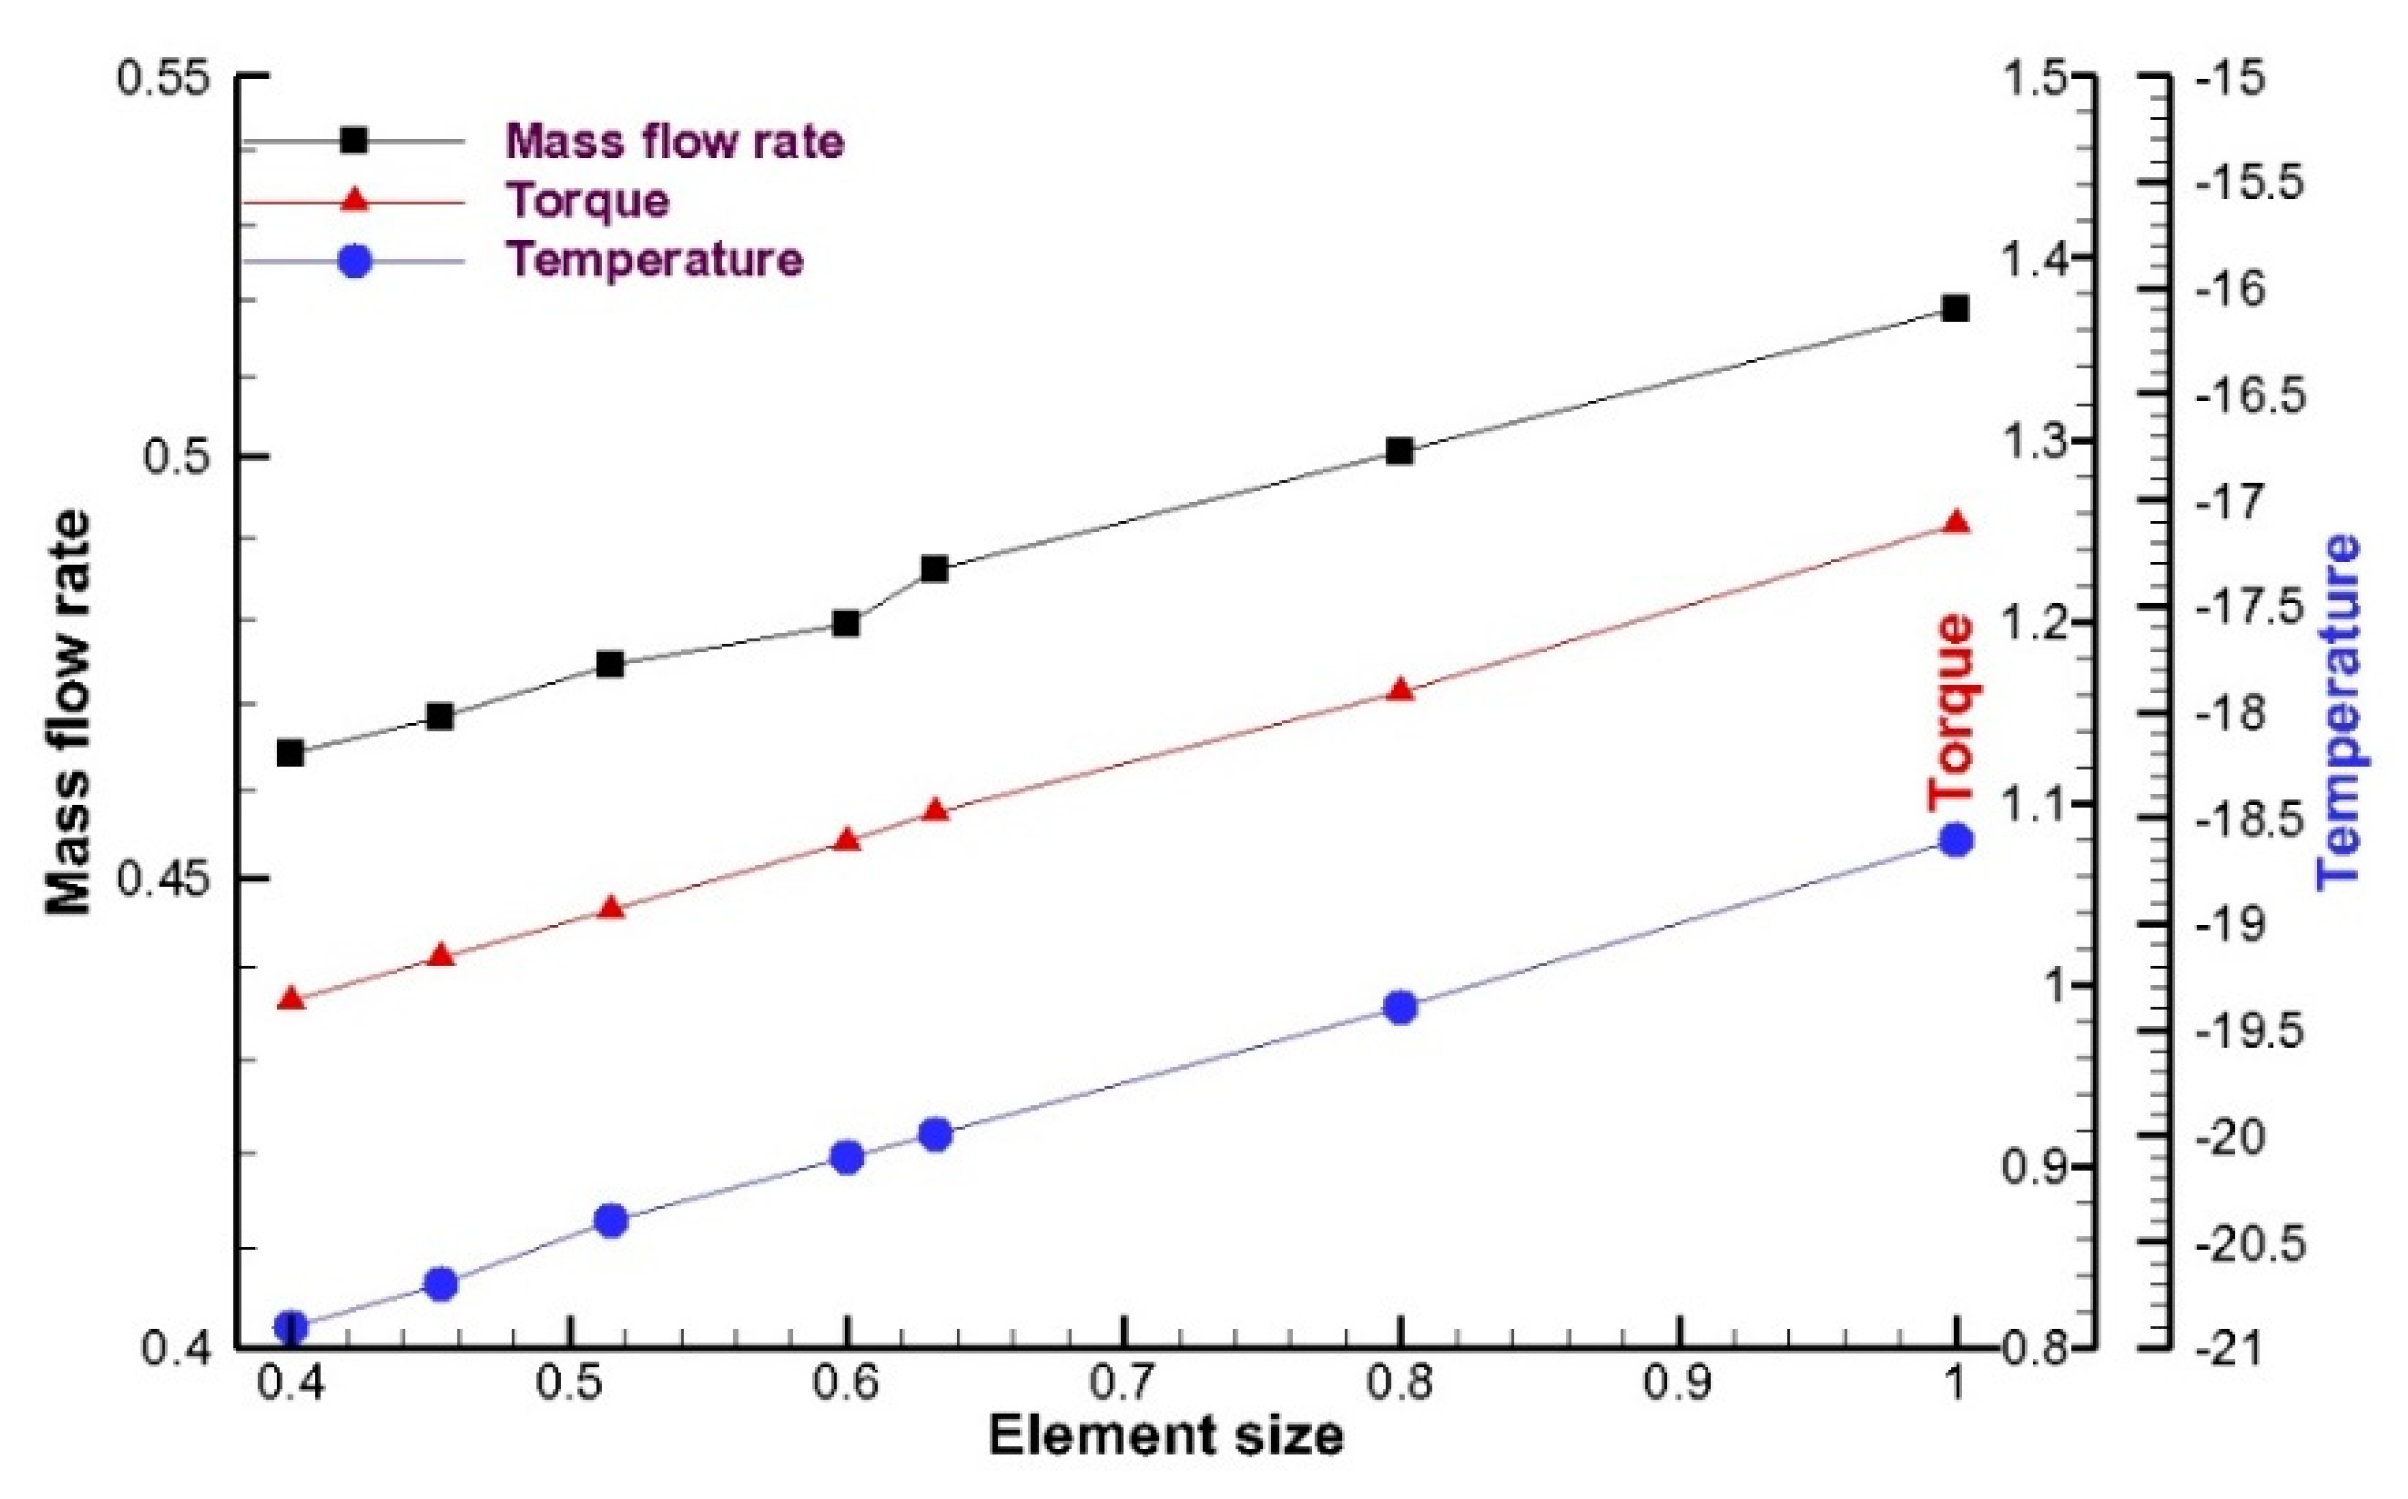
This section is dedicated to the numerical results getting from ANSYS commercial software and their interpretation to provide extensive data for proving TT as one of the best alternatives to be substituted by expansion valves, as well as presenting engineers a guideline to perform an optimum design for a TT. The eleven different configurations of the TT running with high-pressure compressible methane have been considered in different disc’s angular velocities. It is started with the influence of operational parameters on the TT performance. Operational parameters that will be discussed would be rotor output power, mass flow rate, outlet temperature, velocity profile, and pressure contour. After applying the boundary conditions and setting all parameters, iteration was terminated when all residuals fell below the residual convergence criteria. After convergence, numerical results were plotted and are displayed as follows.
The legend of figures is presented in the RxBx format, where Rx refers to the disc outer radius value in millimeters and Bx refers to the disc gap value in millimeters. For example, R75B0.5 refers to a simulation where the disc gap is 0.5 mm and the outer radius is 75 mm. The RxBx format might be used to refer to as a TT geometry or a series of tests where ro and b are kept constant. With ANSYS Fluent, it is possible to visualize a certain property of the flow across lines or planes. In order to get a better grasp of what is happening inside the turbine, two planes were defined. First, an XY plane parallel to the disc’s surface that is in the middle of the gap of the second and third discs. This plane permits a clear visualization of the flow in between the discs. The second plane is a ZY plane that contains the TT axis and is normal to the inlet, which displays well the flow in the outlet.
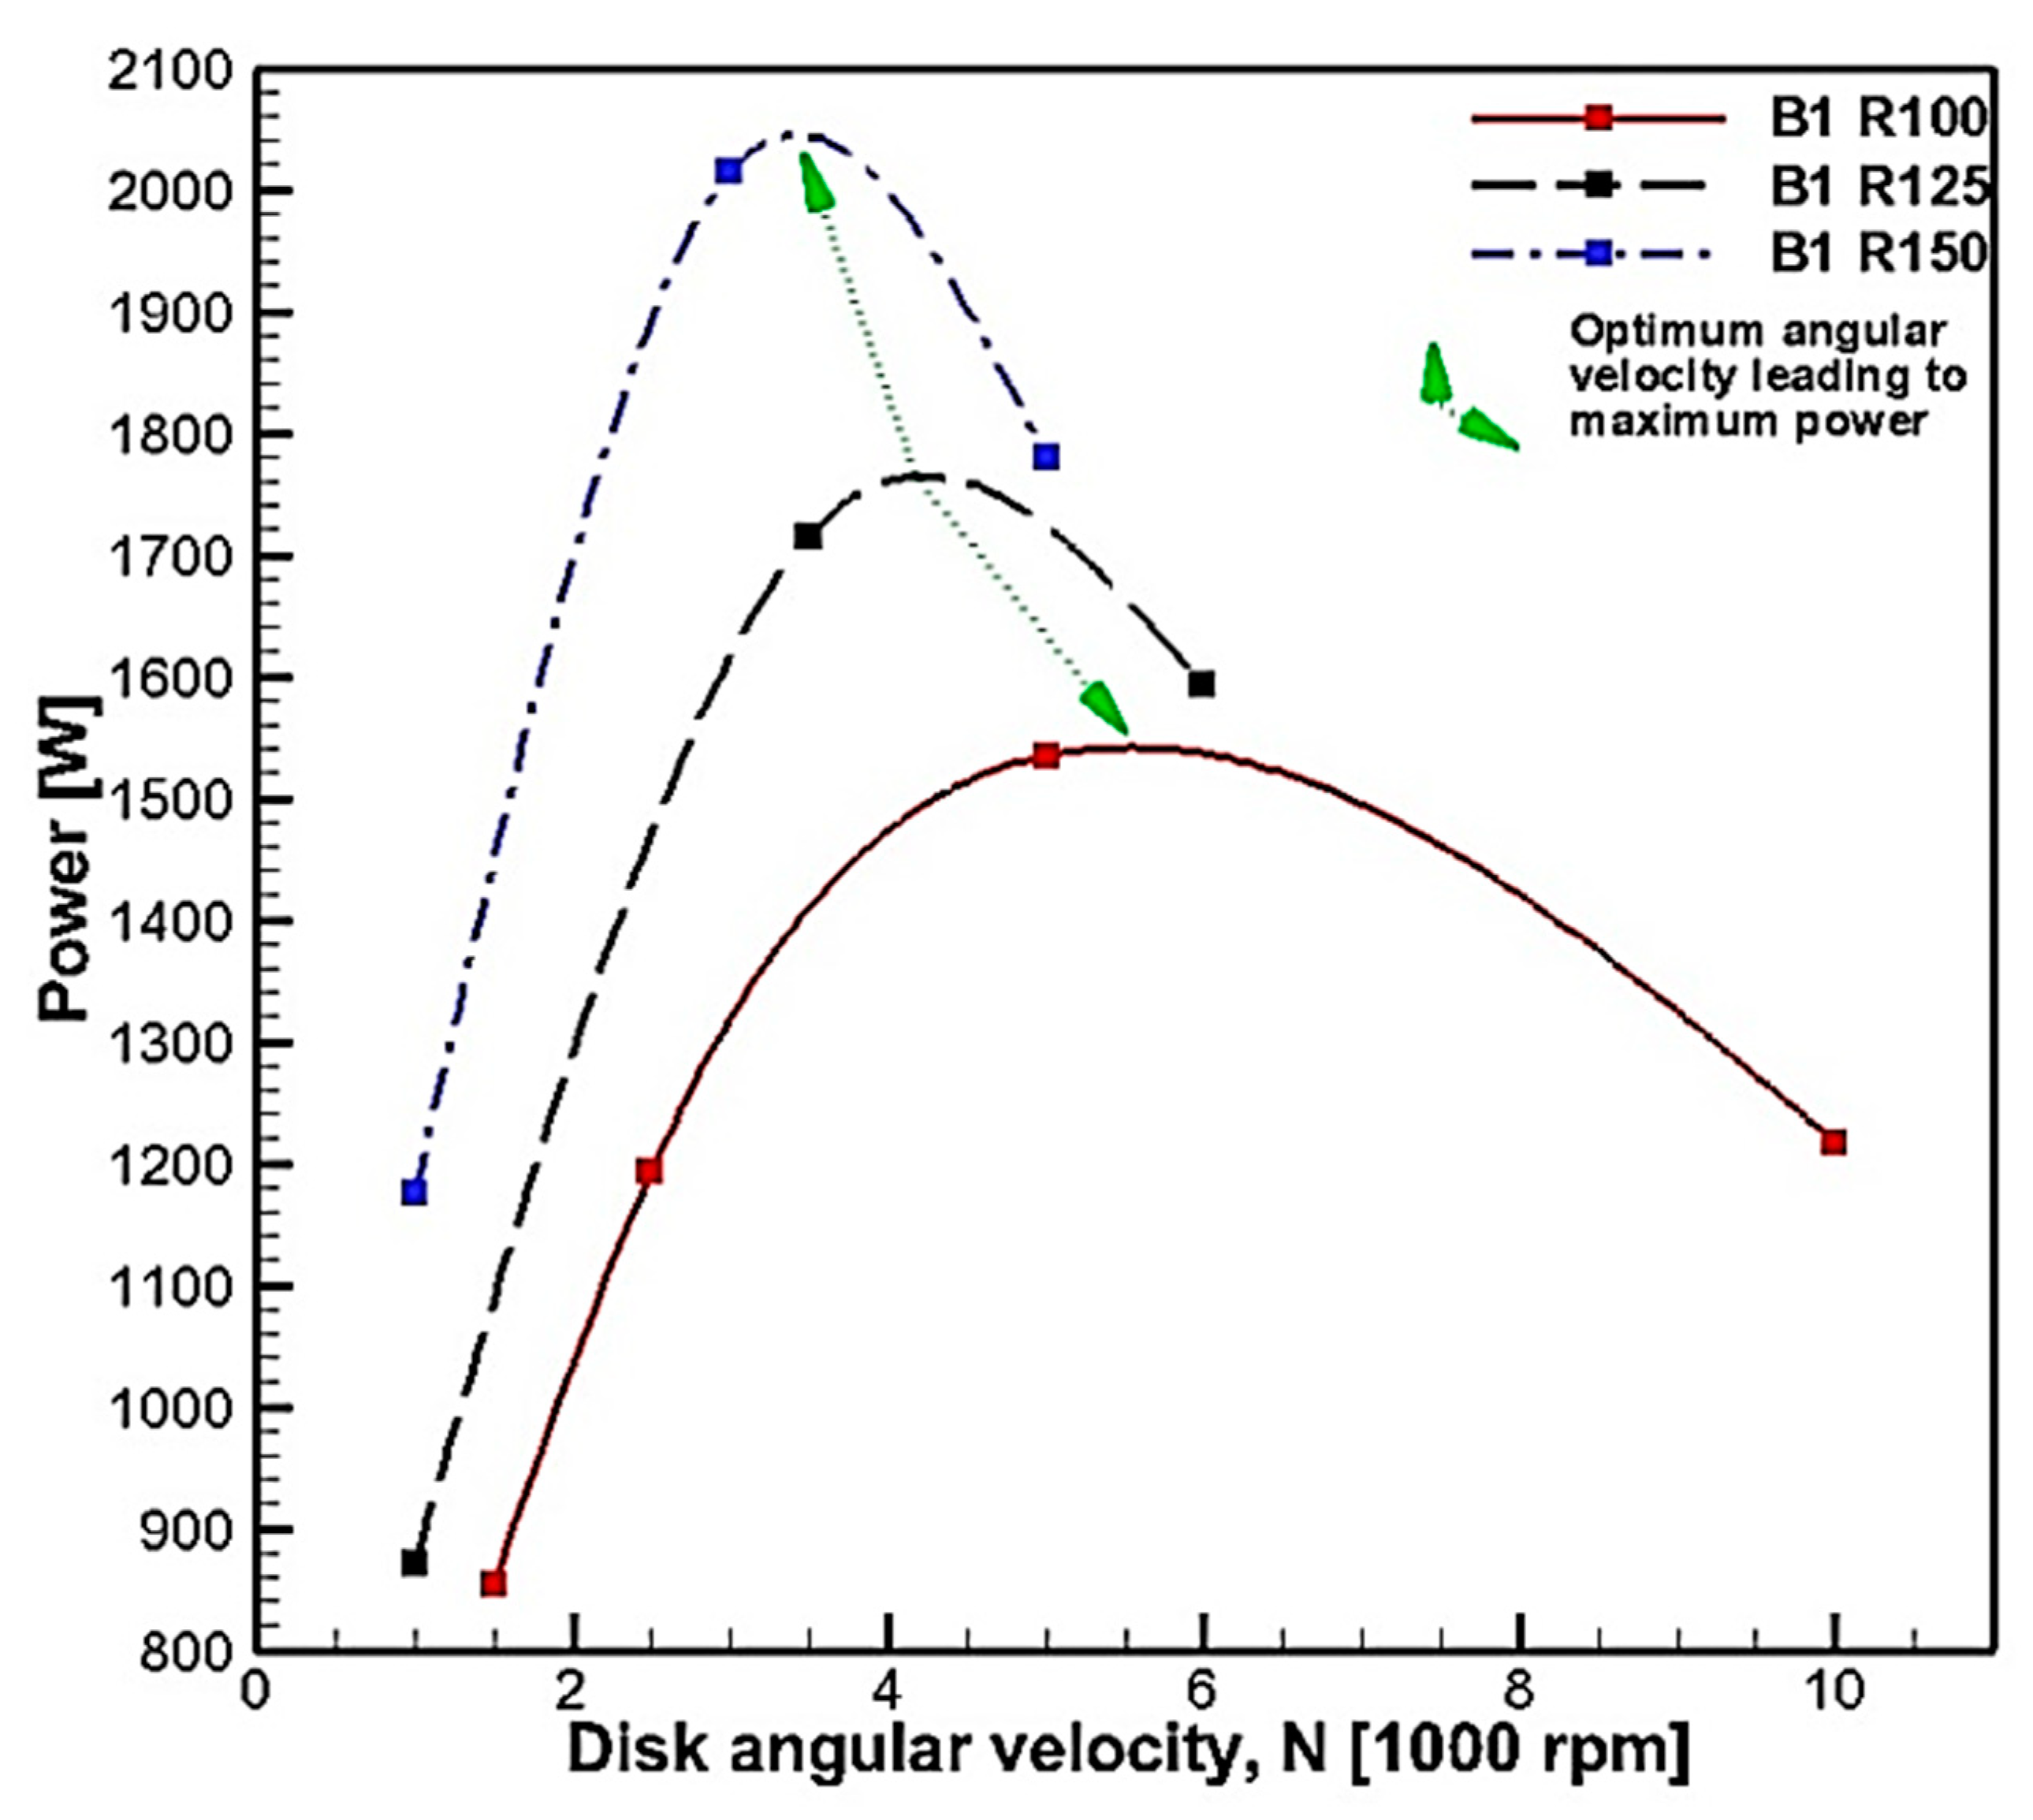
The thermodynamic analysis of the TT is begun with generated power by the TT in different disk angular velocities and with different disk dimensions. As is depicted in
Figure 5, the TT shows a nonmonotonic characteristic on the variation of generated power with disk rotational speed. The generated power characteristic curve displays a negative curvature, which implies a curve having a maximum. It means there is a specific rotational speed, which is the so-called “optimum speed”, at which the TT generated power becomes the maximum. Li et al. [
38] also reported the same characteristic for the efficiency of a TT running with an incompressible carrier fluid in his experimental study. This optimum speed is not fixed but depends on the TT dimension (disk outer diameter), such that optimum speed decreases by increasing the disk diameter, and the magnitude of output power at the optimum point increases by decreasing the TT size. Moreover, the gradient of the characteristic curve of generated power for a bigger TT is higher, which means generated power will decrease faster for a bigger TT by changing the disk angular velocity, while, for smaller a TT, this variation will be slower and with a lower gradient. This feature warns us about the sensitivity of a larger TT with respect to an angular velocity near its optimum point.
In addition, the magnitude of maximum power corresponding to optimum speed varies by the TT dimensions, such that the magnitude of maximum power will increase by increasing disk diameter. This fact needs to be considered as a design rule for the TT. For the configuration of B1R150, the generated power exceeds 2000 W, while for the small TT B1R100, it goes up to 1500 W. This amount of power in 24/7 working conditions will be equal to 1440 kWh energy. The importance of this amount of generated power from wasted energy through an expansion valve can be clearer by comparing it with another technology of power generators, such as renewable photovoltaic (PV) solar cells.
Table 7 provides the equivalent benefits of a TT generated power by considering the climate condition of two cities of Munich and Toronto.
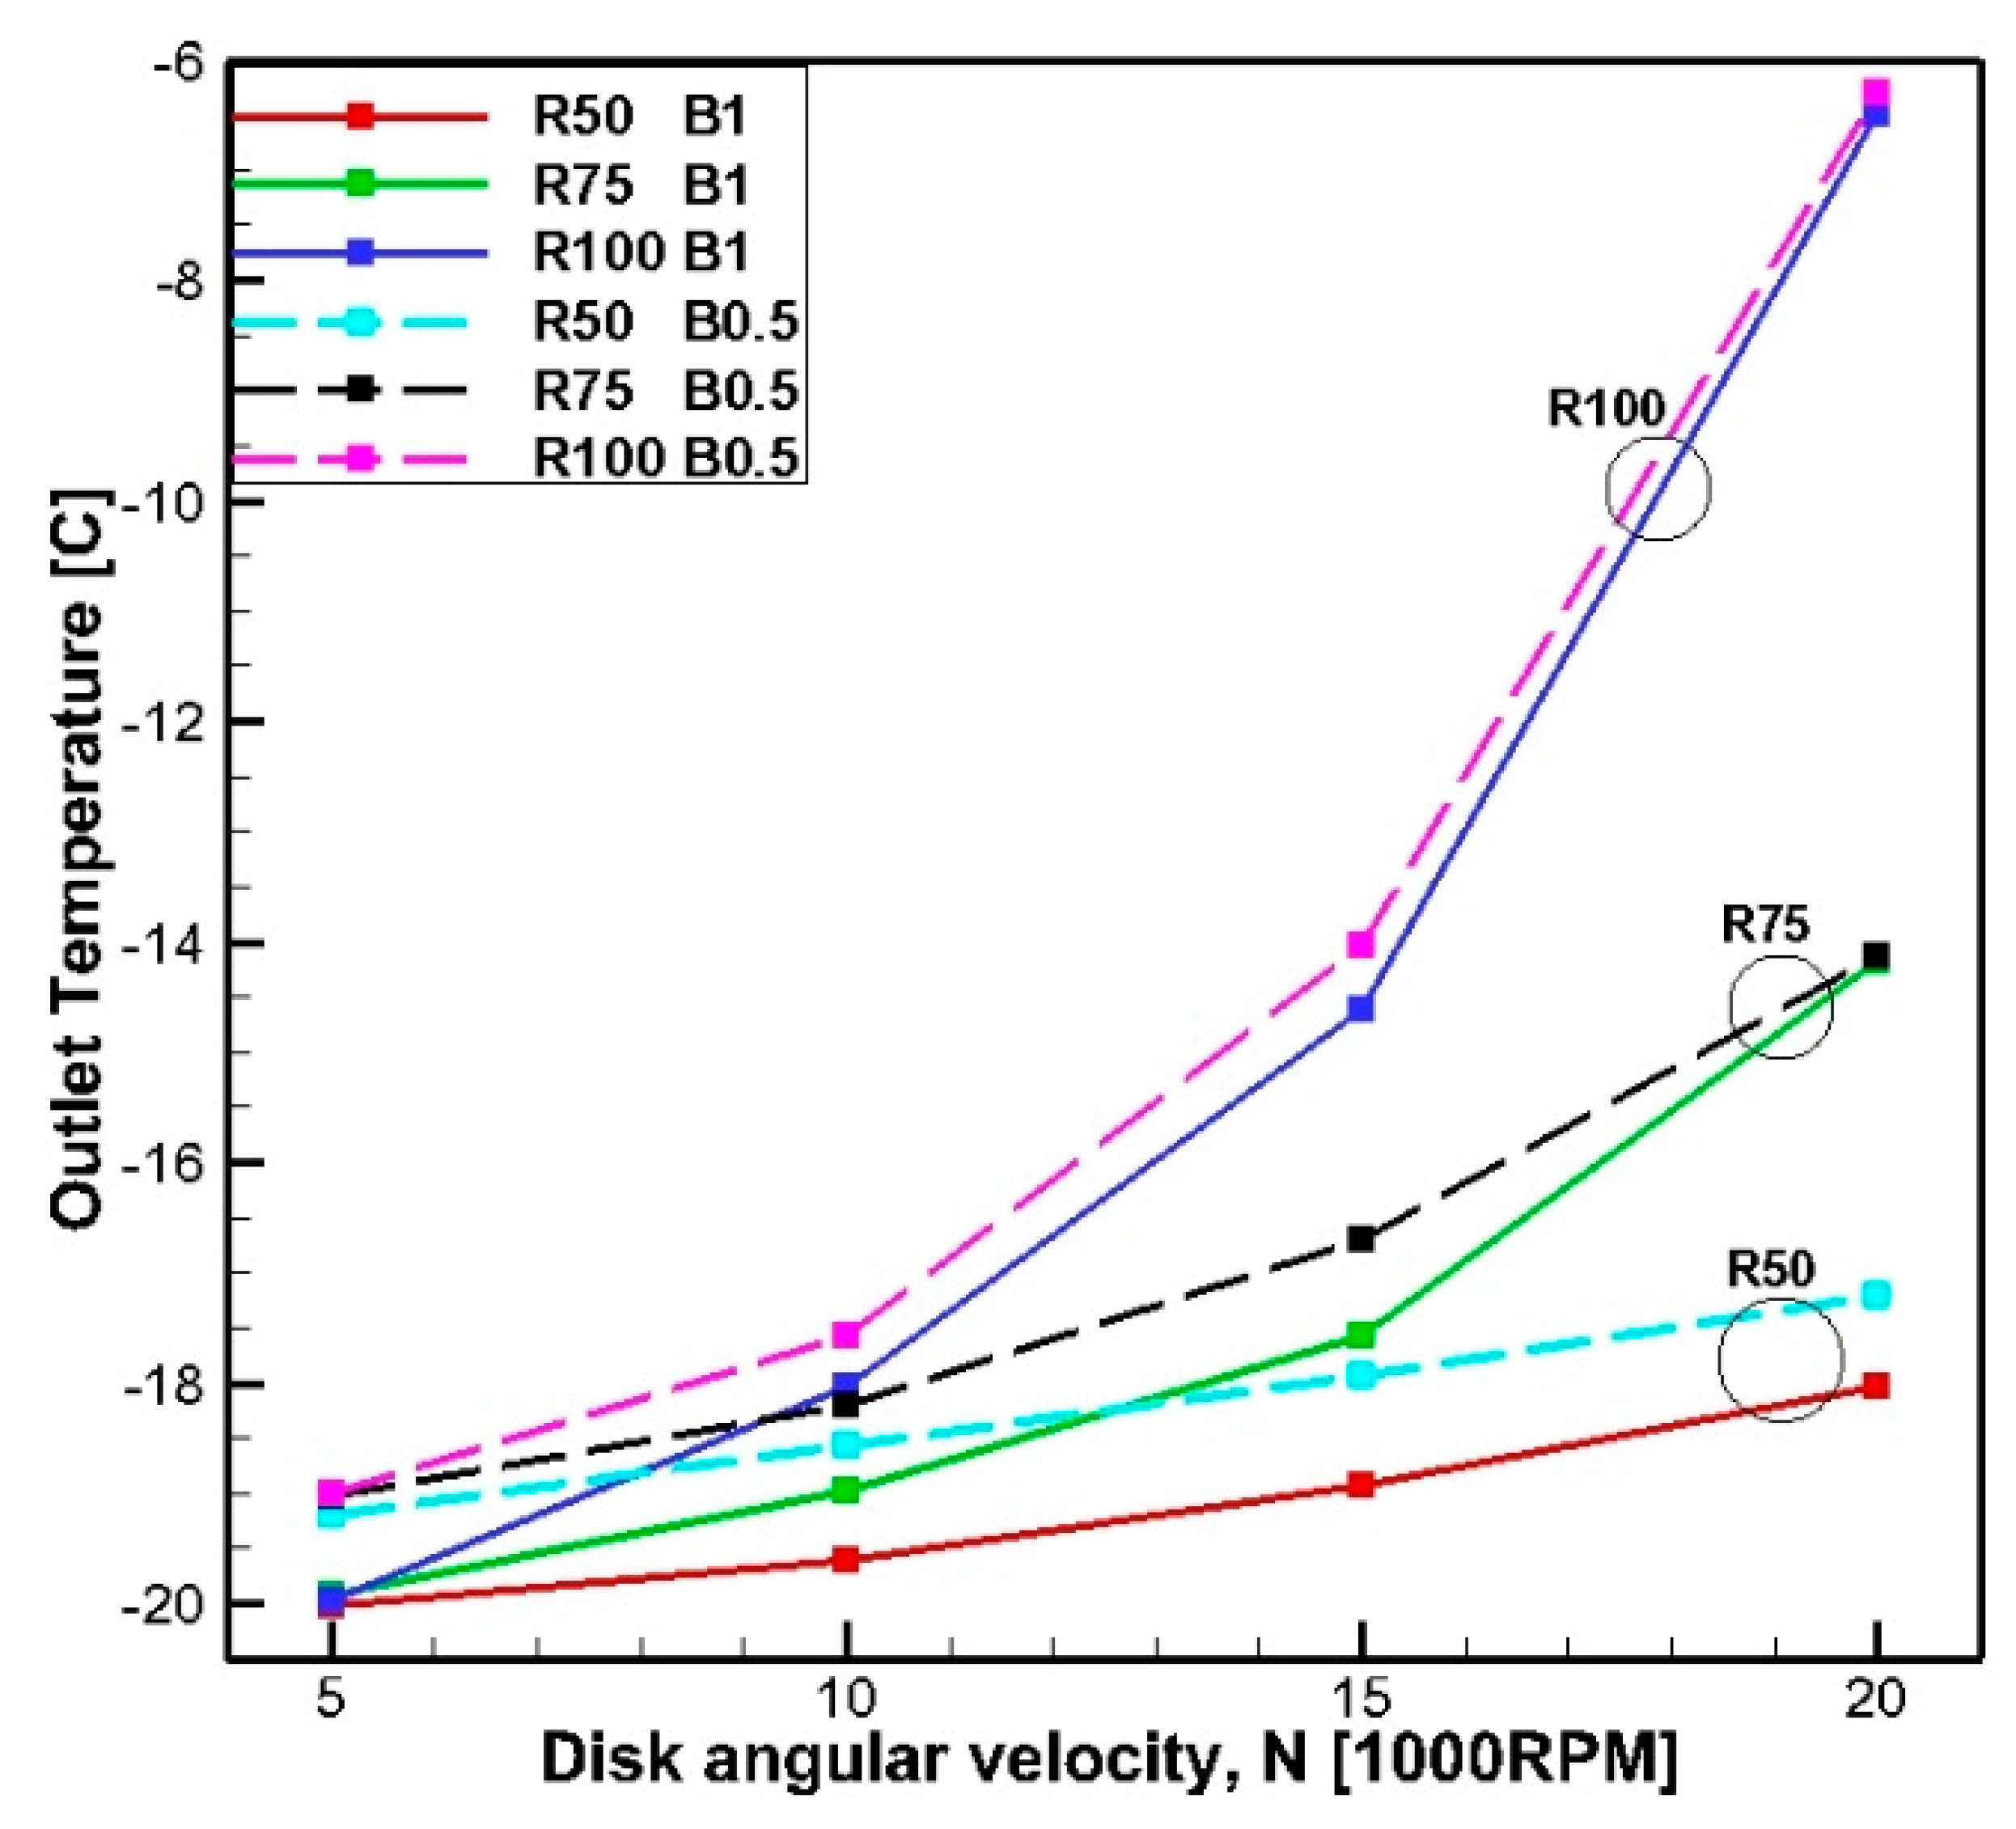
Continuing thermohydrodynamic analysis with the second indicator, outlet temperature, is important in an engineering point of view, shown in
Figure 6. This indicator becomes important, especially while working under high operational pressure differences. Under these circumstances, due to a high expansion ratio, some problems, such as freezing water vapor of humid air over the pressure-reducer, will occur, which leads to a device malfunction (blockage and/or leakage, etc.). As is depicted in
Figure 6, different configurations of a TT under different rotational speeds have been tested numerically, which shows that a higher disk angular velocity increases the outlet temperature, with no exception. The reason behind this fact may be that a higher rotational speed causes a steeper velocity gradient between the disk gap and increases viscous dissipation. Moreover, this effect is not a linear phenomenon, such that a higher rotational speed shows more significant influence intensity while conferring characteristic curves of outlet temperatures in a positive curvature. This fact has more intensity for a larger TT due to the fact that angular velocity together with its arm’s length (distance from center) turns into linear velocity, which for a larger TT, fluid flow can have a higher linear velocity as well. The root of this feature may be found in the inherent quadratic relation between kinetic energy and rotational speed.
With the same logic, one can follow the behavior of outlet temperature curves, which show a higher value for the lower disk gap. In other words, a higher velocity gradient results in more internal heat generation inside the fluid and causes higher temperatures. Finally,
Figure 6 shows the trend of outlet temperatures for different disk gaps for a higher angular velocity, which displays their tendency to approach each other and be closer. In fact, this point narrates an important scientific story: in a phenomenon, may some forces may be contributed in which each one is a function of some variables. Changes in the independent variable will influence the force’s magnitude (also maybe their direction), and hence, one force will be significant in the new condition and one becomes dispensable. In this case, under higher angular velocity, the difference between curves of having different gap sizes will disappear, because centrifugal force becomes dominant at a higher angular velocity. Consequently, two curves approach each other, and their distance decreases more and more. This fact will be important in designing a TT for the specific operating conditions.
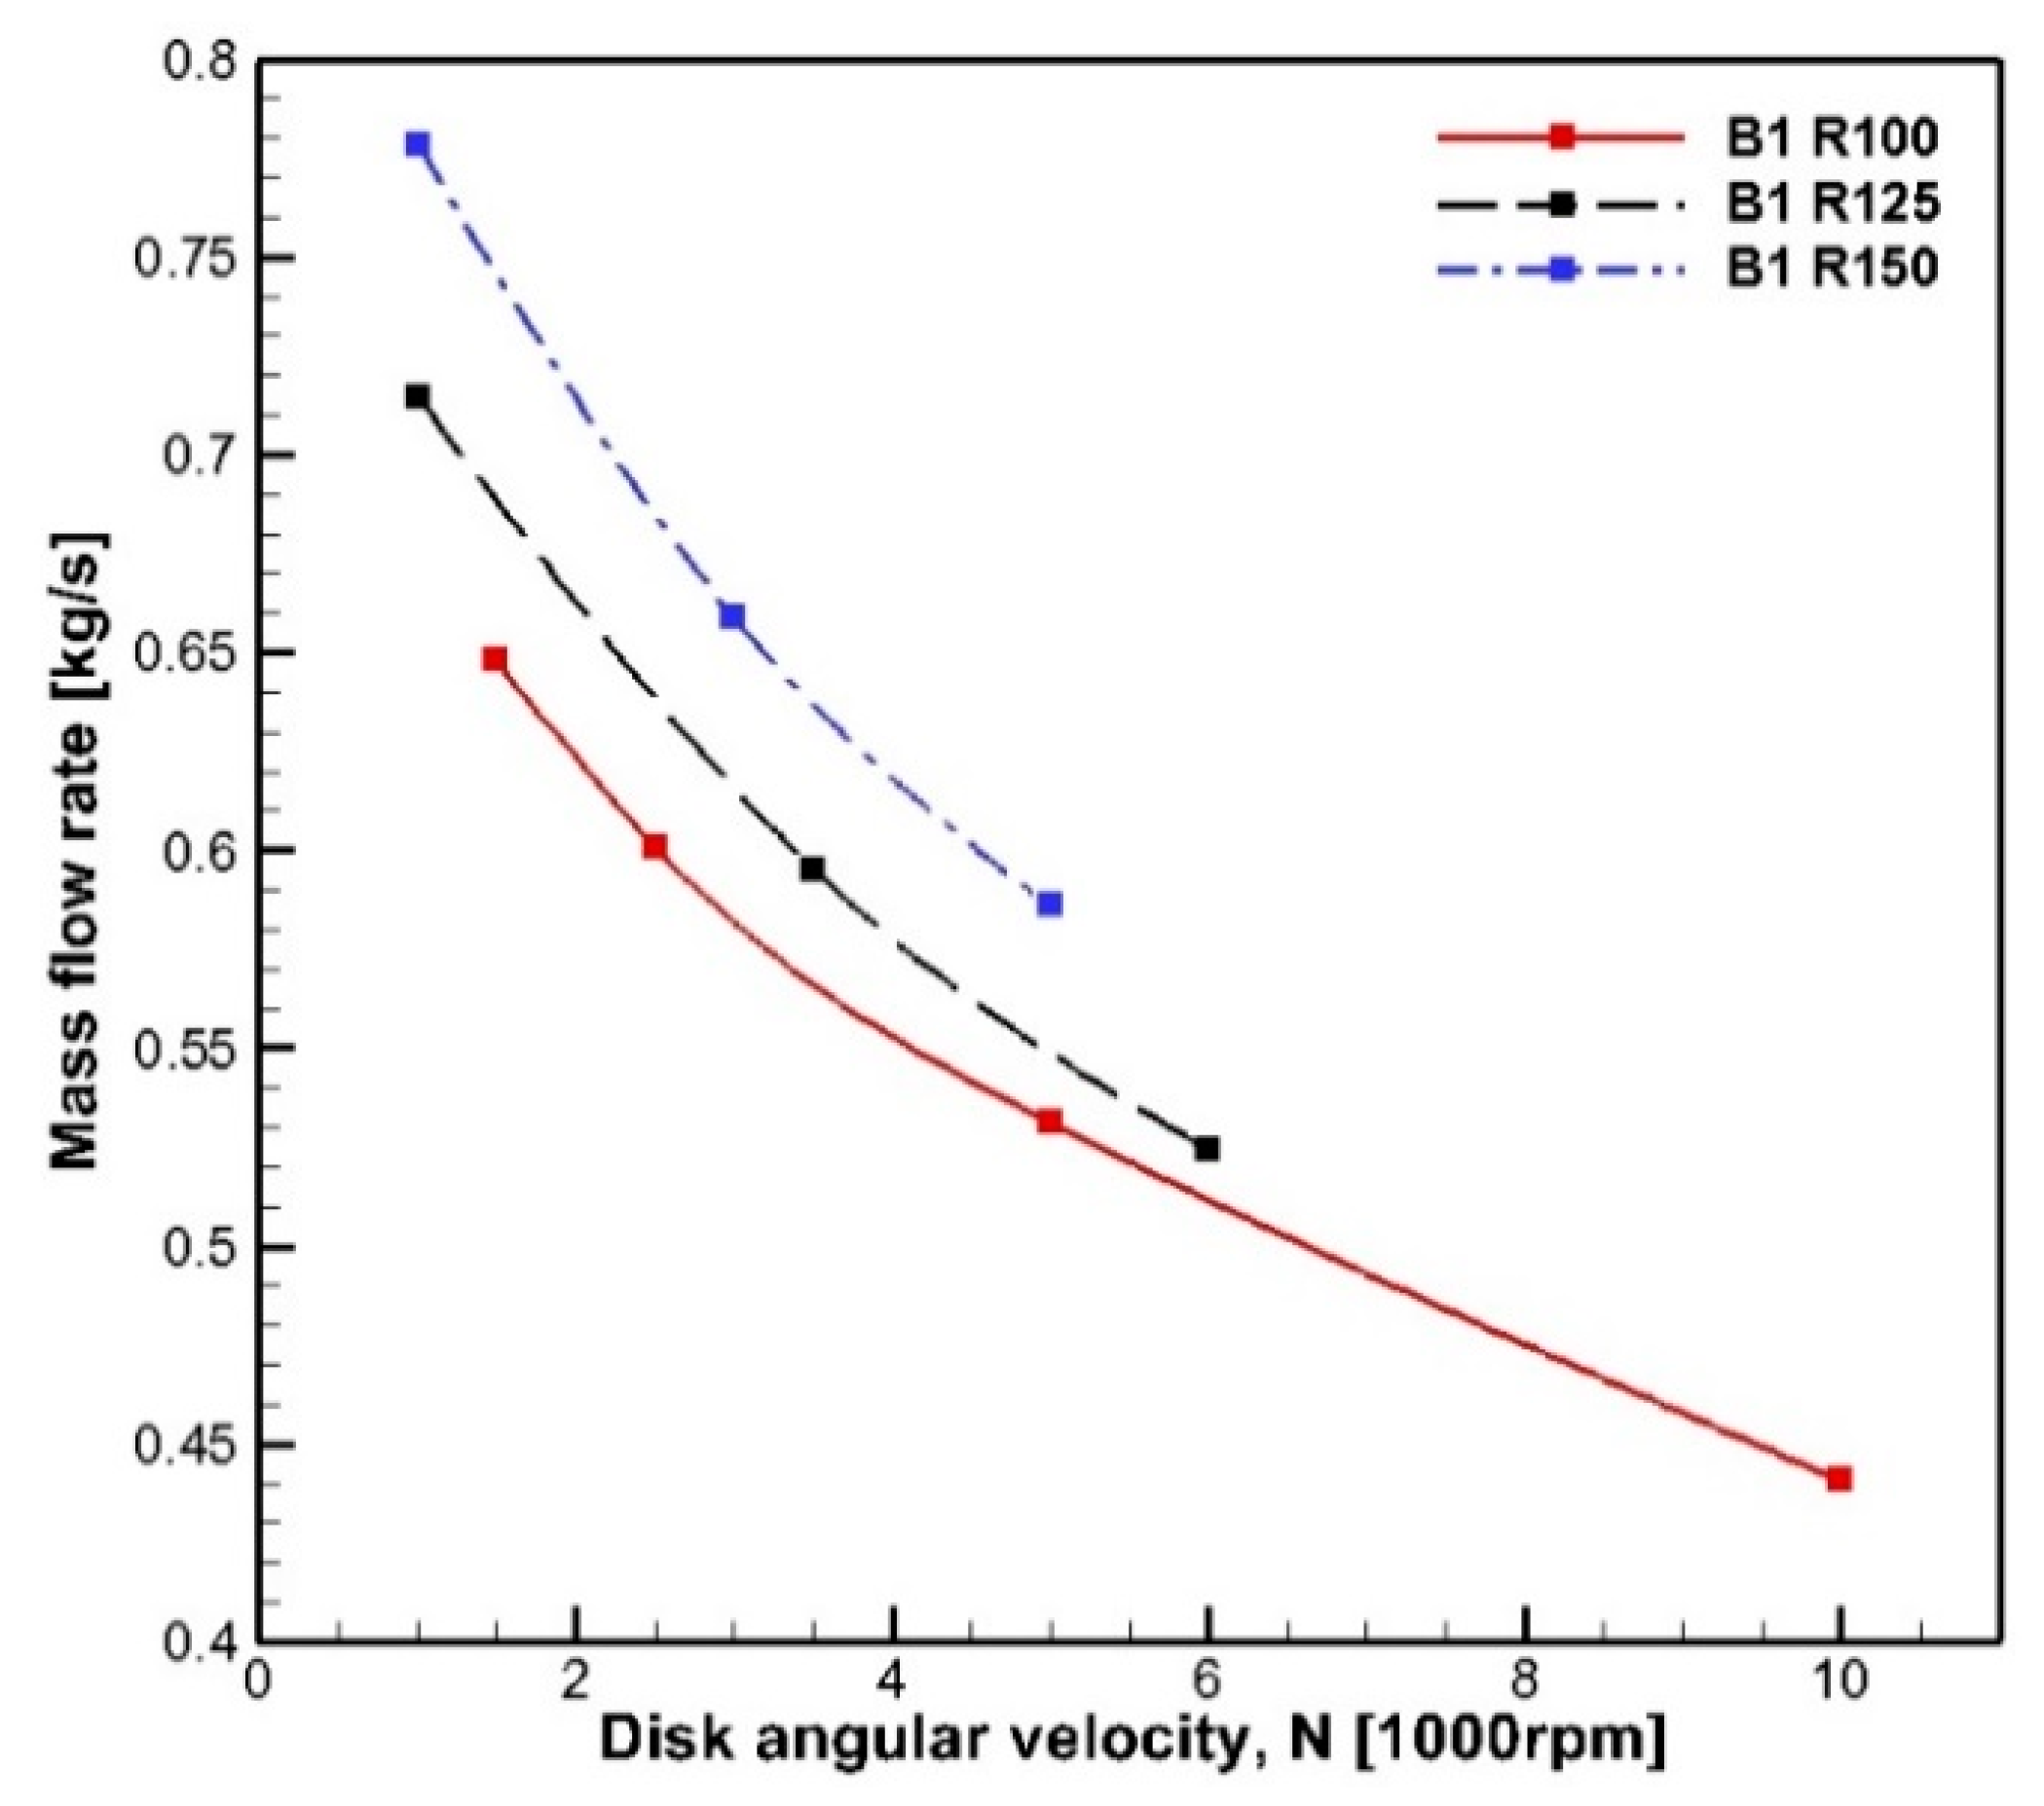
The mass flow rate variation with disk angular velocity is the third indicator that is depicted in
Figure 7. The mass flow rate of TT of different sizes but with constant disk gaps is analyzed, which shows monotonic decreasing behavior with respect to the angular velocity. Its reason lies behind the centrifugal force acting on fluid volume and pushes it toward the outer radius. While centrifugal force is the proportion of squared angular velocity (in constant radius), this effect causes a decrease in mass flow rate. Numerical results also displayed that the larger TT has a higher mass flow rate.
From now, thermohydrodynamic characteristics of the TT (R100B0.5 and N = 5500 rpm) are going to be presented.
Table 8 represents the results of the numerical experiments.
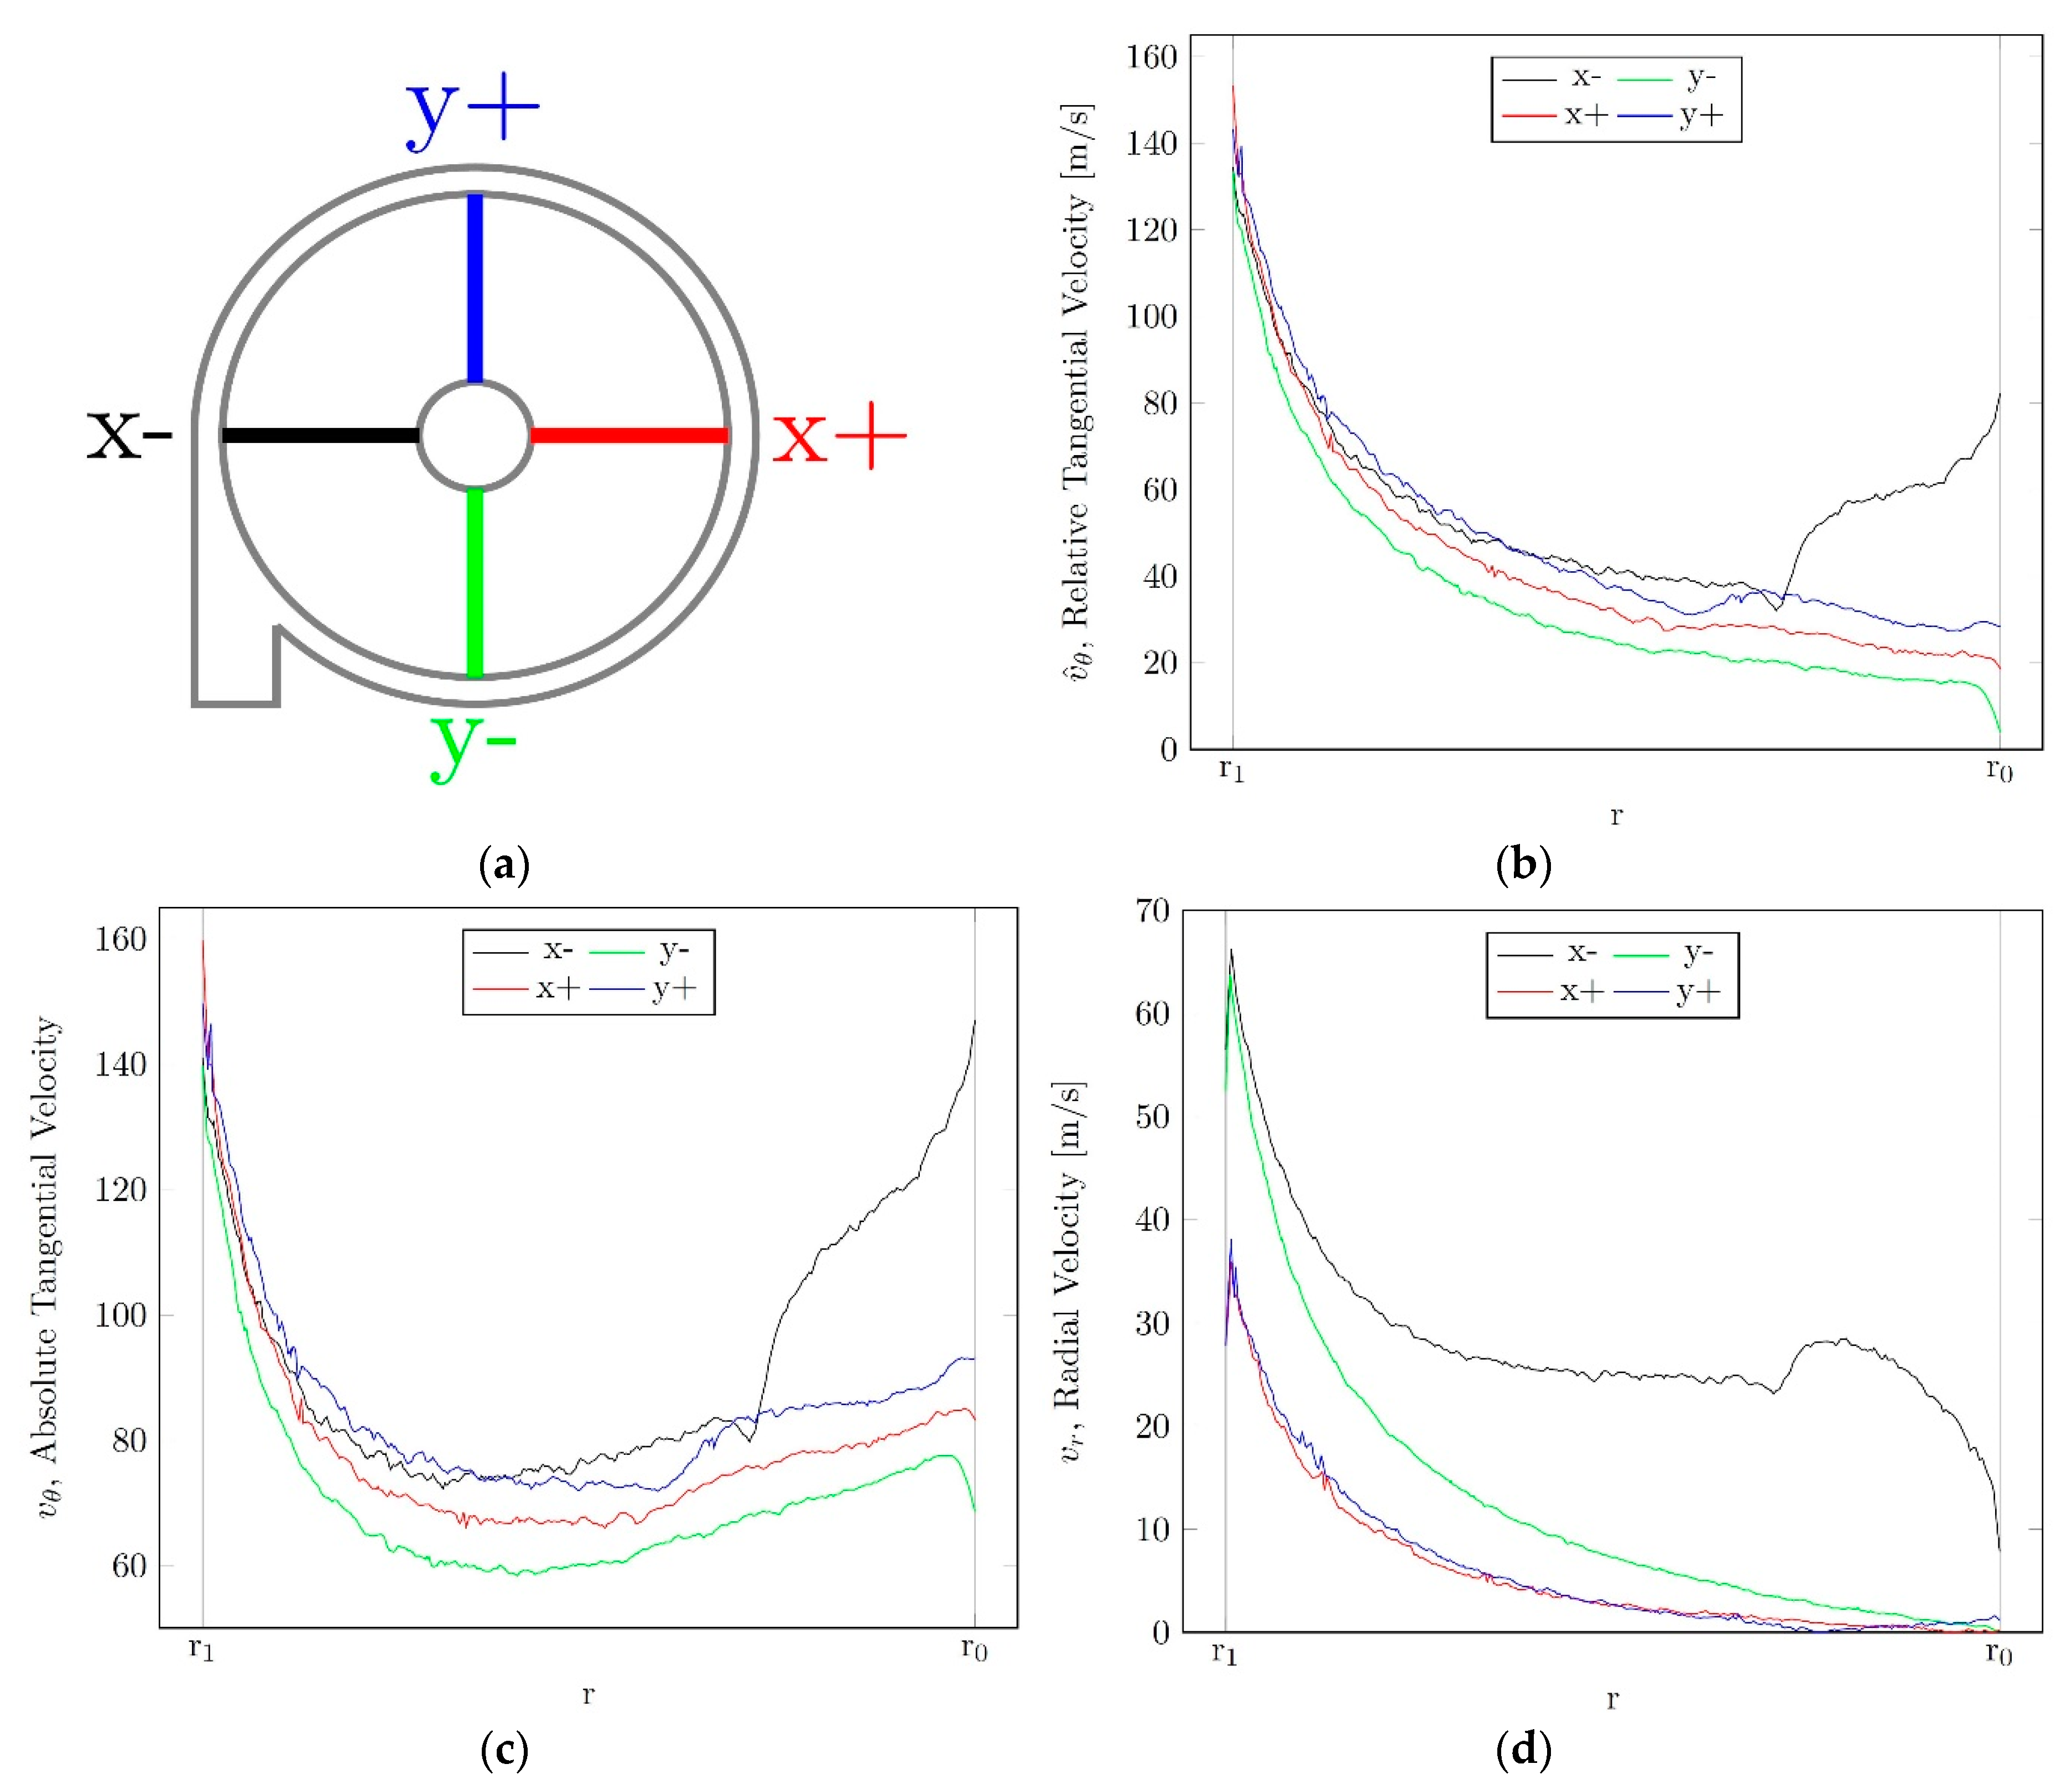
In order to have a finer view of the velocity profiles inside the gaps, four lines were created. These lines are located as displayed in
Figure 8a in the XY plane exactly between the third and fourth disc (counting from the outlet). The relative and absolute tangential velocity along the radius are displayed in
Figure 8b,c, respectively. However, it is also important to consider that the rotor is moving. By subtracting the discs’ linear velocity (ω × r) to the tangential velocity of the fluid, it is possible to display the relative tangential velocity of the flow, as seen in
Figure 8b. The relative tangential velocity profile,
Figure 8b, has a good agreement with the analytical result of Song et al. [
53]. The positive value of the relative velocity in
Figure 8b shows that a disk is not overspeeding the fluid. Comparison between the two
Figure 8b,c, lead us to a deeper understanding of flow characteristics. In fact, in
Figure 8b, the reference frame is on the rotating disk, and, in
Figure 8b, the observer is on an inertial frame of reference. Fluid flow velocity, while observed from an observer located on the disk, has a decreasing trend as it approaches to the outer border of a disk; however, an observer from an inertial frame of reference detects a decreasing-increasing graph of the positive curvature with a minimum in between. The “abnormal” trend of tangential velocity on the “x-” line, which is referred to as the local velocity increase, is due to the impact of fluid flow at the entrance with a blunt-body disk. In fact, a decrease of the cross-section area together with conservation of mass results is the velocity increment. In order to analyze the velocity profile, it is required to consider all engaged parameters, like pressure and density as well.
For interpreting the radial velocity in
Figure 8c, near the outlet, while fluid flow approaches r
1, imagine the fluid pressure is decreased, as shown in
Figure 9 (up), and therefore, fluid density is also sharply decreased, as shown in
Figure 9 (up). At the same time, while coming closer to the center of the TT and outlet part, the cross-section area (πDb) is decreasing as well. Hence, under these circumstances, velocity should compensate all these shortages in order to satisfy the conservation of mass. Consequently, considering zero velocity in the z-direction, both components of velocity near the outlet section are increased.
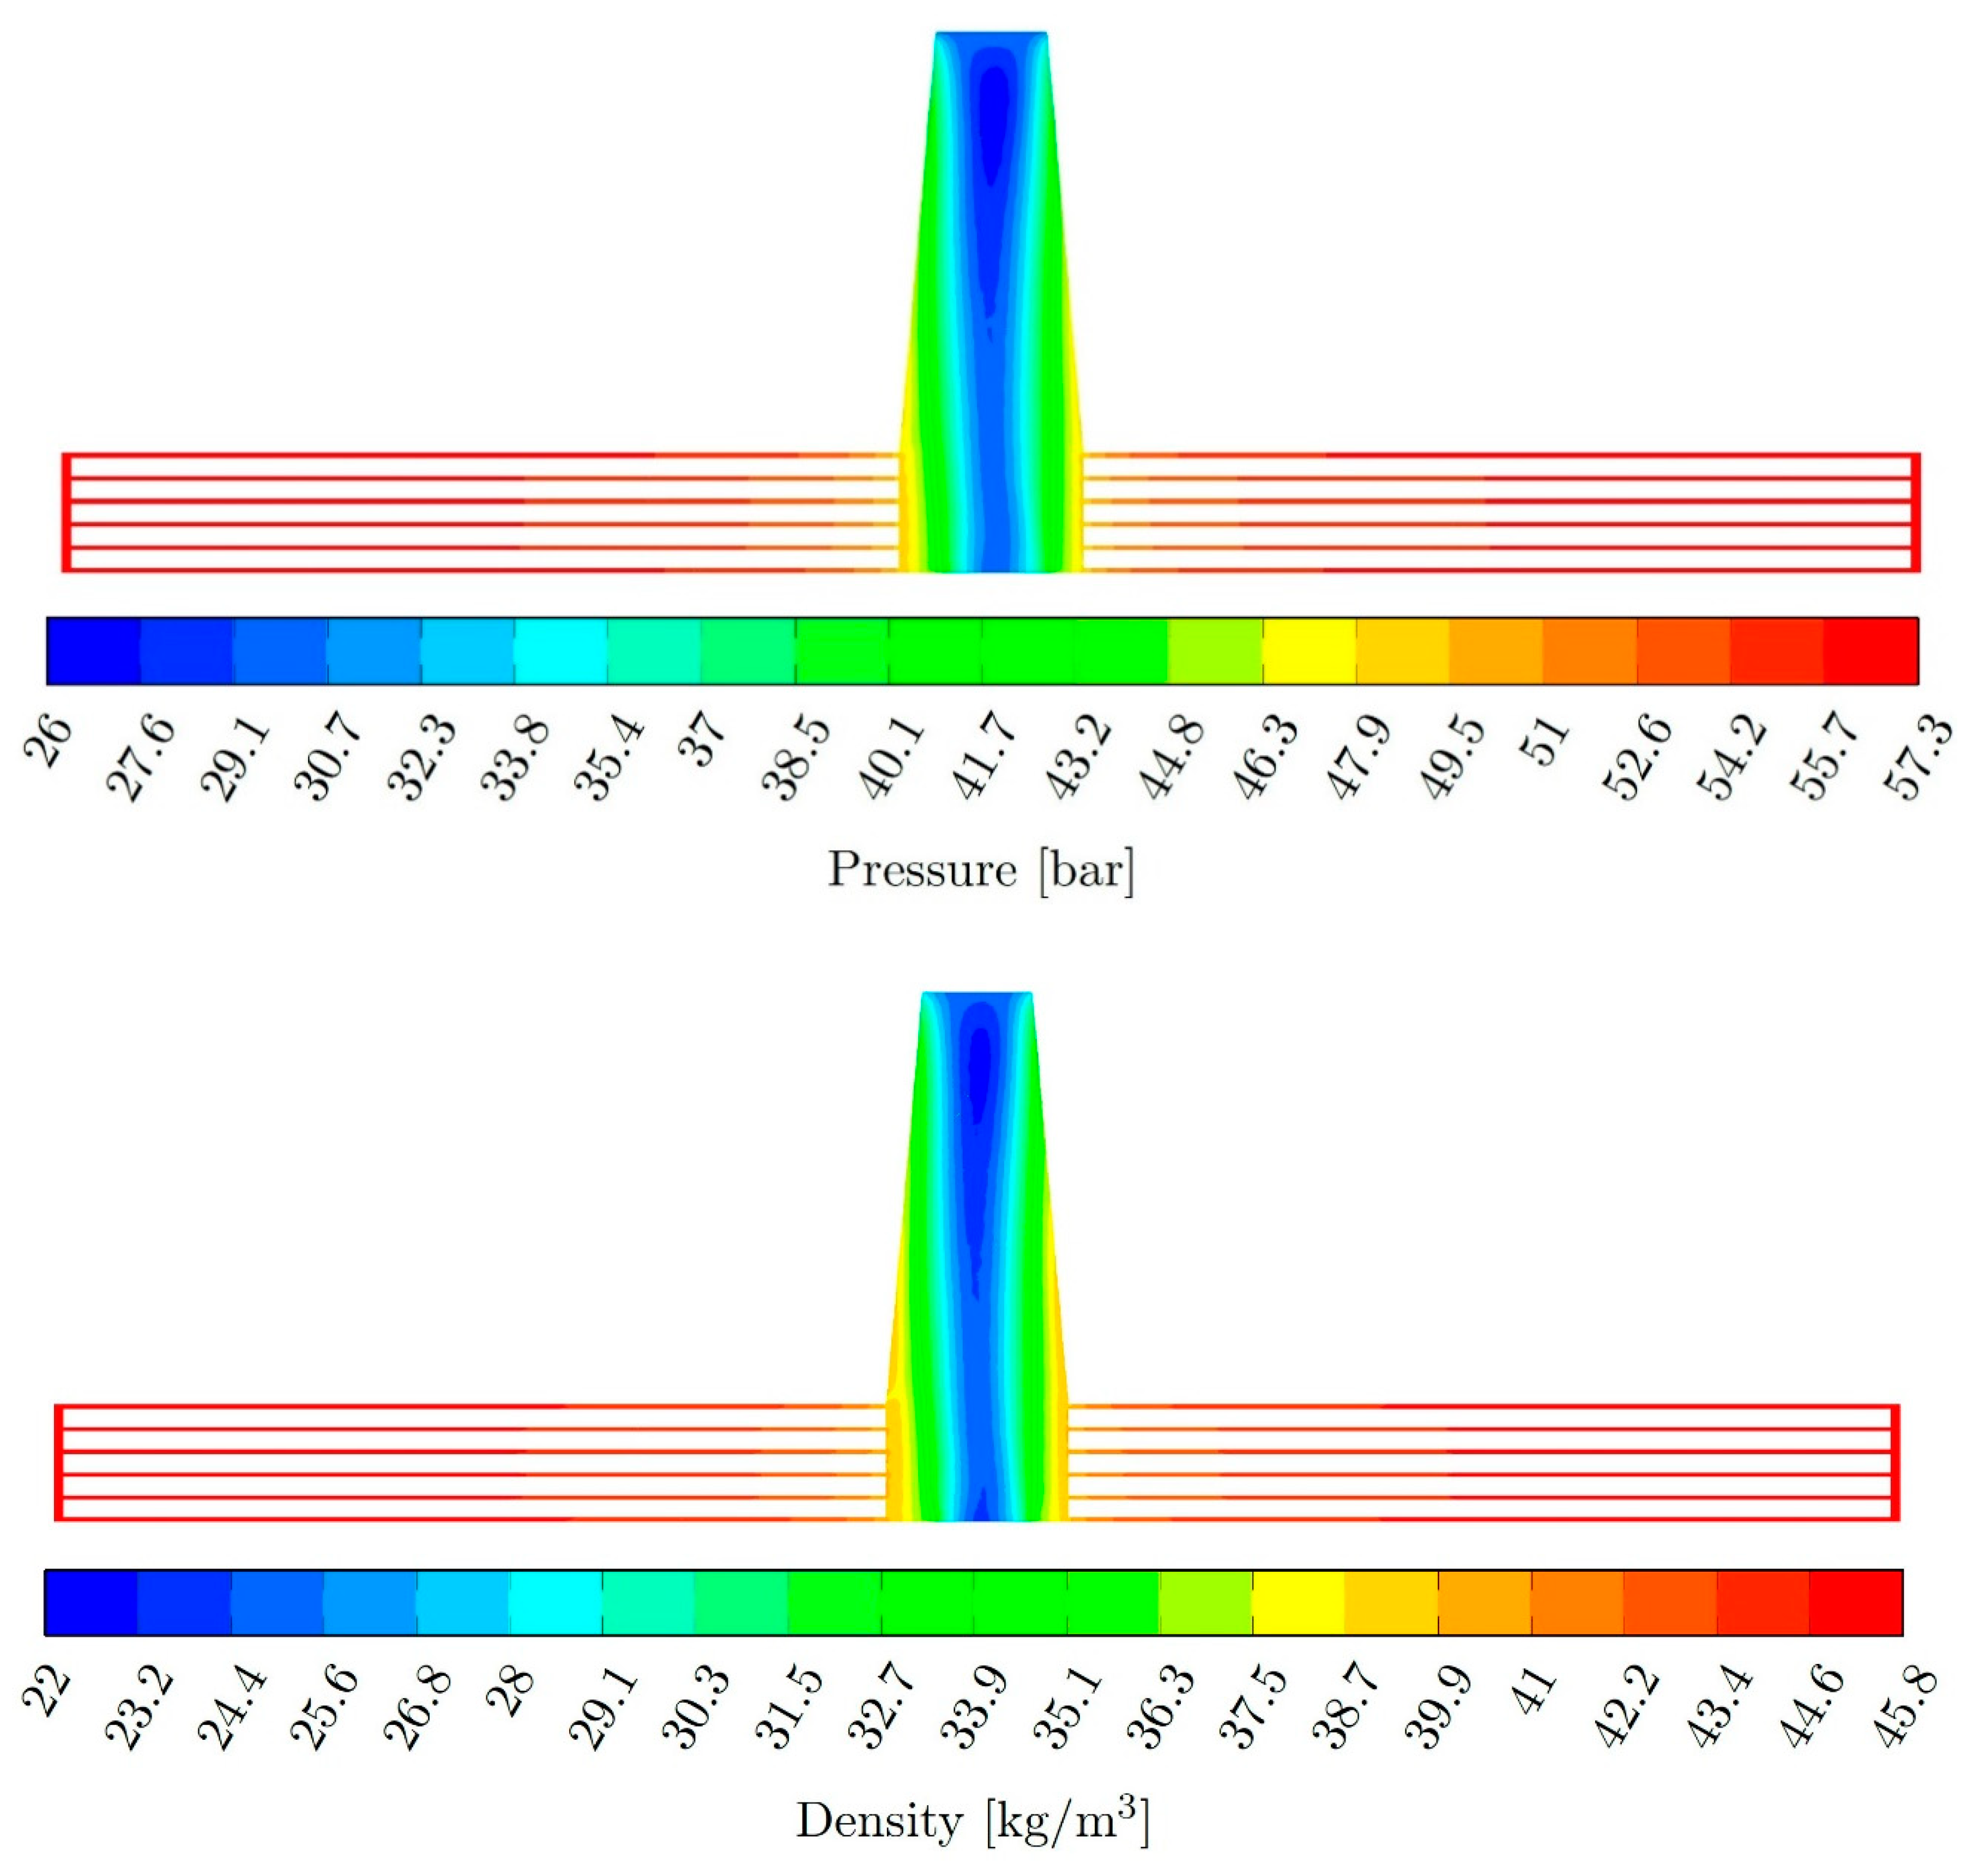
In
Figure 9, distribution of pressure (up) and density (down) contours are depicted. These two parameters are concatenated together via the Redlich-Kwong real gas equation of state and show almost the same trend in contour variation. By decreasing pressure from inlet to outlet as it was set as the boundary condition, density is also decreased, such that the main changes occur at the outlet channel. In both pressure and density distribution, almost 60% of variations belong to the outlet section in which no power is produced. It means that still the main part of carrier fluid potential is wasted through TT. Maybe a larger TT can perform better than a smaller one, as it can use more fluid potential to generate mechanical power. This fact was depicted in
Figure 7, in which, for the same rotational speed, same pressure inlet/outlet, and same disk gap, a larger TT produced more power than a smaller one.
4. Conclusions
In this study, the TT was proposed as a promising opportunity for efficiency enhancement of industries, namely those containing both compression and absorption refrigeration cycles, such as cold stores, as well as those with high-pressure lines, and due to its outstanding applications, the thermohydrodynamic characteristics of the Tesla turbine running under high-pressure methane were studied. Besides acquiring a better understanding of the subject, some general rules were also deduced for the turbine design aiming to maximize the output power. A CFD model was created on commercial software of ANSYS Fluent, and the realizable K-∊ turbulent model with enhanced wall treatment was adopted. The numerical results can be summarized as follows.
From the thermodynamic aspect, extracting mechanical work from NG will reduce both pressure and temperature. It implies that NG will have more capability to receive more heat from an environment. At the same time, generated direct mechanical power by a TT could be integrated with an AC or DC generator to produce electricity. Depending on the end-use appliance and required application, generated DC can be converted to AC, or vice versa. A system based on the use of a battery-inverter can be integrated with the electrical generator for local production and storage of electricity. In addition, considering the R159B1 configuration of the TT, by quantitative analysis, the amount of generated power can support the lighting 285 LED light bulb (7 W suitable for the industrial environment) simultaneously. Moreover, considering available commercial photovoltaic solar panels (150 W, 15.42% efficiency), for the climate condition of Toronto, Canada, about 84.4 m2 area of the solar panel is required to produce an equivalent power. For this city, considering electricity price and regulatory and transmission delivery, TT-generated energy (1440 kWh/month) will be equal to $2846 per year monetary savings. This value would be much higher (100 m2 area of the solar panel and $6132 per year savings) if the calculation is made for Munich, Germany.
On the other hand, from the technical view, in order to design a TT for optimum operating conditions, these general rules must be considered.
In smaller TTs, the main pressure drop occurs at the outlet channel. However, under a fixed condition, a larger TT can produce more power, mass flow rate, and outlet temperature.
For each characteristic curve of the TT-generated power, there is an optimum angular velocity at which the output power becomes the maximum. Optimum angular velocity is shifted to a lower angular velocity for a larger turbine, and the magnitude of the power is increased in respect to the TT size.
Outlet temperature will be increased by increasing disk angular velocity, and a larger TT shows a higher outlet temperature than smaller one.
With the aim of pushing refrigeration industries to harvest enormous wasting energy through expansion valves, this study not only shows the advantages and huge capability of a TT for being substituted be the expansion valves but also provides a deep illustration on the thermohydrodynamic characteristics of the TT.


