Comparison of the Evaporation and Condensation Heat Transfer Coefficients on the External Surface of Tubes in the Annulus of a Tube-in-Tube Heat Exchanger


Abstract
1. Introduction
2. Experimental Procedure
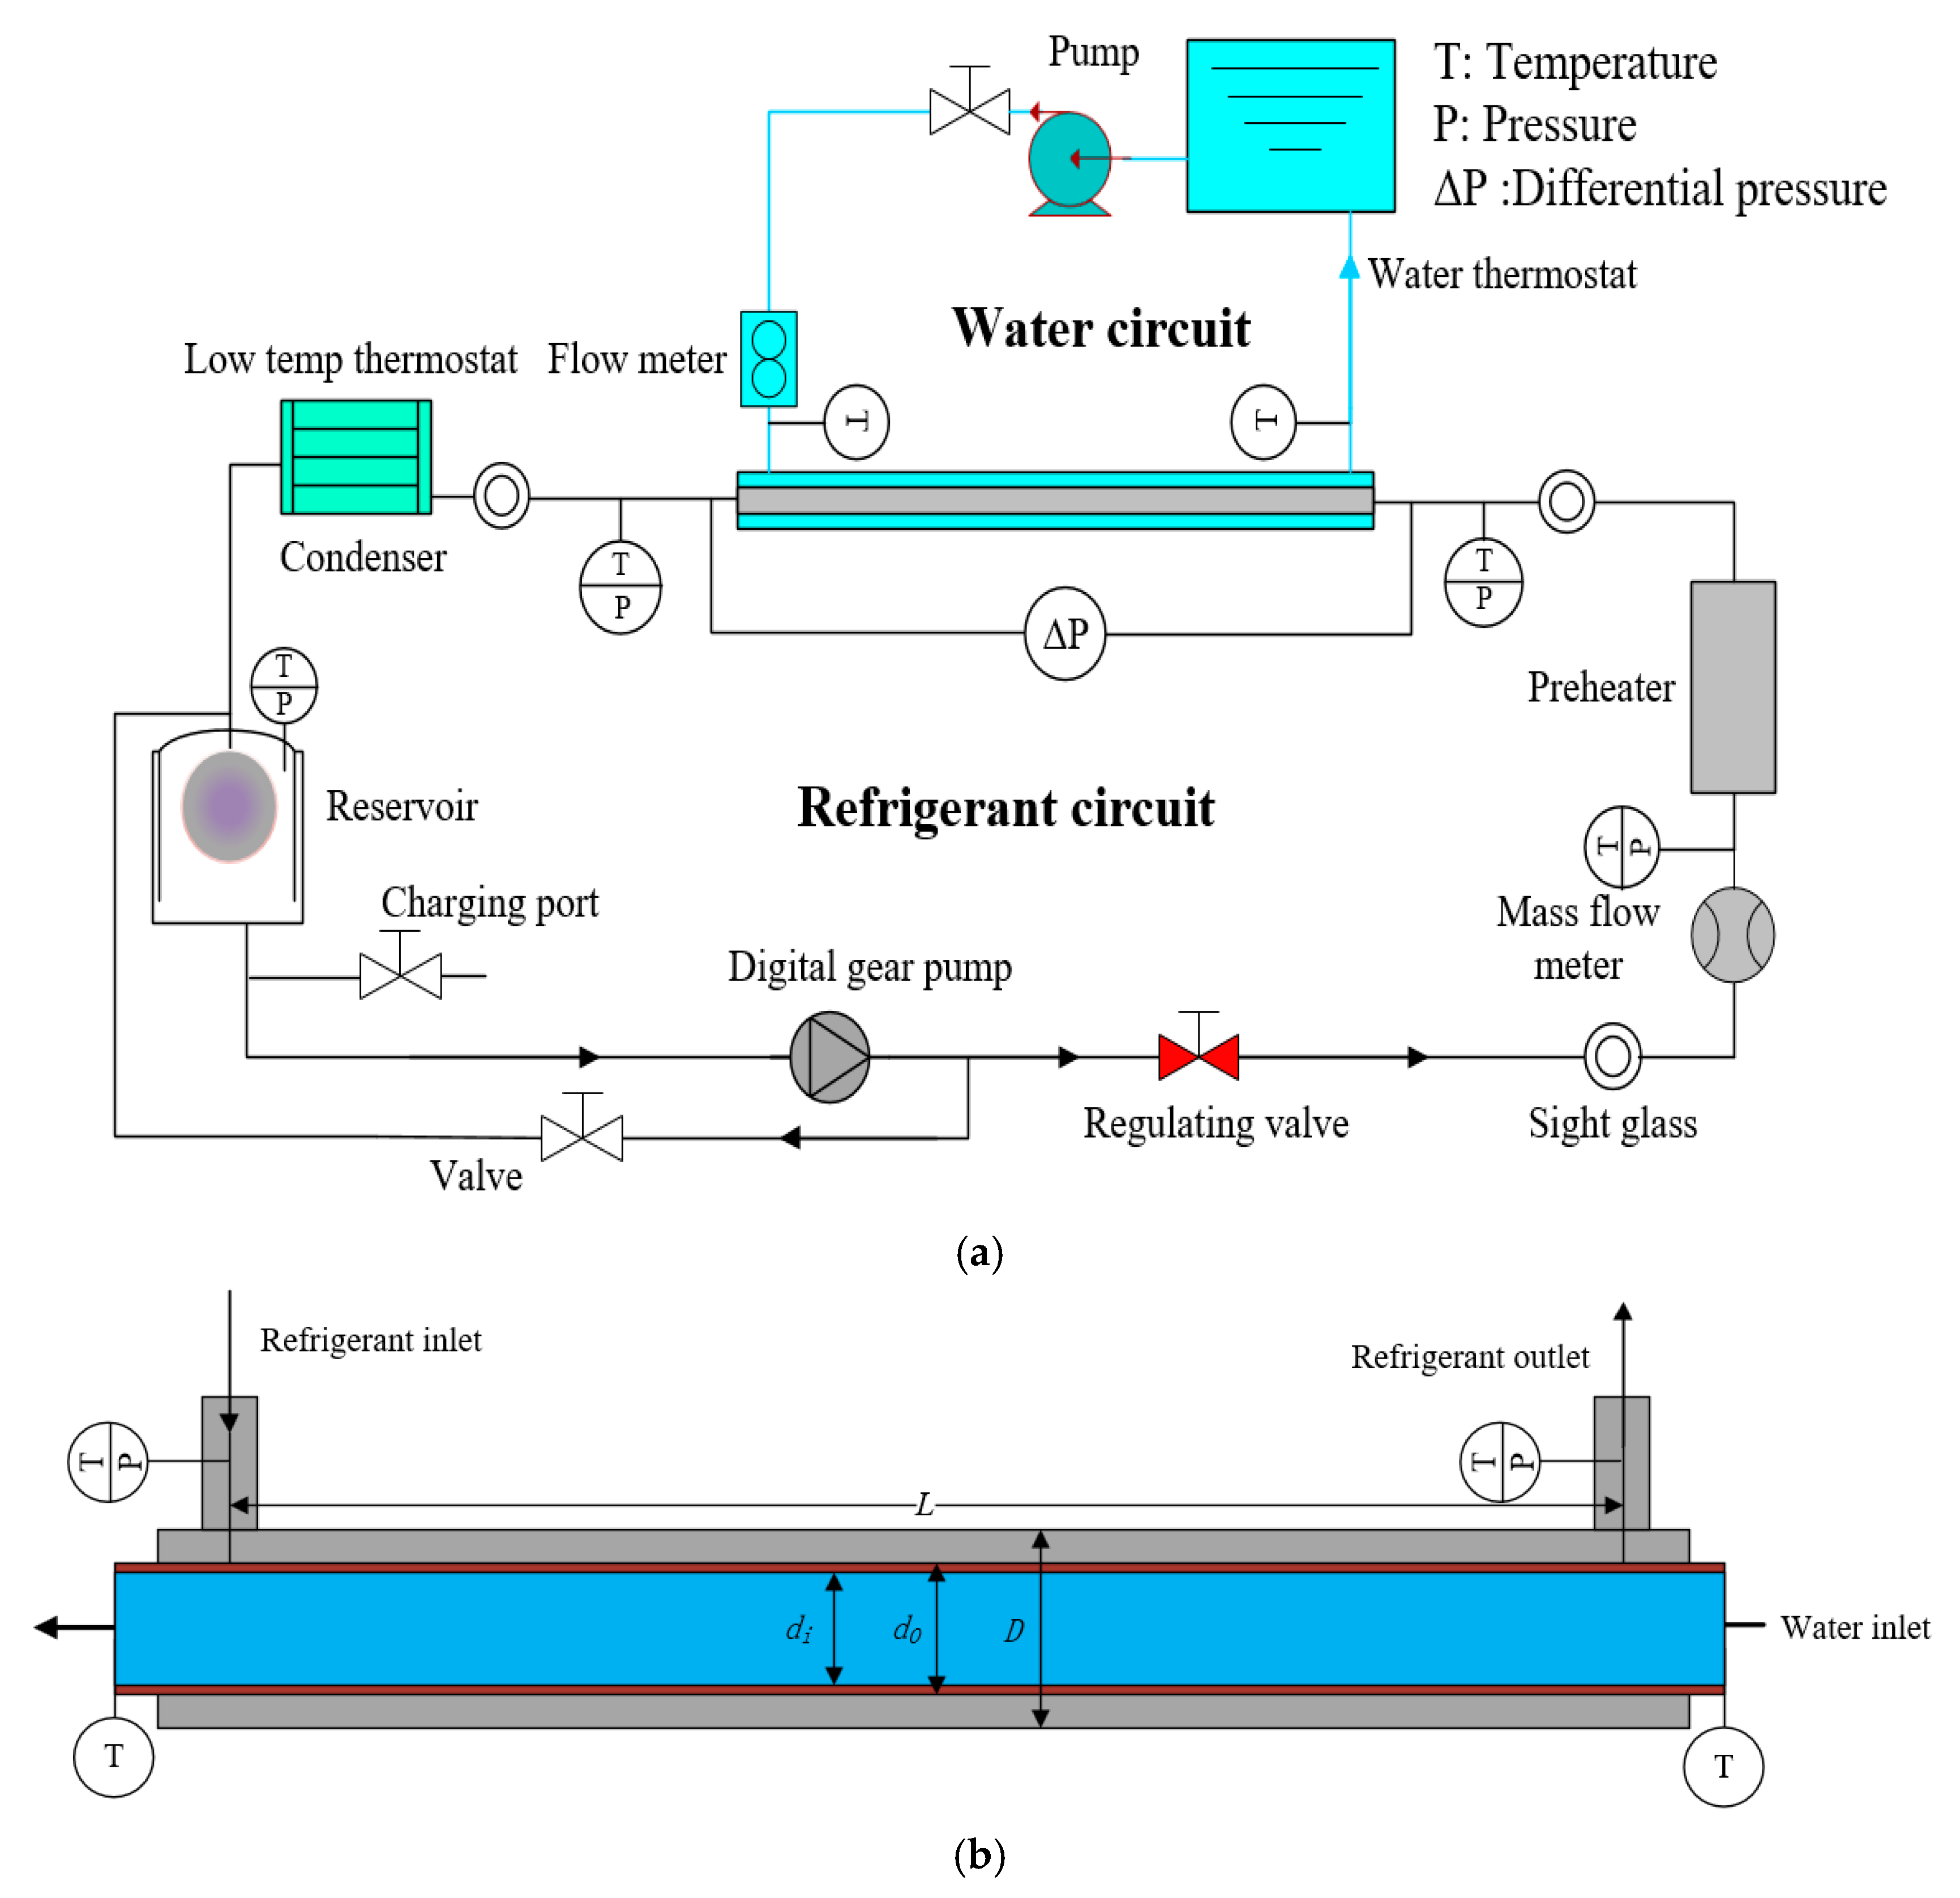
2.1. Test Apparatus
2.2. Test Conditions
3. Data Reduction and Uncertainty Analysis
3.1. Data Reduction
3.2. Experimental Uncertainty Analysis
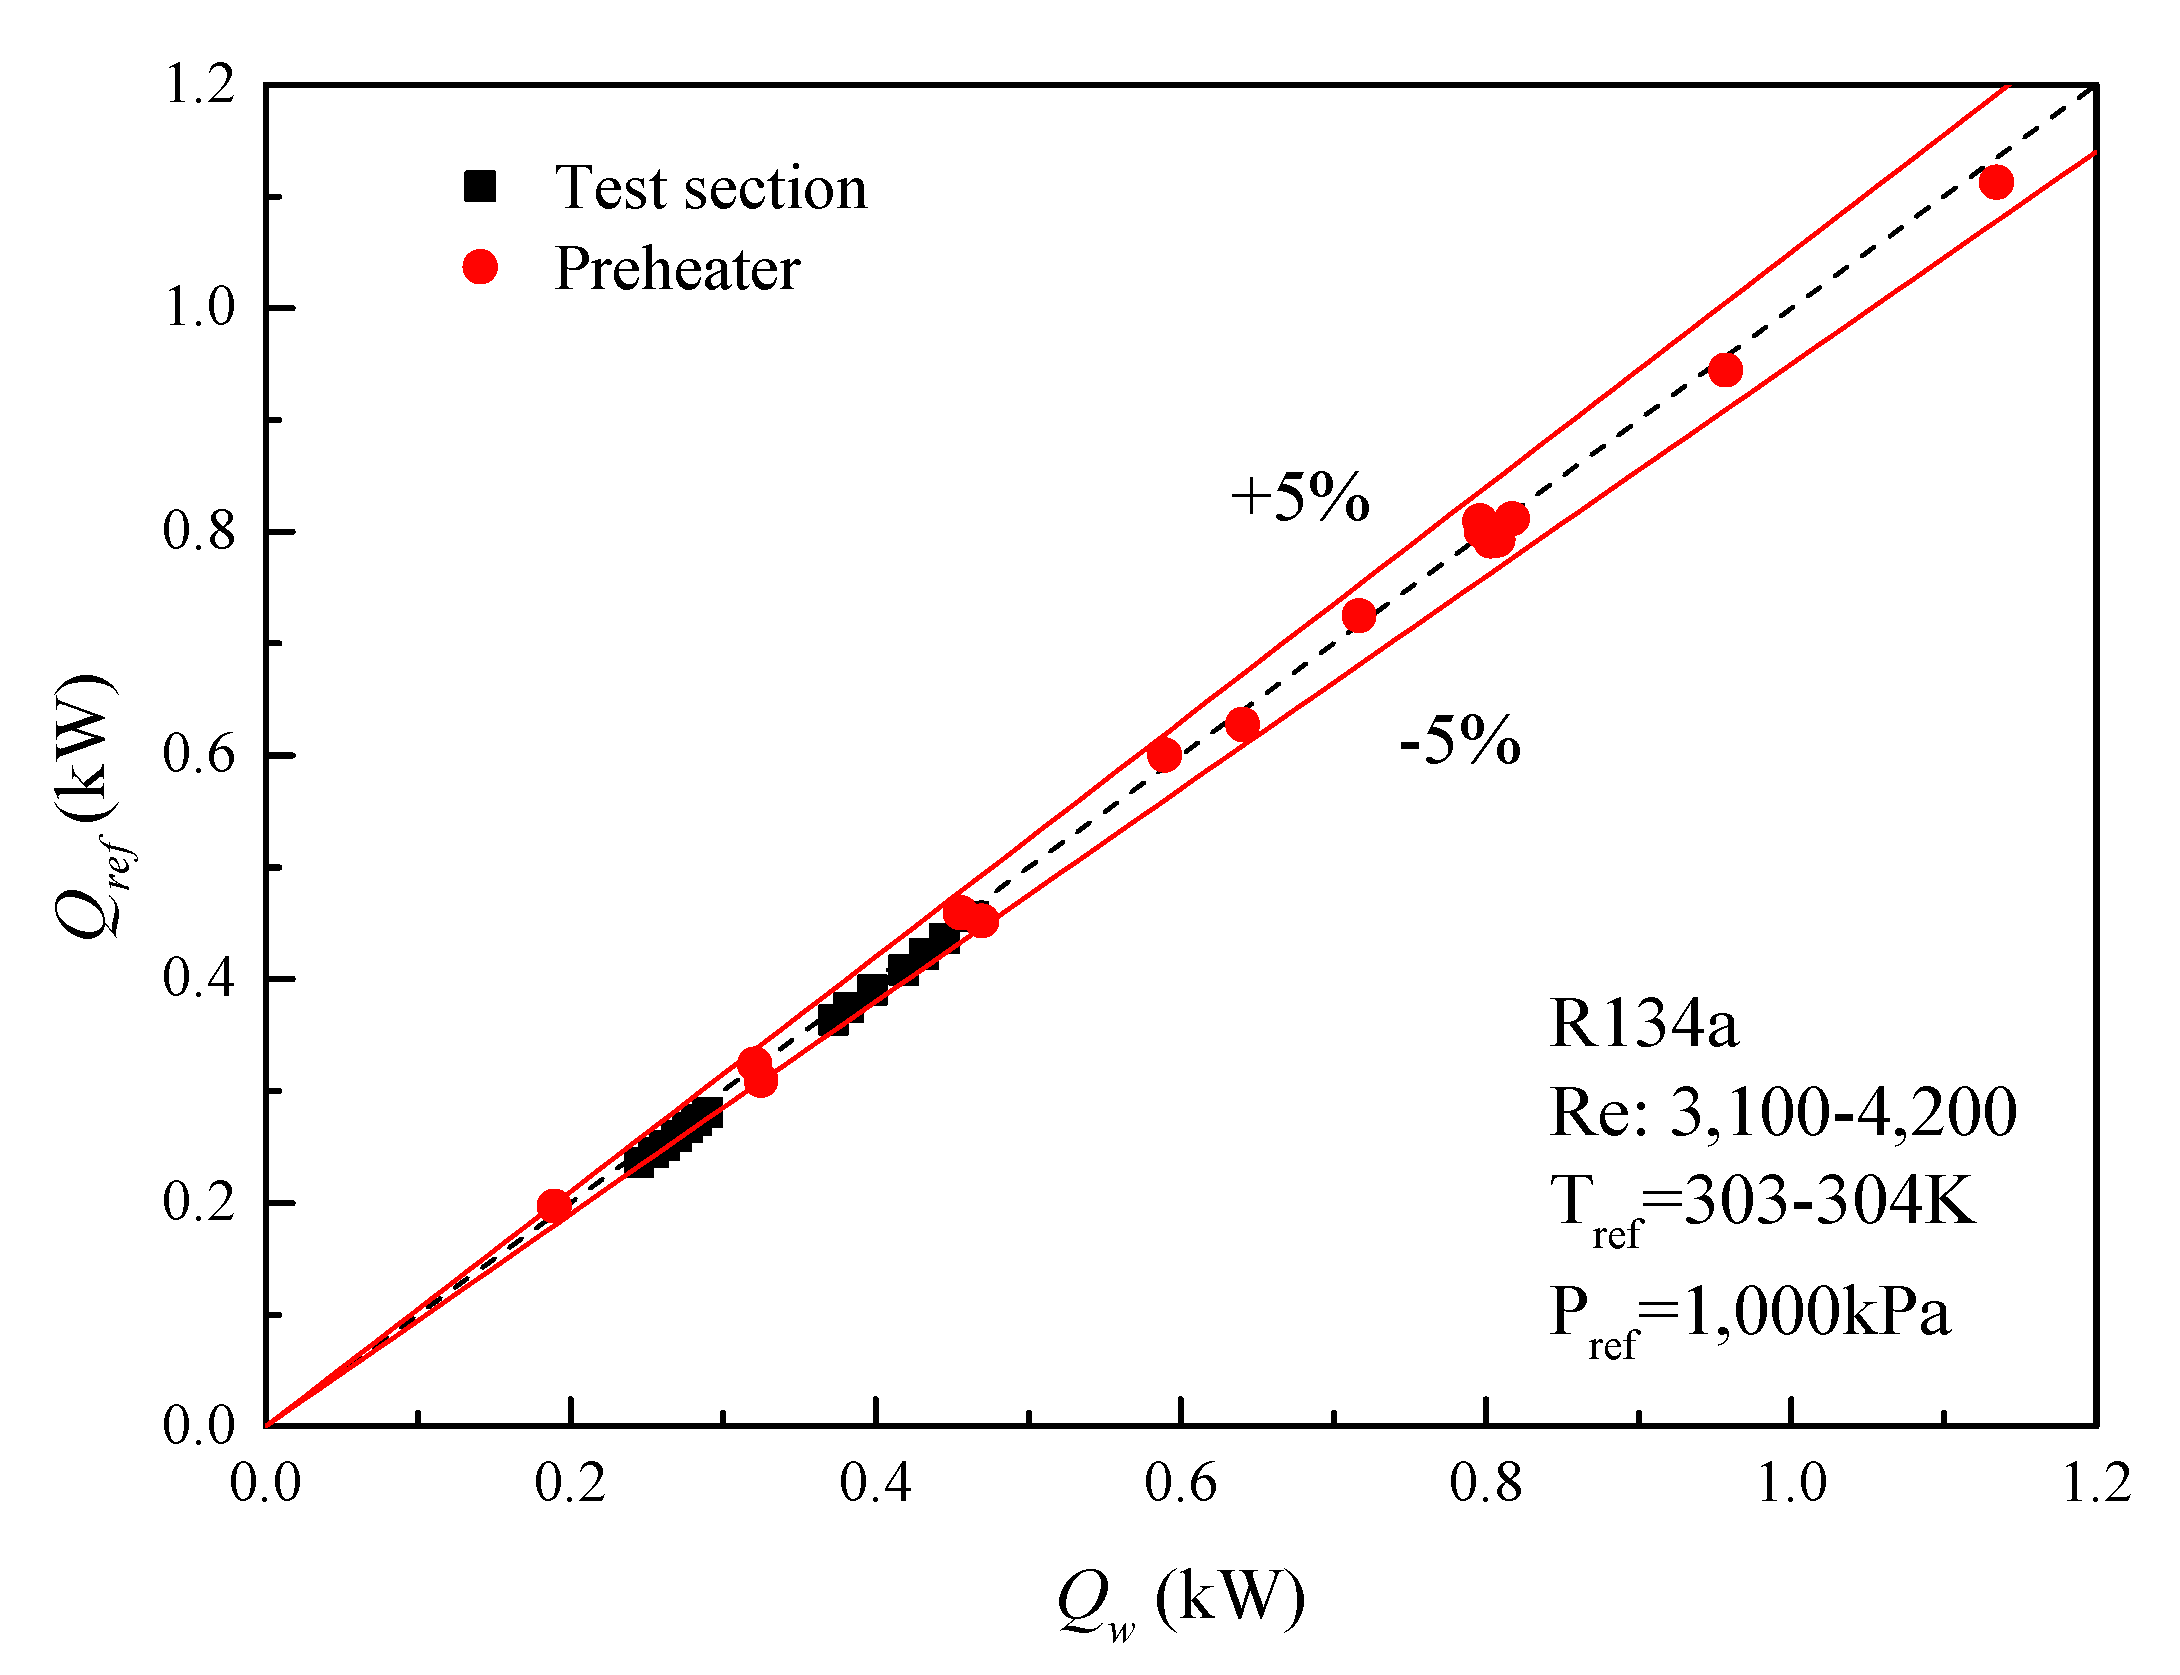
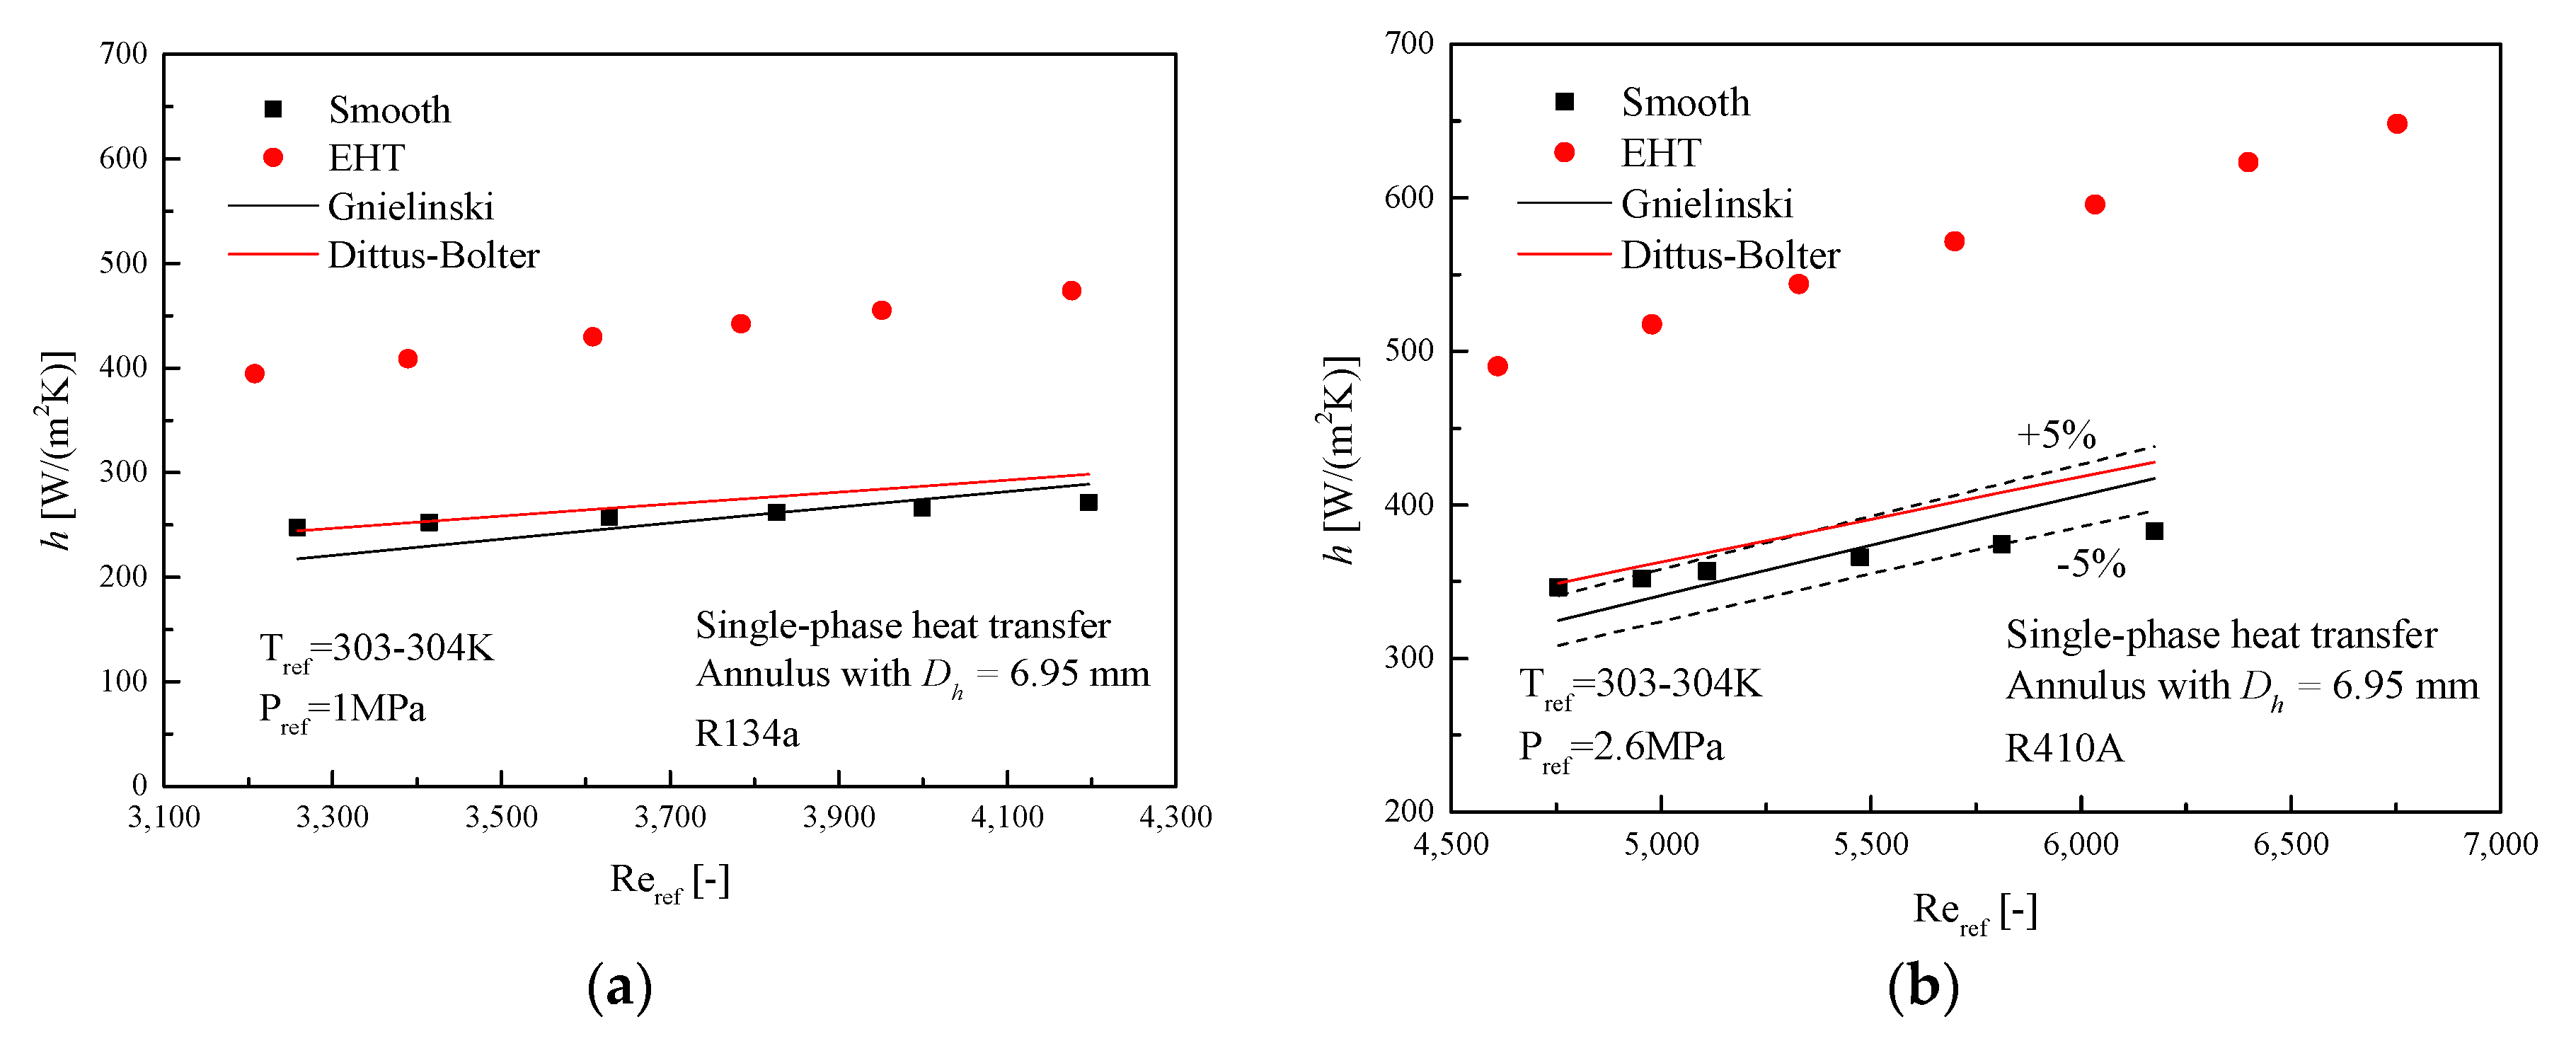
3.3. Experimental Validation
4. Results and Discussion
4.1. Heat Transfer Characteristics of Condensation
4.2. Heat Transfer Characteristics of Evaporation
5. Conclusions
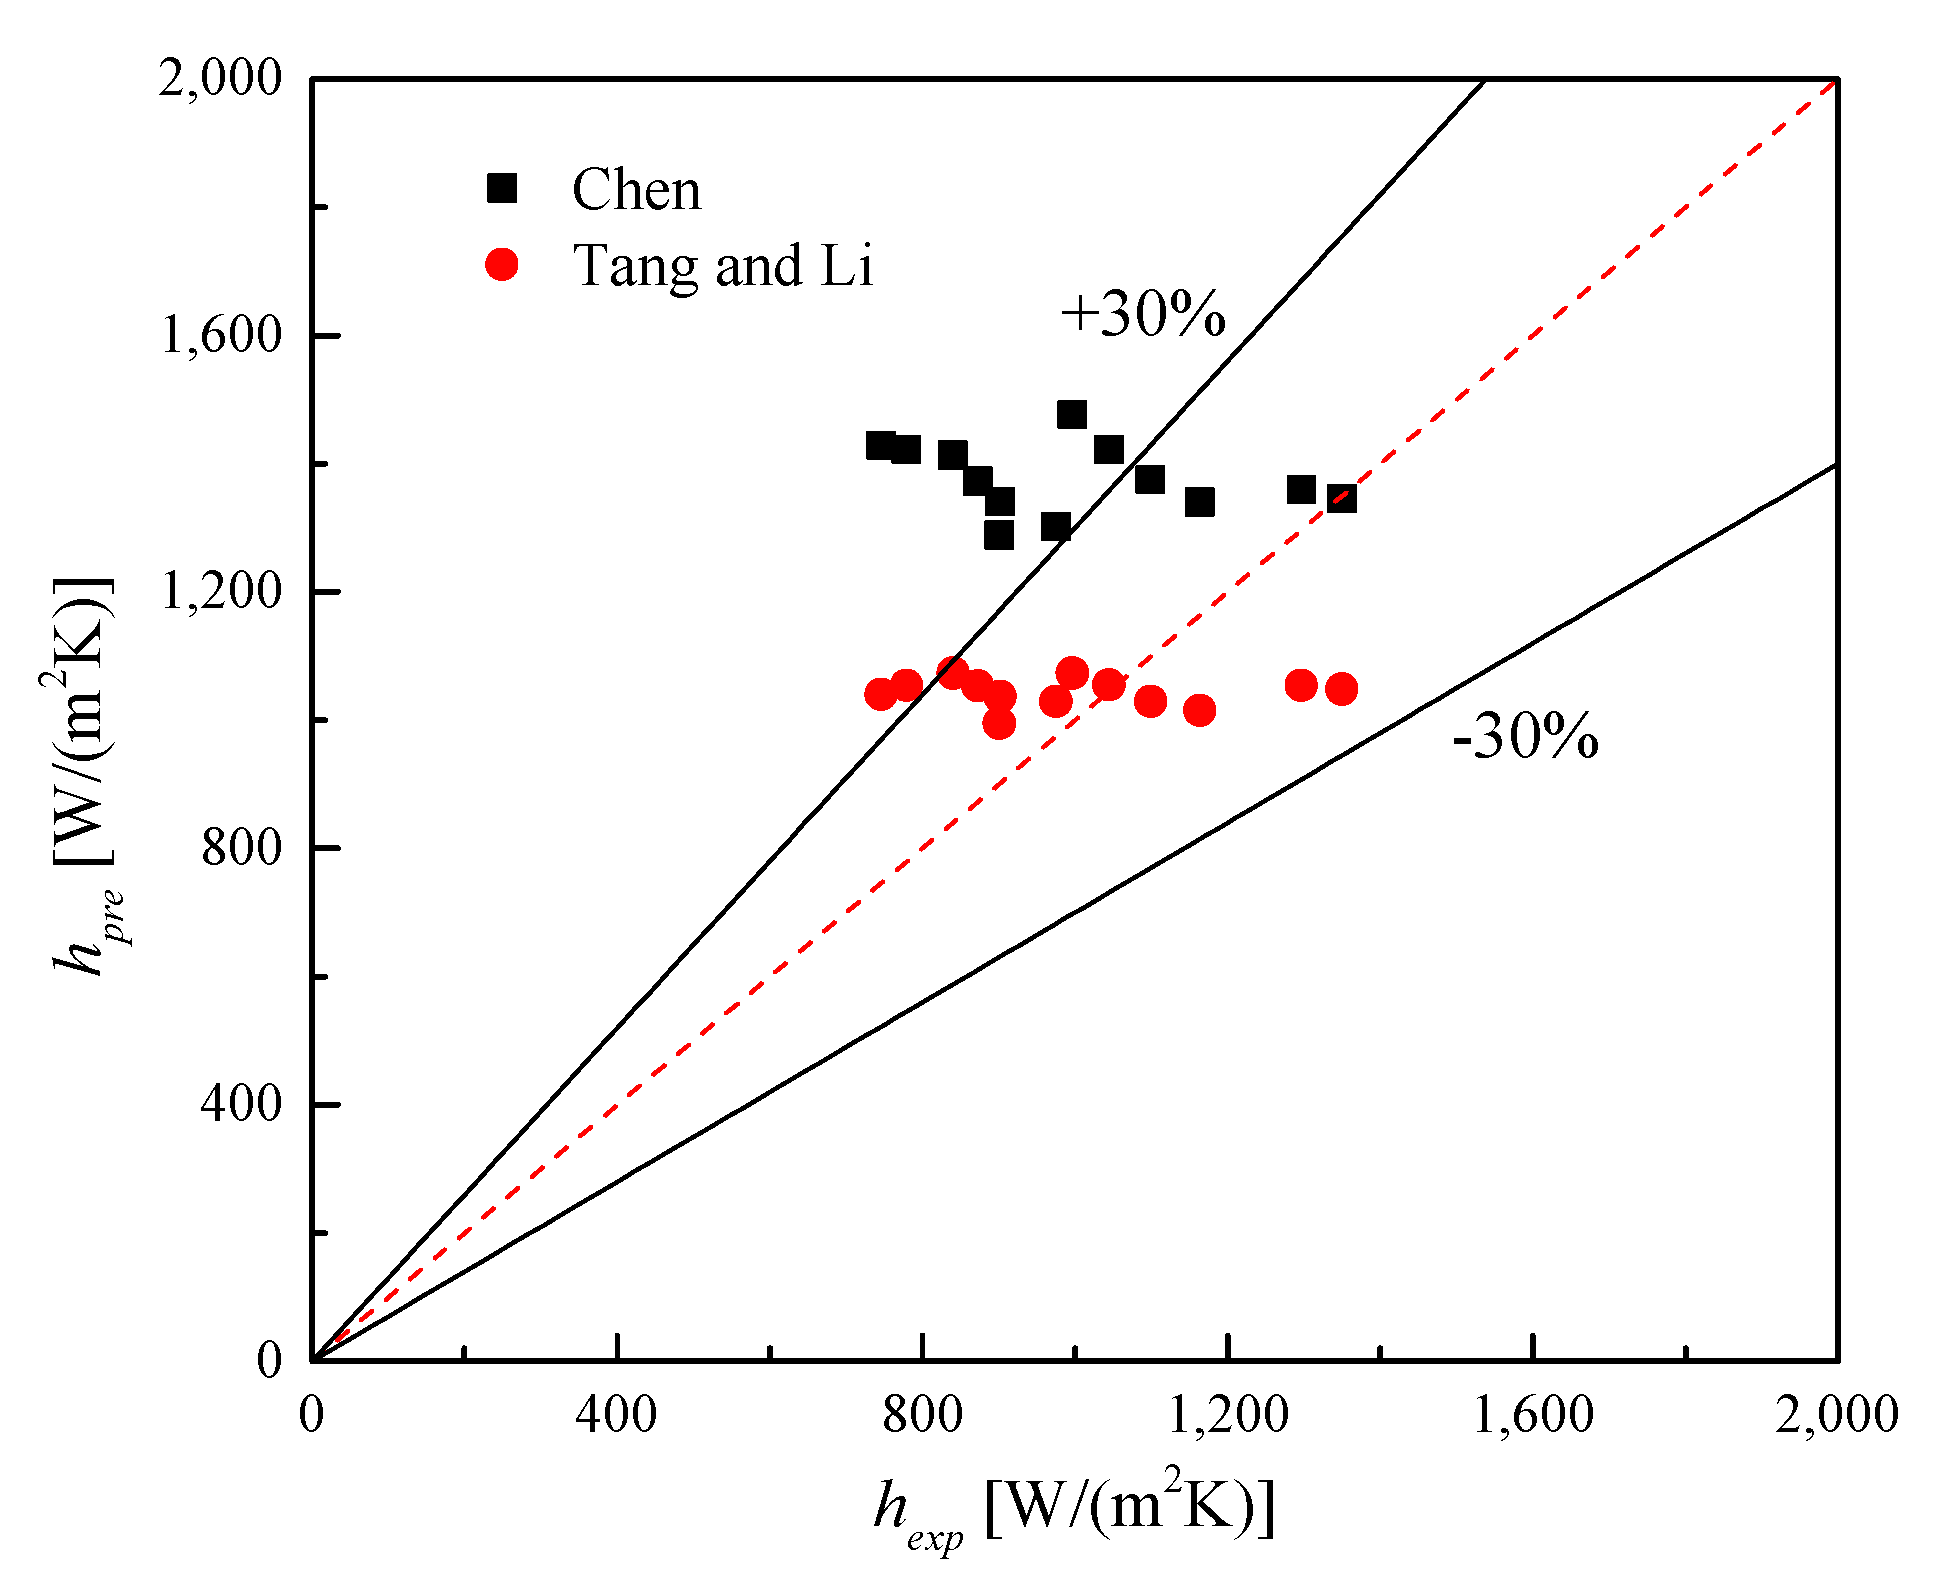
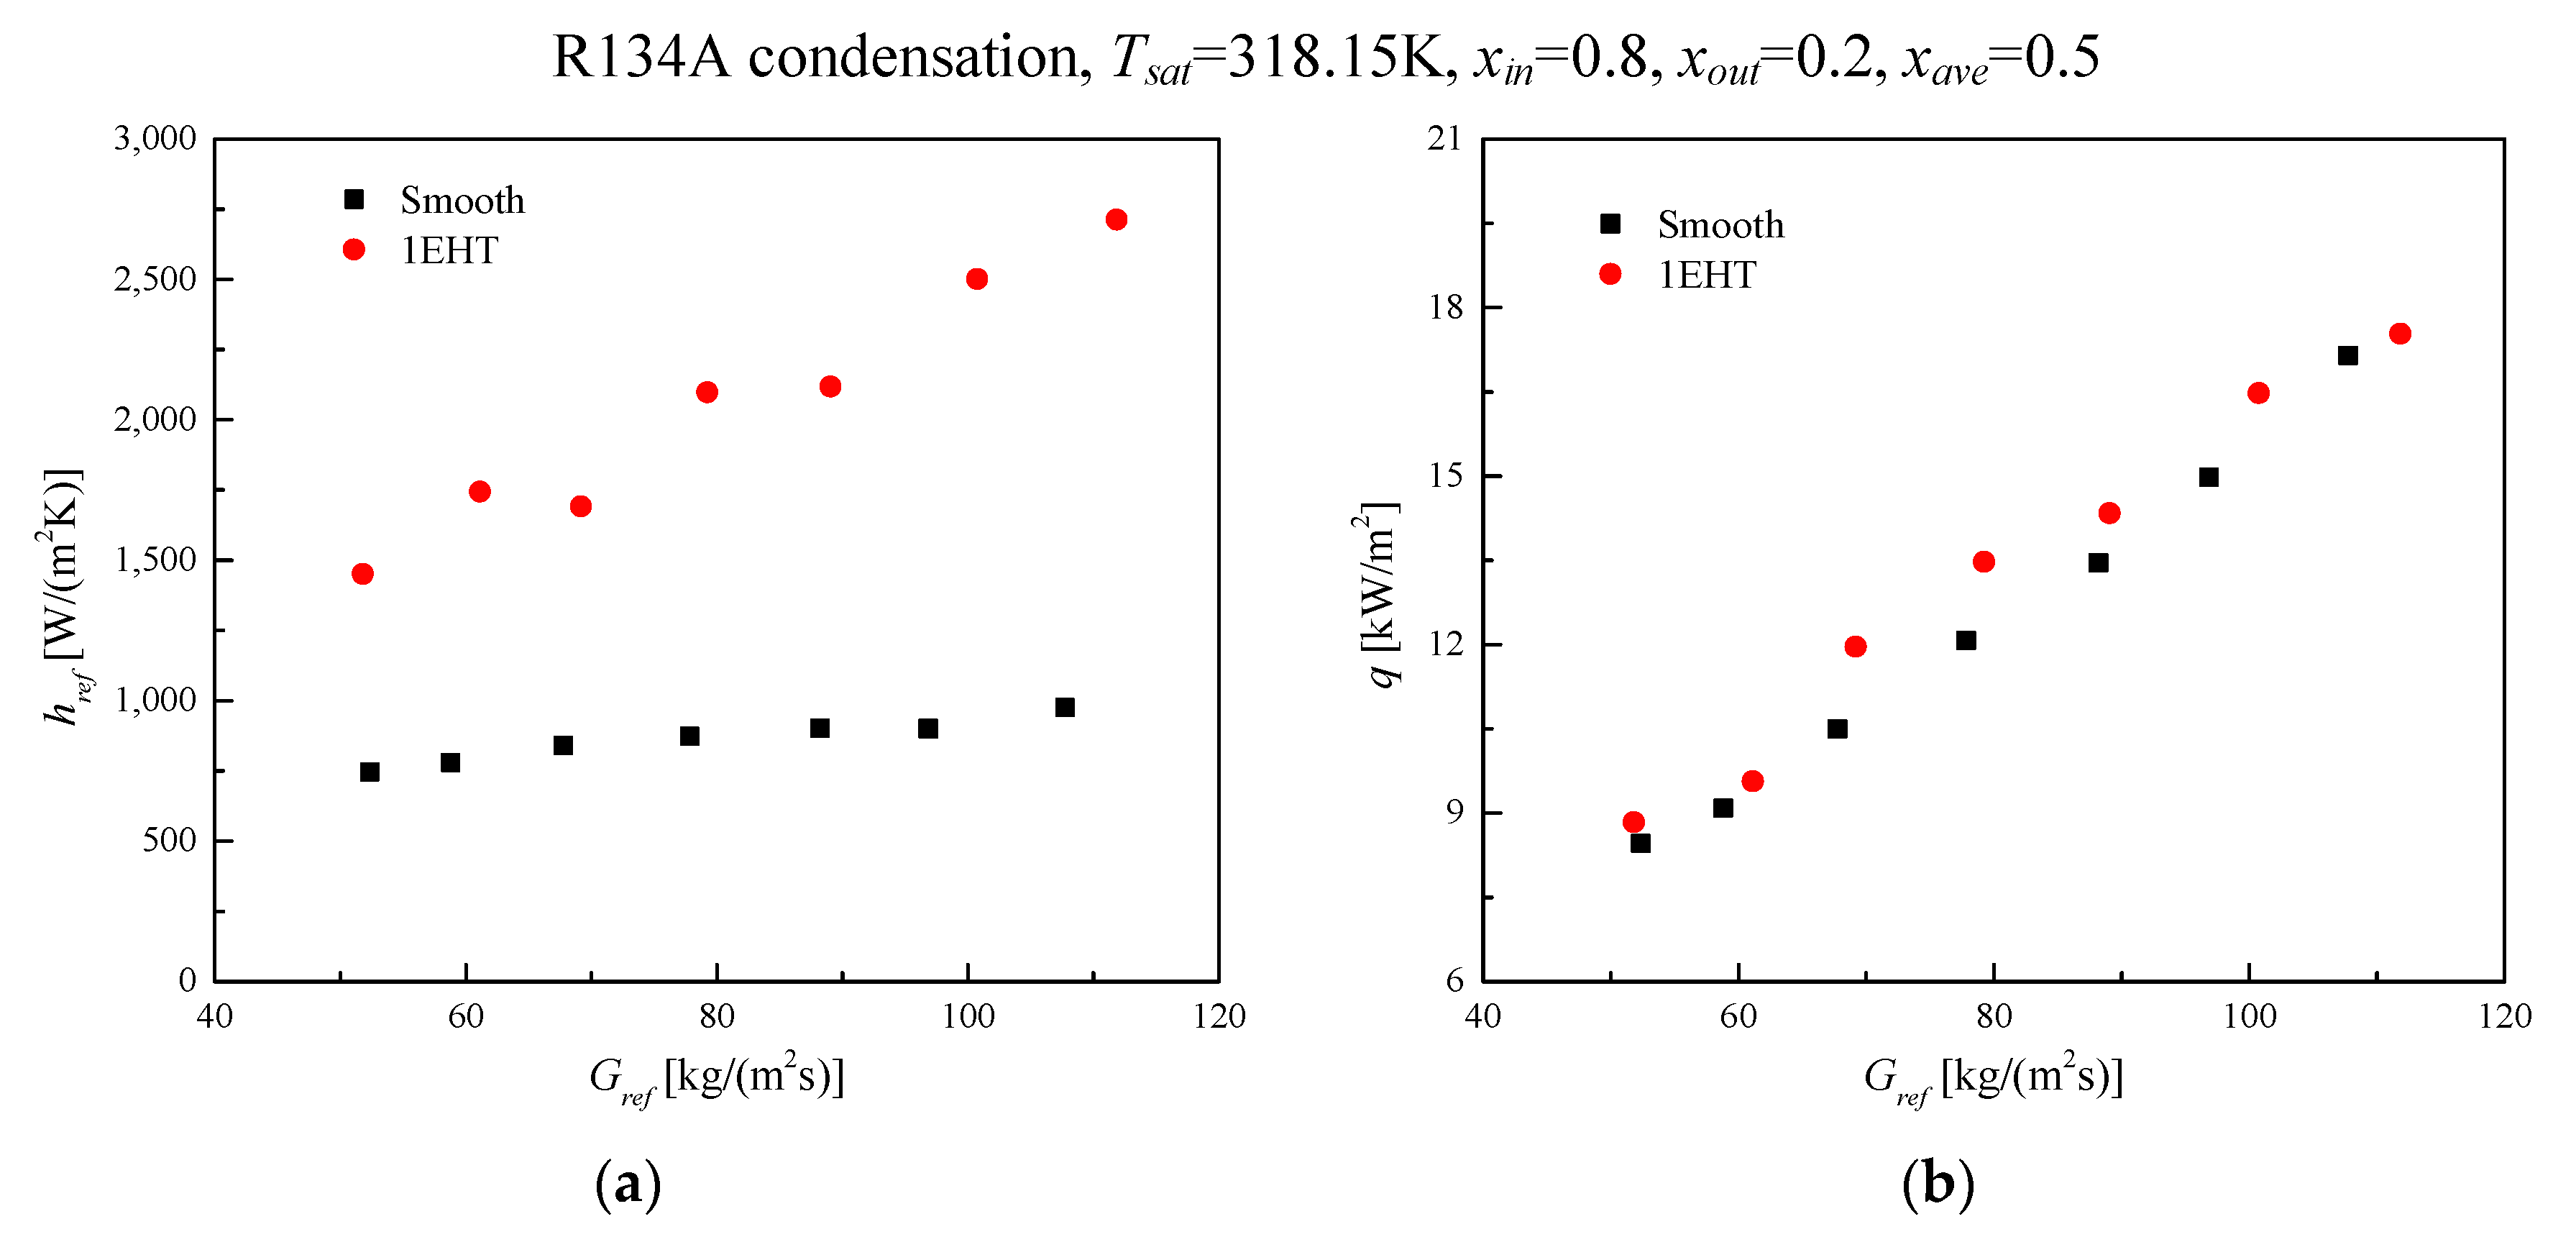
- The heat transfer coefficient increased with increasing mass velocities for both the smooth tube and the 1EHT tube. For condensation in the annulus of the smooth tube, the heat transfer coefficient in the wider annulus gap could achieve approximately 33% to 50% higher values than those found in the narrow gap; a reasonable prediction for a smooth tube was given by Tang and Li [18] correlation, with 84.6% of the data points falling in an error band of ±30%.
- In considering condensation in the annulus of the 1EHT tube, the 1EHT tube could greatly enhance the condensation heat transfer performance in an annulus compared to a smooth tube, and heat transfer enhancement in the range of 98–178% was seen. Furthermore, the heat transfer coefficient seemed to increase rapidly with increasing mass velocities due to the re-distribution of condensate along the circumference and the decreased liquid film thickness on the tube.
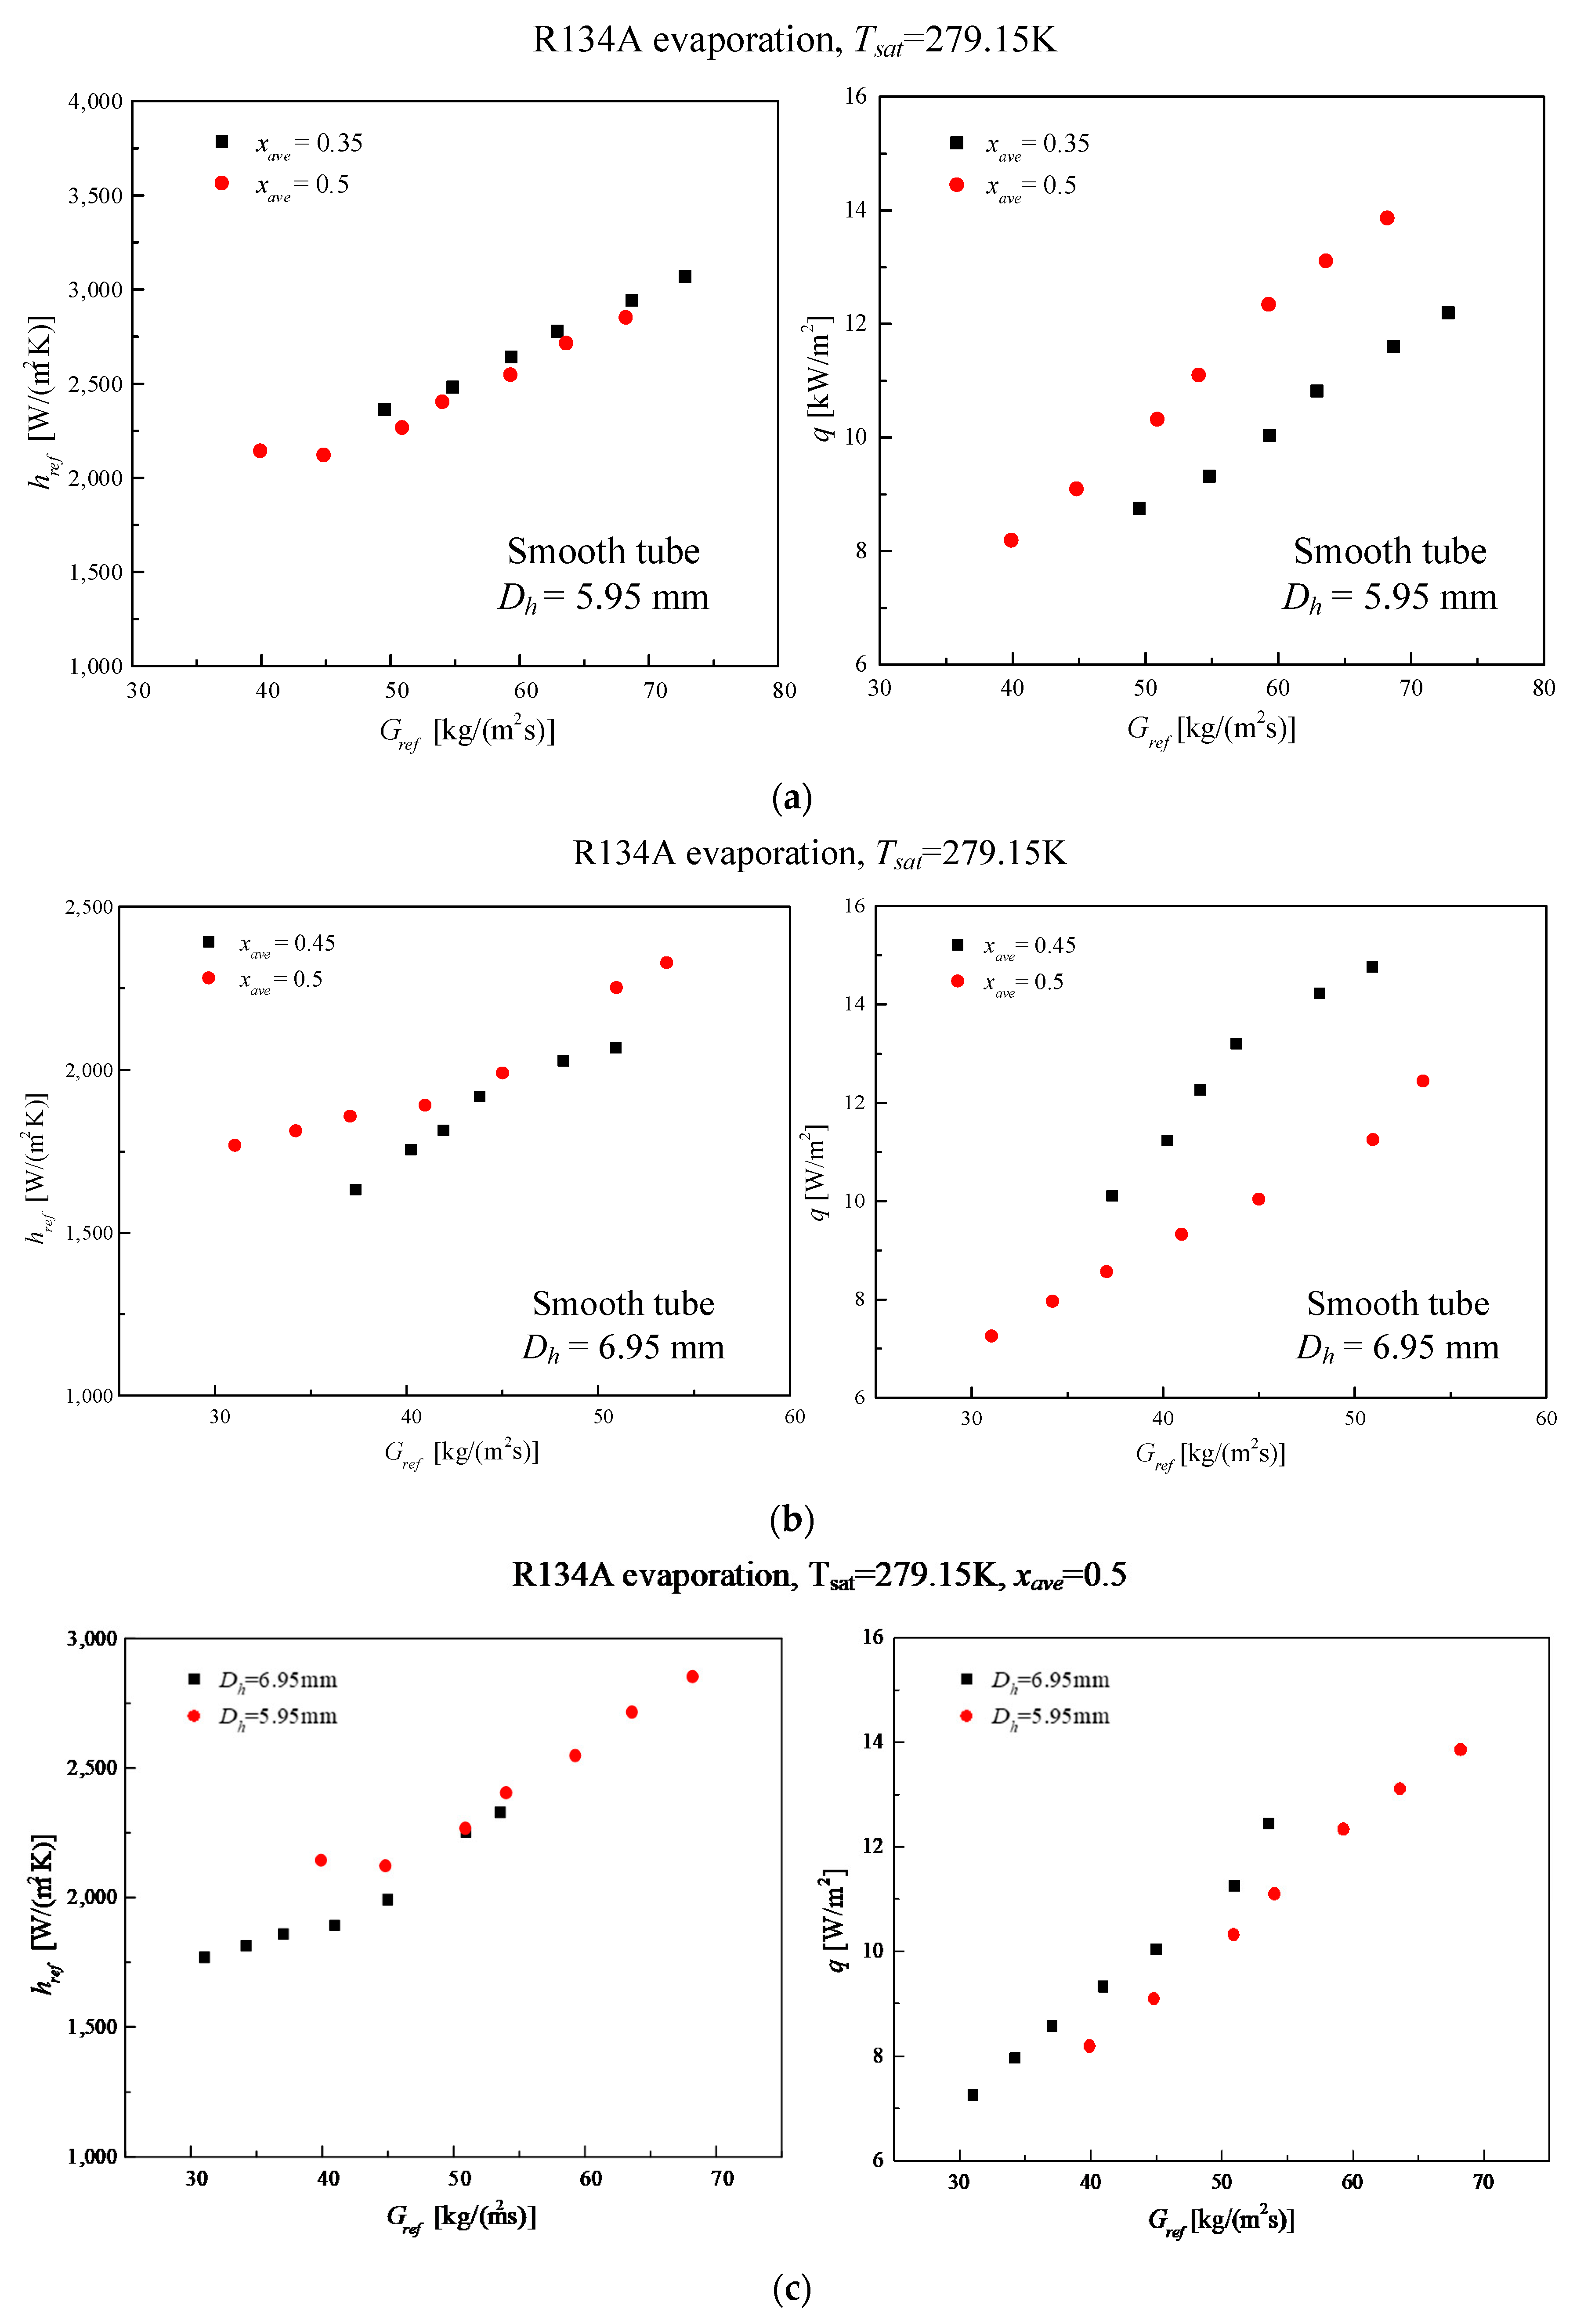
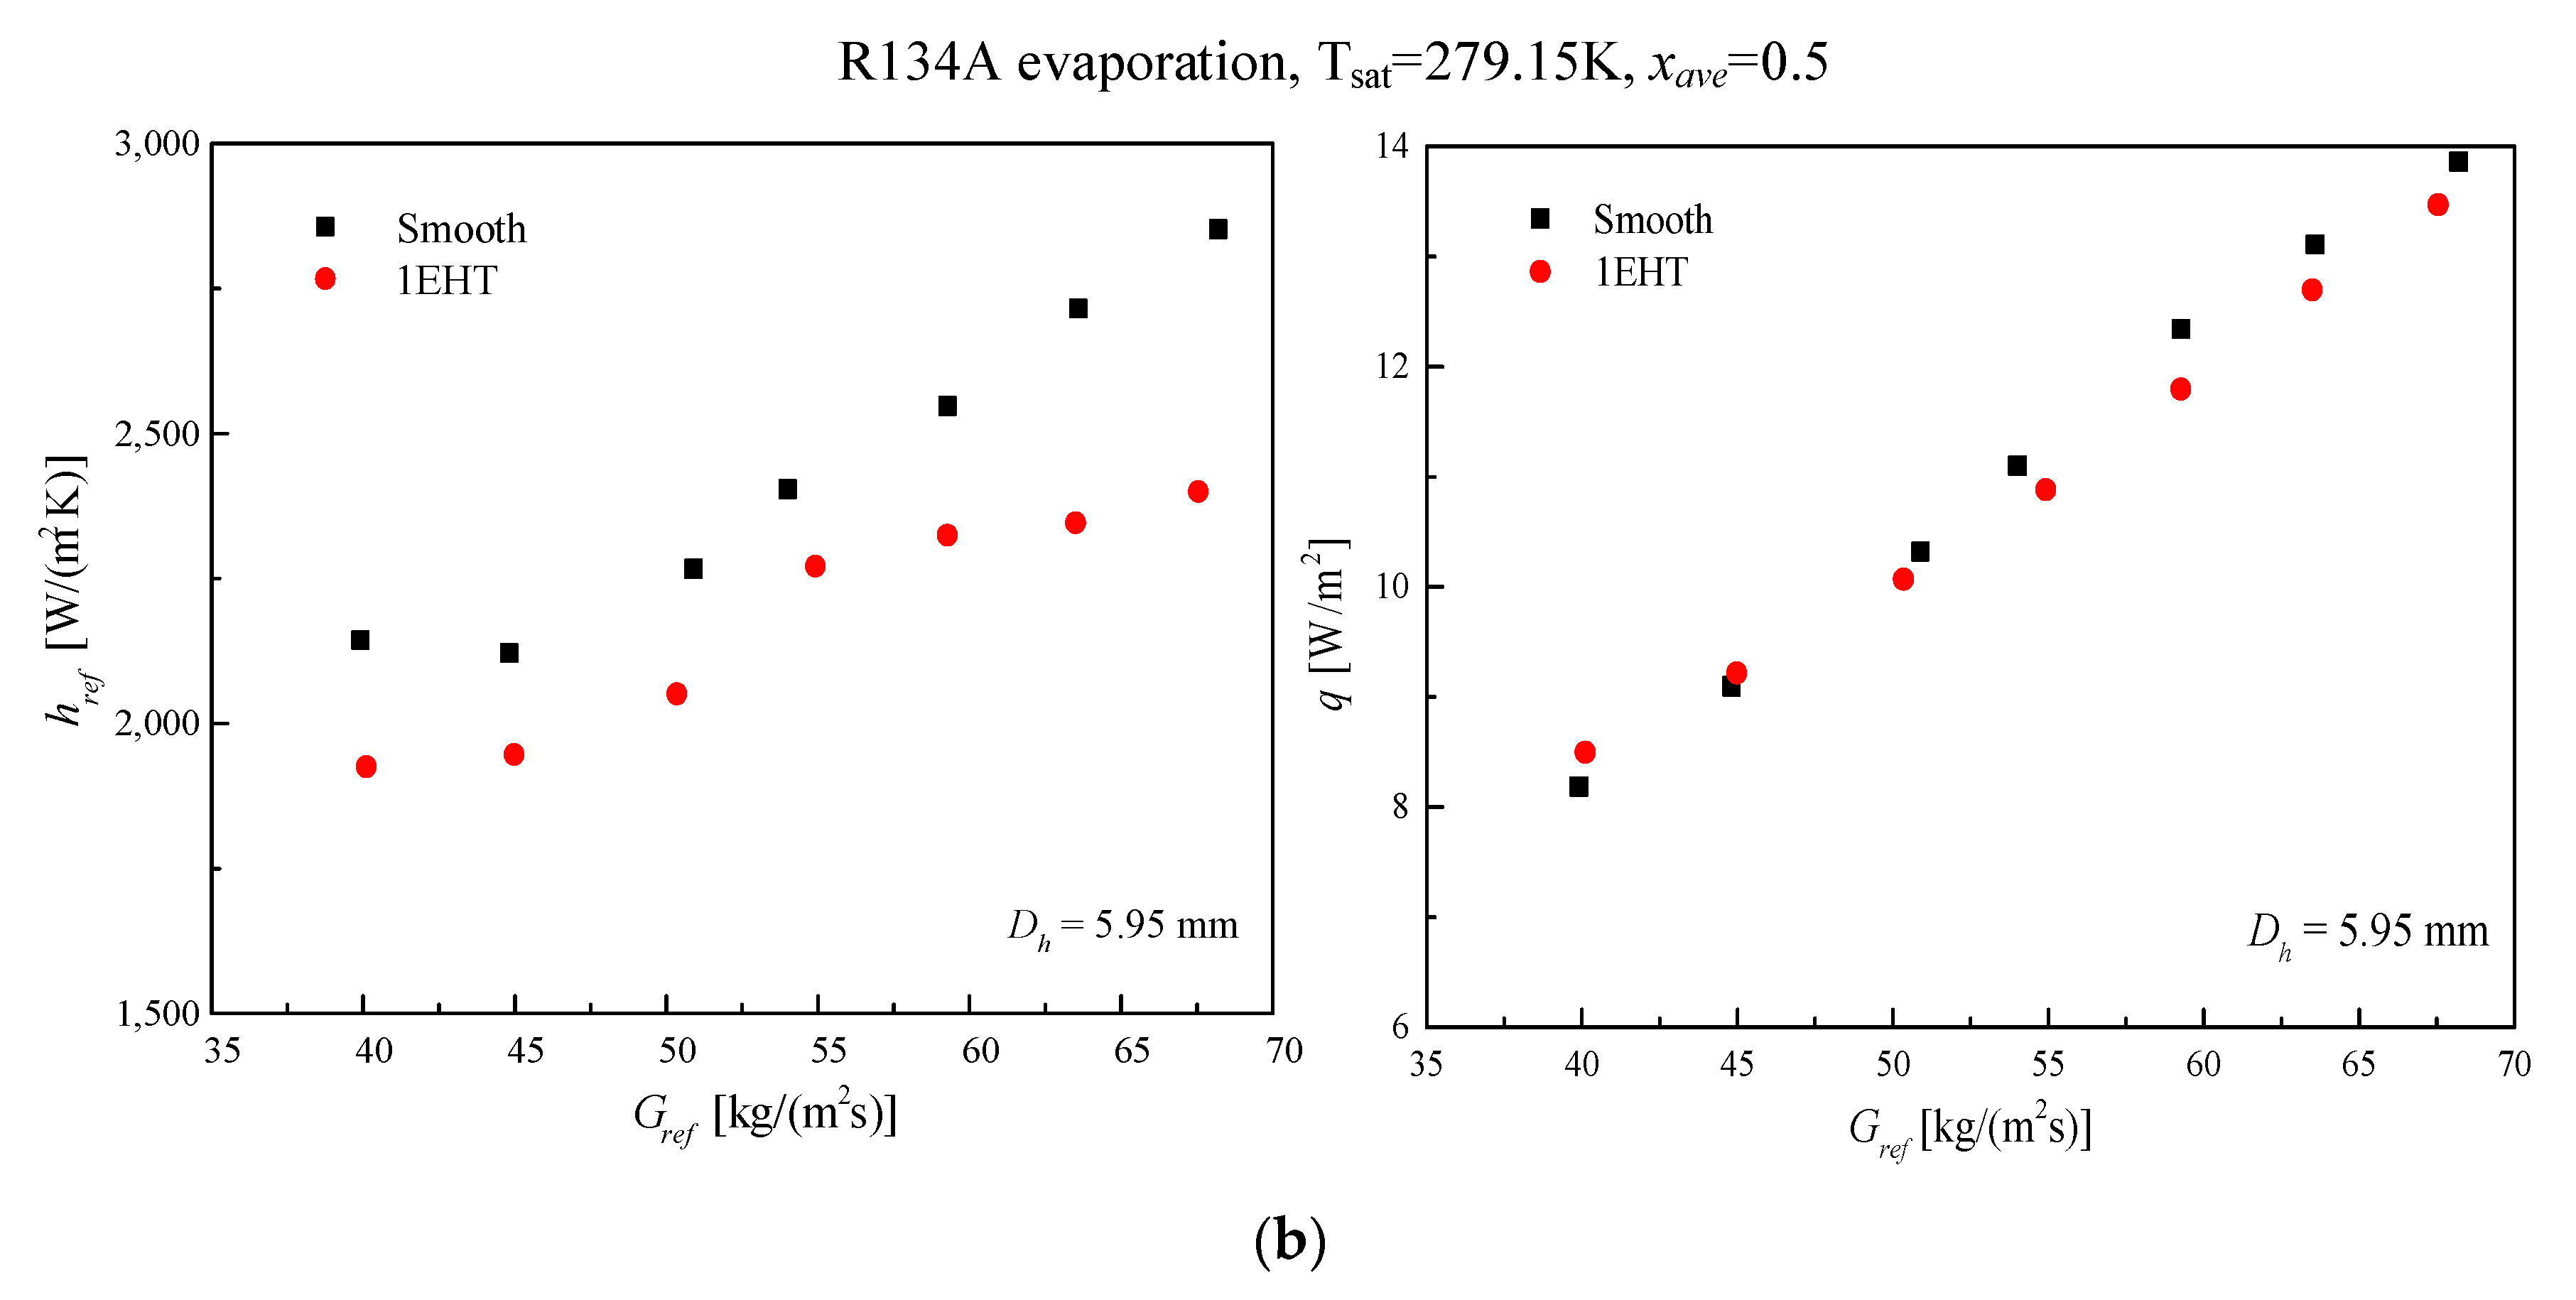
- For flow boiling in the annulus of the smooth tube, the heat transfer coefficient for evaporation of R134A in the smaller annulus gap (for Dh = 5.95 mm) increased gradually with increasing mass flux; little difference was found between the heat performance of xave = 0.35 and xave = 0.5, with the latter being a little lower than the former.
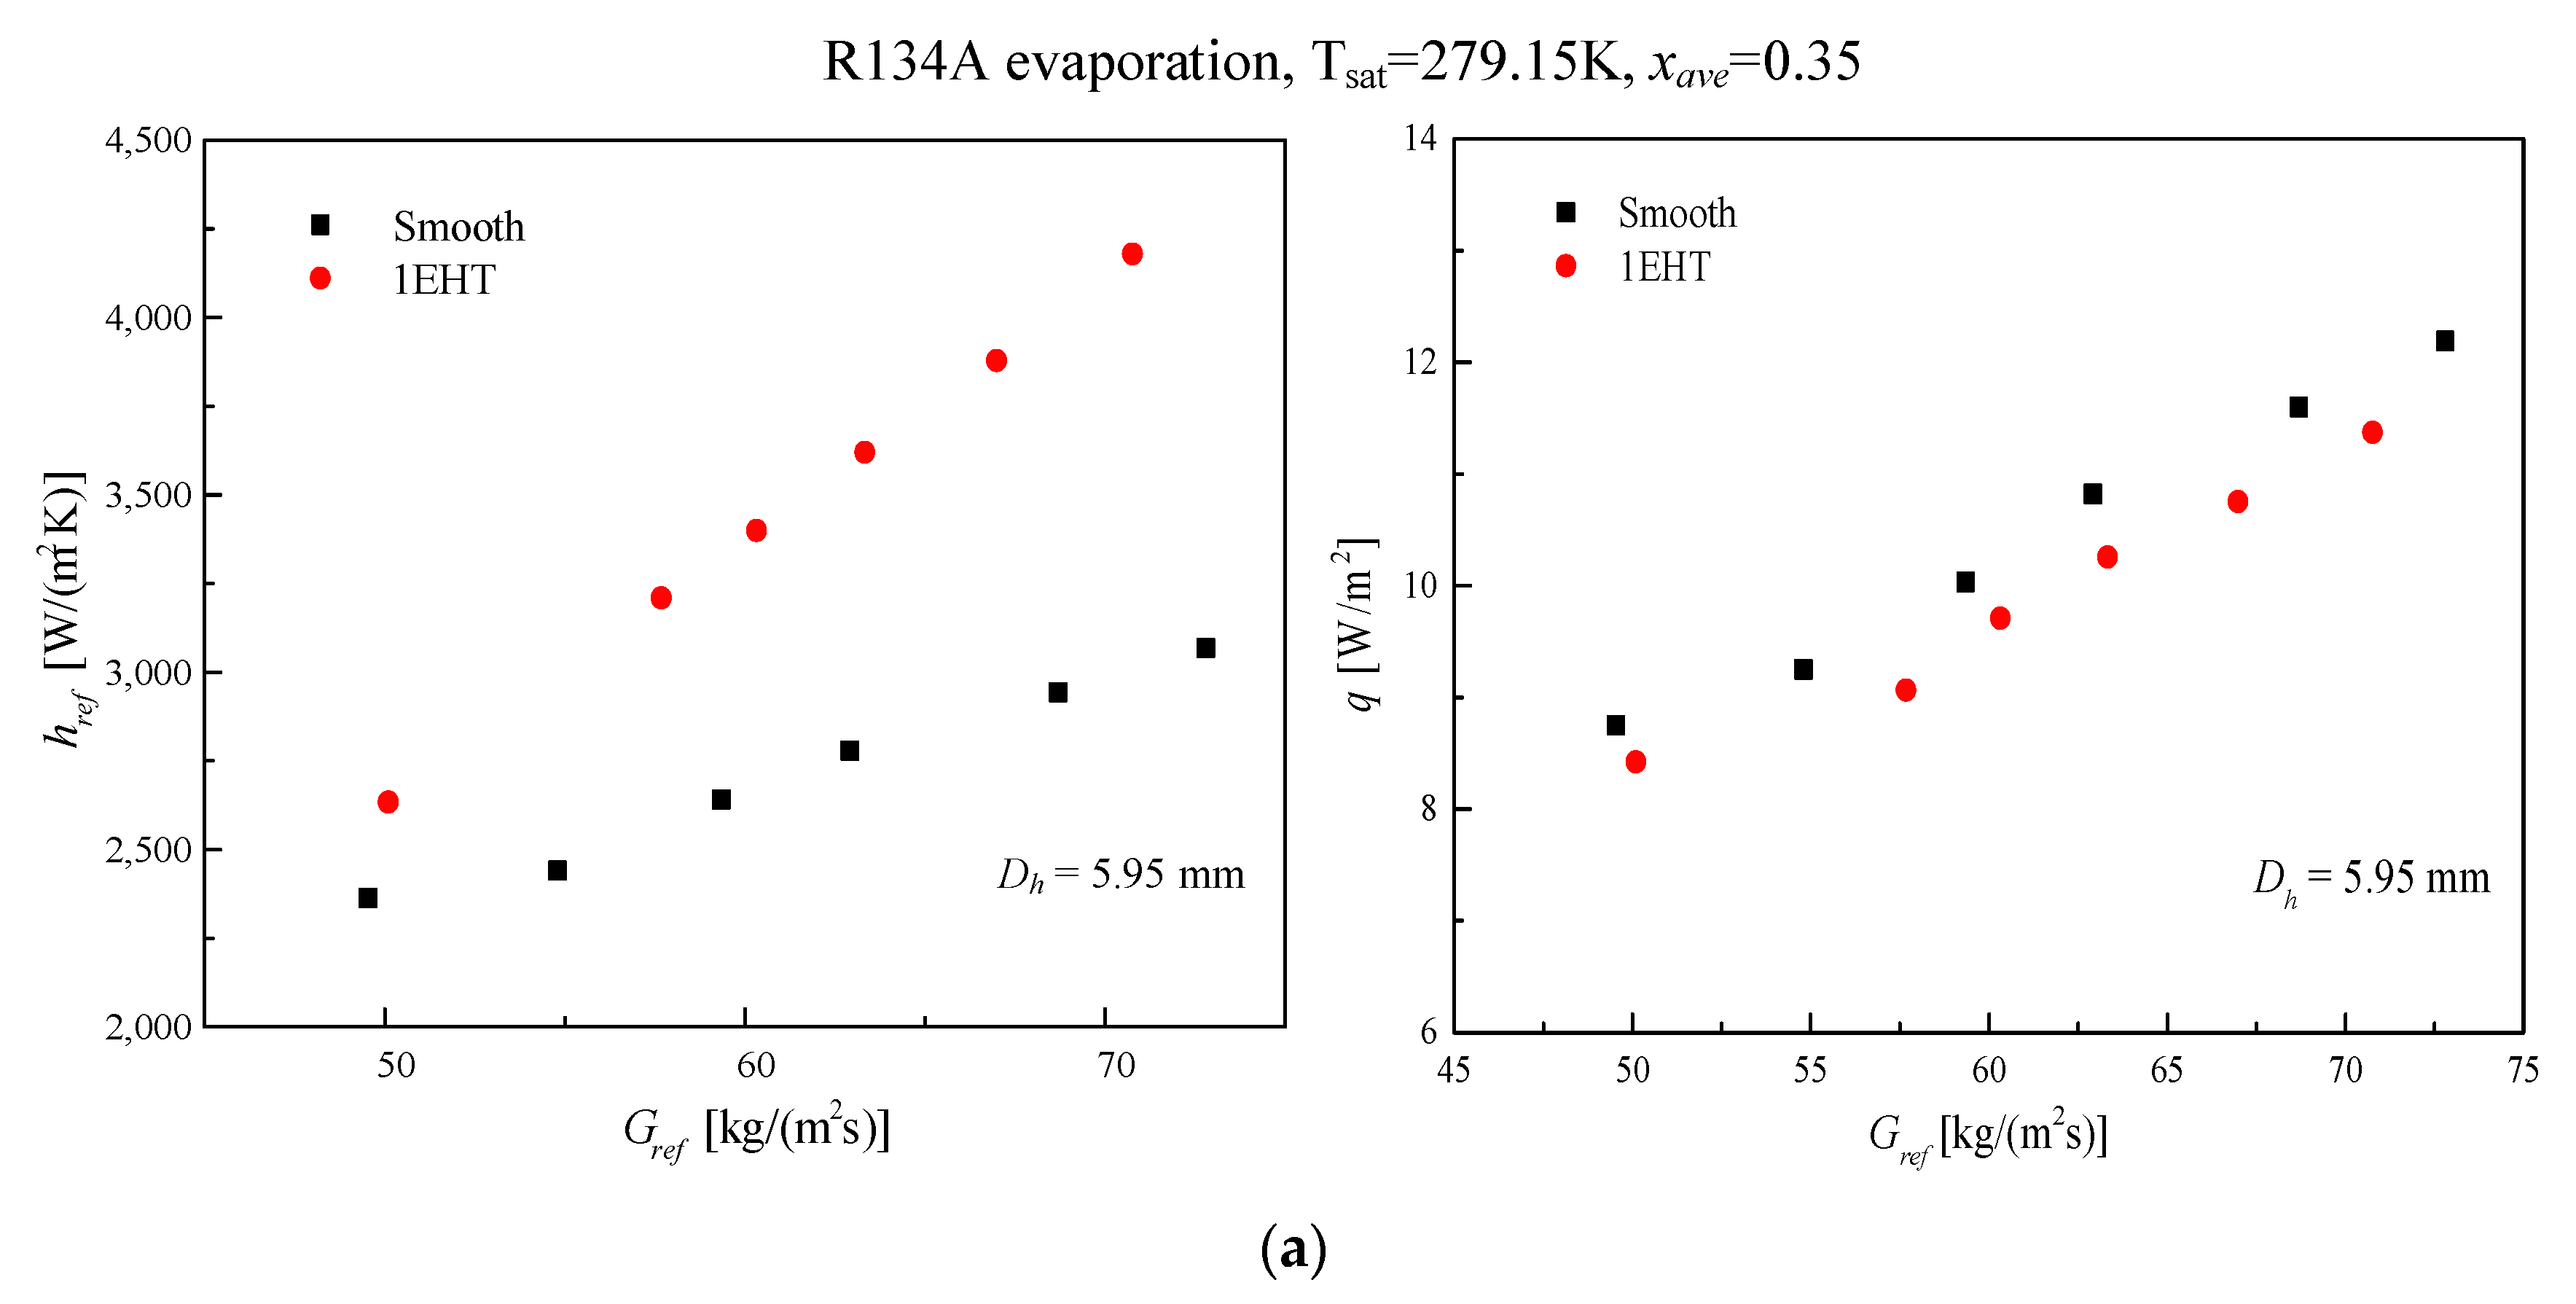
- For flow boiling in the annulus of the 1EHT tube, the heat transfer coefficient during flow boiling was enhanced by 11–36% compared to the smooth tube at xave = 0.35; however, the heat transfer performance of the 1EHT tube was smaller than that of the smooth tube at xave = 0.5. The heat transfer deterioration can be explained by a decrease in the effective nucleate flow boiling heat transfer area. This takes place because the flooded dimples are at a relatively high vapor quality, and a flow pattern transition takes place from slug/wavy-stratified flow to wavy-stratified flow. The results indicate that the unique enhancement units in this study may be inapplicable for the enhancement of wavy-stratified flow during flow boiling.
Author Contributions
Funding
Conflicts of Interest
Nomenclature
| Aa | actual heat transfer area, m2 |
| Ai | inner surface area of test tube, m2 |
| Ao | outer surface area of test tube, m2 |
| cp | specific heat, J/(kg·K) |
| di | inner diameter of test tube, m |
| do | outer diameter of test tube, m |
| Di | external diameter of annulus, m |
| Dh | hydraulic diameter of annulus, m |
| f | Fanning friction factor |
| g | gravitational acceleration, m/s2 |
| G | mass flux, kg/(m2∙s) |
| h | heat transfer coefficient, W/(m2·K) |
| hlv | latent heat of vaporization, J/kg |
| I | electric current, A |
| k | thermal conductivity, W/(m·K) |
| L | tube length, m |
| LMTD | logarithmic mean temperature, K |
| m | mass flow rate, kg/s |
| MAD | mean absolute deviation |
| N | number of points |
| Pr | Prandtl number |
| Q | heat transfer amount, W |
| q | heat flux, W/m2 |
| Re | Reynolds number |
| T | temperature, K |
| U | relative uncertainty |
| V | electric voltage, V |
| x | vapor quality |
| Greek symbols | |
| μ | dynamic viscosity, Pa·s |
| θ | angle, ° |
| ρ | density, kg/m3 |
| ε | void fraction |
| δ | liquid film thickness, m |
| λph | heat balance factor of the preheater |
| Subscripts | |
| ave | average |
| cal | calculation |
| dry | dry-out |
| e | enhanced |
| exp | experimental |
| i | inner |
| in | inlet |
| l | liquid phase |
| lat | latent heat |
| o | outer |
| out | outlet |
| ph | preheating section |
| pre | predicted |
| ref | refrigerant |
| s | smooth |
| sat | saturated |
| sens | sensible heat |
| tp | two-phase |
| ts | test section |
| v | vapor phase |
| wall | tube wall |
References
- Webb, R.L.; Kim, N.-H. Principles of Enhanced Heat Transfer, 2nd ed.; Taylor & Francis: Abingdon, UK, 2005. [Google Scholar]
- Wang, Y.; He, Y.-L.; Lei, Y.-G.; Zhang, J. Heat transfer and hydrodynamics analysis of a novel dimpled tube. Exp. Fluid Sci. 2010, 34, 1273–1281. [Google Scholar] [CrossRef]
- Li, M.; Khan, T.S.; Al-Hajri, E.; Ayub, Z.H. Single phase heat transfer and pressure drop analysis of a dimpled enhanced tube. Appl. Eng. 2016, 101, 38–46. [Google Scholar] [CrossRef]
- Li, M.; Khan, T.S.; Al Hajri, E.; Ayub, Z.H. Geometric optimization for thermal–hydraulic performance of dimpled enhanced tubes for single phase flow. Appl. Eng. 2016, 103, 639–650. [Google Scholar] [CrossRef]
- Vicente, P.G.; García, A.; Viedma, A. Heat transfer and pressure drop for low Reynolds turbulent flow in helically dimpled tubes. Int. J. Heat Mass Transf. 2002, 45, 543–553. [Google Scholar] [CrossRef]
- Kukulka, D.J.; Smith, R. Thermal-hydraulic performance of Vipertex 1EHT enhanced heat transfer tubes. Appl. Eng. 2013, 61, 60–66. [Google Scholar] [CrossRef]
- Lei, X.-S.; Shuang, J.-J.; Yang, P.; Liu, Y.-W. Parametric study and optimization of dimpled tubes based on Response Surface Methodology and desirability approach. Int. J. Heat Mass Tran. 2019, 142, 118453. [Google Scholar] [CrossRef]
- Suresh, S.; Chandrasekar, M.; Chandra Sekhar, S. Experimental studies on heat transfer and friction factor characteristics of CuO/water nanofluid under turbulent flow in a helically dimpled tube. Exp. Fluid Sci. 2011, 35, 542–549. [Google Scholar] [CrossRef]
- Guo, S.P.; Wu, Z.; Li, W.; Kukulka, D.; Sunden, B.; Zhou, X.P.; Wei, J.J.; Simon, T. Condensation and evaporation heat transfer characteristics in horizontal smooth, herringbone and enhanced surface EHT tubes. Int. J. Heat Mass Transf. 2015, 85, 281–291. [Google Scholar] [CrossRef]
- Li, W.; Chen, J.; Zhu, H.; Kukulka, D.J.; Minkowycz, W.J. Experimental study on condensation and evaporation flow inside horizontal three dimensional enhanced tubes. Int. Commun. Heat Mass 2017, 80, 30–40. [Google Scholar] [CrossRef]
- Aroonrat, K.; Wongwises, S. Experimental study on two-phase condensation heat transfer and pressure drop of R-134a flowing in a dimpled tube. Int. J. Heat Mass Transf. 2017, 106, 437–448. [Google Scholar] [CrossRef]
- Aroonrat, K.; Wongwises, S. Experimental investigation of condensation heat transfer and pressure drop of R-134a flowing inside dimpled tubes with different dimpled depths. Int. J. Heat Mass Transf. 2019, 128, 783–793. [Google Scholar] [CrossRef]
- Aroonrat, K.; Wongwises, S. Condensation heat transfer and pressure drop characteristics of R-134a flowing through dimpled tubes with different helical and dimpled pitches. Int. J. Heat Mass Transf. 2018, 121, 620–631. [Google Scholar] [CrossRef]
- Sarmadian, A.; Shafaee, M.; Mashouf, H.; Mohseni, S.G. Condensation heat transfer and pressure drop characteristics of R-600a in horizontal smooth and helically dimpled tubes. Exp. Fluid Sci. 2017, 86, 54–62. [Google Scholar] [CrossRef]
- Shafaee, M.; Mashouf, H.; Sarmadian, A.; Mohseni, S.G. Evaporation heat transfer and pressure drop characteristics of R-600a in horizontal smooth and helically dimpled tubes. Appl. Eng. 2016, 107, 28–36. [Google Scholar] [CrossRef]
- Ayub, Z.H.; Ayub, A.H.; Ribatski, G.; Moreira, T.A.; Khan, T.S. Two-phase pressure drop and flow boiling heat transfer in an enhanced dimpled tube with a solid round rod insert. Int. J. Refrig. 2017, 75, 1–13. [Google Scholar] [CrossRef]
- Li, W.; Chen, X.; Chen, J.-X.; Sun, Z.-C.; Simon, T.W. Shell-Side Flow Condensation of R410A on Horizontal Tubes at Low-Mass Fluxes. J. Heat Transf. 2016, 139. [Google Scholar] [CrossRef]
- Tang, W.; Li, W. Shell-side Condensation Characteristics of R410a on Horizontal Enhanced Tubes. J. Heat Transf. 2019. [Google Scholar] [CrossRef]
- Al-Sallami, W.; Al-Damook, A.; Thompson, H.M. A numerical investigation of the thermal-hydraulic characteristics of perforated plate fin heat sinks. Int. J. Sci. 2017, 121, 266–277. [Google Scholar] [CrossRef]
- Dorao, C.A.; Fernandino, M. Simple and general correlation for heat transfer during flow condensation inside plain pipes. Int. J. Heat Mass Transf. 2018, 122, 290–305. [Google Scholar] [CrossRef]
- Li, W.; Tang, W.; Chen, J.; Zhu, H.; Kukulka, D.J.; He, Y.; Sun, Z.; Du, J.; Zhang, B. Convective condensation in three enhanced tubes with different surface modifications. Exp. Fluid Sci. 2018, 97, 79–88. [Google Scholar] [CrossRef]
- Gnielinski, V. New Equations for Heat and Mass Transfer in Turbulent Pipe and Channel Flows. NASA Sti/Recon Tech. Rep. A 1976, 75, 8–16. [Google Scholar]
- Petukhov, B.S. Heat Transfer and Friction in Turbulent Pipe Flow with Variable Physical Properties. Adv. Heat Transf. 1970, 6, 503–564. [Google Scholar]
- Lemmon, E.W.; Huber, M.L.; Mclinden, M.O. NIST Standard Reference Database 23: Reference Fluid Thermodynamic and Transport Properties—REFPROP, version 9.1; Standard Reference Data Program; National Institute of Standards and Technology: Gaithersburg, MD, USA, 2010. [Google Scholar]
- Moffat, R.J. Describing the uncertainties in experimental results. Exp. Fluid Sci. 1988, 1, 3–17. [Google Scholar] [CrossRef]
- Chen, J.-X.; Chen, X.; He, Y.; Kukulka, D.; Li, W.; Liu, L.; Ma, L.; Smith, R.; Zhang, B. Investigation on flow condensation of refrigerant in annulus of smooth and enhanced tube-in-tube heat exchanger. Heat Mass Transf. 2019, 55, 223–234. [Google Scholar] [CrossRef]
- Cavallini, A.; Col, D.D.; Doretti, L.; Matkovic, M.; Rossetto, L.; Zilio, C.; Censi, G. Condensation in Horizontal Smooth Tubes: A New Heat Transfer Model for Heat Exchanger Design. Heat Transf. Eng. 2006, 27, 31–38. [Google Scholar] [CrossRef]
- Chen, J.C. Correlation for Boiling Heat Transfer to Saturated Fluids in Convective Flow. Ind. Eng. Chem. Process Des. Dev. 1966, 5, 322–329. [Google Scholar] [CrossRef]
- Cooper, M.G. Saturation nucleate pool boiling: A simple correlation. IChemE Symp. Ser. 1984, 86, 786. [Google Scholar] [CrossRef]
- Wojtan, L.; Ursenbacher, T.; Thome, J.R. Investigation of flow boiling in horizontal tubes: Part I—A new diabatic two-phase flow pattern map. Int. J. Heat Mass Tran. 2005, 48, 2955–2969. [Google Scholar] [CrossRef]
- Chen, J.; Li, W. Local flow boiling heat transfer characteristics in three-dimensional enhanced tubes. Int. J. Heat Mass Transf. 2018, 121, 1021–1032. [Google Scholar] [CrossRef]


| Tube Parameters | 1EHT Tube | Smooth Tube |
|---|---|---|
| Internal diameter of inner tube, di (mm) | 17.09 | 17.09 |
| Outer diameter of inner tube, do (mm) | 19.05 | 19.05 |
| Average wall thickness (mm) | 0.98 | 0.98 |
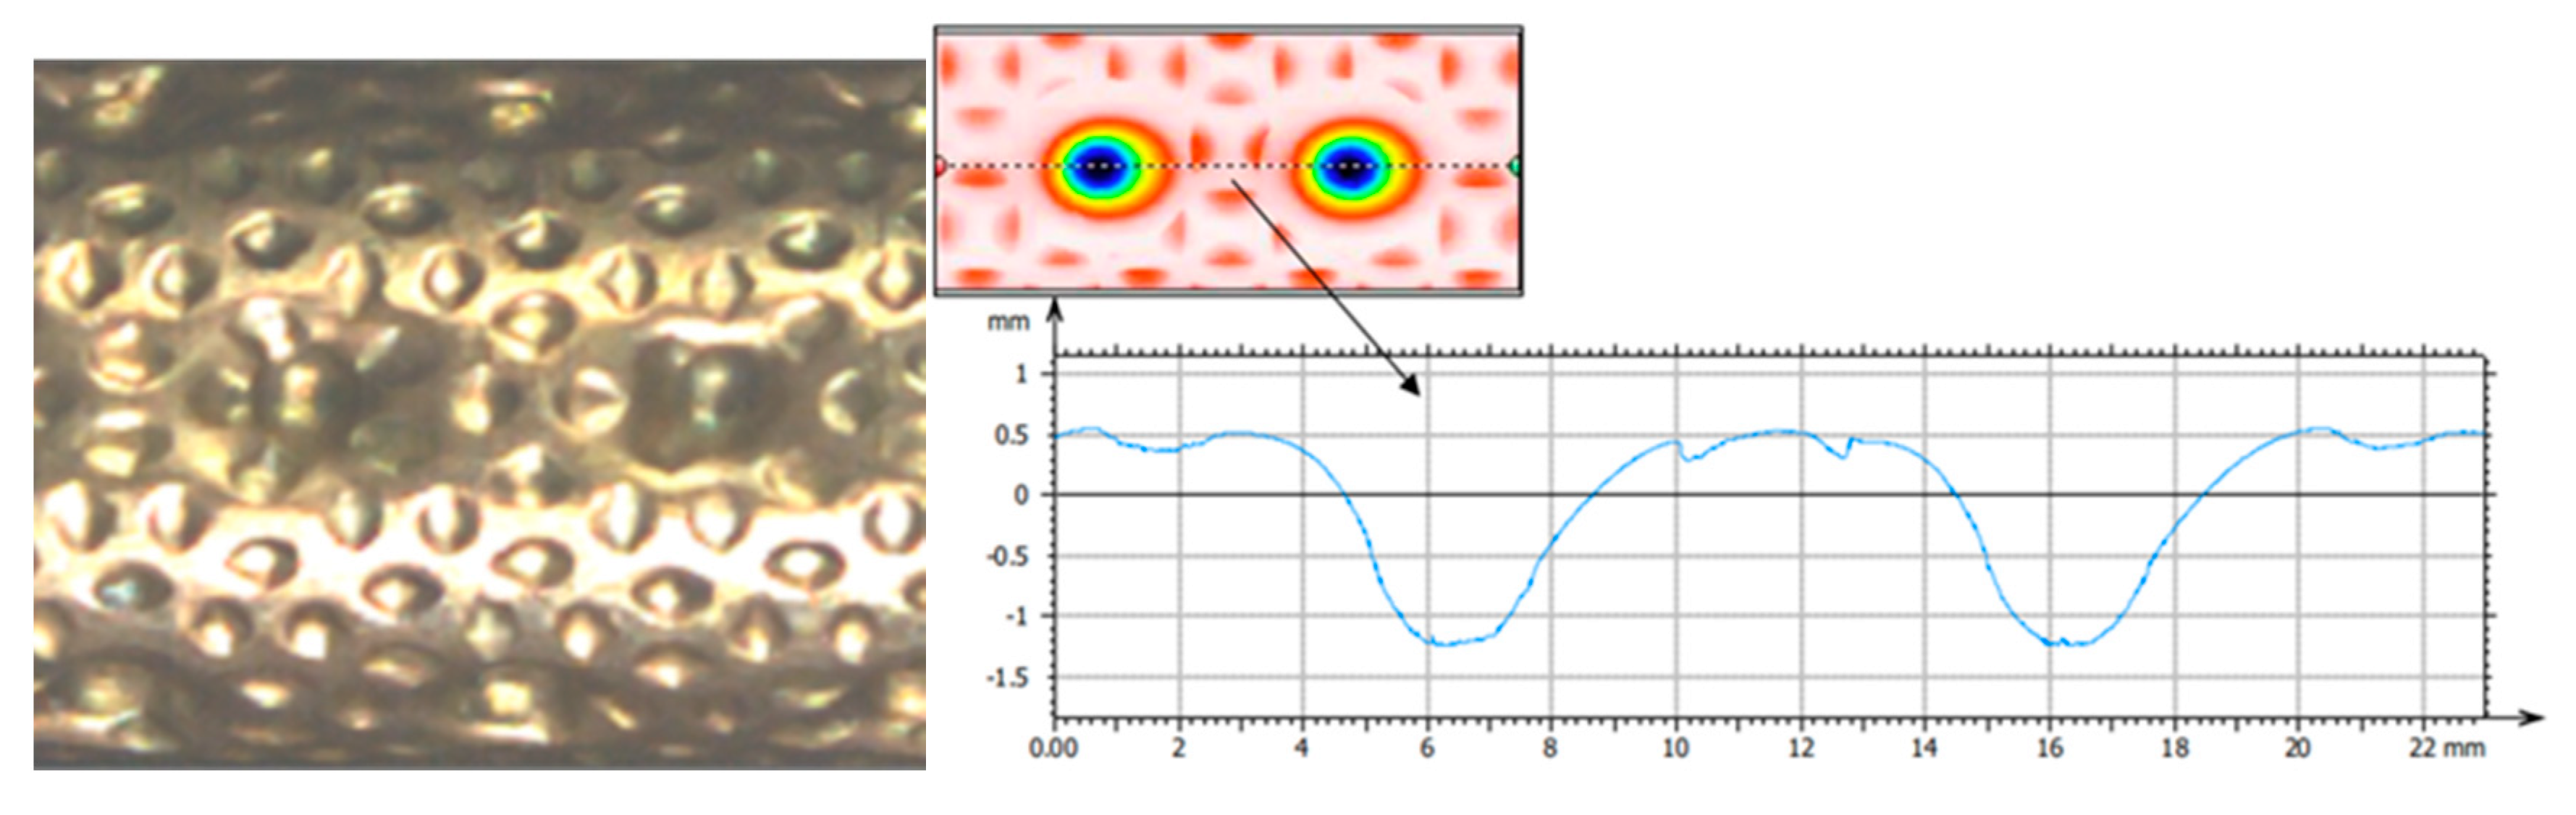
| Height of dimple/protrusion (mm) | 1.71 | - |
| Projection diameter (mm) | 4.4 | - |
| Dimpled/protruded pitch (mm) | 9.86 | - |
| Helix angle, θ (°) | 60 | - |
| Ratio of actual heat transfer area, AE/AS | 1.20 | 1 |
| Inside diameter of outer tube, Di (mm) | 25, 26 | 25, 26 |
| Tube length, L (m) | 2 | 2 |
| Tube material | copper | copper |
| In-tube heat transfer enhancement ratio, a | 1.38 | - |
| Parameters | Range | |
|---|---|---|
| Refrigerant | R134A | |
| Experimental type | Evaporation | Condensation |
| Saturation temperature, Tsat (°C) | 6 | 45 |
| Refrigerant mass velocity, G (kg/m2∙s) | 30–80 | 50–120 |
| Heat flux, q (kW/m2) | 9.04–15.21 | 9.32–19.49 |
| Average vapor quality, xave | 0.35, 0.5 | 0.1–0.9 |
| Measured Parameters | Accuracy |
|---|---|
| Diameter | ±0.05 mm |
| Length | ±0.5 mm |
| Temperature | ±0.1 K |
| Pressure, range: 0–5000 kPa | ±0.075% of full scale |
| Differential pressure, range: 0–50 kPa | ±0.075% of full scale |
| Refrigerant mass flow rate, range: 0–120 kg/h | ±0.2% of reading |
| Water mass flow rate, range: 0–600 kg/h | ±0.2% of reading |
| Calculated Parameters | Uncertainty |
| Mass velocity, G (kg/m2∙s) | ±1.17% |
| Heat flux, q (kW/m2) | ±2.64% |
| Vapor quality, x | ±4.12% |
| Heat transfer coefficient, href (W/m2∙K) | ±12.12% |
© 2020 by the authors. Licensee MDPI, Basel, Switzerland. This article is an open access article distributed under the terms and conditions of the Creative Commons Attribution (CC BY) license (http://creativecommons.org/licenses/by/4.0/).
Share and Cite
Tang, W.; Kukulka, D.J.; Li, W.; Smith, R. Comparison of the Evaporation and Condensation Heat Transfer Coefficients on the External Surface of Tubes in the Annulus of a Tube-in-Tube Heat Exchanger. Energies 2020, 13, 952. https://doi.org/10.3390/en13040952
Tang W, Kukulka DJ, Li W, Smith R. Comparison of the Evaporation and Condensation Heat Transfer Coefficients on the External Surface of Tubes in the Annulus of a Tube-in-Tube Heat Exchanger. Energies. 2020; 13(4):952. https://doi.org/10.3390/en13040952
Chicago/Turabian StyleTang, Weiyu, David John Kukulka, Wei Li, and Rick Smith. 2020. "Comparison of the Evaporation and Condensation Heat Transfer Coefficients on the External Surface of Tubes in the Annulus of a Tube-in-Tube Heat Exchanger" Energies 13, no. 4: 952. https://doi.org/10.3390/en13040952
APA StyleTang, W., Kukulka, D. J., Li, W., & Smith, R. (2020). Comparison of the Evaporation and Condensation Heat Transfer Coefficients on the External Surface of Tubes in the Annulus of a Tube-in-Tube Heat Exchanger. Energies, 13(4), 952. https://doi.org/10.3390/en13040952