Article

Weather Risk Management in Energy Sector: The Polish Case

by
Monika Wieczorek-Kosmala
College of Finance, University of Economics in Katowice, 1 Maja 50, 40-287 Katowice, Poland
Energies 2020, 13(4), 945; https://doi.org/10.3390/en13040945
Submission received: 12 January 2020 / Revised: 7 February 2020 / Accepted: 18 February 2020 / Published: 20 February 2020
(This article belongs to the Special Issue Uncertainties and Risk Management in Competitive Energy Markets)

Abstract

:
The energy sector is perceived as one of the most exposed sectors to the consequences of weather risk both directly (damages of its infrastructure) and indirectly (frictions to the energy supply–demand balance). The main aim of this paper is to provide an insight into the impact of weather risk on economic activity of companies operating in the energy sector in Poland. The empirical objective is to examine whether energy companies: (i) identify their relevant weather risk exposures; (ii) evaluate the impact of weather risk in the cost-revenues dimension; and (iii) implement weather risk management tools, in this case—weather derivatives. In a methodical context, this study relies on a unique research approach and derives from works that examine companies’ risk disclosures in annual reports, by applying textual content analysis. The results indicate that Polish energy companies recognize the impact of weather risk on their performance, also in the cost-revenues dimension. However, although the reported weather risk management methods were diversified, the examined companies did not use weather derivatives to hedge their weather risk exposures. In the overall dimension, the companies leading with the perception and management of weather risk were diversified regarding performance and market size.

1. Introduction

Weather risk-related studies commonly address the relevance of the global climate change we face nowadays. The fact is that since the end of the 19th century the average surface temperatures on Earth have grown constantly and since the pre-industrial reference period have increased by 1.5 °C [1]. This trend is a mostly human-induced phenomenon, as the observed warming is attributed to human activities. The growth of average temperatures is correlated with the growing number of temperature anomalies observable worldwide and is responsible for numerous weather-related disasters. Unfortunately, this trend inevitably continues, as 2016 and 2017 were ranked respectively as a first and second warmest years since 1880 [2,3].
The consequences of climate change we face nowadays are widely analyzed in the extensive body of literature. The problem of changing weather conditions, both in the context of reasons behind climate change and the severity of its consequences, is examined in environmental, climatology, and meteorology related works. The analytical context embraces the socio-economic impacts of climate change (e.g., [4,5]) and the disastrous weather-related consequences of global warming (e.g., [6] with examples for European region and [5] in US context).
The literature that focuses on the economic aspects of climate change predominantly refers to the reasons behind and the consequences of changing weather conditions, together with the analysis of its impact on various branches of the economy. A wide overview of previous works related to the economic aspects of global warming was performed by Dell et al. [7] or Schneider and Lane [8]. However, in the context that remains relevant for this study, several aspects that were examined in previous empirical works need to be highlighted. First, although changing weather conditions affect various industries (e.g., productivity in agriculture [9,10,11,12], tourist destination choices [13,14], human health through the diffusion of heat and cold related diseases [15], retail [16,17]), the energy sector is perceived as highly exposed to weather-related risk. In this regard, various levels of the interplay, both in the macro-perspective and micro-perspective, were examined. In particular, reciprocal influences were deeply considered on how the energy sector affects global climate change and how climate change in turn affects the energy sector. One of the most explored issues is the relationship between energy demand and temperature changes, as a weather-related factor (see meta-analysis performed by Schaefer et al. [18], with an overview of previous empirical studies in this topic).
The second stream of literature relevant for this study refers to the possible methods of managing weather risk in the energy sector. Weather risk is defined as related to the consequences of changing weather conditions [19]. In the context of the energy sector, the existing literature considers various methods and technological solutions that may enhance better assessment of weather risk (in this the frequency of risk occurrence) and the execution of better risk mitigation strategies (e.g., [20]). It should be noted that the majority of previous empirical studies is regionally oriented, with the purpose of deeper insight into a situation in a given country or geographic area. There again, in the context of the energy market, a wide body of the literature is related to weather risk hedging that manages the unfavorable impact of temperature anomalies on the changes of energy demand and supply. The existing body of the literature related to this issue focuses on valuation techniques and efficiency, as well as the market for weather hedge instruments, weather derivatives in particular (e.g., [18]).
The main aim of this study is to provide insight into the impact of weather risk on the economic activity of companies operating in the energy sector as the main players of the energy market. This study refers to the situation of the Polish energy sector, and in particular, aims to examine whether Polish energy companies identify their relevant weather risk exposures and whether they attempt to evaluate the impact of weather risk on their efficiency (in cost-revenues dimension). In the risk-mitigation context, the study aims at exploring the extent of the implementation of weather derivatives by Polish energy companies, with reference to the implementation of other methods of managing weather risk. The empirical examination is preceded by a short discussion over the dimensions of the impact of weather risk on the energy sector and the applicability of weather derivatives in managing the risk that is most relevant for energy supply–demand market equilibrium in the face of temperature anomalies. This discussion develops the conceptual framework for this study.
A focus on Poland was motivated by several observations. First of all, in the debate over global climate change the continuous growth of average temperature is highlighted, with a long-term outlook (e.g., that since 1880s the continuous growth of average Earth temperature is observed, with an approximate growth of 0.06–0.07 °C per 10 years, which recently sped up to 0.13 °C per 10 years [21]). However, analysis of global climate change rarely provides a deeper outlook pertaining to the regional and local context, which is relevant for the consideration of weather risk impact. In the past two decades, Poland was affected by a growing number of incidents of extreme weather conditions. In general, Poland has a mostly temperate climate, between the oceanic climate dominating in the north and west of the country and continental climate in the south and east. Air masses come to Poland from all directions. Hence specificity of the climatology of Poland can be perceived as a mix of maritime, continental, polar, and tropical influences. Oceanic currents are an important factor driving the climate of Poland. The inter-year variability of seasonal or monthly mean temperature can be very high. Monthly temperatures largely vary between years, particularly in winter (in one location the temperatures may range between −4 and +6 in December or between −40 and +20 in February) [22]. The extreme weather anomalies emerge, for instance, by high vulnerability of rainfall, the changing structure of rainfall (draught followed by 2–3 intensive rainfalls, leading to floods), incidents of hail, and a sharp increase or decrease in temperature. Moreover, climatologists observe weather anomalies in seasons: hotter springtime, “Saharan” heat waves in summer and warmer and much shorter winters. The growth of average temperatures is observed within the whole Baltic region [21,23,24,25,26].
Secondly, the energy sector in Poland is specific; there is a saying that “Poland sits on coal” due to the fact that the coal mining industry is very relevant to the Polish economy. Notwithstanding, discussions over the reasons behind global warming address, among others, the need for a limitation of energy produced from fossil fuels, which is a difficult issue for Poland. Thus, Poland attempted to be granted some privileges in the implementation of solutions that may slow down climate change. Very recently (December 2019), Poland was the only of the European Union member states to disagree to carbon neutrality by 2050 [27]. This political decision was explained by the current Polish government as justified due to the relevance of the coal industry to the Polish economy, as hard coal is the primary energy source. In the European Union, Poland still leads in the volume of coal mining (according to Eurostat, in 2018 Poland was responsible for 86% of hard coal mining in the European Union [28]). Concomitantly, the energy sector remains the prime consumer of hard coal in the structure of Polish hard coal consumption, with nearly a 60% share in 2018 [29]. It is worth mentioning that the biggest players both in the coal mining industry, as well as in the energy sector, remain under governmental control to some extent, due to the capital share of the Polish treasury. Facing these facts about Poland, the study on weather risk perception (as related to climate changes) in the Polish energy sector may be controversial, and in fact, this controversy justifies the examination of Poland. In the case of Poland, the dual role of the energy market players is more exposed than in the case of other European countries. On one hand, the energy companies are expected to satisfy the strategic goals relevant from an economic point of view. On the other, however, their performance remains influenced by the effects of climate change and the related weather risk incidents, induced in a great degree by their own activity.
A third motivation behind this study was the works of Binkowski [30] and Preś [31] who overviewed the situation in Poland about 15 years ago. Binkowski [30] conducted a study that led to the following conclusions: although the Polish energy sector remains highly exposed to weather risk, the demand for weather derivatives is non-existing and there was any financial market infrastructure to support the management of weather risk with weather derivatives. According to Preś [31] there were no weather derivative transactions in Poland, probably due to low awareness of managers on the functioning of weather derivatives market. Facing this evidence, the revision of the situation in Poland performed in this study captures the evolution of both the changes of the energy sector’s perception of weather risk and the changes of risk mitigation strategies in this respect.
This study may potentially contribute to the academic debate on the impact of changing weather conditions on the energy sector in several dimensions. First, as it remains single-country oriented, it offers a deeper consideration of the country-specific features of weather risk management in energy market related contexts. A second contribution of this study is the implementation of a unique research approach. This study uses textual content analysis as a research method. The main advantage of content analysis is the possibility of obtaining unique qualitative information in a structured way, so that scientifically sound conclusions can be drawn [32]. This study explores the information disclosed by energy companies in their annual reports. For that purpose, the study relies on a unique set of hand-collected data. The research design remains tightly connected to the economic aspects of the performance of the energy sector, as it relies on information disclosure relevant for market behavior and efficiency (as the ultimate outcome of economic performance).
This study also contributes to risk-management related literature. The studies that examine the problem of weather risk management in the energy sector typically focus on the impact of temperature volatilities and the problem of the pricing of weather derivatives (see e.g., [18]). This study offers a broader context of the examination of energy companies’ weather risk management, as it revises weather risk management as an element of their complex (holistic) risk management strategy.
The remainder of this paper is organized as follows. The Section 2 provides a theoretical framework of the study: it explains the facets of weather risk and its impact on the energy sector, from the point of view of energy market economics. In this context, it discusses the utility of weather derivatives in the energy sector. The Section 3 explains the design of the empirical investigation. In the Section 4, the obtained results are discussed. The Section 5 concludes the study.

2. Conceptual Framework of the Study

2.1. The Facets of Weather Risk from Energy Sector Perspective

According to [19], weather risk “is about unpredictable component of weather fluctuations”, manifested by “weather surprises”. However, weather is not only an environmental issue—it has a tremendous impact on several spheres of economic activity and thus should be perceived as a key economic factor [33,34]. The world economy is weather sensitive (according to [33] it is 20% of the world economy and even 25% of the US economy), as many branches are directly affected by changing weather conditions. It is related to a wide range of phenomena including changes of temperature (temperature anomalies), windspeed, excessive rainfalls or snowfalls. Weather risk has a feature of local geographical risk that cannot be controlled. However, according to Barrieu and Scailett [33] the impact of weather risk is predictable—the same causes lead to the same effects. Moreover, in most cases the impact of weather risk is significant and remains outside managerial control.
Although weather risk conditions have a tremendous impact on various branches of the economy, energy is perceived as one of the most exposed sectors. The impact of weather-related risk events may potentially hit the energy sector in two dimensions: (a) directly, by damaging its infrastructure or (b) by creating shocks (frictions) to the energy supply–demand balance. Accordingly, the two areas of energy sector vulnerability to weather-related risks are observable.
Within the first area (direct impact), Ronalds et al. [20] provide several examples of the manifestation of weather risk in the infrastructure damage of various energy sectors. For instance, in late 2010 to early 2011 coal mines in Queensland in Australia were severely disrupted by heavy rain and floods due to La Niña event. The oil and gas industries are exposed to losses due to the devastating impact of hurricanes and storms, and in this case, hurricane Katrina in 2005 remains the costliest natural disaster (with high losses due to oil spills in Louisiana). Heatwaves are an example of a potentially dangerous weather-related risk for nuclear power plants, as it may cause ineffective cooling with water (when water temperatures are too high or water flows are too low), as observed in France in 2003 [20]. In the Polish context, a good example is the consequences of the excessive snowfalls, followed by frost wave, that occurred at the beginning of April 2008 in Szczecin (one of the largest Polish agglomerations) and its surroundings. These unusual (as for April) and extreme weather conditions caused a serious blackout, due to the destroyed power transmission infrastructure [35].
A second dimension of weather risk impact on the energy sector focuses on the analysis of the consequences of weather risk to the changes of demand and supply of energy. A broadened view on this relationship is often addressed to the consideration of global warming and the related climate change, as the energy sector impacts the greenhouse effect. In this context, a growing demand (consumption) of energy is related to the growing supply of energy (and the use of fossil fuels), which in turn is blamed for the changing weather conditions we face nowadays. This encourages discussion on the urgent need to reduce energy demand (in the macro context), improve energy efficiency, and switch to carbon-free technologies [20].
However, a more tangible and direct relationship between weather conditions and the energy market is reflected by the observations of temperature changes. This relationship, by intuition, seems obvious—temperature distributions (both regional and temporal) affect the demand on energy (and energy consumption). In the context of consumption of electricity, the literature proves the existence of a non-linear relationship between temperature and demand on electricity, which is reflected by a U-shaped curve (referred to as TEC–Temperature–Electricity Curve). The shape of the curve shows high electricity demand observed for both cold and hot weather conditions (and accordingly low and high temperatures) [36,37]. Some studies examine the relationship between the TEC and other factors of socio-economic development, such as the level of income, extent of electrification, energy efficiency improvements, or cultural habits. These factors influence the time temporal dynamic of the TEC slopes, as well as threshold of minimum energy consumption [38]. In this context, the non-linearity of energy demand could be explained with reference to several structural aspects of its variability: geographic (distinction of hot and cold regions), seasonal (distinction of seasonal temperature fluctuations, in this summer or winter fluctuations), fuel-use (electricity versus fossil fuels use), and income-related (poor versus wealthy societies) [39]. A review of previous empirical works related to temperature as a determinant of energy demand (both in global and regional context) is provided by Schaefer et al. [18], with a meta-analysis of the research methodologies and variables tested in these works.
Within the relationship between the level of temperature and energy demand, the consequences of weather risk are related to the impact of abnormal temperature levels (as the manifestation of temperature anomalies). The analysis of the TEC is relevant for recognition of the patterns of typical changes of energy demand, in relationship to changes in temperature. As the consumption of energy is related to the demand on energy services, it ultimately determines the demand on fossil fuels as well [39,40]. A seasonal pattern of energy consumption typically exhibits peaks in warmer and cooler periods, which is related to the recognition of cooling and heating effect. The cooling effect is related to higher energy consumption due to high temperatures in warm periods (to maintain temperature comfort, e.g., the use of air conditioning or other cooling devices). The heating effect is related to lower energy consumption due to the higher temperature levels in colder periods (less of a need for heat). In this context, the approximation of the energy demand is related to the typically observed temperature levels, as well as the above-mentioned structural factors. The underestimation or overestimation of energy demand may in turn affect energy prices (as a consequence of the changes to the energy supply–demand equilibrium) [36,41]. In this context, the changing weather conditions may severely affect the energy market equilibrium, as weather conditions remain related to the observation of long-term changes of temperatures, as well as extreme weather events related to heat or frost waves (in unusual seasons).

2.2. Weather Risk Management with Weather Derivatives

The above outlined exposures to weather risk in the energy sector are substantial enough for a call for weather risk management tools. The inception of weather risk management in 1996 started in the energy sector, and then was adopted by other sectors (retail and leisure, farming) [34].
In general, risk management is a process that begins with the identification and assessment of risk exposures, followed by selection of the most effective risk management methods (strategies). There is a wide body of the literature that provides a strong evidence of the beneficial impact of risk management to the enhancement of value creation. To simplify, various empirical works proved that risk management helps to sustain the unfavorable consequences of risk, as it helps to smooth the volatility of cash flows in the aftermath of risk occurrence (e.g., [42,43,44,45,46]). The possible risk management strategies embrace risk avoidance (do not involve in risky activities), risk reduction (methods that help to prevent the risk occurrence or reduce its impact if already occurred), and risk financing (the methods that allow to prepare the stream of funds that help to restore in the aftermath of risk). The selection of the adequate strategy (or mix of these strategies) should be preceded by the identification of risk, which means the identification of the particular threats and the measurement of their potential impact (severity) and likelihood (chance) of occurrence [47,48,49,50].
In the context of the identification and assessment of weather risk, there are still considerable uncertainties about the likelihood, severity, and timing of weather risk impacts on energy sector infrastructure and performance. There is a need to adapt to climate change, to reduce climate change vulnerabilities and avoid some future impacts [51]. Two dimensions of the interplay between changing weather conditions and energy sector performance, a constant monitoring of global climate changes and the related weather anomalies are relevant for proper weather risk management. Facing the undisputable growth of average Earth temperatures [1], the energy sector needs reliable forecasts and models. As noted by Ronalds et al. [20], a new era for energy and meteorology studies has emerged, and the delivery of appropriate weather and climate information (services) is growing in importance [52]. An increasing number of relevant weather-related loss events worldwide is constantly reported by the platform NatCatService [53]. The data indicate that since 1980 the world has faced a significantly growing number of meteorological events (e.g., storms, 135 in 1980 and 357 in 2018) and climatological events, such as heatwaves, extreme temperatures, droughts or forest fires (28 events in 1980, 79 events in 2017, and 57 events in 2018). The most significant growth was observed in the case of hydrological events, such as floods or mass movements (59 in 1980 and 382 in 2018). Although the data indicate a constant growth of the number of events, a number of catastrophic weather-related events remain relatively stable over time.
The uncontrollable nature of weather risk, together with its potentially high impact on companies’ performance, led to the evolution of various methods of weather risk management [44]. The diversification of weather risk exposures is achieved if a company conducts its business operations in several geographical regions that differ in weather conditions. A company may also consider investing in flexible generation technologies or developing the ability to store or trade energy with long-term contracts. Another possibility is to combine financial management with weather risk management, by holding higher levels of cash to limit earnings volatility induced by the emergence of weather risk. This strategy is an example of typical risk retention. However, it has some relevant drawbacks—the impact on profitability caused by inefficiency of precautionary cash holdings [44,54]. The alternative is the insurance hedging of weather risk. However, the main drawback of weather insurance is that it is rational only for the weather risk exposures that distinguish with low frequency and high severity, which is a feature of extreme weather conditions (such as hail, storms, or draughts). Insurance cannot be implemented for weather exposures that distinguish with high frequency and low severity. Thus, insurance is not suitable for the management of weather risk related to the impact of changing weather conditions on heating and cooling demands, which is the prime weather risk exposure in the energy sector. However, this kind of weather risk exposure could be hedged with the application of weather derivatives.
Weather derivative is defined as a financial instrument whose pay-out is contingent on weather conditions (meteorological events) [44,55]. More specifically, the underlying in weather derivatives are indices related to changing weather conditions. The factor that induced the evolution of weather derivatives was the liberalization of the energy market in the US in the mid-1990s [55]. Since then, the energy and utility companies have actively searched for solutions that could help stabilize their earnings. It emerged very soon that the changing weather conditions were responsible for cash flow volatilities, which became the prime concern behind the management of financial stability of energy companies. The unfavorable changes of cash flows were driven by the correlation between changing weather conditions and the heating and cooling demand, which in turn impacted the prices of energy [34,55].
Weather derivatives are based on the underlying variable, which is a defined weather index. The most common are temperature derivatives. Other weather-dependent indices are also traded, e.g., precipitation (rainfall and snowfall), humidity, sunshine [19,55]. The temperature derivatives are linked to temperature indices: HDD (heating degree days) or CDD (cooling degree days) values. The HDD and CDD express the difference between a reference level of temperature and the average daily temperature, thus capturing the variations of temperature above and below the reference level. A reference level of temperature is assumed at 65 °F in the US and 18 °C elsewhere, which is the level of indoor temperature presumed to be comfortable by the utility industry. Accordingly, higher HDD is a consequence of colder temperatures and signalizes higher demand for heating:
HDD = max   ( 65   ° F   T ,   0 ) ,
HDD = max   ( 18   ° C   T ,   0 ) ,
where T means the average daily temperature. Higher CDD is a consequence of warmer temperatures and the higher demand for cooling:
CDD = max   ( 0 ,   T   65   ° F ) ,
CDD = max   ( 0 ,   T   18   ° C ) ,
The average daily temperature (T) is measured as the arithmetic average of the daily maximum and minimum temperatures [44,55].
The weather index (HDD or CDD) is one of the basic elements of weather derivatives. However, there are several other relevant elements:
  • the accumulation period or the period of time over which the index accumulates; usually it is a month or a season;
  • the location of the weather station that reports daily temperatures for a particular region; typically, the station is located in a major city;
  • so called “tick size,” which is the dollar amount attached to each HDD or CDD; this is the amount to be paid per unit of the CDD or HDD.
The weather indices may not perfectly track the weather exposure (the basis risk), which is relevant from weather risk management point of view. The basis risk is the risk that the weather derivative payoffs (as a hedging instrument) do not correspond to shortfalls in the underlying exposure. The basis risk could be local (shortfalls in the same location), geographical (local area monitoring is costly and thus a derivative refers to another location) or product (difference in the effectiveness of alternative hedging instruments).
The first weather derivative transaction took place in 1997 in the US and the rapid evolution of the weather derivatives market was induced by the growing implementation of this instrument in weather risk hedging in the energy sector [33,56,57]. Weather derivatives transactions frequently remain tailor-made, as a part of the OTC (over the counter) market, as they adjust the contract to the needs of their users. However, successful organized markets exist. In the US, the CME (Chicago Mercantile Exchange) has quoted weather derivatives since 1999. In Europe, the LIFFE (London International Financial Futures and Options Exchange, now part of Euronext) initiated the trade of weather derivatives in 2000, for mean monthly temperatures in Berlin, Paris, and London. The weather derivatives market was growing rapidly until Enron collapsed in 2002, which led to a loss of confidence in derivative transactions. The market recovered after a few years, with growing transaction volumes (see more in [31,33,57]).
Currently, various types of weather derivative instruments are available: forwards and futures, swaps, options and exotics [58,59]. However, the problem of quality, availability, and cost of weather data varies across countries, which is relevant from a basis risk point of view. In general, the basis risk is lower in OTC weather derivatives, in comparison to the exchange traded. In this context, the accessibility of reliable historical meteorological data for a given region remains one of most relevant barriers of a broader use of weather derivatives [31,56,57,58,60,61].

3. Research Design and Method

In a methodical context, this study derives from works that examine companies’ risk disclosures in annual reports, which are a part of a company’s risk communication system. The informativeness of companies’ disclosures (in this, risk disclosures) is regarded to mirror most relevant issues of the company’s performance. In other words, it is assumed that if a company reports (discloses) the information on a given aspect of its performance it is a relevant piece of information from the stakeholders’ perspective [62,63]. In this context, this study focuses on companies’ disclosures on weather-related risk. Accordingly, it is assumed that if a given company reports its weather-related exposures, these exposures are important for the company’s performance. This assumption is justified provided that in the past companies operating in energy sector reported that weather-related events or phenomena were responsible for the volatility of their cash flows and the related change of financial position. For instance, Perez-Gonzalez and Yun [44] refer to several case studies in this respect.
The majority of studies of companies’ disclosures in annual reports (in this, risk disclosures) rely on textual content analysis as a prime research method. Content analysis is a method of classification of text units (pieces of information) into predefined categories. As a result, content analysis transforms the qualitative textual communicates into a set of variables that distinguish with a higher degree of comparability. The method has a defined rigor of data collection and criteria of the classification of the textual information, to obtain an unbiased dataset [32,64,65]. Content analysis underlies numerous studies that examine textual information on companies’ risk exposures and risk management procedures, as disclosed in annual reports [66,67,68,69,70].
Motivated by the previous works in this stream of the literature, the research procedure in this paper was designed to extract the weather-risk related information which was disclosed in companies’ annual reports. The adopted framework of the research procedure is presented in Figure 1. A detailed explanation of the assumptions underlying the consecutive steps in this procedure is addressed further.
The research sample includes Polish companies that operate in the Polish energy sector and are listed on the Warsaw Stock Exchange (WSE) (Warsaw, Poland). At the end of October 2019, there were 12 companies that were listed on the WSE as operating in the energy sector. However, 3 out of these 12 companies were excluded from the sample, as a majority of their performance (production, distribution, and/or trading in energy sector) is located outside the territory of Poland. The 9 companies subject to a detailed analysis are listed in Table 1, together with the specification of the main fields of their activity.
Companies listed on the WSE are obliged to regularly report their activity, and to timely publish their annual reports. The full body of a company’s annual report is an extensive document which discusses numerous issues relevant primarily from the accounting system point of view. However, companies in Poland disclose risk-related information in three elements of their annual reports:
  • financial statement: companies explain the risk related to their performance, which is mandatory with reference to several risk categories;
  • MD&A (management discussion and analysis): according to the corporate governance code of companies listed on the Warsaw Stock Exchange [71], public companies are requested to disclose their risk management systems (in this, the identified risk exposures and the risk mitigation actions taken against these risks);
  • the statement on non-financial performance: in Poland the statement of non-financial performance is a mandatory element of annual reports for the largest companies since 2017; the statement discusses (among other issues) the risk-management related disclosures.
In this study, two elements of companies’ annual reports were taken into consideration as a subject of content analysis: financial statements and MD&A. More precisely, the documents for 2017 and 2018 were subject of examinations, which resulted in an analysis of over 3600 pages of textual information (see Appendix A). It should be noted that several companies issue their annual reports in parts (annual financial statement and MD&A as separate documents/files), whereas others prefer an integrated form of their annual report (all elements of annual report in one document/file).
Due to the extensive size of the documents subject to the study, clarification of the rules of the analysis of textual information is very important. The first of the adopted rules is related to the system of scanning the textual information in order to detect and extract weather risk related sentences. The extraction of sentences (not single words) was motivated by several risk disclosure studies [64,72,73], where the sentences were regarded as providing more meaningful data.
In order to identify the sentences relevant for this study (containing information on the faced or expected weather risk exposures), the text of the documents was searched with the implementation of a set of keywords that embraced the words related to weather risk phenomena. The list of keywords included the following words: risk, weather, temperature, heat, cold, draught, frost, flood, wind, sun, rain, hurricane, winter, summer, spring, autumn, Celsius, and degrees, as well as the words that connote with the negative consequences of risk, such as loss, damage, or threat.
In the last step of the research procedure, the obtained information is subject to clustering, in order to provide some details within the insight into the impact of weather risk on the economic activity of companies operating in the Polish energy sector (consistently with the main purpose of this study). More specifically, this overall goal of the study was decomposed into four detailed research questions to allow better organization and interpretation of the collected textual data. RQ1 and RQ2 address the perception of weather risk, to verify the identification of the relevance of weather risk exposure and the companies’ attempts to communicate these impacts in cost-revenues dimension. RQ3 and RQ4 address risk management practices, by verifying disclosures on methods/measures used to hedge/manage weather risk, in these weather derivatives. The textual information obtained from companies’ reports was coded and the coding rules are explained in detail in Table 2. As a result, each company was evaluated in a weather-related context in focus, with a unified scoring system.
In the adopted coding system, the scores reflect the maturity of weather risk management, ranging between 0 if the issue is not reported and 2 in the case of a greater scale in the advancement of weather risk perception or mitigation. For instance, in RQ1 the score 1 was granted if a company identified weather-related exposures only with reference to the distribution of energy. The interplay between the energy supply and demand, in terms of changing temperatures is a known phenomenon in the energy sector. In this respect, the identification and explanation of weather-related risk exposures with reference to other areas of business activities should be regarded as more advanced and sophisticated (and were given score 2). With reference to RQ2 and RQ3 the distinction between score 1 and 2 was related to the degree of detail in explanations (score 1 if general, score 2 if more detailed, with some computations or examples of particular actions). The scoring system in RQ4 took into account the fact that the access to weather derivatives market is limited. However, the fact that a company is currently active on a derivative market (of any kind) was treated as a symptom of being prepared for derivative trading, and in this, understanding the rules of this trading, the related risk, and the pricing of derivatives.
The adopted coding system computes the overall score for each company, hereafter referred to as the AWRM (average weather risk management) score. The AWRM score ranges between 0 and 8, and gives the opportunity to compare weather risk perception between the analyzed companies, as reported in their annual reports. In general, the higher the AWRM score, the better identification and management of weather-related risk exposures in a company. In this respect, the AWRM score could be used as a variable in the analysis of whether there is any performance-related pattern (e.g., well-established companies distinguish with higher AWRM score).

4. Results and Discussion

4.1. Analytical Background: Financial Position of Sampled Companies as Energy Market Players

In the Polish energy sector, the real shift from a command to market economy took place in 1997, launched by the new law regulations (Energy Law Act) and the establishment of the Energy Regulatory Office (ERO). The ERO is responsible for determining the prices of energy transfer and the property rights from the certificates of origin for electricity and CO2 emission allowances. In 2004, after the Polish accession to the European Union, further law amendments were implemented in the process of adjustment to EU directives. One of the most relevant changes was implemented in 2007—the retail customers were given the freedom to choose the energy supplier.
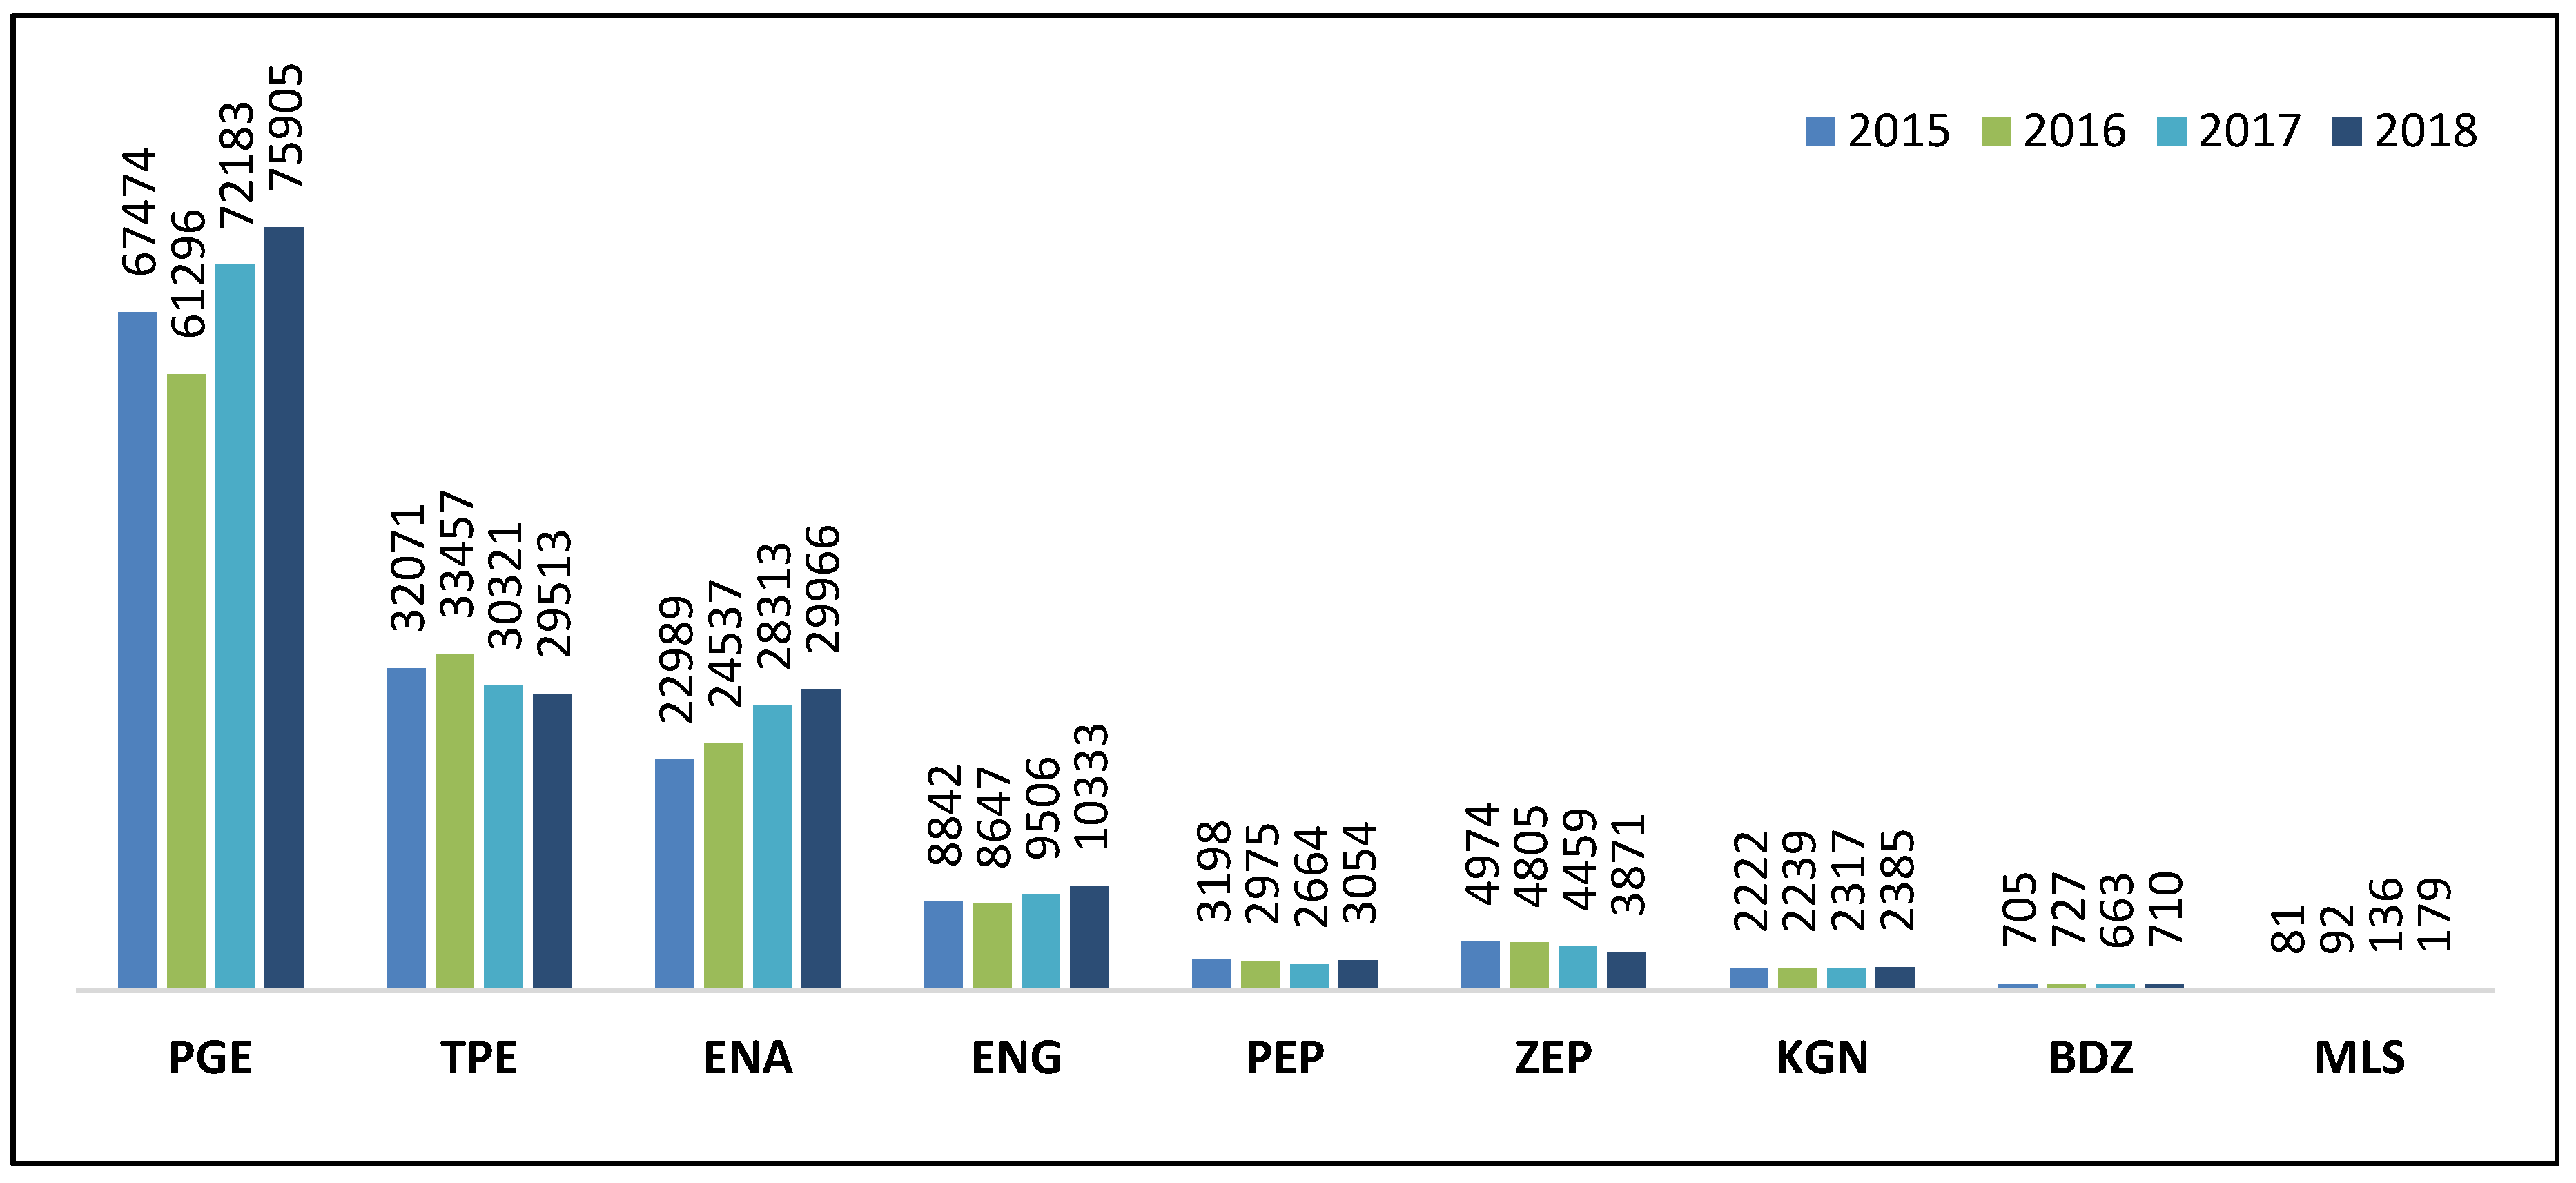
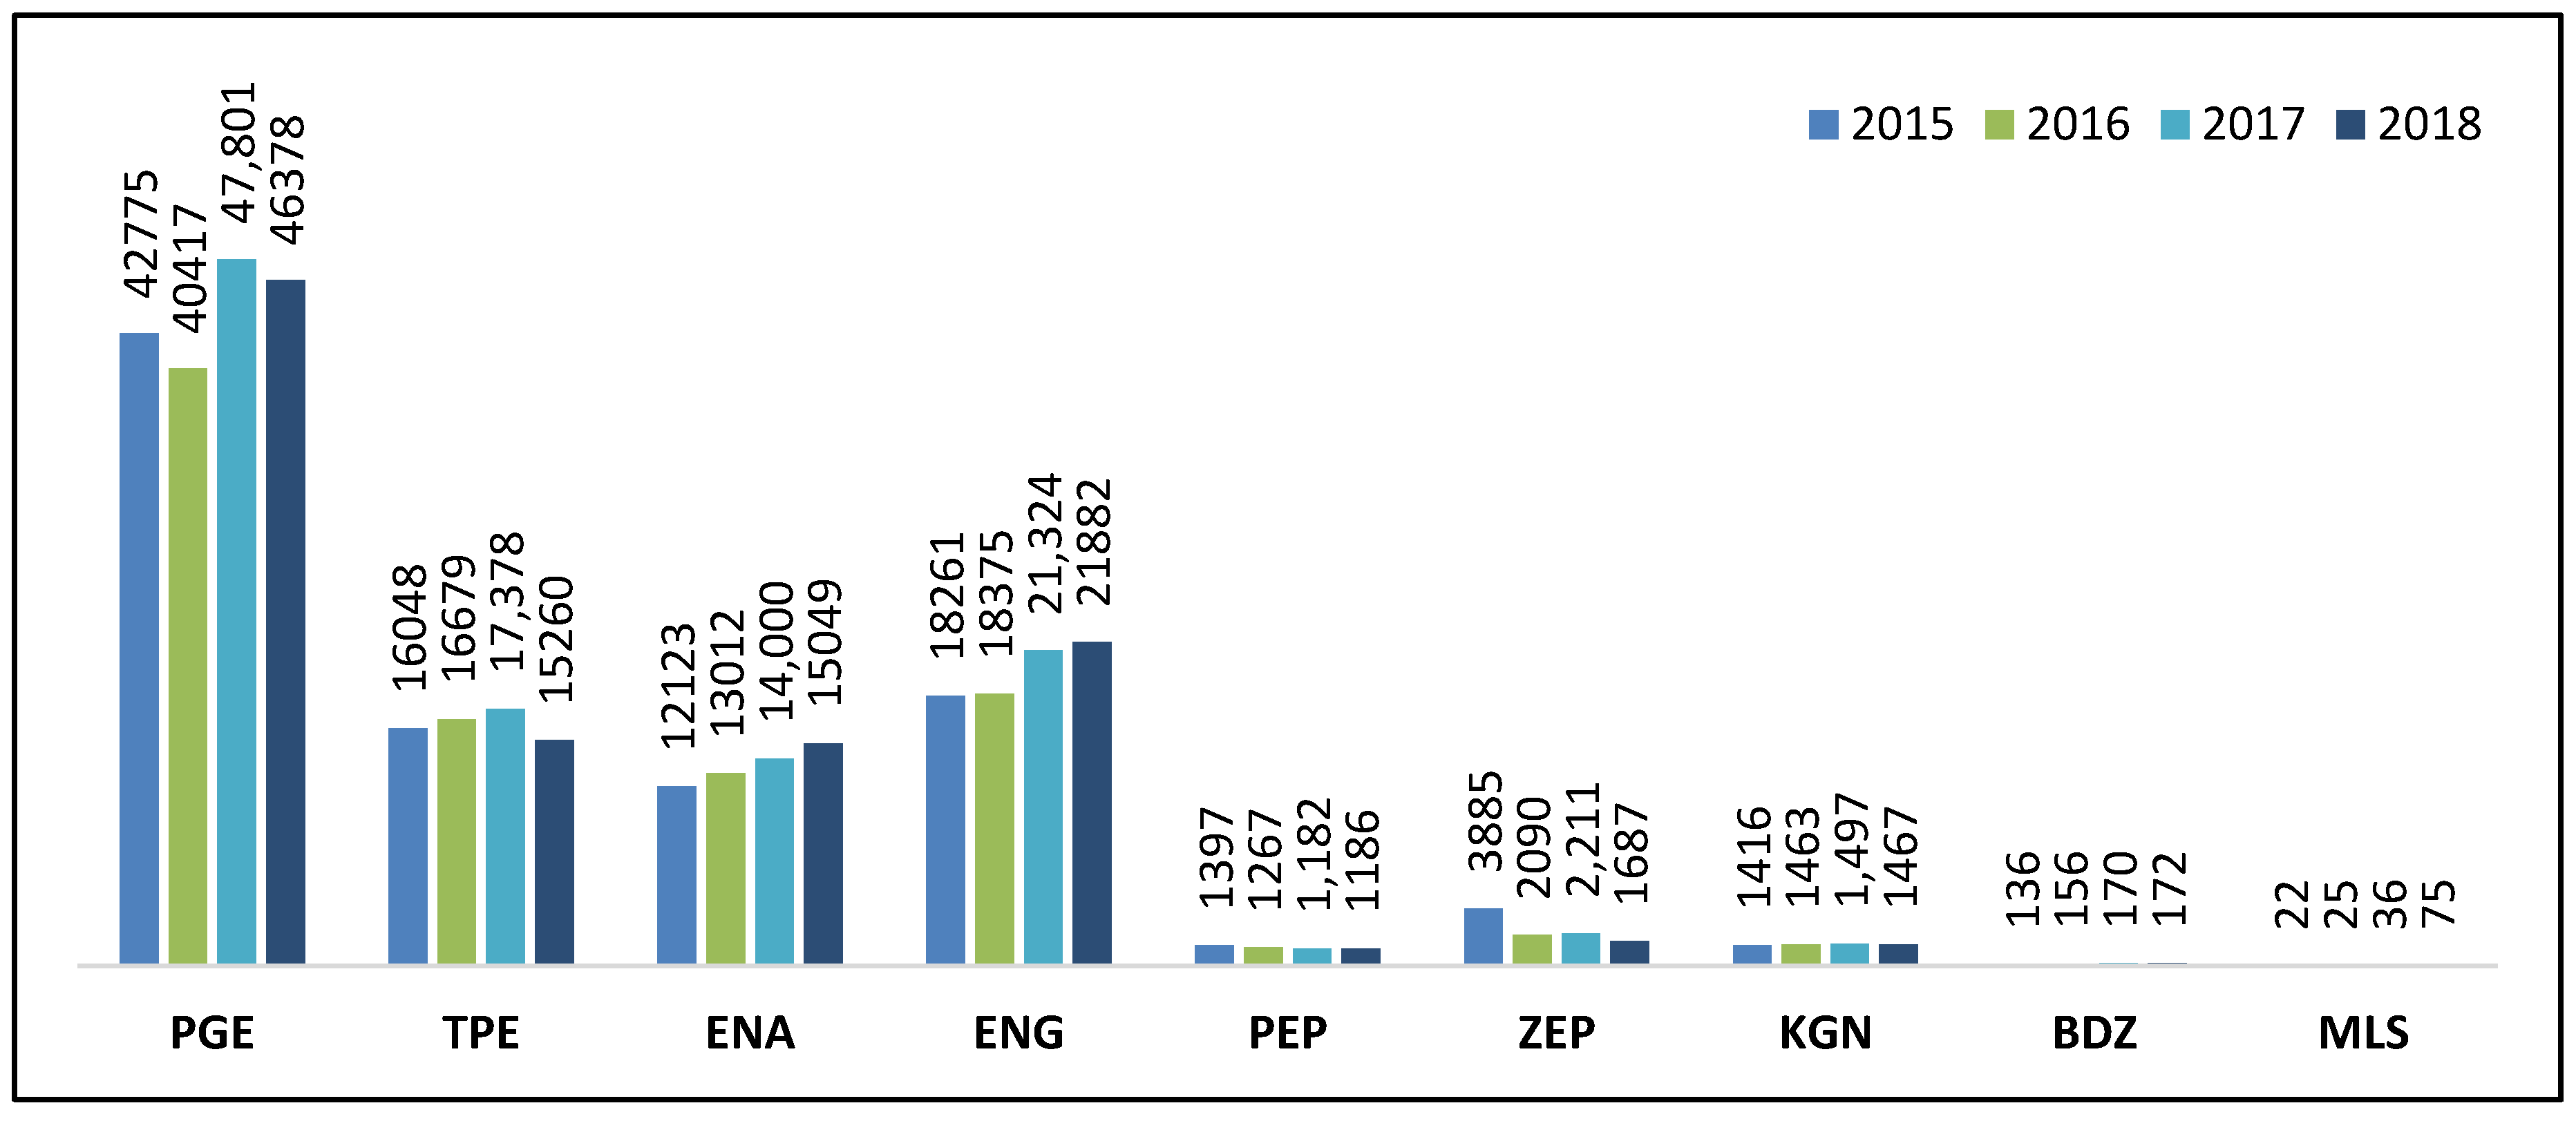
Currently, there are four companies that are the biggest energy market players and their operating activity is concentrated in various parts of Poland: PGE (for full names of companies see Table 1) operates mainly in eastern regions; TPE operates in the south and south-western parts of Poland; ENA activity is concentrated in western Poland; and ENG mainly operates in the north and central regions of Poland. All these four companies perform as capital groups and are listed on the Warsaw Stock Exchange; thus, they are included in the research sample in this study. The leading position of these four big market players is also confirmed by their financial position with respect to sales revenues (Figure 2), volume of assets (Figure 3), and equity (Figure 4), with PGE in the leading position. The remaining five companies included in the sample operate on a visibly lower scale. However, it should be noted that their performance is of a local dimension (e.g., BEZ or KGN) or unique in some aspects (e.g., ownership, PEP; sources of energy, ZEP; subject of business operations, MLS), as presented in Table 1. In the Polish energy sector there are numerous other market players whose primary activity is related with trading and the distribution of energy. Their overall market share is roughly 10% (in terms of sales revenues). However, these companies are not included in the sample, as they are not listed in the Warsaw Stock Exchange.
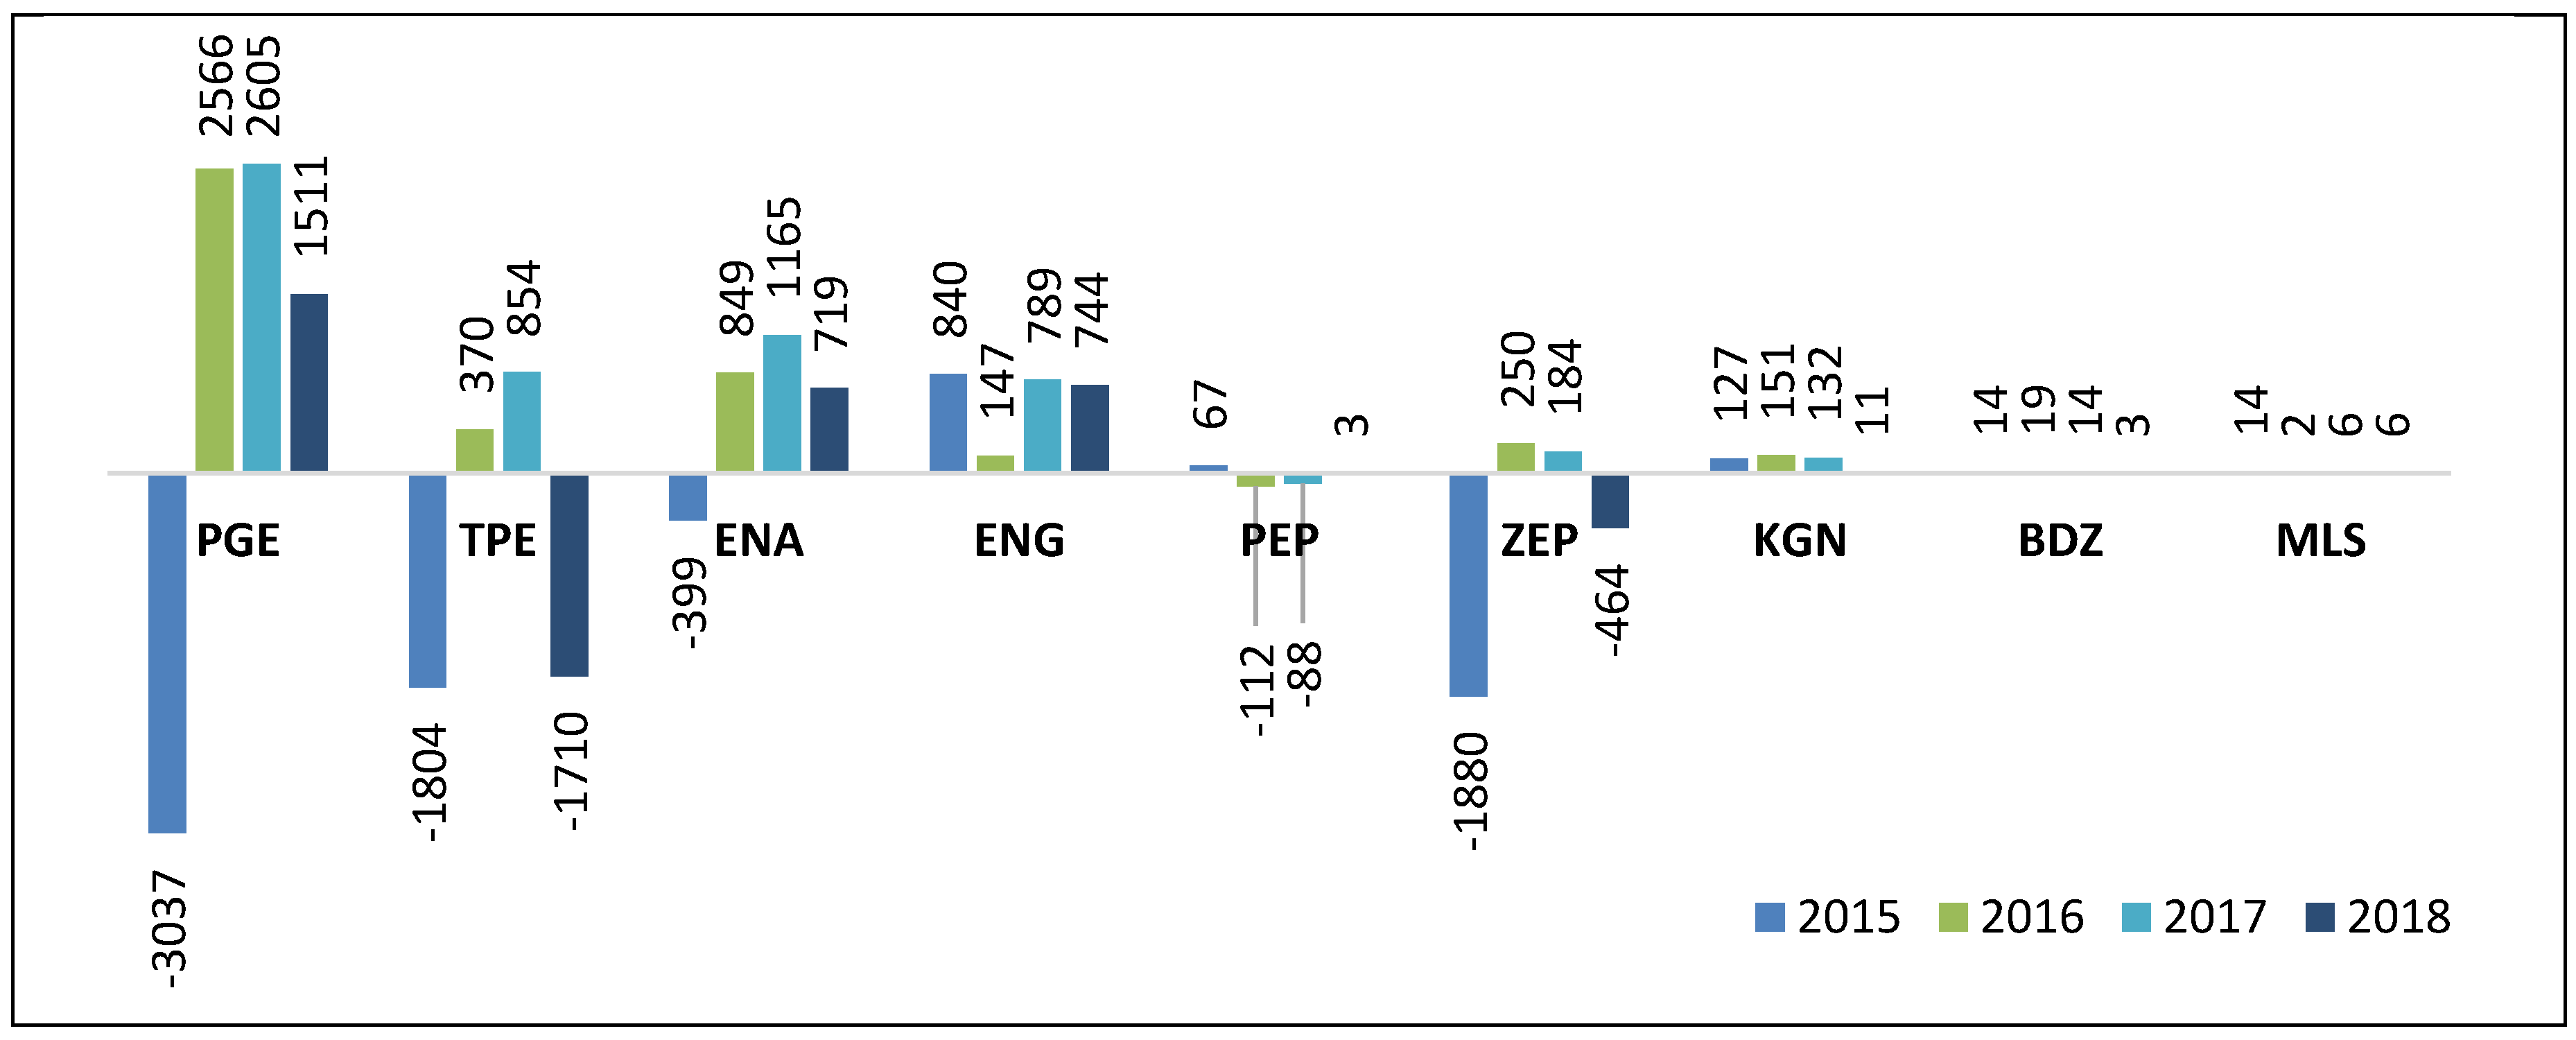
It is worth mentioning that in terms of profitability and the related indicators (ROS–Return on Sales, ROA–Return on Assets and ROE–Return on Equity) the differences between the companies included in the sample are blurred (see Figure 5 and Table 3). MLS returns were the most significant, which is probably related to the expansion of this company, as it was listed on the WSE since 2018, but the biggest market players do not lead. Moreover, in 2015 three out of the four biggest market players (PGE, TPE, and ENA) were unprofitable. The exceptional situation of ZEP is also identifiable, with losses both in 2015 and 2018. However, this situation is explained by the company’s management as a result of incidental situations that led to an increase in operating costs.

4.2. Textual Content Analysis: The Findings

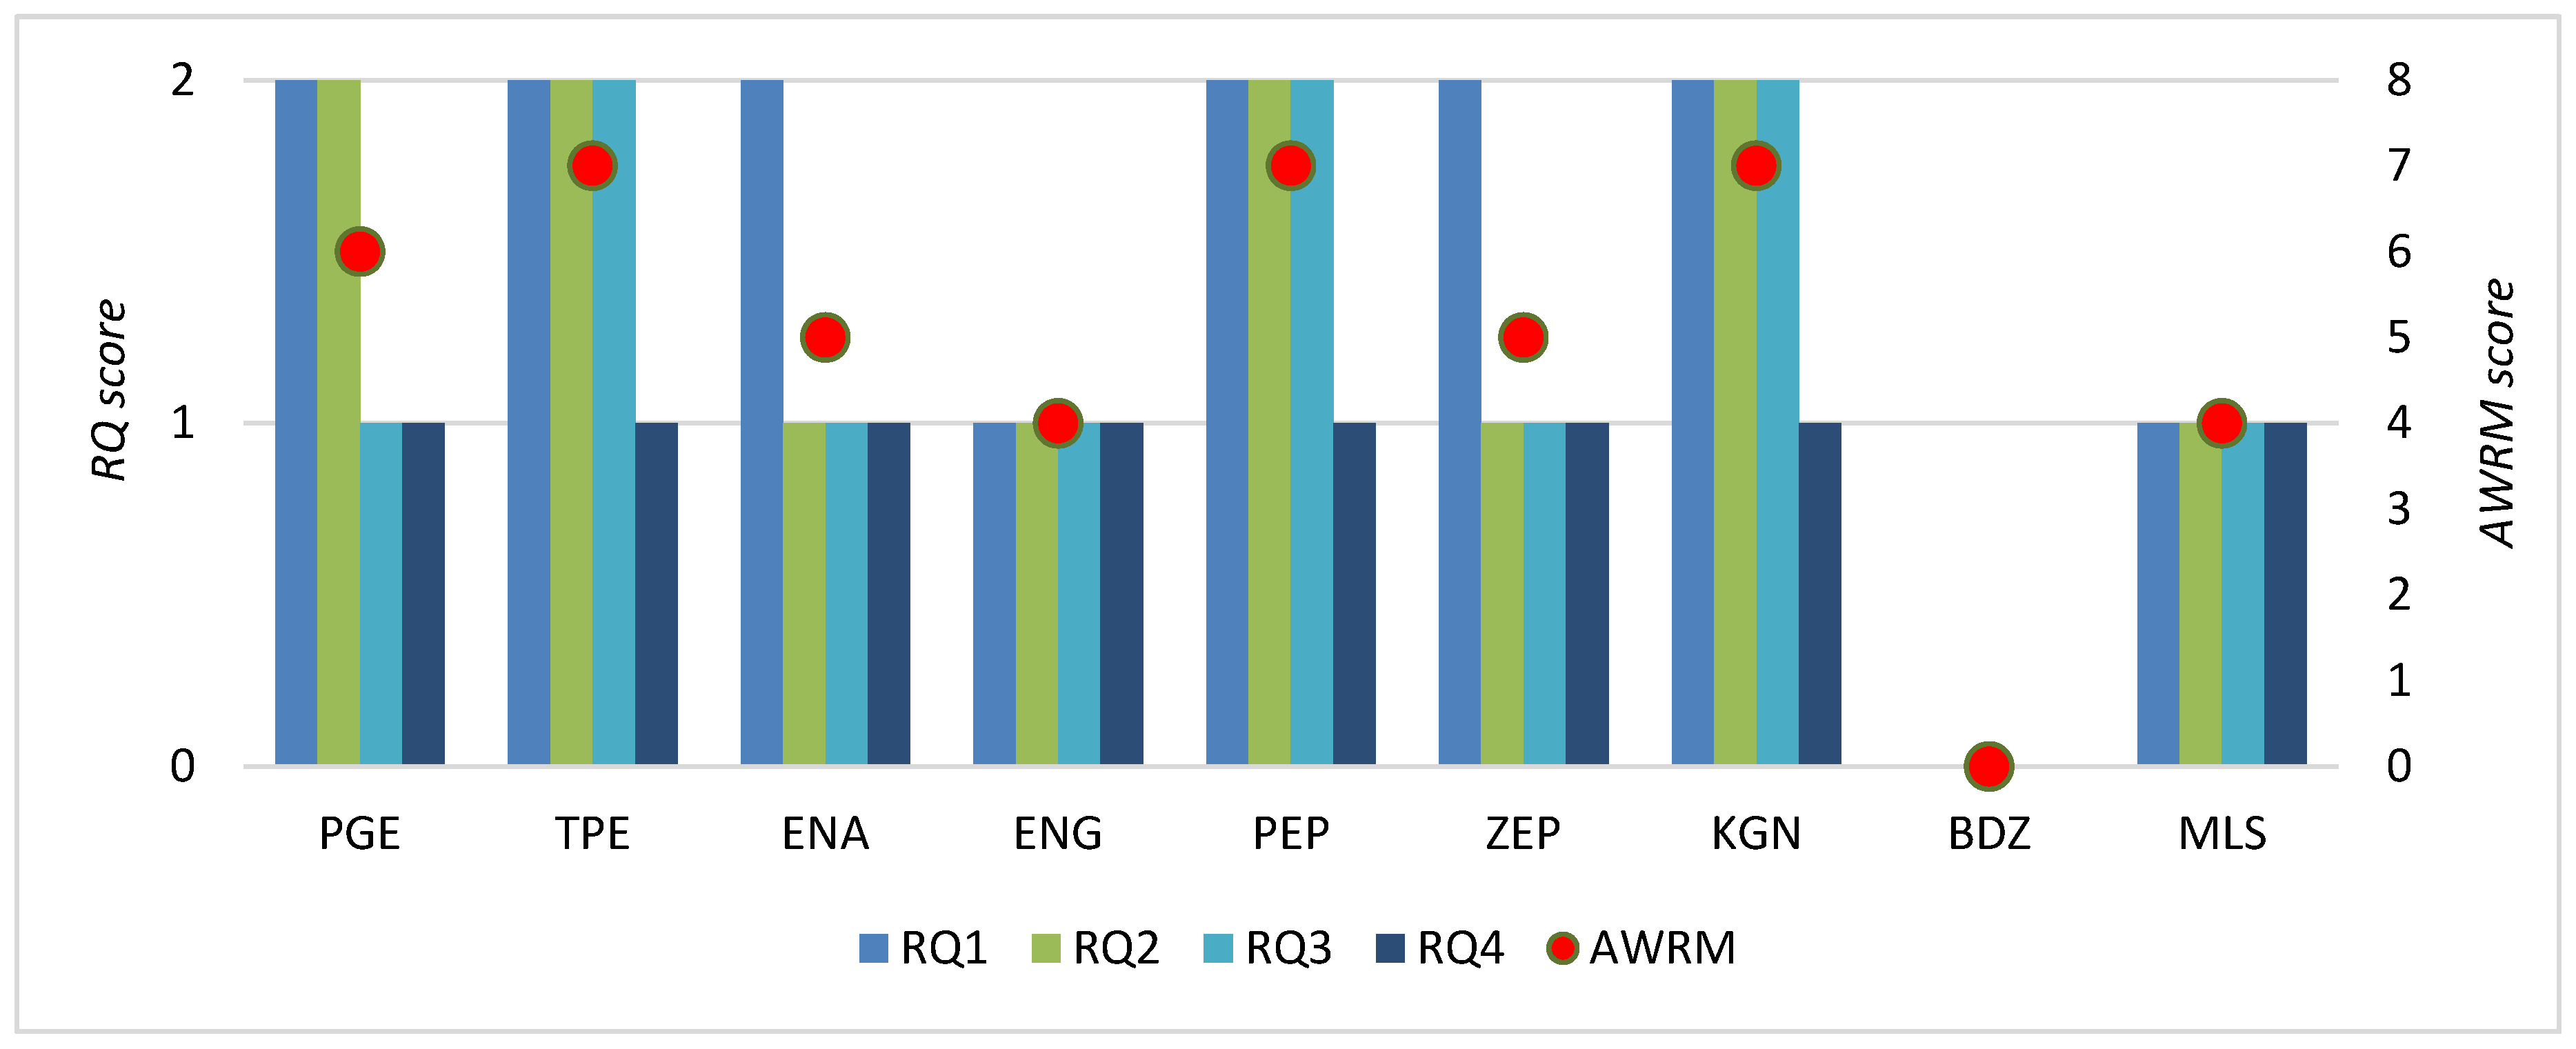
In the process of textual content analysis, a large stock of data was collected. The summary of the relevant information is presented in Appendix A. However, the system of data coding adopted in this study (and discussed in Table 2) synthetizes and summarizes the results for discussion in a single cross-table. Table 4 shows the scores admitted to each company in each criterion of evaluation (the research questions RQ1, RQ2, RQ3, and RQ4) as well as their summarized values (the AWRM score). Table 4 also indicates the score obtained on average by all companies in the given criteria of evaluation (as the arithmetic mean value). The visualization of the summarized results of textual content analysis is presented in Figure 6.
The results in Table 4 and Figure 6 indicate that the majority of researched companies recognize their weather-related risk exposures on a more mature (advanced) level. In the analyzed annual reports’ disclosures, these companies provided information on both the impact of temperature fluctuations on energy consumption, as well as the impact of weather conditions on other aspects of their business performance. For instance, companies reported on (see Table A2 in Appendix A):
  • hydrological events (draught) that threatened hydroelectric power plants (e.g., PGE and ENA);
  • low levels of rivers or ice on rivers that could impact supplies (as the river is relevant route of goods shipment, e.g., ZEP);
  • the chain of dependences, impact of weather risk on the farming industry which is a main supplier of biomass (e.g., PEP);
  • dependence on wind speed conditions and seasonal changes (e.g., ZEP, PEP, and PGE).
Interestingly, in the case of MLS, the weather-related factors were mentioned in a positive context, as the opportunity for international expansion. It is worth mentioning that the companies often highlighted the identified weather risk exposures as the key risks of their performance or the risks relevant from a strategic point of view (also in the forward-looking aspects). Only one out of the nine examined companies did not report on the weather-related events as influential on their performance (BDZ).
In the second aspect of textual analysis (RQ2: evaluation of weather-related exposures in cost-revenues dimension), four out of nine companies were given the highest score. A detailed numerical analysis was provided by PGE, TPE, PEP, and KGN, with reference to the change of defined financial parameters (e.g., returns, revenues, costs, or operating profit, EBITDA (Earnings Before Interest) and Taxes most commonly). The remaining four companies (ENA, ENG, ZEP, and MLS) addressed the impact of weather-related risks on their performance, but in a general way, usually by stating that it is relevant or may reduce revenues/increase costs. Again, only one company (BDZ) did not report on the weather impact (which is obvious given the lack of reported weather risk exposures).
The companies were similarly diversified within the third problem in focus (RQ3): the implantation of methods that support the management of weather-related risk exposures. A more detailed explanation was provided in reports by TPE, PEP, and KGN, such as e.g., diversification of supplies, more advanced modeling methods, monitoring, and investment in new technologies. The remaining five companies (PGE, ENA, ENG, ZEP and MLS) reported weather risk management in a general way, by referring to the adoption of risk management processes or controlling mechanisms. One company (BDZ) did not report weather risk management, which is a consequence of not reporting the weather-related risks as relevant.
Analysis final problem in focus (RQ4): the implementation of weather derivatives, has led to the observation that the examined companies did not report on the use or even the interest in such instruments. These findings are consistent with previous observations by Bińkowski [30] and Preś [31] and the fact that the accessibility of the weather derivatives market for Polish energy market players (even the biggest players) is somehow limited (as these instruments are traded primarily on CME). However, eight out of nine examined companies used other types of derivatives in their risk-hedging strategies. This means that these companies are familiar with the types of derivatives and the functioning (e.g., pricing) of these instruments. Thus, it could be stated that these companies are prepared for weather derivatives trading if the opportunity arises.
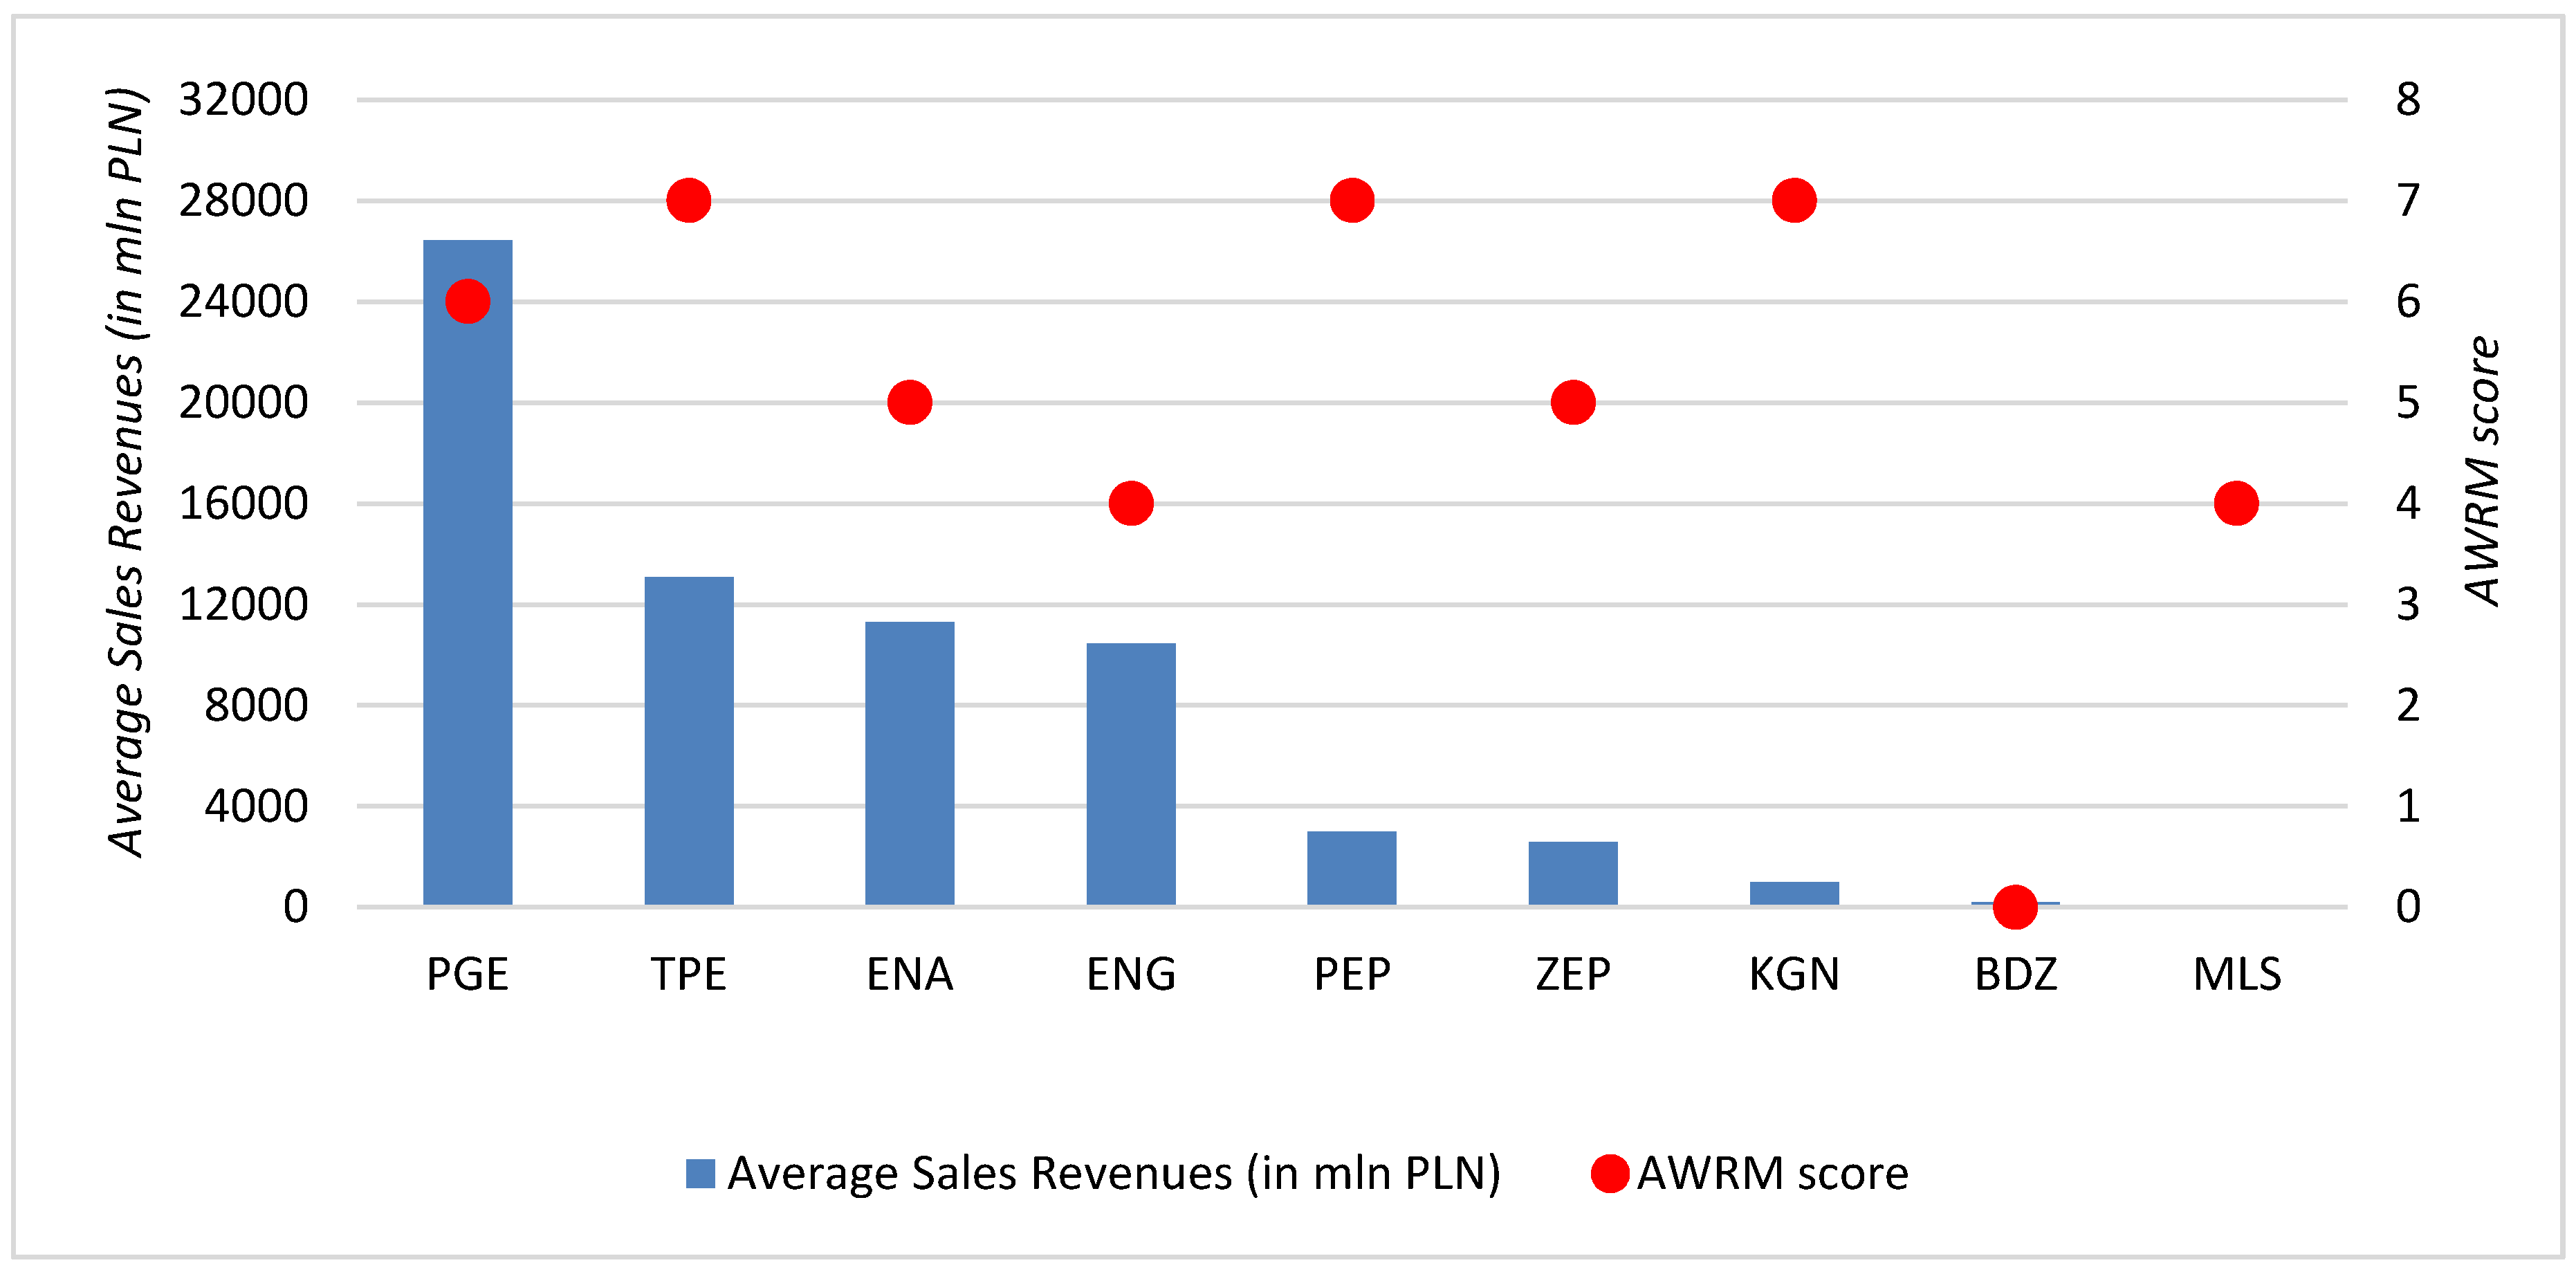
To compare the weather risk perception between the examined companies, as reported in their annual reports, the total score (AWRM) was computed. In general, the higher the AWRM score, the better overall perception and management of weather-related risk exposures in a given company. The total score (AWRM) obtained by the analyzed companies ranged technically between 4 for MLS and ENG, thorough 5 for ENA and ZEP, 6 for PGE and 7 for TPE, PEP, and KGN (if we exclude the outlier score for BDZ). Due to the small size of the sample, the correlation analysis with the scale of companies’ performance or profitability and returns is not statistically sound. However, data presented in Figure 7 indicate that there is no pattern between performance and AWRM score. The performance of a given company was captured by the average sales revenues for the period 2015–2018. The highest AWRM scores (6 and 7) were obtained by both market leaders (PGE and TPE), as well as by smaller companies (PEP and KGN).

5. Conclusions

In the era of climate change, the frequency and severity of weather anomalies grow visibly. The problem of changing weather conditions is studied in the literature from a variety of angles, with reference to socio-economic impacts and long-term and short-term disastrous consequences of global warming. In the context of economic activity, literature provides strong evidence on the impact of weather on various branches of the economy. In this regard, the energy sector remains one of the most exposed sectors to the consequences of changing weather conditions and related weather risks.
The manifestation of weather risk could be the damage of infrastructure, which is often a result of “weather surprises”, events of low frequency, but potentially high consequences. This type of weather risk exposure could be hedged with weather insurance. However, the energy sector is also exposed to the volatility of the supply and demand of energy, as a result of the changing weather conditions related to temperature distributions. In this context, weather impacts the price of energy and leads to volatility of cash flows in energy companies, which is potentially dangerous for maintaining financial stability. This kind of weather risk exposure is of high frequency and low severity and could be hedged with weather derivatives. Since new millennium, the global weather derivatives market has grown in importance, with energy companies as the main market players.
This study was designed to verify whether the companies operating in the Polish energy sector perceive and manage their weather risks. The examinations were based on the application of textual content analysis method and relied on hand-collected data from companies’ annual reports. Textual content analysis is a useful tool for examining qualitative textual data on a comparative level. The application of textual content analysis in this study has shed some light on aspects that are difficult to examine in a quantitative dimension. In other words, the qualitative approach adopted in this study enables a focus on the information (communicates) disclosed by the examined companies, in the written form. Through the interpretation of these pieces of information (structured with the rigor of the content analysis method) the new body of knowledge was obtained. This research approach can be replicated on other samples of energy companies. Moreover, further enquiries in this respect may expand the number of underlying research questions (with clearly defined coding rules), to address possible problems that are regarded as relevant.
However, the textual-based examinations have several limitations. Frist, there is a risk of subjective bias, as the translation of textual information to scoring system depends on the researchers’ subjective judgements. To avoid this bias, the coding procedure implemented in this study was designed to meet the requirement of reliability and validity of data collection in manual content analysis, as requested by Weber [74] and Krippendorff [32] (the originators of this method). A second limitation is cognition limited only to learning from what a company is willing to report. Thus, a researcher should be aware that the real practices may be more advanced than what was reported. In addition, this particular study has some limitations due to the sample size: there were only nine energy companies listed on the Warsaw Stock Exchange and operating in Poland that could be the subjects of this study (with respect to the requirement on the availability of reliable data). Nevertheless, the obtained results led to some interesting findings.
In the weather risk perception context, we found that the majority of examined companies addressed their relevant weather risk exposures, and weather risk was often reported as one of the key or strategic risks in a forward-looking context. It should be noted that all examined companies (with one exception) reported on the relationship between the prices of energy and temperatures, and some of these companies referred to this problem in detail (by giving examples of difficult seasons). The examined companies also reported on the potential impact of weather risk on their financial position, by addressing profitability indices. Several companies provided detailed computations in this respect.
In the weather-risk mitigation context, we found that the examined companies relied on the implementation of various weather risk management methods. However, companies did not report on the implementation of weather derivatives. In this respect, the findings are consistent with the conclusions from Binkowski [30] and Preś [31] who examined the implementation of weather derivatives in Poland in the past.
The latter conclusion opens the prospects for further research endeavors, as it raises several further questions: Why do energy companies in Poland not implement weather derivatives? In particular, is it related to the accessibility of these instruments? Or maybe this is a deliberate and conscious decision? Maybe the correlation of temperatures and changing prices of energy results in cash flow volatilities that are fully retainable? Finally, are these observations consistent with the situation in other emerging European countries? In order to answer these questions, however, a wider examination needs to be conducted, with the application of methods that go beyond the information disclosed in annual reports.

Funding

This research received no external funding.

Conflicts of Interest

The authors declare no conflict of interest.

Appendix A

Table A1. Documents subject to textual content analysis (sources of data).
CompanyDocuments 1No. of PagesSize of File in KB
BDZConsolidated financial statement 20171167524
Consolidated financial statement 20181198443
ENAConsolidated financial statement 20171212397
Consolidated financial statement 20181473768
Management Discussion and Analysis 201715013,193
Management Discussion and Analysis 20181845968
ENGConsolidated financial statement 2017701943
Consolidated financial statement 2018771952
Management Discussion and Analysis 20171416348
Management Discussion and Analysis 20181314270
PGEConsolidated financial statement 2017912483
Consolidated financial statement 2018953006
Management Discussion and Analysis 20171414943
Management Discussion and Analysis 20181325279
PEPConsolidated financial statement 2017852088
Consolidated financial statement 2018982520
Management Discussion and Analysis 2017501239
Management Discussion and Analysis 2018531597
TPEConsolidated annual report 20173167856
Consolidated annual report 201836711,782
KGNConsolidated financial statement 2017961246
Consolidated financial statement 20181001638
Management Discussion and Analysis 2017821854
Management Discussion and Analysis 2018872144
ZEPConsolidated annual report 20172025601
Consolidated financial statement 20181273547
Management Discussion and Analysis 2018672372
MLS 2Consolidated financial statement 2018831287
Management Discussion and Analysis 2018737089
1 The documents were obtained from the official websites of the examined companies; 2 The MLS company is listed on WSE since 2018.
Table A2. Summary of textual data for RQ1: Does the company identify its relevant weather risk exposures?
CompanySummary of Information Disclosed in Analyzed Documents
PGE
  • Weather risk among strategic exposures, valued as of moderate impact
  • “Extreme weather conditions that could affect production and distribution of electric energy and heat”
  • Reported events that impacted the distribution and costs (lower temperatures in 2018 that affected sale of heat; lower wind speed that affected production of energy in windfarms, May–December 2018; hydrological draught that lowered production in hydroelectric power plant)
TPE
  • Changing weather conditions among main factors that impact a company’s future prospects (as influential on energy demand)
  • Weather risk on the list of key risks (impact on technological and trading aspects of company’s performance)
ENA
  • Weather risk identified as one of the key risks: impact of temperature changes on the river Vistula (low level of water due to heat, to warm water due to heat, risk of ice due to extreme freeze)
  • Impact of weather risk on distribution: extensive explanation of the impact of weather risk (scale and frequency)
  • Impact of weather risk on transmission property (2017: intensive rainfalls and wind due to Gregory and Xavier windstorms, resulted in blackouts)
ENG
  • Hydrogeological conditions, wind speed and changes of the temperature, discussed primarily in the context of distribution (consumption-production)
PEP
  • Chain of interdependencies: production of biomass relies on the availability of inventory, which is in turn dependent on the farming industry; company reported that the farming industry is directly exposed to weather risks, unfavorable weather conditions influence the farming industry, as a deliverer
  • Windfarms: dependence on quality of wind speed modeling (correct/accurate models); the difficulties arise due to exposure to seasonal changes of wind speed (autumn/winter stronger, summer/springtime weaker)
ZEP
  • Weather-related risks among a company’s key risks and discussed within the factors that affected the performance in 2017 and 2018 (backward looking approach)
  • Identified the risk of seasonal changes of temperatures (in particular the impact of heat in summer that affects the demand on energy) and wind speed (relevant for windfarms)
  • Identified lack of correlation between higher energy demand (due to changing seasonal temperature fluctuations) and windspeed conditions (higher demand for energy in the periods of lower windspeed)
KGN
  • Weather-related risk (changing temperatures and seasonal fluctuations of temperatures) identified as one of the key risks (impact on household segment)
  • Warm winters (temperatures higher than on average) as a factor that leads to reduced sales;
  • Risk of a company’s dependence on supplies by River Odra (as transportation channel): it identifies risk of a frozen river in wintertime and high level of water in springtime
ECBNot reported
MLS
  • Company reports on the impact of sunshine, not as a threat, but as an opportunity (factor that is relevant for higher demand on the company’s products)
Table A3. Summary of textual data for RQ2: Does the company evaluate the impact of weather risk in cost-revenues dimension?
CompanySummary of Information Disclosed in Analyzed Documents
PGE
  • Reported impact of weather risk (in particular in the sector of renewable energy) on EBITDA (earnings before interest, taxes, depreciation, and appreciation);
  • Detailed computations of the impact in cost/revenues dimension (in +/-)
TPE
  • Notion on the seasonal demand on energy and its dependence on weather conditions (with reference to revenues)
  • Explanation on the impact of changing weather conditions on earnings in 2017 (analysis of fluctuation of energy prices in the EU context; long-lasting heat induced demand on energy; hydrological difficulties in some of EU countries (draught) induced the increase of energy prices)
ENA
  • Reported generally (by stating: it ‘could decrease EBITDA’)
ENG
  • Reported generally: weather risk related to hydrometeorological and windspeed conditions reported among key concerns that may affect the company performance (in this financial performance); this issue addressed both in 2017 and 2018 (in forward looking context)
PEP
  • Reported impact of weather risk on financial results and future performance
  • Analyzed impact on EBITDA (earnings before interest, taxes, depreciation, and appreciation);
  • Detailed computations of the impact in cost-revenues dimension (in +/-)
ZEP
  • The impact of changing prices of energy due to changing weather conditions
  • Reported generally, with reference to future revenues (both backward and forward looking perspective)
  • Analysis in the global context of the impact of weather conditions in Europe on the prices of energy and allowances of CO2 emissions (the company identified incidents that caused an increase in the price of emissions)
KGN
  • Report on loss of profits and higher costs due to weather risk
  • Impact of higher average temperatures on sales revenues analyzed in greater detail (in +/-)
ECBNot reported
MLS
  • Reported generally: favorable weather conditions (sunny climate) as a reason for geographical expansion (risk as opportunity, prospects for growth)
Table A4. Summary of textual data for RQ3: Does the company disclose the information on methods/measures used to hedge/manage weather risk?
CompanySummary of Information Disclosed in Analyzed Documents
PGE
  • Reported generally: several risk management actions to prevent material damage due to weather risk
TPESeveral detailed actions reported:
  • e.g., monitoring of windspeed and frosting of windmills
  • New investments in technologies that may potentially reduce the impact of weather conditions on production of energy
ENA
  • Reported generally: monitoring, overall reference to risk management policies implemented in the company
ENG
  • Reported generally: monitoring, overall reference to risk management policies implemented in the company
PEPSeveral detailed actions described:
  • Diversification of biomass deliveries (sources of supply)
  • Continuous evaluation/assessment of supply (internally organized, dedicated research program)
  • Implementation of better windspeed modeling methods
  • Analysis of possible locations of new investment in windfarms (to identify locations with highest windspeed)
ZEP
  • Reported generally: reference to overall risk management policies implemented in the company
KGNSeveral detailed actions described:
  • Inventory management (extra stock to safeguard shortages of sources for energy production)
  • Arrangement of alternative ways of transporting these goods
ECBNot reported
MLS
  • Reported in general way, indirectly: company mentioned the expansion on Australian market (due to sunny climate), which indicates diversification of revenues by geographical location

References

  1. IPPC. Global Warming of 1.5 °C. 2018. Available online: http://www.ipcc.ch/report/sr15/ (accessed on 20 November 2019).
  2. NASA. Long-Term Warming Trend Continued in 2017: NASA, NOAA. Release 18-003; 18 January 2018. Available online: https://www.nasa.gov/press-release/long-term-warming-trend-continued-in-2017-nasa-noaa (accessed on 20 November 2019).
  3. NASA. 2018 Fourth Warmest year in Continued Warming Trend, according to NASA, NOAA. News; 6 February 2019. Available online: https://climate.nasa.gov/news/2841/2018-fourth-warmest-year-in-continued-warming-trend-according-to-nasa-noaa/ (accessed on 20 November 2019).
  4. Rose, A.; Dormady, N. A Meta-Analysis of the Economic Impacts of Climate Change Policy in the United States. Energy J. 2011, 32, 143–165. [Google Scholar] [CrossRef]
  5. Rosennzweig, C.; Iglesius, A.; Yang, X.B.; Epstein, P.; Chivian, E. Climate Change and Extreme Weather Events—Implications for Food Production, Plant Diseases, and Pests. Glob. Chang. Hum. Health 2001, 2, 90–104. Available online: https://digitalcommons.unl.edu/cgi/viewcontent.cgi?article=1023&context=nasapub (accessed on 20 November 2019). [CrossRef]
  6. Van Aalst, M.K. The impacts of climate change on the risk of natural disasters. Disasters 2006, 30, 5–15. [Google Scholar] [CrossRef] [PubMed]
  7. Dell, M.; Jones, B.; Olken, B. What Do We Learn from the Weather? The New Climate-Economy Literature. J. Econ. Lit. 2014, 53, 740–798. [Google Scholar] [CrossRef] [Green Version]
  8. Schneider, S.H.; Lane, J. An Overview of ‘Dangerous’ Climate Change. In Avoiding Dangerous Climate Change; Schellnhuber, H.J., Cramer, W., Nakicenovic, N., Wigley, T., Yohe, G., Eds.; Cambridge University Press: Cambridge, UK, 2006; pp. 7–23. ISBN 978-0-521-86471-8. [Google Scholar]
  9. Bosello, F.; Zhang, J. Assessing Climate Change Impacts: Agriculture. Working Paper No. 94.05. Fondazione ENI Enrico Mattei, 2005. Available online: https://www.econstor.eu/dspace/bitstream/10419/73909/1/NDL2005-094.pdf (accessed on 15 July 2019).
  10. Sharma, A.K.; Vashishtha, A. Weather derivatives: Risk-hedging prospects for agriculture and power sectors in India. J. Risk Financ. 2007, 8, 112–132. [Google Scholar] [CrossRef]
  11. Smith, P.; Olesen, J.E. Synergies between the mitigation of, and adaptation to, climate change in agriculture. J. Agric. Sci. 2010, 148, 543–552. [Google Scholar] [CrossRef] [Green Version]
  12. Adams, R.M.; Hurd, B.H.; Lenhart, S.; Leary, N. Effects of Global Climate Change on Agriculture: An interpretative Review. Clim. Res. 1998, 11, 19–30. Available online: https://www.int-res.com/articles/cr/11/c011p019.pdf (accessed on 15 July 2019). [CrossRef] [Green Version]
  13. Scott, D. Climate Change and Tourism in the Mountain Regions of North America. In Proceedings of the First International Conference on Climate Change and Tourism, Djerba, Tunisia, 9–11 April 2003. [Google Scholar]
  14. Bas, A.; Nicholls, S.; Viner, D. Implications of Global Climate Change for Tourism Flows and Seasonality. J. Travel Res. 2007, 45, 285–296. [Google Scholar] [CrossRef]
  15. Bosello, F.; Roson, R.; Tol, R. Economy-Wide Estimates of the Implications of Climate Change: Human Health. Ecol. Econ. 2006, 58, 579–591. Available online: http://citeseerx.ist.psu.edu/viewdoc/download?doi=10.1.1.175.5630&rep=rep1&type=pdf (accessed on 15 December 2019). [CrossRef] [Green Version]
  16. Štulec, I. Effectiveness of Weather Derivatives as Risk Management Tool in Food Retail: The Case of Croatia. Int. J. Financ. Stud. 2017, 5, 2. [Google Scholar] [CrossRef] [Green Version]
  17. Zara, C. Weather derivatives in the wine industry. Int. J. Wine Bus. Res. 2010, 22, 222–237. [Google Scholar] [CrossRef]
  18. Schaefer, R.; Szklo, A.S.; de Lucena, A.; Borba, B.; Nogueira, L.; Fleming, F.; Troccoli, A.; Harrison, M.; Boulahya, M. Energy sector vulnerability to climate change: A review. Energy 2012, 38, 1–12. [Google Scholar] [CrossRef]
  19. Campbell, S.D.; Diebold, F.X. Weather forecasting for weather derivatives. J. Am. Stat. Assoc. 2005, 100, 6–16. [Google Scholar] [CrossRef] [Green Version]
  20. Ronalds, B.F.; Wonhas, A.; Troccoli, A. A New Era for Energy and Meteorology. In Weather Matters for Energy; Troccoli, A., Dubus, L., Haupt, S.E., Eds.; Springer: New York, NY, USA, 2014; pp. 3–16. ISBN 978-1-4614-9220-7. [Google Scholar]
  21. Wójcik, R.; Miętus, M. Some features of long-term variability in air temperature in Poland (1951–2010), original title: Niektóre cechy wieloletniej zmienności temperatury powietrza w Polsce (1951–2010). Przegląd Geogr. 2014, 86, 339–364. [Google Scholar] [CrossRef] [Green Version]
  22. Kundzewicz, Z.; Forland, E.; Piniewski, M. Challenges for developing national climate services—Poland and Norway. Clim. Serv. 2017, 8, 17–25. [Google Scholar] [CrossRef]
  23. HELCOM. Climate Change in the Baltic Sea Area. Helsinki Commission. Balt. Sea Environ. Proc. 2007, 111. Available online: https://www.helcom.fi/wp-content/uploads/2019/08/BSEP111.pdf (accessed on 15 December 2019).
  24. Lehmann, A.; Getzlaff, K.; Herlass, J. Detailed assessment of climate variability in the Baltic Sea area for the period 1958-2009. Clim. Res. 2011, 46, 185–196. [Google Scholar] [CrossRef]
  25. Tomczyk, A.; Półrolniczak, M.; Bednorz, E. Circulation Conditions’ Effect on the Occurrence of Heat Waves in Western and Southwestern Europe. Atmosphere 2017, 8, 31. [Google Scholar] [CrossRef] [Green Version]
  26. Bednorz, E.; Czernecki, B.; Tomczyk, A.; Półrolniczak, M. If not NAO then what?—regional circulation patterns governing summer air temperatures in Poland. Theor. Appl. Climatol. 2019, 126, 1325–1337. [Google Scholar] [CrossRef] [Green Version]
  27. BBC. EU carbon neutrality: Leaders Agree 2050 Target without Poland. 13 December 2019. Available online: https://www.bbc.com/news/world-europe-50778001 (accessed on 5 January 2020).
  28. Eurostat. Consumption and Production of Hard Coal. 2019. Available online: https://ec.europa.eu/eurostat/web/products-eurostat-news/-/DDN-20190823-1 (accessed on 15 December 2019).
  29. Stat.gov.pl. Consumption of Fuels and Energy Carriers in 2018. Released 05 December 2019; Statistics Poland. Available online: https://stat.gov.pl/en/topics/environment-energy/energy/consumption-of-fuels-and-energy-carriers-in-2018,8,13.html (accessed on 15 December 2019).
  30. Binkowski, P. The conditions of creation and prospects of weather derivatives development on the domestic market, original title: Warunki tworzenia i perspektywy rozwoju derywatów pogodowych na rynku krajowym. Współczesna Ekon. 2008, 2, 37–57. [Google Scholar]
  31. Preś, J. Zarządzanie ryzykiem pogodowym; CeDeWu: Warszawa, Polska, 2008; ISBN 978-83-60089-56-9. [Google Scholar]
  32. Krippendorff, K. Validity in content analysis. In Computerstrategien fur die Kommunikationsanalyse; Mochmann, E., Ed.; Campus: Frankfurt, Germany, 1980; pp. 69–112. [Google Scholar]
  33. Barrieu, P.; Scailett, O. A primer on weather derivatives. Int. Ser. Oper. Res. Manag. Sci. 2010, 138, 155–175. [Google Scholar] [CrossRef]
  34. Mraoua, M.; Bari, D. Temperature stochastic modeling and weather derivatives pricing: Empirical study with Moroccan data. Afr. Stat. 2007, 2, 22–43. [Google Scholar] [CrossRef]
  35. Bartodziej, G.; Tomaszewski, M. Blackout w rejonie Szczecina. Uwagi i wnioski. Energetyka 2008, 10, 682–684. Available online: https://www.cire.pl/pliki/2/blackout_szczecin.pdf (accessed on 15 February 2019).
  36. Gupta, E. Climate Change and the Demand for Electricity: A Non-Linear Time Varying Approach. Working Paper. 6 December 2011. Available online: https://www.isid.ac.in/~pu/conference/dec_11_conf/Papers/EshitaGupta.pdf (accessed on 15 February 2019).
  37. Henley, A.; Peirson, J. Non-Linearities in Electricity Demand and Temperature: Parametric Versus Non Parametric Methods. Oxf. Bull. Econ. Stat. 1997, 59, 149–162. [Google Scholar] [CrossRef]
  38. Hekkenberg, M.; Moll, H.C.; Uiterkamp, A. Dynamic Temperature Dependence Patterns in Future Energy Demand Models in the Context of Climate Change. Energy 2009, 34, 1797–1806. [Google Scholar] [CrossRef]
  39. Cian, E.; Lanzi, E.; Roson, R. The Impact of Temperature Change on Energy Demand: A Dynamic Panel Analysis. Fondazione Eni Enrico Mattei, 2007. Available online: http://www.feem.it/Feem/Pub/Publications/WPapers/default.htm (accessed on 15 February 2019).
  40. Baker, T.; Ekins, P.; Johnstone, N. Global Warming and Energy Demand; Routledge Global Environmental Change Book Series: London, UK, 2007; ISBN 978-0415116015. [Google Scholar]
  41. Morna, I.; van Vuuren, D.P. Modeling global residential sector energy demand for heating and air conditioning in the context of climate change. Energy Policy 2009, 37, 507–521. [Google Scholar] [CrossRef]
  42. MacMinn, R.D. Insurance and Corporate Risk Management. J. Risk Insur. 1987, 54, 658–677. [Google Scholar] [CrossRef]
  43. Froot, K.A.; Scharfstein, D.S.; Stein, J.C. Risk Management: Coordinating Corporate Investment and Financing Policies. J. Financ. 1993, 48, 1629–1658. [Google Scholar] [CrossRef] [Green Version]
  44. Perez-Gonzalez, F.; Yun, H. Risk Management and Firm Value: Evidence from Weather Derivatives. J. Financ. 2013, 68, 2143–2176. [Google Scholar] [CrossRef]
  45. McShane, M.; Nair, A.; Rustambekov, E. Does Enterprise Risk Management Increase Firm Value? J. Account. Audit. Financ. 2011, 26, 641–658. [Google Scholar] [CrossRef]
  46. Bromiley, P.; McShane, M.; Nair, E.; Rustambekov, E. Enterprise Risk Management: Review, Critique, and Research Directions. Long Range Plan. 2015, 48, 265–276. [Google Scholar] [CrossRef] [Green Version]
  47. Vaughan, E.; Vaughan, T. Fundamentals of Risk and Insurance; John Wiley & Sons: Hoboken, NJ, USA, 2003. [Google Scholar]
  48. Rejda, G.E. Principles of Risk Management and Insurance; Addison Wesley Longman: London, UK, 2001. [Google Scholar]
  49. Dorfman, M. Introduction to Risk Management and Insurance; Pearson-Prentice Hall: Upper Saddle River, NJ, USA, 2005. [Google Scholar]
  50. Hopkin, P. Fundamentals of Risk Management: Understanding, Evaluating and Implementing Effective Risk Management, 3rd ed.; Kogan Page: London, UK, 2015. [Google Scholar]
  51. Audient, P.; Amado, J.; Rabb, B. Climate Risk Management Approaches in the Electricity Sector: Lessons from Early Adapters. In Weather Matters for Energy; Troccoli, A., Dubus, L., Haupt, S.E., Eds.; Springer: New York, NY, USA, 2014; pp. 17–62. ISBN 978-1-4614-9220-7. [Google Scholar]
  52. Zillman, J.W. Weather and climate information delivery within national and international frameworks. In Weather Matters for Energy; Troccoli, A., Dubus, L., Haupt, S.E., Eds.; Springer: New York, NY, USA, 2014; pp. 201–218. ISBN 978-1-4614-9220-7. [Google Scholar]
  53. NatCatSERVICE. Available online: https://natcatservice.munichre.com/ (accessed on 15 December 2019).
  54. Wieczorek-Kosmala, M.; Błach, J. Financial Slack and Company’s Risk Retention Capacity. In Multiple Perspectives in Risk and Risk Management; Linsley, P., Shrives, P., Wieczorek-Kosmala, M., Eds.; Springer: Cham, Switzerland, 2019; pp. 145–168. ISBN 978-3-030-16045-6. [Google Scholar] [CrossRef]
  55. Cao, M.; Wei, J. Weather derivatives valuation and market price of weather risk. J. Futures Mark. 2004, 24, 1065–1089. [Google Scholar] [CrossRef]
  56. Alaton, P.; Djehiche, B.; Stillberger, D. On modelling and pricing weather derivatives. Appl. Math. Financ. 2002, 9, 1–20. [Google Scholar] [CrossRef]
  57. Yang, C.; Brockett, P.; Wen, M. Basis risk and hedging efficiency of weather derivatives. J. Risk Financ. 2009, 10, 517–536. [Google Scholar] [CrossRef]
  58. Woodard, J.D.; Garcia, P. Basis risk and weather hedging effectiveness. Agric. Financ. Rev. 2008, 68, 99–117. [Google Scholar] [CrossRef] [Green Version]
  59. Stulz, R.M. Should we fear Derivatives? J. Econ. Perspect. 2004, 18, 173–192. [Google Scholar] [CrossRef] [Green Version]
  60. Turvey, C.G. Weather Derivatives for Specific Event Risk in Agriculture. Rev. Agric. Econ. 2001, 23, 333–351. [Google Scholar] [CrossRef]
  61. Deng, X.; Barnett, B.J.; Vedenov, D.V.; West, J.W. Hedging Dairy Production Losses Using Weather-Based Index Insurance. Agric. Econ. 2007, 36, 271–280. [Google Scholar] [CrossRef]
  62. Watson, D.; Head, A. Corporate Finance Principles and Practice; Pearson: Harlow, UK, 2013; ISBN 978-0-273-76274-4. [Google Scholar]
  63. James, B.; Stanga, K. Differences in Disclosure needs of major users of financial statements. Account. Bus. Res. 1997, 7, 187–192. [Google Scholar] [CrossRef]
  64. Bowman, E.H. Content analysis of annual reports for corporate strategy and risks. Interfaces 1984, 14, 61–71. [Google Scholar] [CrossRef]
  65. White, M.; Marsh, E.E. Content Analysis: A Flexible Methodology. Libr. Trends 2006, 55, 22–45. [Google Scholar] [CrossRef] [Green Version]
  66. Beretta, S.; Bozzolan, S. A framework for the analysis of firm risk communication. Int. J. Account. 2004, 39, 265–288. [Google Scholar] [CrossRef]
  67. Linsley, P.; Shrives, P. Risk reporting: A study of risk disclosure in the annual reports of UK companies. Br. Account. Rev. 2006, 38, 387–404. [Google Scholar] [CrossRef]
  68. Michelon, G.; Bozzolan, S.; Beretta, S. Board monitoring and internal control system disclosure in different regulatory environments. J. Appl. Account. Res. 2014, 16, 138–164. [Google Scholar] [CrossRef]
  69. Elshandidy, T.; Shrives, P.; Bamber, M.; Abraham, S. Risk reporting: A review of the literature and implications for future research. J. Account. Lit. 2018, 40, 54–82. [Google Scholar] [CrossRef] [Green Version]
  70. Abraham, S.; Cox, P. Analysing the determinants of narrative risk information in UK FTSE 100 annual reports. Br. Account. Rev. 2007, 39, 227–248. [Google Scholar] [CrossRef]
  71. Best Practice for GPW Listed Companies 2016. Available online: https://www.gpw.pl/pub/GPW/o-nas/DPSN2016_EN.pdf (accessed on 15 February 2019).
  72. Milne, M.J.; Adler, R.W. Exploring the reliability of social and environmental disclosures content analysis. Account. Audit. Account. J. 1999, 12, 237–256. [Google Scholar] [CrossRef] [Green Version]
  73. Elshandidy, T.; Neri, L. Corporate governance, risk disclosure practices and market liquidity: Comparative evidence from the UK and Italy. Corp. Gov. Int. Rev. 2015, 23, 331–356. [Google Scholar] [CrossRef] [Green Version]
  74. Weber, R.P. Basic Content Analysis; Sage Publications: Newblury Park, CA, USA, 1990. [Google Scholar]
Figure 1. The framework of research procedure in textual content analysis.
Energies 13 00945 g001
Figure 2. Sampled companies according to sales revenues (in mln of PLN).
Energies 13 00945 g002
Figure 3. Sampled companies according to volume of assets (in mln of PLN).
Energies 13 00945 g003
Figure 4. Sampled companies according to volume of equity capital (in mln of PLN).
Energies 13 00945 g004
Figure 5. Sampled companies according to net profit (in mln of PLN).
Energies 13 00945 g005
Figure 6. The visualization of the results of textual content analysis.
Energies 13 00945 g006
Figure 7. The relationship between companies’ performance (measured by average sales revenues in the period 2015–2018) and AWRM score.
Energies 13 00945 g007
Table 1. Companies included in the research sample.
CompanyFull Name of the CompanyMain Business Activity
BDZZESPÓŁ ELEKTROCIEPŁOWNI BĘDZIN S.A.generation of electricity and heat; heat distribution (water steam and hot water)
ENAENEA S.A.trading electricity and fuel gas on retail and wholesale market; generation and distribution of electricity (from bituminous coal, biomass, gas, wind, water and biogas); bituminous coal mining
ENGENERGA S.A.generation, transmission and sale of electricity and heat; sale of gas
PGEPGE POLSKA GRUPA ENERGETYCZNA S.A.conventional power generation, distribution, retail and wholesale of energy (combines own fuel (lignite) resources, power generation, and final distribution networks)
PEPPOLENERGIA S.A.generation of power from conventional and renewable sources, as well as electricity trading and distribution (offshore wind farms, biomass power plant under development);
the first private energy company in Poland
TPETAURON POLSKA ENERGIA S.A.generation, distribution and supply of electricity and heat; hard coal mining; one of the largest distributors of electricity in Poland
KGNZESPÓŁ ELEKTROCIEPŁOWNI WROCŁAWSKICH
KOGENERACJA S.A.
generation of heat and electrical power and the transmission and distribution of heat (for Wroclaw and surroundings)
ZEPZESPÓŁ ELEKTROWNI PĄTNÓW-ADAMÓW-KONIN S.A.producer of electricity
generated from brown coal
MLSML SYSTEM S.A.the design, engineering, and production of building-integrated photovoltaic (BIPV) cell systems which generate electrical power from sunlight
Source: Own study.
Table 2. Coding rules of textual information related to weather risk in companies.
Research QuestionCoding Rules
RQ1. Does the company identify its relevant weather risk exposures?0–not reported
1–yes, identified with reference to distribution
2–yes, identified with reference to other business processes as well
RQ2. Does the company evaluate the impact of weather risk in the cost-revenues dimension?0–not addressed
1–yes, evaluated in general way
2–yes, evaluated in detailed way (numerical assessment is provided)
RQ3. Does the company disclose the information on methods/measures used to hedge/manage weather risk?0–not reported
1–yes, in general way
2–yes, more detailed actions described
RQ4. Does the company report on the use of derivatives and hedging weather exposures with derivatives?0–not reported
1–yes, company reports the use of derivatives other than weather derivatives
2–yes, company repots the use of weather derivatives
Source: Own study.
Table 3. Profitability ratios of the examined companies.
CompanyROEROAROS
201520162017201820152016201720182015201620172018
PGE−7.16.35.43.3−4.54.23.62.0−10.69.111.35.8
TPE−11.22.24.9−11.2−5.61.12.8−5.8−9.92.111.0−19.8
ENA−3.36.58.34.8−1.73.54.12.4−4.17.510.25.7
ENG4.60.83.73.49.51.78.37.27.81.47.57.2
PEP4.8−8.8−7.40.32.1−3.8−3.30.12.4−3.7−3.20.1
ZEP−48.412.08.3−27.5−37.85.24.1−12.0−63.89.37.5−20.1
KGN8.910.38.80.85.76.75.70.513.014.713.01.2
BDZ10.612.58.51.62.02.72.20.48.810.27.01.4
MLS62.38.617.17.617.22.34.53.227.46.111.24.6
Source: Own study.
Table 4. Synthesis of the results of textual content analysis. AWRM, average weather risk management score.
CompanyRQ1RQ2RQ3RQ4AWRM
PGE22116
TPE22217
ENA21115
ENG11114
PEP22217
ZEP21115
KGN22217
BDZ00000
MLS11114
Mean1.561.331.220.895.00