Abstract
The European Union (EU) countries, as one of the most economically developed regions in the world, are taking increasingly decisive actions to reduce the emission of harmful substances into the natural environment. This can be exemplified by a new climate strategy referred to as “The European Green Deal”. Its basic assumption is that the EU countries will have achieved climate neutrality by 2050. To do so, it is necessary to make an energy transition involving the widest possible use of renewable energy sources (RES) for energy production. However, activities in this area should be preceded by analyses due to the large diversity of the EU countries in terms of economic development, the number of inhabitants and their wealth as well as geographical location and area. The results of such analyses should support the implementation of adopted strategies. In order to assess the current state of the energy sector in the EU and indicate future directions of activities, research was carried out to analyze the structure and volume of energy production from RES in the EU countries. The aim of the study was to divide the EU countries into similar groups by the structure and volume of energy production from RES. This production was compared with the number of inhabitants of each EU country, its area and the value of Gross Domestic Product (GDP). This approach allows a new and broader view of the structure of energy production from RES and creates an opportunity to take into account additional factors when developing and implementing new climate strategies. The k-means algorithm was used for the analysis. The presented analyses and obtained results constitute a new approach to studying the diversified energy market in the EU. The results should be used for the development of a common energy and climate policy and economic integration of the EU countries.
1. Introduction
Easy access to cheap energy is one of the most important factors that affect economic development and the well-being of individual societies. Also, it mitigates the effects of poverty [1,2,3]. The dynamic development of the world economy means that the demand for energy is increasing from year to year in virtually all sectors of this economy. Currently, the energy sector is increasingly leaning toward the development and competitiveness of the economies of individual countries [4,5,6,7].
Unfortunately, the production of electricity and heat in many countries, including the European Union (EU) countries, is largely based on traditional, conventional raw materials [8]. The source of this energy involves most often fossil fuels, the extraction and combustion of which (in the process of energy production) causes the formation of many harmful substances that enter the natural environment [9]. The greenhouse gases and other gaseous and dust pollutants generated in this process disturb the balance of the natural environment and pose a greater and greater threat to the entire terrestrial ecosystem [10,11]. At present, this threat is already so great that it becomes necessary to take very decisive and global-wide actions to limit the negative impact of the development of our civilization on the environment.
Environmental protection, while ensuring economic development, is becoming one of the main problems of both modern economy and science. From ecological as well as social and economic points of view, this is an extremely important issue. On the one hand, the dynamically developing world economy shows an increasing demand for energy, and on the other hand, the production of this energy causes a huge threat to the natural environment. These problems also apply to the EU countries. In order to reduce emissions of harmful substances, unconventional energy sources are increasingly used for energy production [12,13,14]. Sustainable and closed economy concepts are also being promoted. They aim to reduce the emission of harmful substances and focus on a more complete and rational use of resources, including energy [15,16]. The concept of sustainable energy is also gaining importance. Its purpose is to provide energy that meets the needs of the present without compromising the ability of future generations to meet their needs [17] to finally ensure energy safety based on energy obtained only from renewable energy sources (RES).
The problem of limiting emissions of harmful substances into the natural environment has become one of the main topics discussed by European institutions for years. The EU countries are required to reduce greenhouse gas emissions under the Kyoto Protocol [18]. The consistent policy of the EU in terms of reducing greenhouse gas emissions, mainly carbon dioxide, forces member states to a variety of activities, which results in the development of the renewable energy sector used for its production, among other initiatives [19,20].
According to the strategy presented by the European Commission in 2018, the economy of the EU is to be neutral for both the climate and the environment [21]. At the same time, however, it is to provide favorable conditions for economic development and for a modern and competitive economy. In order to achieve climate neutrality by 2050, a series of actions and decisions need to be taken in virtually all areas of economic and social life. The solutions proposed by the European Commission presented at the United Nations (UN) COP25 climate summit in Madrid, Spain (December 2019) go even further [22]. The summit presented a new European climate strategy called “The European Green Deal” [23]. According to this strategy, by 2050 the economy of the EU should become a “zero-emission” economy, i.e., climate neutral, and by 2030 carbon dioxide (CO2) emissions should be reduced by 50% (plans include even 55%), in relation to its issue in 1990. These assumptions are more ambitious than those adopted at the UN COP24 Climate Summit, which took place in December 2018 in Katowice, Poland [24].
The introduction of “The European Green Deal” requires the preparation of a new climate pact, which must be approved and then implemented by all member states. Otherwise, the assumed ambitious goals will not be achieved.
The Just Energy Transition (JET) Fund is to be very important in this respect, as it will constitute the financial base for the Just Transition Mechanism (JTM). This fund is intended for countries and regions that will have problems achieving economic zero emissions and will also support the decarbonization process in Europe [25].
It is undisputable that the implementation of the Green Deal idea will require the introduction of many political, economic and social measures that will cover all aspects of the lives of the EU citizens. In order to achieve success in this area, it is crucial to conduct an effective and rapid transition process of the energy industry. In particular, this applies to energy production, which, in the EU, is currently largely obtained from conventional sources. This, in turn, is associated with high emissions of this production [26,27,28]. The process of obtaining energy resources also causes high emissions of harmful gases and pollutants [29,30]. An alternative that can improve this situation involves renewable energy [31,32,33]. Its development, and thus an increase in the share of energy produced from these sources in the entire energy production, will be the basis for achieving the assumed goals of Europe’s climate neutrality by 2050. Therefore, the development of renewable energy is and will be treated as a priority in activities related to ensuring energy safety in the EU countries and achieving the indicators included in “The European Green Deal” strategy [34].
The goals of individual EU countries regarding the share of energy from RES in the total consumption of this energy along with the results achieved in 2017 are presented in Figure 1. The EU strategy assumes an increase up to at least 32% in the share of energy from RES in the total energy consumption in 2030. The original target of at least 27% in 2018 has been adjusted to 32%. By 2020, this level is to be 20% for the entire EU [35]. In 2017, energy from RES covered 17.5% of the total energy consumption in the EU countries (Figure 2) [35,36,37].
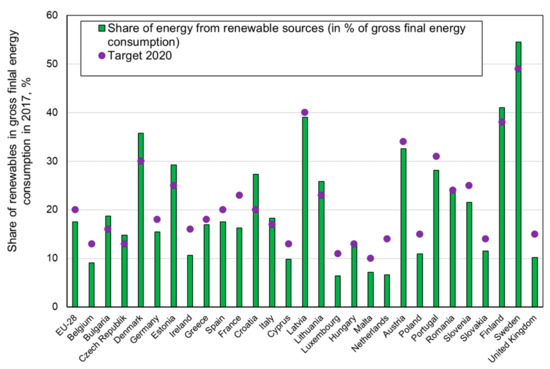
Figure 1.
Share of energy from renewable energy sources in % of gross final energy consumption in the EU (own study based on data from [35,36,37]).
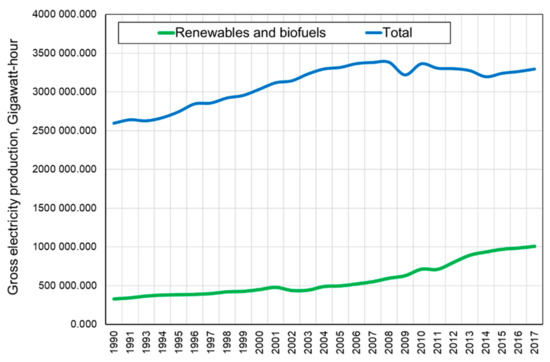
Figure 2.
Total energy production in the EU countries between 1990–2017, including energy produced from renewable energy sources (own study based on data from [35,36,37]).
The presented results show a large diversity of individual EU countries, both in terms of the assumed goal and its achievement.
In general, the adopted assumptions and actions taken to increase energy production (and ultimately also its use) from RES are already bringing very positive effects. Between 1990 and 2017, the share of energy production from RES in relation to the total energy production increased from 12.6% to 30.6%. The total electricity production in the EU countries between 1990–2017, including energy produced from RES, is presented in Figure 2.
A comparison of energy production from RES in individual EU countries in 1990 and 2017 is shown in Figure 3. Figure 4 summarizes the percentage increase in energy production from RES in the EU countries between 1990 and 2017.
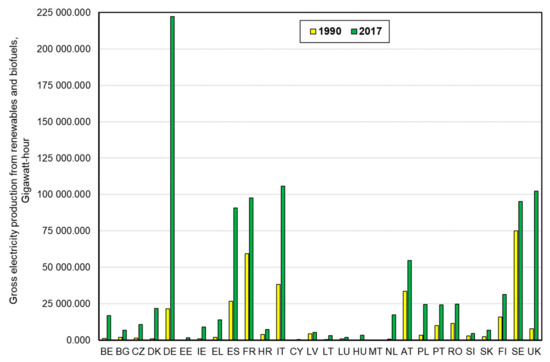
Figure 3.
Comparison of energy production from renewable energy sources in individual EU countries in 1990 and 2017 (BE-Belgium, BG-Bulgaria, CZ-Czech Republic, DK-Denmark, DE-Germany, EE-Estonia, IE-Ireland, EL-Greece, ES-Spain, FR-France, HR-Croatia, IT-Italy, CY-Cyprus, LV-Latvia, LU-Lithuania, LU- Luxembourg, HU-Hungary, MT-Malta, NL-Netherlands, AT-Austria, PL-Poland, PT-Portugal, RO-Romania, SI-Slovenia, SK-Slovak Republic, Fi-Finland, SE-Sweden, UK-United Kingdom) (own study based on data from [35,36,37]).
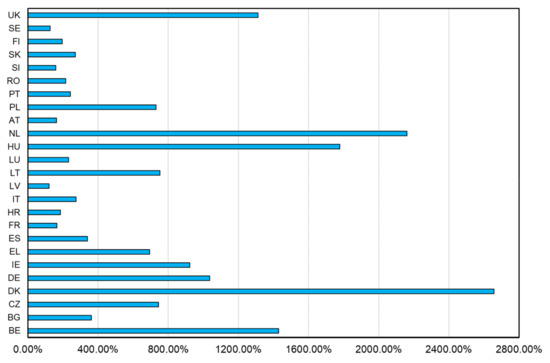
Figure 4.
Percentage increase in renewable energy production in the EU countries between 1990 and 2017 (own study based on data from [35,36,37]).
The presented data clearly shows that energy production from RES in the analyzed period significantly increased (Figure 2). However, in the EU countries, these increases were very different (Figure 3 and Figure 4). The largest percentage increases in energy from RES were reported in Germany, the Netherlands, Hungary, Belgium and the United Kingdom. In turn, the smallest increases were found in Slovenia, Latvia and Sweden.
The differences depend on the energy policy of individual countries, as well as ecological awareness of societies and their pressure on the authorities in the field of climate protection. The economic aspect is also an important factor. It is undisputable that energy production from RES is much more expensive than from conventional sources. As a result, many countries are not able to cover these costs from their own resources, which undoubtedly limits the possibilities of developing renewable energy. Both the possibilities and availability of individual renewable energy sources are also very significant in this respect. Figure 5 presents the structure of energy produced from RES in the EU countries in 2017. It includes the eight most important sources from which renewable energy is produced.
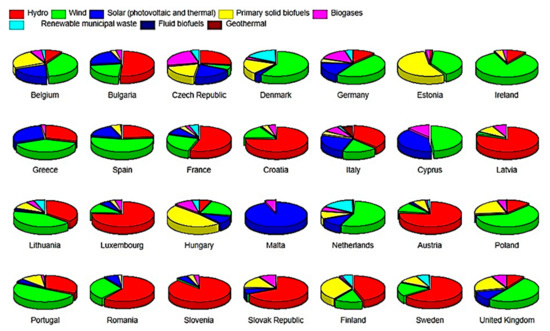
Figure 5.
Structure of energy produced from renewable energy sources in the EU countries in 2017 (own study based on data from [37]).
When analyzing the presented structure (Figure 5), it can be stated that, like the consumption of energy from RES (Figure 1), it is very different in individual EU countries. The reasons for the uneven distribution of energy production from RES in the EU countries are different economic, climatic, hydrological and geological conditions [36,38], among other factors.
It is obvious, however, that to achieve the goals of “The European Green Deal” strategy, it is necessary to significantly increase the amount of energy obtained from RES. The production of energy from these sources is practically neutral for the environment, which is undoubtedly its great advantage. Therefore, the EU countries must develop and implement an effective energy policy combined with a climate policy. These policies need to be both coherent and comprehensive and take into account the diversity of the EU countries.
According to the authors, the most important in the process of achieving climate neutrality of individual EU countries are their economic and demographic potentials as well as, to a slightly smaller extent, their geographical location and area. It is also crucial to properly orientate a climate policy so that it is acceptable by individual countries. In this regard, it seems obvious to consider the diversity of these countries. One of the main factors influencing the pace of introduced changes in the field of technological innovation will be the amount of public expenditure allocated for research and development [39,40,41].
For this reason, analyses were carried out to determine similarities between the EU countries in terms of the structure and volume of energy production from RES. These analyses take into account the number of inhabitants of individual countries, their gross domestic product and their area. It was assumed that the pro-ecological policy that is being and will have to be pursued by the EU should be adapted to the specificity of the member states. The key factors that will have an impact on achieving success in implementing ecological ideas will involve convincing societies of the need to introduce changes, the wealth of individual countries and the level of dependence of their economies on energy obtained from conventional raw materials (coal, oil, gas).
Since energy production from RES is to constitute the basis for implementing the idea of “The European Green Deal”, it is reasonable to make a diagnosis of the current state regarding the structure of energy production from these sources in individual EU countries. It is also important to relate this production to the specificity of individual countries and to identify countries with similar structure and volume of this production. This, in turn, should help in the process of implementing this idea and allow for a better distribution and use of funds.
When studying works that look at renewable energy [32,39,40,41,42,43,44,45,46,47,48,49,50,51,52,53,54,55,56,57,58,59,60], it can be claimed that so far no studies have been conducted in the scope of the structure of sources from which renewable energy is produced in the EU countries, while taking into account the specificity of individual countries. Undoubtedly, by referring this production to the number of inhabitants, gross domestic product and area of a given country, this specificity is taken into account. The paper presents the results of such analysis covering the eight most important sources from which renewable energy is produced. In the developed methodology, these sources were treated as variables (features), which included energy produced from hydro power, geothermal, wind, and solar sources as well as primary solid biofuels, biogases, renewable municipal waste, and liquid biofuels. The volume of energy production from these sources was compared to the gross domestic product (GDP), the number of inhabitants and area of a given country. Similarities between individual EU countries were determined for all cases. On this basis, these countries were divided into similar clusters (groups), depending on the studied factors (GDP, number of inhabitants and area of a given country).
In order to measure the wealth of individual countries, their GDP value was adopted, in relation to which the amount of energy produced from individual renewable sources was determined. In a similar way, indicators of the amount of produced energy were calculated per one inhabitant of each country (demographic potential) and per one square kilometer of area (geographical potential). The analyses were based on the Eurostat data from 2017 [37]. The k-means method was used to determine similarities between individual countries.
The main purpose of the research, was to analyze the structure of sources from which the EU countries produce renewable energy and to determine similarities between these countries in relation to their economic (GDP), demographic (number of inhabitants) and geographical (area) potentials. So far, no analyses have been carried out taking into account these factors, which undoubtedly represents a new approach to this subject.
The paper also presents the results of statistical analyses that were performed for the examined variants. These results were summarized with short comments, while a broader interpretation can be found in the discussion of the results. Undoubtedly, an original and new approach was created with regard to energy market research in the EU by taking into account eight sources of renewable energy production, relating this production to three factors characterizing individual countries (GDP value, population and area) and dividing these countries into similar groups. As far as the proposed changes (“The European Green Deal”) are concerned, such analysis seems to be very valuable and broadens knowledge in the field of both the production and structure of RES. It should also be emphasized that the presented research is one of the first studies relating to the idea of “The European Green Deal”.
The approach presented and the results obtained should therefore indicate and enable a more complete understanding of the problems that may occur in individual EU countries when implementing very ambitious climate strategies.
2. Background
2.1. Literature Review
In the previous studies on renewable energy sources, reference was mainly made to their technical [42], ecological [43] economical [44] and social [45] aspects. These works concentrate, among others, on analyses regarding the development of the renewable energy market [46,47,48,49], technologies related to the production of energy from RES [50] as well as on the socio-environmental consequences of using energy from these sources [51,52].
By contrast, Marques et al. [53] conducted an analysis of motivations related to the use of renewable energy in European countries, using panel data techniques, namely vector decomposition with fixed effects, in the period from 1990 to 2006. The results corroborate the lobby effect of the traditional energy sources in constraining the impetus toward renewables. The socioeconomic and political factors are mainly robust. In turn, a study by [54] assessed the effectiveness of renewable energy policy.
Papież et al. [48] conducted an analysis which aimed to identify the factors determining energy policy in the EU countries since the mid-1990s. As a result, it was found that the share of RES in the energy structure of the EU countries in 2014 largely depended on this share in the EU countries in the mid-1990s.
Bórawski et al. [46] presented the development of a renewable energy structure with particular emphasis on biofuels in the EU. The analysis included data on the share of renewables in Gross Island energy consumption, changes of renewable energy between 2004–2016, and the amount of liquid biofuels. By contrast, Shivakumar et al. in [32] presented the main factors stimulating the implementation of renewables in the EU. In turn, a study by [55] discusses the role and significance of activities conducted by energy cooperatives in terms of their participation in energy transition in Europe.
Ntanos et al. [56] determined a correlation between the use of energy from RES and the value of GDP. Also, in a study by [57], the authors conducted research on the impact of RES on economic growth. The analysis concerned the Black Sea and Balkan countries. Lucas et al. [58] determined the impact of various concepts of energy safety on the development of energy production from RES.
Study [59] analyzes the possibilities of developing renewable energy in both developed and developing countries. On the other hand, in their work [60], Kim and Park determined the impact of the financial market on the implementation and development of energy based on RES.
It is obvious that the development and implementation of new technologies in the field of obtaining energy from RES is a very costly process. At the same time, solutions in this area are usually innovative and require expensive research. In this respect, it becomes necessary to finance them also from public subsidies. The amount of these subsidies can have a very significant impact on the results achieved [39,40,41].
The presented, selected research results indicate that the energy transition, the main goal of which is to replace conventional energy sources with RES, is a complex process that depends on many factors. These results also confirm the need for research that would focus not only on the absolute values of energy produced from RES but also on other factors that may affect the volume and structure of this production in the future. Therefore, a new approach to this analysis, especially in the context of changes that are to take place in the EU countries in connection with the introduction of the “Green Deal” idea, seems fully justified.
2.2. EU Policy in Terms of RES
The EU energy policy is characterized by an integrated approach to energy safety. Its goal is to satisfy social needs, ensure competitiveness of the economy and protect both the environment and climate [61,62,63,64,65,66].
The idea of “Green Deal for Europe” proposed in December 2019 creates new conditions for implementing a very ambitious climate protection plan. It also makes the EU countries most responsible for improving the climate on earth. At the same time, it assumes that achieving climate neutrality will contribute to the dynamic development of the economy and improve its competitiveness. In addition, it will also be an example for other countries and continents that are involved in improving this climate. The implementation of the “Green Deal for Europe” idea will also enable the EU countries to achieve energy independence, which may have a significant impact on the energy market as well as regional policy.
Therefore, based on the energy policy of the EU countries, the significance and role of RES in the structure of the energy sector has been systematically growing since the 1990s [35,36,37]. As a result, a growing share of energy obtained from RES in the energy mix of the EU has been reported.
The EU aims to achieve a 20% share of RES in gross final energy consumption by the end of 2020. This target has been set for the whole EU, but in addition, each member state has its own targets set in national action plans that show the path of development of RES in each country. All plans to achieve the assumed goals are presented in [67]. National targets for the use of energy from RES for individual countries, taking into account their starting point and the overall potential of RES, range from just 10% for Malta to as high as 49% for Sweden. The process of reaching these values varies from country to country.
For example, the primary goal of Germany’s sustainable energy policy is to limit the negative impact of energy on the environment and the climate by supporting projects that lead to the use of energy from RES [68,69,70,71]. Denmark, which has been developing technologies for obtaining energy from RES since the 1970s [72], on September 15th, 2019 covered all daily demand for energy from RES (mainly from wind energy) [73].
Sweden, on the other hand, covers almost 55% of the demand for energy from RES [37]. Sweden’s huge success in this area is primarily due to the large number of hydropower plants and large biomass resources. The very active energy policy of the Swedish Government is also important [74]. If the pace of development of RES is maintained, by 2040 the Swedish energy mix will have been using only RES and the set goal will have been achieved by the national authorities.
In Bulgaria, in 2011, the program “The energy strategy of the Republic of Bulgaria until 2020 for reliable, efficient and cleaner energy” was adopted. It is the basic document regulating the national energy policy, where the assumptions were adjusted to the energy policy of the EU. Renewable energy sources occupy a key place in the Bulgarian energy strategy [75]. Bulgaria has adopted the so-called National Renewable Energy Action Plan to fulfill its obligations under the Directive [76]. The adopted assumptions and actions have brought the expected effects, because the target set for 2020 in the scope of using energy from RES in relation to the total gross energy consumption was achieved already in 2017.
The French Plan for Energy and Climate assumes that 23% of RES will be achieved in final energy consumption in 2020 and 32% in 2030. Both emission reduction and emission neutrality were also planned for 2050. To achieve this, in 2030, 40% of electricity, 38% of heat, 15% of fuels and 10% of gas (biogas) will come from RES.
The examples of effects of energy policy conducted by selected EU countries show that ambitious plans related to the idea of “The European Green Deal” are possible to obtain. However, this will require huge financial commitment and solidarity between countries. Many of the EU countries, as evidenced by the data presented in Figure 1, must significantly intensify their activities in this area. In particular, this applies to the overall share of energy from RES in gross final energy consumption and the share of energy from RES in transport [77].
By taking into account the diversity of the EU countries when developing energy policy for the coming years, and in particular the distribution of funds that will be allocated for this purpose, it will by easier to accomplish the set goals.
3. Materials and Methods
3.1. Methods
The presented multidimensional comparative analysis was carried out using the taxonomic concept of a multidimensional object, which is a statistical unit. The multidimensional object (characterized by many variables) in this case are the European Union Member States. Eight diagnostic variables were adopted for the analysis, which were the values of energy produced in a given country from selected renewable sources (hydro, geothermal, wind, solar, primary solid biofuels, biogases, renewable municipal waste, liquid biofuels). Each of the studied EU countries was characterized by these eight values. The analysis was carried out for four different variants. The first variant involved the absolute values of these energies, the second variant compared them to the value of GDP of individual countries, the third variant to the number of inhabitants, and the fourth variant to the area of a given country.
The non-hierarchical cluster analysis algorithm—the k-means method—was utilized. It consists in assigning n objects to a given a priori number of k clusters. The aim was to find and extract groups (clusters) of similar objects (countries) from the studied population. The similarity of objects (countries) located in one cluster should be as large as possible, while separate clusters together with the objects forming them (countries) should differ from each other as much as possible. Moving objects (countries) between clusters takes as long as variations within clusters become minimized and variations between separate clusters become maximized.
Usually, as a result of using the k-means method for grouping, the average values of variables for each cluster are examined in each dimension in order to estimate how much these clusters differ from each other. The F-statistic derived from the analysis of variance performed in each dimension is an indicator of how well a given dimension discriminates against other clusters.
The k-means method aims to find the extreme of the objective function, which is defined by the following relationship:
The research algorithm for the k-means method consists of the following stages:
- 1)
- Determination of a priori number of clusters – k. To calculate the number of clusters, the following Equation (2) was used [78]:where: k is the number of clusters, n is the number of cases (countries).
- 2)
- Assignment of cases (EU countries) to individual clusters on the basis of designated Euclidean distances dij for individual cases (EU countries) Pi, from the centers of clusters mi. The Euclidean distance is determined based on the following relationship:
- 3)
- Determination of new cluster centers using the cumulative method based on the equation:
- 4)
- Determination of the displacement of clusters ∆m:
- 5)
- Assignment of cases (EU countries) to new clusters.
- 6)
- Determination of new cluster centers.
3.2. Materials
In order to conduct the comparative analysis of the similarities between the EU countries in terms of the structure of energy production from RES, data from the Eurostat database for 2017 (the latest available data) was used (Table 1) [37]. The analysis was carried out for 28 countries that were the EU Member States in 2017.

Table 1.
Structure of energy production from renewable energy sources in the EU countries in 2017 (own study based on data from [37]).
Each country was characterized by 8 diagnostic variables that determine the volume of energy production from selected renewable sources. The volume of energy production was expressed in gigawatt hours. Diagnostic variables characterizing the EU countries were the volume of energy production from the following sources: hydro, geothermal, wind, solar, primary solid biofuels, biogases, renewable municipal waste, and liquid biofuels.
The variables determining the structure of energy production from RES (Table 1) were then compared to the GDP value of a given country (Table 2 and Figure 6), calculated per capita (Table 3 and Figure 7) and per 1 km2 of a given country’s area (Table 4 and Figure 8). The diagnostic variables presented in Table 1, Table 2, Table 3 and Table 4 were used for a preliminary statistical analysis and their basic statistical parameters were determined (mean, maximum, minimum values, standard deviations and coefficient of variation), which are summarized in Table 5, Table 6, Table 7 and Table 8.
Table 2.
Structure of energy production from renewable energy sources in the EU countries in relation to the value of GDP in 2017 (own study based on data from [37]).
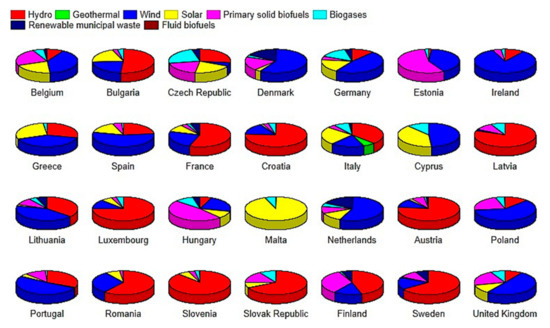
Figure 6.
Structure of energy production from renewable energy sources per GDP of individual EU countries in 2017 (GDP according to nominal expenditure, in euro) (own study based on data from [37]).
Table 3.
Structure of energy production from renewable energy sources per capita of individual EU countries in 2017 (own study based on data from [37]).
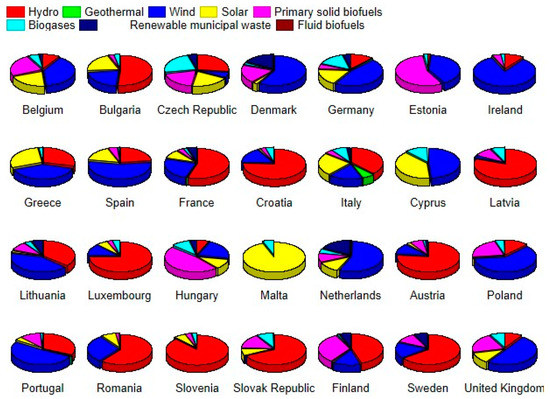
Figure 7.
Structure of energy production from renewable energy sources per capita of individual EU countries in 2017 (own study based on data from [37]).
Table 4.
Structure of energy production from renewable energy sources per 1 km2 of area of individual EU countries in 2017 (own study based on data from [37]).
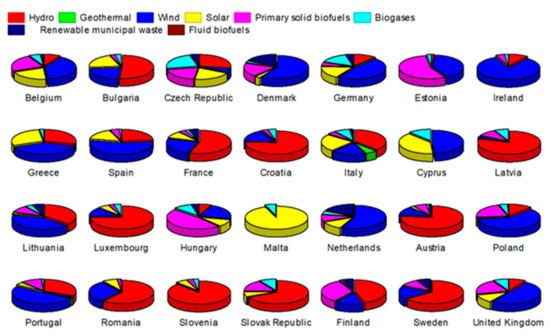
Figure 8.
Structure of energy production from renewable energy sources per 1 km2 of area of individual EU countries in 2017 (own study based on data from [37]).
Table 5.
Selected statistical parameters of variables determining the volume of energy production from selected renewable energy sources in the EU countries in 2017 (own study).
Table 6.
Selected statistical parameters of variables determining the volume of energy production from renewable energy sources in the EU countries in terms of their GDP (by nominal expenditure, in euro) in 2017 (own study).
Table 7.
Basic statistical parameters of variables determining the volume of energy production from renewable energy sources in the EU countries in 2017 per capita (own study).
Table 8.
Basic statistical parameters of variables determining the volume of energy production from renewable energy sources in the EU countries in 2017 per 1 km2 (own study).
The set of variables presented in Table 5, Table 6, Table 7 and Table 8 are characterized by a large range of the coefficient of variation. Therefore, these variables meet the condition of diagnostic features, which must be marked by significant differences within the examined population. In addition, these variables are not highly correlated. Correlation coefficients between the studied variables are summarized for each variant in Table 9, Table 10, Table 11 and Table 12, respectively.
Table 9.
Correlation coefficients for energy production from renewable energy sources in the EU countries in 2017 (own study).
Table 10.
Correlation coefficients for energy production from renewable energy sources in the EU countries per capita in 2017 (own study).
Table 11.
Correlation coefficients for energy production from renewable energy sources in the EU countries per GDP (according to nominal expenditure, in euro) in 2017 (own study).
Table 12.
Correlation coefficients for energy production from selected renewable energy sources in the EU countries per 1 km2 in 2017 (own study).
The analysis showed that the largest positive values of the correlation coefficient are adopted for the variables presented in Table 9, defining the total energy production from studied RES. On the other hand, for the variables presented in Table 10, Table 11 and Table 12, the correlation coefficient shows much smaller values, often negative.
The analysis of the correlation coefficient confirmed that it was correct to take into account the adopted diagnostic variables in further analysis, defining the volume of energy production from RES for the adopted criteria.
4. Results
Based on the adopted procedure, the analysis was conducted, the results of which are presented in this chapter. As already mentioned, the analysis covered 28 EU countries for which eight diagnostic variables were adopted, defining the volume of energy production from various RES, which were considered in four different variants.
The purpose of the analysis was to divide the EU countries into similar groups in terms of the structure and volume of energy production from RES in total (absolute values), as well as in relation to the GDP value of a given country, per capita and in relation to the area of a given country (relative values).
The k-means method used for the analysis requires assuming the a priori number of clusters to which the EU countries will be assigned. In order to determine an appropriate number of clusters, the preliminary analysis of hierarchical grouping using the Ward’s method was performed (Figure 9). This method does not require defining the a priori number of clusters to which countries are to be assigned. Here, the number of clusters is determined based on the algorithm with the Euclidean linkage (the same linkage as in the k-means method) [75]. Based on the results of this analysis (Figure 9), as well as based on the results obtained from Equation (2), it was assumed that the optimal number of clusters adopted for calculations in the k-means method would be four.
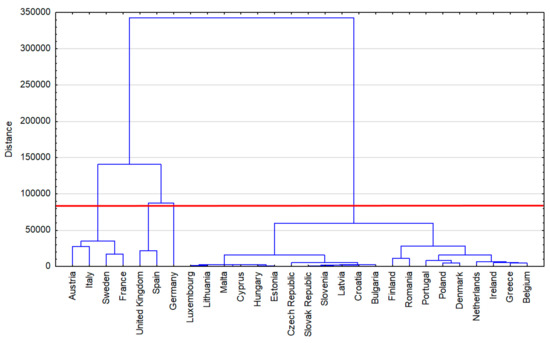
Figure 9.
Results of the hierarchical grouping of similarities between the EU countries in energy production from renewable energy sources in 2017 using the Ward’s method (own study).
Based on the determined values, the analysis was carried out, which resulted in grouping the EU countries into clusters in such a way that their degree of association with countries belonging to the same cluster was as high as possible, and with countries from other clusters as low as possible. The results are presented in the sections below.
4.1. Results of Grouping the EU Countries According to the Similarity of the Structure of Total Energy Production from Renewable Energy Sources
The first stage of the analysis involved the division of the EU countries into similar groups according to the total amount of energy produced from RES in 2017. Based on the adopted assumption regarding the optimal number of groups, the EU countries were divided into four clusters.
Based on the analyses, diversity measures within and between the clusters were determined, along with degrees of freedom (df) (Table 13). The obtained values of F-statistics, which are the ratio of diversity between clusters to diversity within clusters, allowed the authors to determine the most important grouping variables in terms of their discriminatory power. This means that the larger the F-statistic for a given variable, the more important it is for assigning given countries to particular clusters.
Table 13.
Analysis of variance for renewable energy production (own study).
The analysis of variance showed that wind energy played the largest role in assigning the EU countries to individual clusters. The value of F-statistic for this variable is largest and amounts to 149.33. The second most important allocation criterion was energy generated from biogases (statistical value F = 117.72).
Geothermal energy, for which the value of F-statistic was only 2.37, was the least important factor for assigning the EU countries based on the adopted criterion. It should be emphasized, however, that each diagnostic variable, i.e., each renewable energy source, ultimately had an impact on grouping the EU countries into homogeneous clusters in terms of both structure and volume of energy production from these sources. It also needs to be emphasized that wind energy in the renewable energy structure in the EU countries is extremely important, because it is the second, after natural gas, largest “source” of electricity in Europe. The share of wind energy in the EU energy mix is around 18% [79]. At the same time, in the report by [80], the European Wind Energy Association (EWEA) indicated that by 2030 wind farms could become the largest source of renewable energy in Europe.Since wind energy and biogas energy were significant for assigning the EU countries to specific clusters, countries with similar volumes of energy production from these sources were in one cluster.
The compositions of the created clusters and the distance from their centers (cluster centers) are presented in Table 14. The greater the distance of a given EU country from the center of the cluster in which this country was located, the greater its diversity from countries whose distance from the center of the cluster was smaller.
Table 14.
Elements of clusters with distances from centers (own study).
The results indicate that the most numerous cluster was created by 21 countries (cluster 3), and also they point to homogeneity of one of the clusters (cluster 2). Germany, as a country with the highest amount of wind and biogas energy production (Figure 10b), is in Cluster 2, thus creating a homogeneous cluster. No other country is similar to Germany in terms of the amount of energy produced from the selected renewable sources, especially in the production of energy from wind and biogas. The country’s special wind energy program, which guarantees adequate prices, has made the country one of the world’s largest producers of wind energy in recent years. In 2017, as the leader of European wind energy, Germany had a capacity of 56 GW. Other countries include Spain (23 GW), Great Britain (14 GW) (cluster 1) and France (14 GW) (cluster 4) [79].
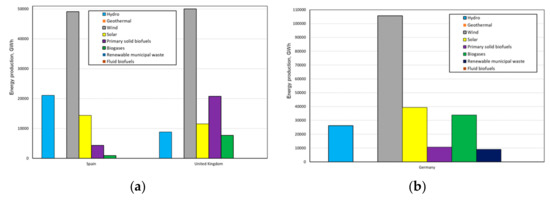
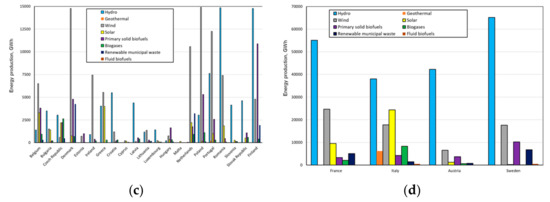
Figure 10.
Structure and volume of energy production from renewable energy sources by countries in individual clusters; cluster 1 (a); cluster 2 (b); cluster 3 (c); cluster 4 (d) (own study).
A similar situation can be observed with regard to the production of energy from biogas, in which Germany is also the undisputed leader. Both of these energy sources form the basis for energy transition in Germany (Energiewende) and for reducing greenhouse gas emissions and increasing energy efficiency [68]. This policy has very tangible benefits. The environmentally friendly policy aimed at ensuring that 100% of energy demand in selected sectors is met by renewable sources is often followed by regional and municipal authorities. Similar actions are taken in many EU countries, but Germany is reported to have definitely the biggest number of such initiatives. According to the Global Status Report [81], around 20 million people in Germany live in regions where energy demand is fully met by RES. In terms of the absolute values, none of the EU countries have achieved such results.
Other countries, i.e., Great Britain and Spain have significantly improved the results in the field of energy production from RES in recent years. Both these countries show great similarities in the production of energy from wind and sun but smaller similarities in the field of energy production from water, primary solids, biofuels, and biogases.
According to the National Infrastructure Commission advisory center, the UK Government should now only invest in renewable energy sources and possibly one nuclear power plant - Hinkley Point C until 2025, as these two sources guarantee both safe and cheap electricity. The Spanish Government, in turn, intends to increase the share of RES in the national electricity production mix to 70% by 2030, and then to 100% by 2050 (which is in line with the idea of “The European Green Deal”). Currently, almost half of the energy consumed in Spain comes from RES [82]. Spain is the second largest wind energy market in Europe after Germany [83]. It is worth noting that on the wholesale energy market in Spain, wind energy turns out to be the cheapest of all energy sources present in the country’s energy mix.
Clusters 3 and 4 are the most internally diversified clusters in terms of the structure and volume of energy production from RES. Cluster 3 includes as many as 21 EU countries (including Finland, Belgium, Greece, Denmark, the Netherlands and Poland). This cluster is created by countries with very low energy production from RES (e.g., Malta, Lithuania, Luxembourg), but also by countries where the volume of energy production from RES is much larger (e.g., Denmark, Finland).
In turn, cluster 4 is formed by four countries that are characterized by greater diversity in the structure of energy production from RES. It is worth mentioning that the composition of individual clusters coincides with the composition of the clusters obtained using the preliminary analysis performed by the Ward’s method (Figure 9). The structure and volume of energy production from RES by countries in individual clusters are presented in Figure 10.
Basic descriptive statistics characterizing the structure of energy production in the created clusters are presented in Table 15.
Table 15.
Elements of clusters with distances from centers (own study).
Based on the analysis, it can be concluded that the highest value of renewable energy production was reported for the first homogeneous cluster made by Germany. Germany was found to have produced 224,976.89 gigawatt hours of renewable energy in 2017.
For the other clusters created by very different countries, it is reasonable to use the mean value to determine the amount of renewable energy production by these clusters. A list of mean values of energy production from RES for individual clusters is presented in Figure 11.
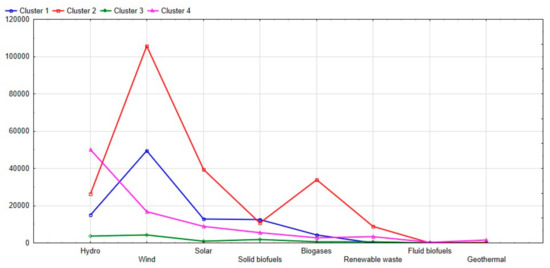
Figure 11.
Mean values of energy production from renewable energy sources for individual clusters (own study).
Based on the results, the countries forming cluster 3 were shown to have achieved the lowest mean value of energy produced from RES.
4.2. Results of Grouping the EU Countries according to the Similarity of the Structure of Energy Production from Renewable Energy Sources Per Their GDP Value
The second variant that was analyzed involved the division of the EU countries into similar groups in terms of the structure and volume of energy production from RES in relation to the GDP of a given country. It was adopted that this value is a measure of the wealth of a given country.
It was assumed that the economies of highly developed countries (with high GDP values) should develop the RES sector to the largest extent, and thus also produce the largest amounts of energy from RES. It was therefore reasonable to conduct an analysis that aimed to divide the EU countries into similar groups in terms of the volume and structure of renewable energy production in relation to the GDP of a given country.
This analysis seems particularly interesting in terms of cognition, because according to the report entitled “Renewable Energy Benefits: Measuring the Economics” by the International Renewable Energy Agency (IRENA), an increase in the share of the use of renewable energy up to 36% by 2030 may elevate global GDP by $ 1.3 trillion or 1.1 percent [84].
It is therefore also reasonable to check whether there is currently a relationship between the structure and volume of energy production from RES and the wealth of EU countries and what the similarity of these countries is in this respect.
As in the previous variant, the EU countries were divided into four clusters. Their compositions together with the calculated distances from their centers are shown in Table 16. The measures of diversity within and between the clusters are presented in Table 17.
Table 16.
Elements of clusters with distances from centers (own study).
Table 17.
Analysis of variance for renewable energy production (own study).
The results indicate that this time the basic grouping variable assigning countries to individual clusters was hydropower. For this variable, the value of F-statistic was 85.02. The second grouping variable was wind energy (F = 9.01), which in the first variant was the priority grouping variable. Geothermal energy was reported to have the least impact on the division of countries in this case (as in the previous variant), for which the value of F-statistic was only 0.35. It can therefore be concluded that the created clusters are characterized by a smaller diversity of their number than in the first variant of the analysis.
The first cluster included the countries with the greatest similarity in the structure and volume of renewable energy production in relation to the GDP value of these countries. This group consists of 4 countries with the largest energy production from water, i.e., Croatia, Latvia, Austria and Sweden. Wind energy and primary solid biofuels are also produced in all these countries, but the volume of this production is more diverse. However, these countries do not belong to the countries with the highest value of total energy production from the analyzed renewable sources, nor with the highest GDP value. However, the ratio of energy production from water (the basic grouping variable) to the GDP value of these countries is favorable for them.
Countries in Cluster 2 (Bulgaria, Romania, Slovenia, Slovak Republic and Finland) also show a great similarity in the structure and volume of energy production from RES. In these countries, the ratio of energy production from water to the value of GDP is very favorable, which determined the composition of this cluster.
Countries that are in clusters 3 and 4 are slightly less similar in terms of the structure and volume of energy production from RES.
The analysis also showed that Germany, which is the country with the largest amount of energy production in total from RES, after taking into account the value of GDP, is no longer the clear leader of this cluster. A similar situation can be observed in the case of Spain and Great Britain, which in the first variant of the analysis belonged, next to Germany, to the countries with the largest energy production from RES.
The structure and volume of energy production from RES in relation to the value of GDP by countries in individual clusters is presented in Figure 12.
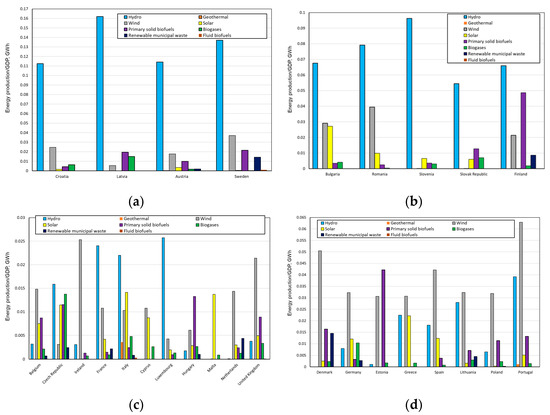
Figure 12.
Structure and volume of energy production from renewable energy sources in relation to the value of GDP by countries in individual clusters; cluster 1 (a); cluster 2 (b); cluster 3 (c); cluster 4 (d) (own study).
The analysis allowed for the determination of total, minimum, maximum and mean values of energy production from RES in relation to the value of GDP in individual clusters (Table 18). Figure 13 presents the mean values of energy production from RES in relation to the value of GDP for individual clusters.
Table 18.
Elements of clusters with distances from centers (own study).
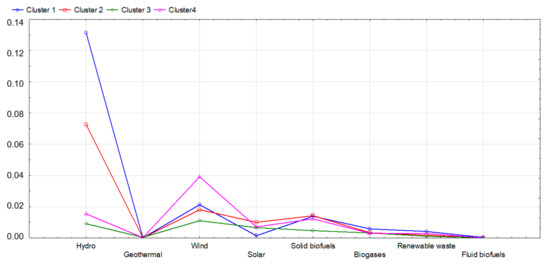
Figure 13.
Mean values of energy production from renewable energy sources in relation to the value of GDP for individual clusters (own study).
When analyzing the results, it can be stated that the countries in cluster 1 are characterized by the highest mean value of energy production from water, biogas and renewable municipal waste in relation to the value of GDP. The lowest mean value of energy production from RES in relation to GDP was reported for countries in cluster 3. This applies to hydro, geothermal and wind energy, solid biofuels and renewable municipal waste
4.3. Results of Grouping the EU Countries according to the Similarity of the Structure of Energy Production from Renewable Energy Sources Per Capita
The third variant of the analysis involved grouping the EU countries into similar clusters in terms of the structure and volume of energy production by the number of inhabitants of these countries. It seemed reasonable to check whether there is a relationship between the structure and volume of energy production from RES and the number of inhabitants, and what the similarity of these countries is in this respect.
As in the previous variants, the EU countries were divided into four groups. Measures of diversity within and between the created clusters are presented in Table 19.
Table 19.
Analysis of variance for renewable energy production (own study).
In this variant, the highest value of F-statistic, which defines the most important grouping variable in assigning countries to clusters, was achieved by hydropower (F = 113.91), while the second significant grouping variable was wind energy (F = 14.65). The grouping variables in this case were the same as for the analysis regarding the structure and volume of energy production from RES, taking into account the GDP value of a given country.
The variable that was found to have the least impact on the results, as in the previous two variants of the analysis, was geothermal energy, for which the value of F-statistic was 0.13.
The created clusters and their compositions, as well as the distances from the centers of these clusters are presented in Table 20. The structure and volume of energy production from RES per capita by countries in individual clusters are presented in Figure 14.
Table 20.
Elements of clusters with distances from centers (own study).
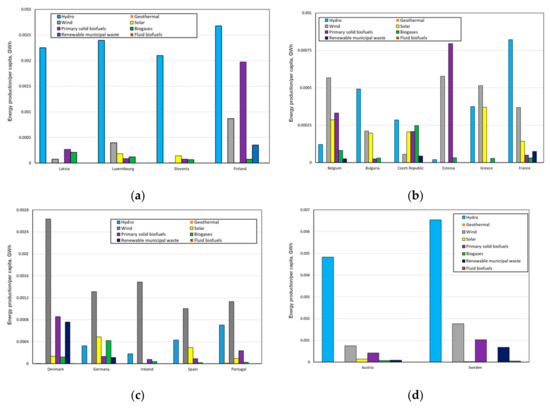
Figure 14.
The structure and volume of energy production from renewable energy sources per capita by countries in individual clusters; cluster 1 (a); cluster 2 (b); cluster 3 (c); cluster 4 (d) (own study).
The results showed that the division of countries according to the structure and volume of energy production from RES per capita essentially differed from the division by the structure and volume of energy production from these sources in total (Table 14), as well as from the results obtained in the variant including the value of GDP (Table 16).
The most energy from RES per capita was found to be generated by countries from cluster 4 (Sweden and Austria), and the least-by countries from cluster 2 (e.g., Poland, France, Malta, Belgium). Among the countries producing the lowest energy per capita, Malta was shown to produce the least energy in total.
On this basis, it can be concluded that both the greatest similarities and differences between the countries were found in cluster 2 (17 countries, including France, Great Britain, Poland, Italy, the Czech Republic). At the same time, countries that are in clusters 2 and 3 were shown to share similarities (determined on the basis of a small distance from the center of the cluster for individual countries).
It was also noted that clusters 1 and 3 included countries that “stood out” from other countries from these clusters. In the case of cluster 1, it was Finland, and in the case of cluster 3, it was Denmark (for them, the distances from the centers of their clusters are 0.000541 and 0.0005059, respectively).
Figure 15 shows the mean values for each cluster. Table 21 presents the total, minimum, maximum and mean values of energy production from RES in individual clusters per capita of a given country.
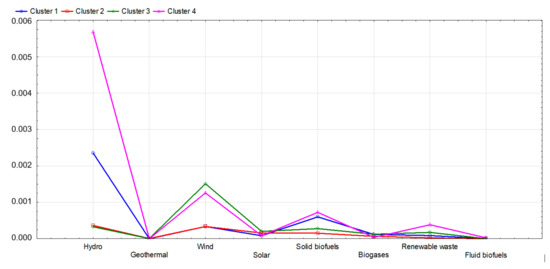
Figure 15.
The Mean values of energy production from renewable energy sources in relation to the number of inhabitants for individual clusters (own study).
Table 21.
Elements of clusters with distances from centers (own study).
When analyzing the results, it can be stated that the demographic factor significantly affected the composition of clusters and their number.
4.4. Results of Grouping the EU Countries according to the Similarity of the Structure of Energy Production from Renewable Energy Sources Per Area
The last variant of the analysis involved grouping of the EU countries by relating the amount of energy produced from RES to their area.
As in the case of the previous variants, the EU countries were grouped into four clusters, the compositions of which are presented in Table 22. In turn, Table 23 presents the measures of similarity and diversity along with the analysis of variance.
Table 22.
Elements of clusters with distances from centers (own study).
Table 23.
Analysis of variance for renewable energy production (own study).
The analysis of the value of F-statistic showed that the most important grouping variable for this variant was solar energy (F = 129.4). Hydrogen energy (F = 42.76) was the second significant grouping variable, which was the most important in the two previous variants. Thus, in this variant, its significance in grouping countries into homogeneous structures was observed to have slightly decreased. It is worth noting that the priority (main) grouping variable in this analysis variant is completely different when compared to the previous variants.
However, the least significant variable from the point of view of assigning countries to clusters did not change, as for the fourth time, it was geothermal energy (F = 0.14).
The analysis of the results indicates that the division of countries into homogeneous clusters according to the structure and volume of energy production from RES per 1 km2 essentially differed from the previously obtained divisions.
In cluster 1, Malta was reported to be the country with the smallest area among all analyzed countries (and also the smallest number of inhabitants). Among all the EU countries, it is a country where the largest amount of renewable energy is produced from solar energy (i.e., a priority grouping variable) (Figure 16a). Malta is also a country where the production of energy from RES is lowest.
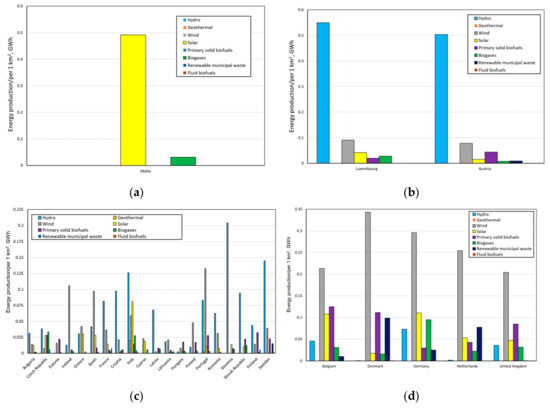
Figure 16.
Structure and volume of energy production from renewable energy sources in relation to the area of the countries in individual clusters; cluster 1 (a); cluster 2 (b); cluster 3 (c); cluster 4 (d) (own study).
Cluster 2 was made up by Luxembourg and Austria. Although these countries differ significantly in their area, the structure and volume of energy produced from RES per area of these countries was found to be very similar.
The analysis found that as many as 20 EU countries showed similarities in terms of the structure and volume of energy production from RES per area. These countries form cluster 3. At the same time, due to its abundance, this cluster was found to have the greatest internal diversity.
The structure and volume of energy production from RES in relation to the area for countries located in individual clusters is presented in Figure 16.
Table 24 shows the total, minimum, maximum and mean values of energy production from RES in individual clusters per 1 km2 of area, and Figure 17 shows the mean values of this production for each cluster.
Table 24.
Elements of clusters with distances from centers (own study).
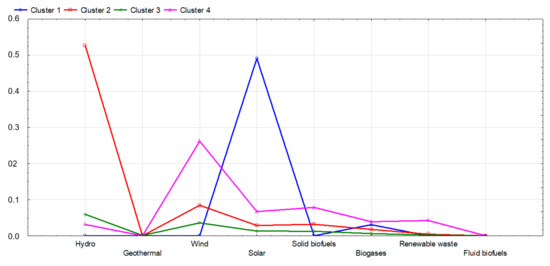
Figure 17.
Mean values of energy production from renewable energy sources in relation to the area of selected countries for individual clusters (own study).
5. Discussion
When studying the presented data and results, it can be concluded that in recent years, there has been a large increase in energy production from RES in the EU countries (Figure 2, Figure 3 and Figure 4). Along with the increase in production, the consumption of this energy is also on the increase [84]. At the same time, a large variation in the overall production of this energy and the structure of this production in individual countries can be noted.
Based on the overall production of energy from RES in the EU countries, Germany was found to be the largest producer (about 22% of the studied energy sources), followed by France, Italy, Sweden and the United Kingdom, the production of which accounts for around 10% of the EU production (Table 1).
However, when taking into account the structure and volume of renewable energy production from the studied sources, it is clear that the similarities in both the structure and the volume of renewable energy production among the EU countries with the highest production is shown by Spain and the United Kingdom (cluster 1), France, Italy, Sweden and Austria (cluster 4) (Table 14). Germany, in turn, was found to be a homogeneous cluster, not showing enough similarities to be compared with other EU countries (Table 14). Much smaller amounts of energy from RES were shown to be produced in other countries, including Poland and Spain, i.e., countries with a large area and large population. The analysis of these results also clearly indicates the countries in which energy is based on conventional raw materials. This applies primarily to Poland, Slovenia, Croatia, Hungary and several smaller countries.
The share of energy produced from RES in gross final energy consumption is one of the main indicators of the strategy “Europe 2020” [85,86]. The goal of this strategy (adopted before “The European Green Deal” strategy) is to achieve about 20% share of energy from RES in the final energy balance in 2020, and at least 32% by the end of 2030.
In this respect, Sweden, Finland, Latvia, Denmark and Austria use the most renewable energy (Figure 1). Sweden is the leader in this respect, while eleven member states were found to have already achieved the 2020 goals. Apart from Sweden, they include Bulgaria, the Czech Republic, Denmark, Estonia, Croatia, Italy, Lithuania, Hungary, Romania, and Finland (Figure 1). However, Latvia and Austria are very close to achieving the assumed share of renewable energy in total energy consumption, which is only about 1 percentage point from their 2020 targets (Figure 1).
In this respect, the countries with the highest absolute amount of energy produced from RES present quite poorly. Although Germany, Great Britain, France and Spain are leaders in the absolute amount of energy produced from RES, these achievements are low when compared to the final energy balance (Figure 1). The general energy demand of these countries is so large that the amount of energy produced from RES meets their needs only to a small extent. This, in turn, means that their energy deficit is satisfied from other energy sources, including mostly conventional sources that are very harmful to the environment.
Therefore, further analyses included determining the amount and structure of energy produced from RES in relation to the value of GDP (Table 2), the number of inhabitants (Table 3) and the area (Table 4) of individual countries.
It was assumed that by contrasting them only with the absolute values of energy produced from RES would not fully reflect the real state of renewable energy in Europe. Undoubtedly, this approach gives a fuller and more objective picture of the state of this energy sector. This is confirmed by the results obtained from the analyses for three additional variants, which differ significantly from the grouping results for the total amount of energy produced from RES.
When converting the amount of energy produced from RES to the GDP of a given country (measure of wealth), great similarities between such countries as Germany, Poland, Estonia, Greece, Lithuania, Portugal and Denmark were reported. This means that in relation to the value of GDP, the amount of energy produced from RES is very similar in these countries, despite the fact that in terms of the absolute values, these quantities significantly differ.
Sweden, Latvia, Croatia and Austria were found to be most favorable for this variant (cluster 1, Table 16), for which the relationship between the amount of energy produced from RES and their GDP is highest. Also, the division into similar groups for this variant is more even than in the case of the analysis of the absolute energy production values. This creates favorable conditions for exchange of experience and cooperation between countries in a given cluster and joint application for funds intended for energy transition.
Another factor that was taken into account in the presented analysis is the demographic factor. It was assumed that the ratio of the amount of energy produced from RES to the number of inhabitants of a given country determines the state of public awareness in the field of climate protection. This is a very general assumption, but according to the authors, the value of this indicator may undoubtedly point to social commitment to environmental protection.
The analysis shows (Table 20 and Figure 14) that the largest amounts of energy produced from RES per capita were reported for countries in cluster 4 (Sweden and Austria) and cluster 1 (Finland, Denmark, Luxembourg and Latvia). On the other hand, the smallest amounts were observed for countries from cluster 2 (Hungary, Cyprus, Malta, Poland, Bulgaria, as well as the Czech Republic and the United Kingdom, among other countries). Also, in this case, the division of countries into similar groups was found to be different than in the case of the division by the total amount of energy produced from RES (Table 14).
Therefore, it is reasonable to state that the reference of energy production from RES to the value of GDP and the number of inhabitants of a given country gives results that definitely reflect the specificity of individual countries rather than just an analysis of the absolute values of this production. They also define the degree of utilization of the economic and demographic potentials of a given country. Countries that achieve the best results for these criteria are undoubtedly among the leaders in introducing energy transition. It can also be assumed that the societies of these countries are more aware of the need to introduce changes related to climate protection.
In the next analysis, the amount of energy produced from RES was compared to the area of a given country. It was assumed that the size of a given country should have an impact on the structure and amount of energy produced from RES. It is obvious that the geographical location of the country and its area affect the availability of RES. It seems that this indicator, of course, to some extent determines the degree of the use of “geographical potential” in the production of energy from RES.
It seems reasonable to state that countries with a large area have easier access to renewable energy sources, especially in the field of wind and solar energy. Undoubtedly, this is a certain simplification, but according to the authors, the reference of energy production from RES to the area of a given country can, as already mentioned, be treated as a degree of utilization of the country’s “geographical potential”.
The results (Table 22 and Figure 16) indicate that also in this respect the division of the EU countries into similar groups is different versus the division that takes into account the absolute amounts of energy produced from RES. Austria and Luxembourg obtained the best results for this variant. The structure of renewable energy production in these countries is also very similar. The lowest rates were obtained by countries from cluster 3 (e.g., Poland, Bulgaria, Lithuania, Cyprus, Estonia and Hungary). It can be claimed that despite the favorable geographical conditions, these countries are not achieving satisfactory results.
To sum up, it should be noted that the results show that the problem of reducing harmful emissions in the energy industry in the EU countries is very complex. It requires an in-depth analysis that will cover many factors. Undoubtedly, the results presented in this paper and their discussion constitute a new approach to the analysis of this problem. Renewable energy sources must replace conventional sources as soon as possible.
This applies mainly to the heating and cooling sectors as well as the transport sector, as these sectors make the most use of conventional energy sources (coal, oil and gas). The integration of these sectors, in particular the heating and cooling sectors with the electricity sector must be carried out in two ways: through both electrification and technological innovation [87,88,89]. The introduction of these solutions requires the development of a comprehensive energy policy based on both knowledge and innovative solutions.
In order to achieve the assumed climate goals, a fair and reasonable orientation of finances toward energy transition in many EU countries is required. The presented analyses should support this process and direct it to the analysis of the needs and possibilities of designated similar groups of countries. This creates a possibility of more efficient use of funds than if all countries were treated according to one criterion.
The diversity of the EU countries, clearly demonstrated in the study, shows that such a course of the EU actions should give the best results.
The results of grouping the EU countries into homogeneous clusters (groups) in terms of the structure and volume of energy production from RES presented in the article indicate that the analysis in terms of the absolute amount of energy produced from RES does not fully describe the actual state of this phenomenon. Thus, it was justified to extend this analysis to new factors that allowed a more accurate assessment of the similarity of the EU countries in the field of renewable energy production.
In order to develop technologies related to renewable energy sources, the knowledge of the countries which have achievements and experience in a given area should be used. However, it should be remembered that what kind of renewable energy sources are worth developing depends also on the natural conditions of the country. Solutions that work well in countries with high sunshine will not work so well in countries with low sunshine. The same applies to investing in water and wind energy.
The economic and demographic potentials of a given country are also crucial to be considered. As already mentioned, obtaining energy from RES is very expensive and requires considerable investments. Public consent to these investments is also a key factor in this respect.
The results also indicate a large variety of sources from which renewable energy is obtained in the EU countries. This is due to the geographical location of these countries, their financial capabilities, traditions as well as economic potential and social awareness. Especially in this area, there are great opportunities for cooperation and exchange of experience between individual countries, which should result in a more complete and effective use of individual renewable energy sources.
6. Conclusions and Policy Implications
In the context of the negative events observed for several due to climate change, further global economic growth, which is based on the use of fossil fuels and thus the increasing pollution of the natural environment, is unreal and impossible to maintain. Forecasts regarding the state of the natural environment for the coming years point to the need to introduce very strong and rapid changes to improve this situation. The concept of “The European Green Deal” meets these challenges and is undoubtedly a very ambitious plan to provide Europe, as the first continent, with the so-called climate neutrality in 2050. However, this goal requires huge financial outlays, organizational and economic changes in most EU countries, including social acceptance of the introduced changes in individual countries.
It is undisputable that this concept is a great opportunity for economic development of the EU and allows for the achievement of climate advantage over the rest of the continents. However, to reach the “zero emission” of the European economy in 2050, enormous investments and legislative changes will be necessary. In particular, this applies to countries where the energy sector is based on conventional raw materials. It will not be easy to conduct energy transition in these countries, as it will require large financial resources and social acceptance. An undoubted chance for the effective implementation of this idea and achievement of the assumed goal is the Just Transition Fund, which is to finance the costs of necessary changes.
It should also be noted that the EU is responsible only for around 10% of global emissions of GHG and harmful substances [90,91]. It can therefore be assumed that the success of the Green Deal concept will be proof that zero-emission economy is possible. This, in turn, should encourage other countries and continents to introduce similar solutions. With the current state of public awareness and the widespread phenomena of negative climate change, the improvement of the state of the environment, and hence the climate should become an absolute priority for the entire modern world.
In order to effectively direct the necessary changes related to improving the quality of the natural environment in Europe, it is reasonable to conduct research to broaden the knowledge of the current state of European energy, with special emphasis on renewable energy. It is certain that energy produced from RES is definitely more ecological and constitutes a real alternative to production from conventional sources. The current state of the art and developed technologies also enable its wider and more effective application. Nevertheless, this process is very expensive and requires a consistent, thoughtful and comprehensive policy.
Both the research and results presented in this paper are to support this process and broaden the knowledge of the structure of renewable energy production in the EU countries. The new approach to energy production analysis presented in this paper, which takes into account the economic, demographic and geographical potentials of individual countries, has enabled the acquisition of new knowledge in this area. It was also important to show the diversity of these countries.
It seems insufficient to rely only on the analysis of the absolute volumes of energy production from RES, especially in view of the need to develop a new climate policy for economically diverse EU countries. The multi-criteria division of the EU countries into similar groups presented in the paper creates an opportunity to develop effective solutions dedicated to individual groups. It should also encourage close cooperation between the countries in these groups. Exchange of experience and joint resolution of similar problems should improve the effectiveness of introduced changes and ensure energy safety of these countries
In addition, a common social policy is also very important in this respect. In countries with similar problems, it will be much easier to implement even not very popular actions, for example, those associated with closing mines and limiting energy production from coal. For similar groups of countries presented in this article, financial resources should also be dedicated and distributed (e.g., from the Just Transition Fund).
The question remains whether countries with the highest absolute amount of energy produced from RES fully use their economic and demographic potentials and whether this production is related to the size of these countries. The conducted research and the obtained results indicate that the potentials of these countries (the richest in Europe) are not fully used to improve the quality of the climate. However, in order to achieve the goals of “The European Green Deal”, all EU countries must jointly implement its assumptions.
The use of taxonomic methods to analyze the structure and volume of energy production from RES in individual countries in relation to the new criteria that take into account the specificity of these countries fulfilled its task. The results undoubtedly support the assessment of the current state of renewable energy in the EU and are a source of new knowledge that can be used to improve the state of the environment.
It should also be emphasized that the presented work is one of the first paper relating to the idea of “The European Green Deal” presented in December 2019. The authors hope that it will start a broad discussion on this idea and will make an important contribution to the development and implementation of an effective EU climate policy.
Author Contributions
Conceptualization, M.T and J.B.; methodology, J.B. and M.T.; software, M.T.; and J.B.; formal analysis, J.B. and M.T.; investigation, J.B. and M.T.; resources, J.B. and M.T.; data curation, J.B. and M.T.; writing of the original draft preparation, J.B. and M.T.; writing of review and editing, J.B. and M.T.; visualization, M.T.; supervision, M.T and J.B.; project administration, M.T and J.B.; funding acquisition, J.B. All authors have read and agreed to the published version of the manuscript.
Funding
This article was prepared within the statutory research performed at Silesian University of Technology, Department of Production Engineering, Faculty of Organization and Management (13/030/BK-20/0059).
Conflicts of Interest
The authors declare no conflicts of interest.
References
- Kanagawa, M.; Nakata, T. Assessment of access to electricity and the socio-economic impacts in rural areas of developing countries. Energy Policy 2008, 36, 2016–2029. [Google Scholar] [CrossRef]
- Tutak, M.; Brodny, J. Degree of Use of Alternative Sources for Energy Production for the Economical Aims in EU Countries. In Proceedings of the 17th International Multidisciplinary Scientific GeoConference SGEM 2017, Vienna, Austria, 27–29 November 2017; pp. 635–642. [Google Scholar] [CrossRef]
- Stecuła, K.; Brodny, J. Renewable Energy Sources as an Opportunity for Global Economic Development. In Proceedings of the 17th International Multidisciplinary Scientific GeoConference SGEM 2017, Vienna, Austria, 27–29 November 2017; pp. 749–756. [Google Scholar] [CrossRef]
- Karekezi, S.; Kimani, J. Have power sector reforms increased access to electricity among the poor in East Africa? Energy Sustain. Dev. 2004, 8, 10–25. [Google Scholar] [CrossRef]
- Nouni, M.; Mullick, S.; Kandpal, T. Providing electricity access to remote areas in India: Niche areas for decentralized electricity supply. Renew. Sustain. Energy Rev. 2008, 34, 430–434. [Google Scholar] [CrossRef]
- Oseni, M. Household’s access to electricity and energy consumption pattern in Nigeria. Renew. Sustain. Energy Rev. 2012, 16, 990–995. [Google Scholar] [CrossRef]
- Slough, T.; Urpelainen, J.; Yang, J. Light for all? Evaluating Brazil’s rural electrification progress. Energy Policy 2015, 86, 315–332. [Google Scholar] [CrossRef]
- Gerbaulet, C.; Hirschhausen von, C.; Kemfert, C.; Lorenz, C.; Oei, P.-Y. European electricity sector decarbonization under different levels of foresight. Renew. Energy 2019, 141, 973–987. [Google Scholar] [CrossRef]
- International Energy Agency (IEA). Available online: http://www.iea.org/publications/freepublications/publication/CO2EmissionsFromFuelCombustionHighlights2014.pdf (accessed on 10 January 2020).
- Azmi, S.Z.; Latif, M.T.; Ismail, A.S.; Juneng, L.; Jemain, A.A. Trend and status of air quality at three different monitoring stations in the Klang Valley, Malaysia. Air Qual. Atmos. Health 2010, 3, 53–64. [Google Scholar] [CrossRef]
- Wu, X.; Zang, S.; Ma, D.; Ren, J.; Chen, Q.; Dong, X. Emissions of CO2, CH4, and N2O Fluxes from Forest Soil in Permafrost Region of Daxing’an Mountains, Northeast China. Int. J. Environ. Res. Public Health 2019, 16, 2999. [Google Scholar] [CrossRef]
- Ahmadov, A.K.; Borg, C. Do natural resources impede renewable energy production in the EU? A mixed-methods analysis. Energy Policy 2019, 126, 361–369. [Google Scholar] [CrossRef]
- Brodny, J.; Tutak, M. Analysis of Gases Emitted into the Atmosphere during an Endogenous Fire. In Proceedings of the 16th International Multidisciplinary Scientific GeoConference SGEM, Vienna, Austria, 2–5 November 2016; pp. 75–82. [Google Scholar] [CrossRef]
- Brodny, J.; Tutak, M. Analysis of Methane Emission into the Atmosphere as a Result of Mining Activity. In Proceedings of the 16th International Multidisciplinary Scientific GeoConference SGEM, Vienna, Austria, 2–5 November 2016; pp. 83–90. [Google Scholar] [CrossRef]
- Mavi, N.K.; Mavi, R.K. Energy and environmental efficiency of OECD countries in the context of the circular economy: Common weight analysis for malmquist productivity index. J. Environ. Manag. 2019, 247, 651–661. [Google Scholar] [CrossRef]
- Schoden, F.; Siebert, A.; Keskin, A.; Herzig, K.; Straus, M.; Schwenzfeier-Hellkamp, E. Building a Wind Power Plant from Scrap and Raising Public Awareness for Renewable Energy Technology in a Circular Economy. Sustainability 2020, 12, 90. [Google Scholar] [CrossRef]
- Kutscher, C.F.; Milford, J.B.; Kreith, F. Principles of Sustainable Energy Systems, 3rd ed.; Mechanical and Aerospace Engineering Series; CRC Press: Boca Raton, FL, USA, 2018. [Google Scholar]
- UNFCCC. Kyoto Protocol Reference Manual on Accounting of Emissions and Assigned Amount United Nations Framework Convention on Climate Change. 2008. Available online: http://unfccc.int/kyoto_protocol/items/3145.php (accessed on 10 January 2020).
- Álvarez, R.; Zubelzu, S.; Díaz, G.; López, A. Analysis of low carbon super credit policy efficiency in European Union greenhouse gas emissions. Energy 2015, 82, 996–1010. [Google Scholar] [CrossRef]
- European Commission. Available online: https://ec.europa.eu/clima/policies/strategies_en (accessed on 10 January 2020).
- European Commission. Available online: https://ec.europa.eu/clima/policies/strategies/2050_en (accessed on 10 January 2020).
- COP25 Summary Report. Available online: https://www.ieta.org/resources/Documents/IETA-COP25-Report_2019.pdf (accessed on 10 January 2020).
- European Commission. Available online: https://ec.europa.eu/info/strategy/priorities-2019-2024/european-green-deal_en (accessed on 10 January 2020).
- COP24 Summary Report. Available online: https://www.ieta.org/resources/COP24/COP24SummaryReport_2018.pdf (accessed on 10 January 2020).
- European Commission. Available online: https://ec.europa.eu/regional_policy/en/newsroom/news/2020/01/14-01-2020-financing-the-green-transition-the-european-green-deal-investment-plan-and-just-transition-mechanism (accessed on 10 January 2020).
- Halushchak, M.; Bun, R.; Shpak, N.; Valakh, M. Modelling and spatial analysis of greenhouse gas emissions from fuel combustion in the industry sector in Poland. ECONTECHMOD Int. Q. J. Econ. Technol. Model. Process. 2016, 5, 19–26. [Google Scholar]
- Kolasa-Wiecek, A. Stepwise multiple regression method of greenhouse gas emission modeling in the energy sector in Poland. J. Environ. Sci. 2015, 30, 47–54. [Google Scholar] [CrossRef] [PubMed]
- Lozano, S.; Gutiérrez, E. Non-parametric frontier approach to modelling the relationships among population, GDP, energy consumption and CO2 emissions. Ecol. Econ. 2008, 66, 687–699. [Google Scholar]
- Brodny, J.; Tutak, M. Analysis of the diversity in emissions of selected gaseous and particulate pollutants in the European Union countries. J. Environ. Manag. 2019, 231, 582–595. [Google Scholar] [CrossRef]
- Brodny, J.; Tutak, M. Exposure to Harmful Dusts on Fully Powered Longwall Coal Mines in Poland. Int. J. Environ. Res. Public Health 2018, 15, 1846. [Google Scholar] [CrossRef]
- Boeters, S.; Koornneef, J. Supply of renewable energy sources and the cost of EU climate policy. Energy Econ. 2011, 33, 1024–1034. [Google Scholar] [CrossRef]
- Shivakumar, A.; Dobbins, A.; Fahl, A.; Singh, A. Drivers of renewable energy deployment in the EU: An analysis of past trends and projections. Energy Strategy Rev. 2019, 26, 100402. [Google Scholar] [CrossRef]
- Swain, R.B.; Karimu, A. Renewable electricity and sustainable development goals in the EU. World Dev. 2020, 125, 104693. [Google Scholar] [CrossRef]
- European Commission. Available online: https://ec.europa.eu/info/sites/info/files/european-green-deal-communication_en.pdf (accessed on 10 January 2020).
- Eurostat. Available online: http://www.europarl.europa.eu/factsheets/en/sheet/70/energia-ze-zrodel-odnawialnych (accessed on 10 January 2020).
- Eurostat. Available online: https://ec.europa.eu/eurostat/statistics-explained/index.php?title=Renewable_energy_statistics (accessed on 10 January 2020).
- Eurostat. Available online: http://appsso.eurostat.ec.europa.eu/nui/submitViewTableAction.do (accessed on 10 January 2020).
- Dunjic, S.; Pezzutto, S.; Zubaryeva, A. Renewable energy development trends in the Western Balkans. Renew. Sustain. Energy Rev. 2016, 65, 1026–1032. [Google Scholar] [CrossRef]
- Bointner, R.; Pezzutto, S.; Grilli, G.; Sparber, W. Financing Innovations for the Renewable Energy Transition in Europe. Energies 2016, 9, 990. [Google Scholar] [CrossRef]
- Bointner, R.; Pezzutto, S.; Sparber, W. Scenarios of public energy research and development expenditures: Financing energy innovation in Europe. WIREs Energy Environ. 2016, 5, 470–488. [Google Scholar] [CrossRef]
- Pezzutto, S.; Mosannenzadeh, F.; Grilli, G.; Sparber, W. European Union Research and Development Funding on Smart Cities and Their Importance on Climate and Energy Goals. In Smart and Sustainable Planning for Cities and Regions: SSPCR 2015; Green Energy and Technology; Bisello, A., Vettorato, D., Stephens, R., Elisei, P., Eds.; Springer: Cham, Switzerland, 2017. [Google Scholar]
- Bamati, N.; Raoofi, A. Development level and the impact of technological factor on renewable energy production. Renew. Energy 2019, in press. [Google Scholar] [CrossRef]
- Li, C.; Wang, N.; Zhang, H.; Liu, Q.; Chai, Y.; Shen, X.; Yang, Z.; Yang, Y. Environmental Impact Evaluation of Distributed Renewable Energy System Based on Life Cycle Assessment and Fuzzy Rough Sets. Energies 2019, 12, 4214. [Google Scholar] [CrossRef]
- Przychodzen, W.; Przychodzen, J. Determinants of renewable energy production in transition economies: A panel data approach. Energy 2020, 191, 116583. [Google Scholar] [CrossRef]
- Azarova, V.; Cohen, J.; Friedl, C.; Reichl, J. Designing local renewable energy communities to increase social acceptance: Evidence from a choice experiment in Austria, Germany, Italy, and Switzerland. Energy Policy 2019, 132, 1176–1183. [Google Scholar] [CrossRef]
- Bórawski, P.; Bełdycka-Bórawska, A.; Szymańska, E.J.; Jankowski, K.J.; Dubis, B.; Dunn, J.W. Development of renewable energy sources market and biofuels in the European Union. J. Clean. Prod. 2019, 228, 467–484. [Google Scholar] [CrossRef]
- Grigoras, G.; Scarlatache, F. An assessment of the renewable energy potential using a clustering based data mining method. Case study in Romania. Energy 2015, 81, 416–429. [Google Scholar] [CrossRef]
- Papież, M.; Śmiech, S.; Frodyma, K. Determinants of renewable energy development in the EU countries. A 20-year perspective. Renew. Sustain. Energy Rev. 2018, 91, 918–934. [Google Scholar]
- Šúri, M.; Huld, T.A.; Dunlop, E.D.; Ossenbrink, H.A. Potential of solar electricity generation in the European Union member states and candidate countries. Sol. Energy 2007, 81, 1295–1305. [Google Scholar] [CrossRef]
- Bonnet, C.; Hache, E.; Seck, G.S.; Simoën, M.; Carcanague, S. Who’s winning the low-carbon innovation race? An assessment of countries’ leadership in renewable energy technologies. Int. Econ. 2019, 160, 31–42. [Google Scholar] [CrossRef]
- McGee, J.A.; Greiner, P.T. Renewable energy injustice: The socio-environmental implications of renewable energy consumption. Energy Res. Soc. Sci. 2019, 56, 101214. [Google Scholar] [CrossRef]
- Ogbonnaya, C.; Abeykoon, C.; Damo, U.M.; Turan, A. The current and emerging renewable energy technologies for power generation in nigeria: A review. Therm. Sci. Eng. Prog. 2019, 13, 100390. [Google Scholar] [CrossRef]
- Marques, A.C.; Fuinhas, J.A.; Pires Manso, J.R. Motivations driving renewable energy in European countries: A panel data approach. Energy Policy 2010, 38, 6877–6885. [Google Scholar] [CrossRef]
- Marques, A.C.; Fuinhas, J.A. Are public policies towards renewables successful? Evidence from European countries. Renew. Energy 2012, 44, 109–118. [Google Scholar] [CrossRef]
- Wierling, A.; Schwanitz, V.J.; Zeiß, J.P.; Bout, C.; Candelise, C.; Gilcrease, W.; Gregg, J.S. Statistical Evidence on the Role of Energy Cooperatives for the Energy Transition in European Countries. Sustainability 2018, 10, 3339. [Google Scholar] [CrossRef]
- Ntanos, S.; Skordoulis, M.; Kyriakopoulos, G.; Arabatzis, G.; Chalikias, M.; Galatsidas, S.; Batzios, A.; Katsarou, A. Renewable Energy and Economic Growth: Evidence from European Countries. Sustainability 2018, 10, 2626. [Google Scholar] [CrossRef]
- Koçak, E.; Şarkgüneşi, A. The renewable energy and economic growth nexus in Black Sea and Balkan countries. Energy Policy 2017, 100, 51–57. [Google Scholar] [CrossRef]
- Lucas, J.N.V.; Francés, G.E.; González, E.S.M. Energy security and renewable energy deployment in the EU: Liaisons Dangereuses or Virtuous Circle? Renew. Sustain. Energy Rev. 2016, 62, 1032–1046. [Google Scholar] [CrossRef]
- Carfora, A.; Pansini, R.V.; Romano, A.A.; Scandurra, G. Renewable energy development and green public policies complementarities: The case of developed and developing countries. Renew. Energy 2018, 115, 741–749. [Google Scholar] [CrossRef]
- Kim, J.; Park, K. Financial development and deployment of renewable energy technologies. Energy Econ. 2016, 59, 238–250. [Google Scholar] [CrossRef]
- Bel, G.; Joseph, S. Policy stringency under the European Union Emission trading system and its impact on technological change in the energy sector. Energy Policy 2018, 117, 434–444. [Google Scholar] [CrossRef]
- European Parliament. Available online: https://www.europarl.europa.eu/factsheets/en/sheet/68/energy-policy-general-principles (accessed on 10 January 2020).
- García-Álvarez, M.T.; Cabeza-García, L.; Soares, I. Assessment of energy policies to promote photovoltaic generation in the European Union. Energy 2018, 151, 864–874. [Google Scholar] [CrossRef]
- Scarlat, N.; Dallemand, J.F.; Monforti-Ferrario, F.; Banja, B.; Motola, V. Renewable energy policy framework and bioenergy contribution in the European Union—An overview from National Renewable Energy Action Plans and Progress Reports. Renew. Sustain. Energy Rev. 2015, 51, 969–985. [Google Scholar] [CrossRef]
- Stecuła, K.; Brodny, J. Perspectives on renewable energy development as alternative to conventional energy in Poland. In Proceedings of the 17th International Multidisciplinary Scientific GeoConference SGEM 2017, Vienna, Austria, 27–29 November 2017; Volume 17, pp. 717–724. [Google Scholar] [CrossRef]
- Palka, D.; Brodny, J. The impact of the adaptation of conventional energy to the require-ments of the new EU emission standards for energy costs and the state of the environ-ment in Poland. In Proceedings of the 17th International Multidisciplinary Scientific GeoConference SGEM 2017, Vienna, Austria, 27–29 November 2017; Volume 17, pp. 805–812. [Google Scholar] [CrossRef]
- European Commission. Available online: https://ec.europa.eu/energy/en/topics/renewable-energy/national-renewable-energy-action-plans-2020 (accessed on 23 January 2020).
- Agora Energiewende. 12 Insights on Germany’s Energiewende; Agora Energiewende: Berlin, Germany, 2013. [Google Scholar]
- Rogge, K.S.; Johnstone, P. Exploring the role of phase-out policies for low-carbon energy transitions: The case of the German Energiewende. Energy Res. Soc. Sci. 2017, 33, 128–137. [Google Scholar] [CrossRef]
- Strunz, S. The German energy transition as a regime shift. Ecol. Econ. 2014, 100, 150–158. [Google Scholar] [CrossRef]
- Matthes, F.C. Energy transition in Germany: A case study on a policy-driven structural change of the energy system. Evol. Inst. Econ. Rev. 2017, 14, 141–169. [Google Scholar] [CrossRef]
- Lund, H. The implementation of renewable energy systems. Lessons learned from the Danish case. Energy 2010, 35, 4003–4009. [Google Scholar] [CrossRef]
- NOIZZ. Available online: https://noizz.pl/ekologia/dania-po-raz-pierwszy-w-historii-zaspokoila-100-procent-swoich-potrzeb-energia/qcqdglz (accessed on 10 January 2020).
- Swedish Energy Agency. Energy in Sweden. 2017. Available online: https://www.google.com/url?sa=t&rct=j&q=&esrc=s&source=web&cd=5&ved=2ahUKEwj-wa_3qZrnAhUy_CoKHW2eATsQFjAEegQIAxAB&url=https%3A%2F%2Fenergimyndigheten.a-w2m.se%2FFolderContents.mvc%2FDownload%3FResourceId%3D104743&usg=AOvVaw0bRU60IlT6cfUXzMzbtWvO (accessed on 23 January 2020).
- Hebda, W. Energy strategy of the Republic of Bulgaria until the year 2020. Polityka Energetyczna 2015, 18, 111–128. [Google Scholar]
- Directive 2009/28/EC of the European Parliament and of the Council. Available online: https://eur-lex.europa.eu/legal-content/EN/TXT/HTML/?uri=CELEX:32009L0028&from=EN (accessed on 23 January 2020).
- Eurostat. Available online: https://ec.europa.eu/eurostat/statistics-explained/index.php?title=Renewable_energy_statistics/pl#Najwi.C4.99kszy_udzia.C5.82_energii_ze_.C5.BAr.C3.B3de.C5.82_odnawialnych_odnotowano_na_.C5.81otwie_i_w_Szwecji (accessed on 23 January 2020).
- Mardia, K.V.; Kent, J.T.; Bibby, J.M. Multivariate Analysis. Probability and Mathematical Statistics; Academic Press: London, UK, 1979. [Google Scholar]
- Wind Europe. Available online: https://windeurope.org/wp-content/uploads/files/about-wind/statistics/WindEurope-Annual-Statistics-2017.pdf (accessed on 10 January 2020).
- European Wind Energy Association. Available online: https://www.ewea.org/fileadmin/files/library/publications/scenarios/EWEA-Wind-energy-scenarios-2020.pdf (accessed on 10 January 2020).
- Global Status Report. Available online: https://www.ren21.net/wp-content/uploads/2019/08/Full-Report-2018.pdf (accessed on 10 January 2020).
- Asociacion Empresarial Eolica (AEE). Red Eléctrica de España. Available online: https://www.aeeolica.org/ (accessed on 10 January 2020).
- Wind Europe. Available online: https://windeurope.org/wp-content/uploads/files/about-wind/statistics/WindEurope-Annual-Statistics-2018.pdf (accessed on 10 January 2020).
- The International Renewable Energy Agency. Available online: https://www.irena.org/-/media/Files/IRENA/Agency/Publication/2016/IRENA_Measuring-the-Economics_2016.pdf (accessed on 10 January 2020).
- Bürgin, A. National binding renewable energy targets for 2020, but not for 2030 anymore. J. Eur. Public Policy 2015, 22, 690–707. [Google Scholar] [CrossRef]
- European Commission. Available online: https://ec.europa.eu/eu2020/pdf/COMPLET%20EN%20BARROSO%20%20%20007%20-%20Europe%202020%20-%20EN%20version.pdf (accessed on 10 January 2020).
- Connolly, D. Heat Roadmap Europe: Quantitative comparison between the electricity, heating, and cooling sectors for different European countries. Energy 2017, 193, 580–593. [Google Scholar] [CrossRef]
- Pezzutto, S.; Fazeli, R.; De Felice, M.; Sparber, W. Future development of the air-conditioning market in Europe: An outlook until 2020. Wiley Interdisciplin. Rev. Energy Environ. 2016, 5, 649–669. [Google Scholar]
- Pezzutto, S.; Croce, S.; Zambotti, S.; Kranzl, L.; Novelli, A.; Zambelli, P. Assessment of the Space Heating and Domestic Hot Water Market in Europe—Open Data and Results. Energies 2019, 12, 1760. [Google Scholar] [CrossRef]
- Euronews. Available online: https://www.euronews.com/2019/12/05/eu-still-among-top-3-world-co2-emitters-new-data-shows (accessed on 10 January 2020).
- Pani, R.; Mukhopadhyay, U. Management accounting approach to analyse energy related CO2 emission: A variance analysis study of top 10 emitters of the world. Energy Policy 2013, 52, 639–655. [Google Scholar] [CrossRef]
© 2020 by the authors. Licensee MDPI, Basel, Switzerland. This article is an open access article distributed under the terms and conditions of the Creative Commons Attribution (CC BY) license (http://creativecommons.org/licenses/by/4.0/).