Article

Condition Assessment of HV Bushings with Solid Insulation based on the SVM and the FDS Methods †

Faculty of Electrical Engineering, Department of Electrotechnology and Diagnostics, West Pomeranian University of Technology, Sikorskiego 37, 70–313 Szczecin, Poland
*
Author to whom correspondence should be addressed.
This paper is an extended version of our paper published in 2018 IEEE Innovative Materials and Technologies in Electrical Engineering (i-MITEL), 18–20 April 2018.
Energies 2020, 13(4), 853; https://doi.org/10.3390/en13040853
Submission received: 23 December 2019 / Revised: 11 February 2020 / Accepted: 14 February 2020 / Published: 15 February 2020
(This article belongs to the Section F: Electrical Engineering)

Abstract

:
This paper presents the dielectric response of the insulation of bushings as an effect of the simulated long-term aging process. The experiment was conducted under a condition of a high temperature difference between the current circuit and the cover. The dielectric response was measured with the FDS (Frequency Dielectric Spectroscopy) and the SVM (Step Voltage Measurement) methods. The research has shown the correlation between the aging time and some parameters obtained with the FDS and SVM analysis.

1. Introduction

Transformer bushings belong to the basic equipment of each high voltage power transformer. They serve as the elements providing the passage of power cables through the barrier which consists of a transformer tank. Transformers, like bushings, are designed for around 30 years of operation. However, as the operating practice shows, they are very often the cause of failure. The policy of the distribution companies is aimed at lengthening the transformers operating time above the designed lifetime i.e., 30 years what results in arising the situations in which there is big a group of transformers with factory-installed transformer bushings [1,2]. In spite of positive results of the measurements of the dielectric loss factor tgδ measured in mains frequency the bushings installed in such units have the signs of beginnings of the aging processes which are noticeable in the low frequency range 0.01–0.001 Hz. Such ageing processes are unnoticeable for the standard methods what may cause misdiagnosis in the technical condition of the insulators and, as a result, it may lead to disastrous consequences such as explosions. The statistics, which present that from 12 to 40% of the catastrophic failures of the power transformers resulted from bushing malfunctions, can be found in the literature [3,4,5,6]. Due to inefficiency of tg50Hz there is the need to search for new measurement solutions that increase predictability of defects in HV (high voltage) bushings insulation [6,7]. According to the authors such methods may be the FDS and the SVM method since they can contribute to detect accelerated aging in the early stage of their development. The new use of the SVM method applied mainly in HV motor insulation diagnostics, according to the authors, allows for diagnostics of the most exposed to aging layers and such possibility results from a different distribution of the electric field constant in relation to the alternating field [8]. Due to that issue, the constant field mainly breaks down at the stem, i.e., those most exposed to aging.
The main insulation of HV transformer bushings constructed using RBP (Resin-Bonded Paper) or RIP (Resin Impregnated Paper) technology is a resinous composite in which the polymer matrix consists of epoxy resin and the reinforcement rod is an electrotechnical paper foil and the aluminum screen. The morphological construction of such structures can be classified according to the group of layered composites with a mixed structure which are characterized by, among others, isotropic electrical and mechanical properties [9,10].
The aging processes in such composites are caused by the superposition of the action of the electric field, temperature and mechanical stress [11]. However, for a high concentration of factors, the synergy effect accelerates the process of composite degradation.
The action of the electric field can be presented in the following equation:
L E = L 0 ( E / E 0 ) n
where
  • LE—the “lifetime” for the electric field strength E,
  • L0—the “lifetime” for the electric field strength E0,
  • n—the coefficient of the voltage durability (VEC).
The physical nature of the electric aging is hardly recognized. However, it is generally believed that the process is dominated by partial discharges and injections of electrons from electrodes. The presence of the electric field has no direct impact on the kinetics of the aging process. The value of the coefficient “n” is usually determined based on long-term experimental processes.
The impact of the thermal exposure on the composite destruction process is shown in the following equation:
L T = L 0 exp ( BT 1 T 0 T )
where
  • T0—the reference temperature,
  • LT—the lifetime for the temperature T,
  • B—the coefficient associated with the activation energy of the major chemical reactions.
The impact of the mechanical stress can be described as in the following equation:
L M = L 0 ( M / M 0 ) m
where
  • M—the coefficient of mechanical durability (MEC),
  • L0, M0 correspond to Equation (1).
The action of these factors in the initial stage of the aging processes primarily causes the occurrence of microdefects in the composite structure. Considering the physical nature of the occurrence of defects, Kimura put forward the phenomenological model of their formation (Figure 1) [12].
The practical experience of the authors has shown that, in most cases, the total destruction of composite occurs as a result of the electrical breakdown but not as a result of mechanical damage. This is probably due to the changes of the interface structure of the “polymer–filler matrix”. In the initial stage of the aging process, this determines the kinetics of the physical and chemical processes. Therefore, the good adhesion and mutual wettability of the resin and the filler determine the durability of the insulation.
The strength of the adhesion between the polymer matrix and the reinforcement depends on the type of the chemical bonds and the post-production mechanical stress as well as the existing electrostatic and mechanical friction forces between the elements. The phenomenological model of the matrix–filler interphase has been described by Theocaris I Varias (Figure 2) [13].
The essential part of this is the transition zone which significantly influences such properties of the entire composite as its dielectric and mechanical relaxation mechanisms and electrical conductivity in the field of low electric fields and temperature.
In the initial stage of the aging of the RBP and the RIP composites, major changes in the phase boundary morphology occur in the transition layer. This results in the loss of adhesion and the occurrence of free spaces in the form of micro gas inclusions and composite delimitation. As a result, there is an occurrence at the phase boundary from which is formed, among other factors, a Maxwell–Wagner space charge which can significantly alter the local electric field strength and may cause the generation of partial discharges even under the nominal operating conditions of the insulation.
In off-line RIP insulation tests, the presence of Maxwell–Wagner charge as well as inclusion and delamination can be identified, among others, using the spectroscopic measurements of dielectric relaxation. In the frequency domain, the most frequently used method is FDS (Frequency Dielectric Spectroscopy) method, in which changes in the dielectric loss factor tgδ in a wide frequency range of 10−4–103 Hz are noticed (Figure 3).
The presence of inclusions or delamination results in the creation of a spatial charge in which the relaxation time constant is usually in the range of 1–100 s, on tg = f(f), which characteristically corresponds to the frequency range of 10–3–10Hz. In this range, a large increase in the coefficient tgδ is observed, and the frequency in which its value is maximum is defined as the resonance frequency corresponding to the value of the relaxation time constant (Figure 3, curve 2). Similar changes in the aged RIP insulation can be observed in the rage above 100 Hz. These are associated with the dipole relaxation of low-molecular-weight products of the resin and filler. Similarly, in the Cole–Cole diagram ε” = f(ε’), the frequency at which the value ε” is at maximum corresponds to the relaxation time constant. In the operating measurements, often instead of a thorough analysis of the relationship tgδ = f(f), a faster determination of the range of changes in the value of the time constant is applied using the relationship ε” = f(ε’).
In this domain, however, the PDC (Polarization–Depolarization Current) method or the SVM (Step Voltage Measurement) method can be used. The latter consists of measuring the change of the charging current over time under the conditions of a step increase in the measuring voltage to the value Umeas = 1.5∙U0. It is mainly used to test HV motor insulation, and the measurement conditions and the interpretation of the results are included in the IEEE number 4, 1978 standard (“Standard Techniques for High-Voltage Testing”), standard number 43, November 1974 (“Recommended Practice for Testing Insulation Resistance of Rotating Machinery”), and in [14]. The method of calculating the absorption coefficient Ka defined in these standards is
Ka = i 30 M i 30 C
where i30M and i30C are, respectively, the measured and calculated leakage currents after 30 min of the SVM test.
The absorption coefficient Ka for the new insulation based on epoxy resins should be less than 2, while in the case of degraded insulation, its value should be 5–7. In this manuscript, the authors assumed that the morphology of the RIP composite is very similar to the structure of the vacuum pressure impregnation used in the insulation of HV engines.
Therefore, the manuscript adopts the methodology for measuring SVM and assessing the condition of the insulation in accordance with the above-mentioned standards. A detailed description of the FDS and the SVM methods is provided later in the manuscript.

2. Test Subject and Research Methodology

The subjects of the laboratory tests were two transformer bushings: an RIP type, Micafil CTKF 145 kV, and an RBP type, Haefely CRPT 52 kV (Figure 4), which were retired from service after around 10 years of operation. The heat sources were installed inside the bushings to simulate the most unfavorable conditions during the actual operation (Figure 4c). The temperature inside the current path and the adjacent layers was T = 130 °C, which is likely during the summer period for tgδ50Hz ≈ 1.5% due to the thermal model analysis [15]. The temperature was controlled by the use of a Czaki-type temperature controller.
The SVM tests were performed directly after the deinstallation of bushings and after 140, 340 and 740 h of aging. The instrument used for measurements was an MI 3200 Metrel Theraohm at a voltage of 10 kV and measurement accuracy current of 5% ± 0.5 nA in the full measurement range. The voltage levels and the respective time sequences used in this procedure are presented in Table 1. The combined test time was 30 min, and after its conclusion, the Ka coefficient was calculated.
The absorption coefficient was also appointed for the other RIP type CTF 245 kV bushings, which were retired from service after the long-term operation period. In order to verify the SVM method results, the dielectric dissipation factor tgδ was measured in a wide frequency spectrum (FDS method). The FDS method was performed using the meter Dirana, from the company Omicron, in the frequency range 10−3 to 5 kHz at a voltage of 200 V; the measurement accuracy tgδ for 1 mHz < f < 100 Hz was 1% + 3 × 10⁻⁴, while for 1 mHz < f 100 Hz, this value was 2% + 5 × 10⁻⁴. In measurements, the tree electrode method was used. An internal inspection of the inner insulation of the selected bushing was also performed by creating a few cross-sections of the core. Advanced insulation aging in the form of visible discoloration was observed in the layers located close to the conduction, and compounds of carbon insulation degradation were detected.

3. Results

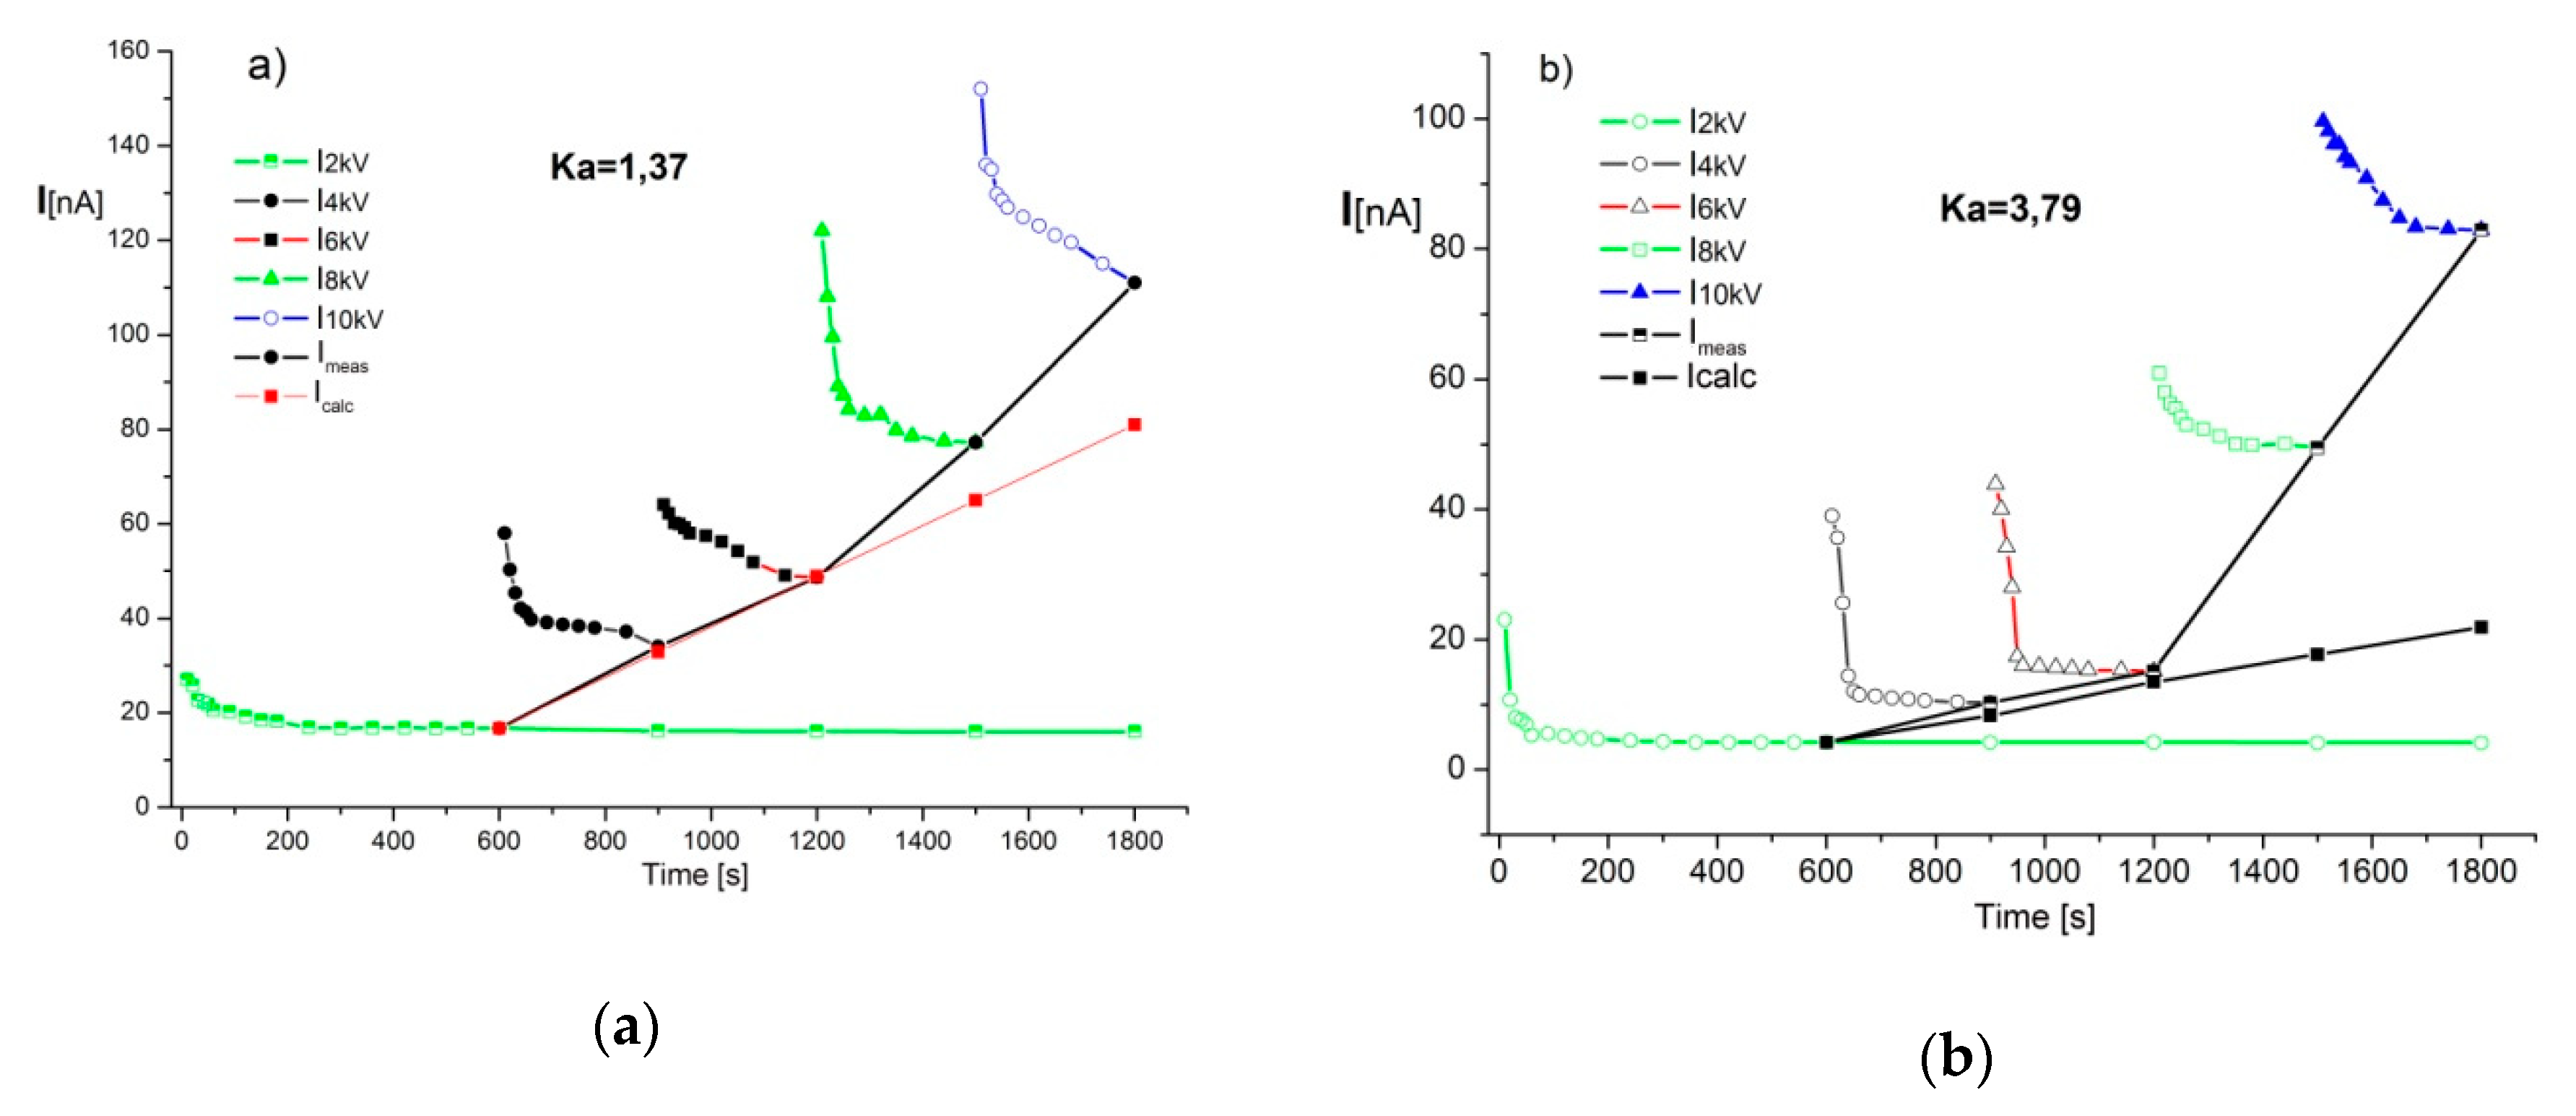
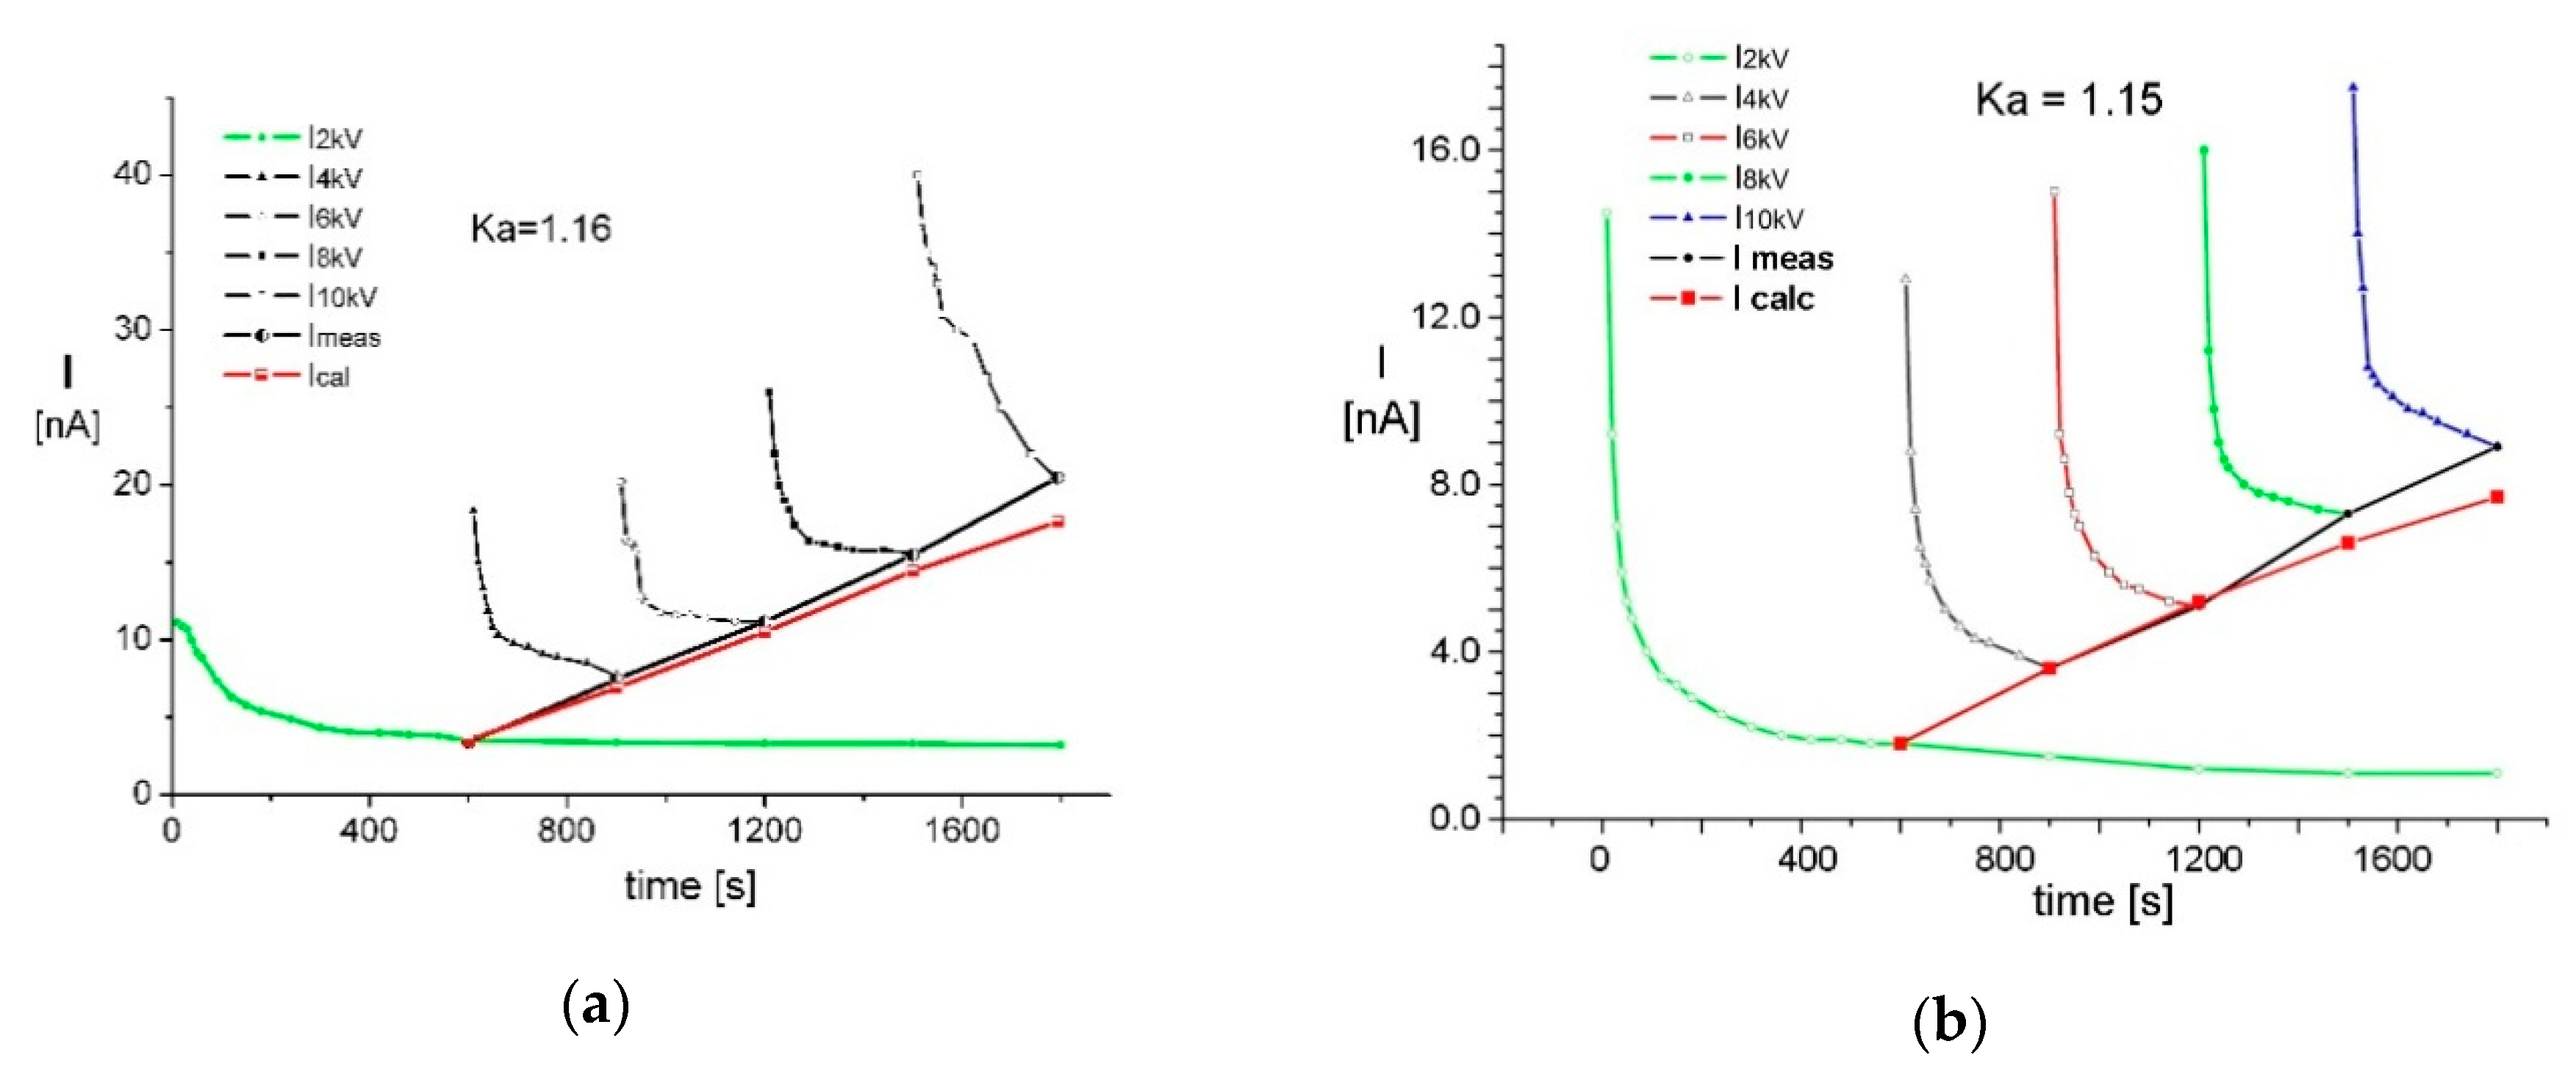
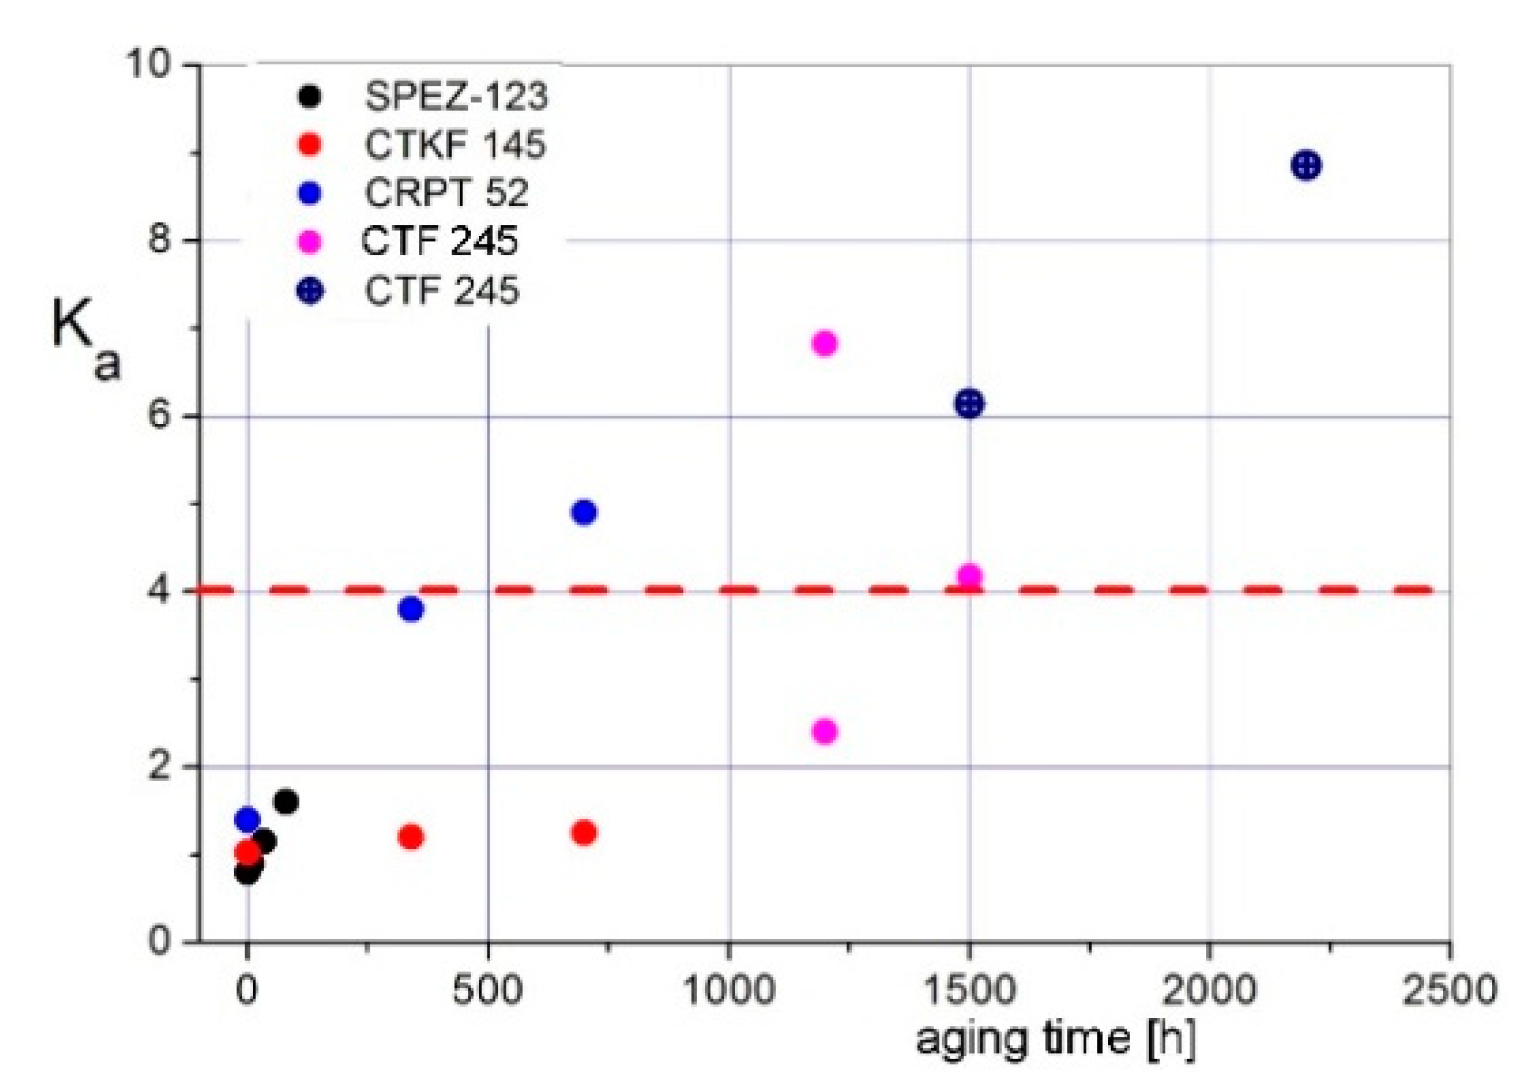
3.1. Impact of Thermal Aging on SVM Test Results of the Insulation of Bushings

Figure 5 shows the effects of thermal aging on the SVM measurement results for the RBP insulated type CRPT 52 kV bushing [16]. After 10 years of operation, the absorption coefficient value was Ka = 1.37 (Figure 5a), which suggests a good overall condition without advanced aging processes. After 340 and 740 h of aging, a significant increase in the leakage current was observed for the step voltages of 8 and 10 kV. As a result, the calculated absorption coefficient values were Ka = 3.79 (Figure 5b) and Ka = 4.9 (Figure 5c), respectively. These results may be considered to be a result of the ongoing aging process, which leads to the presence of the products of the thermal decomposition.
Different results were obtained for the RIP type CTKF 145 kV bushing (Figure 6). It was observed that, during an additional thermal aging of 740 h, the value of the leakage current decreased in each of the voltage steps. The authors believe that this is a consequence of the so-called additive process and physical relaxation of the composite, which has been validated with the dielectric response measurements in the frequency domain (FDS) [15]. Simultaneously, no changes in the value of the absorption coefficient were noted (Figure 6), suggesting no significant aging changes in the composite structure.
Considering the much higher thermal endurance of RIP type composites over the RBP type, which are classified respectively as class F (155 °C) and E (120 °C), the obtained data of coefficient Ka changes during the aging process were as expected in both cases.
In the authors’ opinion, even though a non-standard SVM method was used [8], there is a dependency between the absorption coefficient Ka and the level of the thermal wear of RBP and RIP insulation. This dependency was validated in Section 3.2 and Section 3.3 for selected examples of RIP-insulated bushings after long-term operation under various conditions.

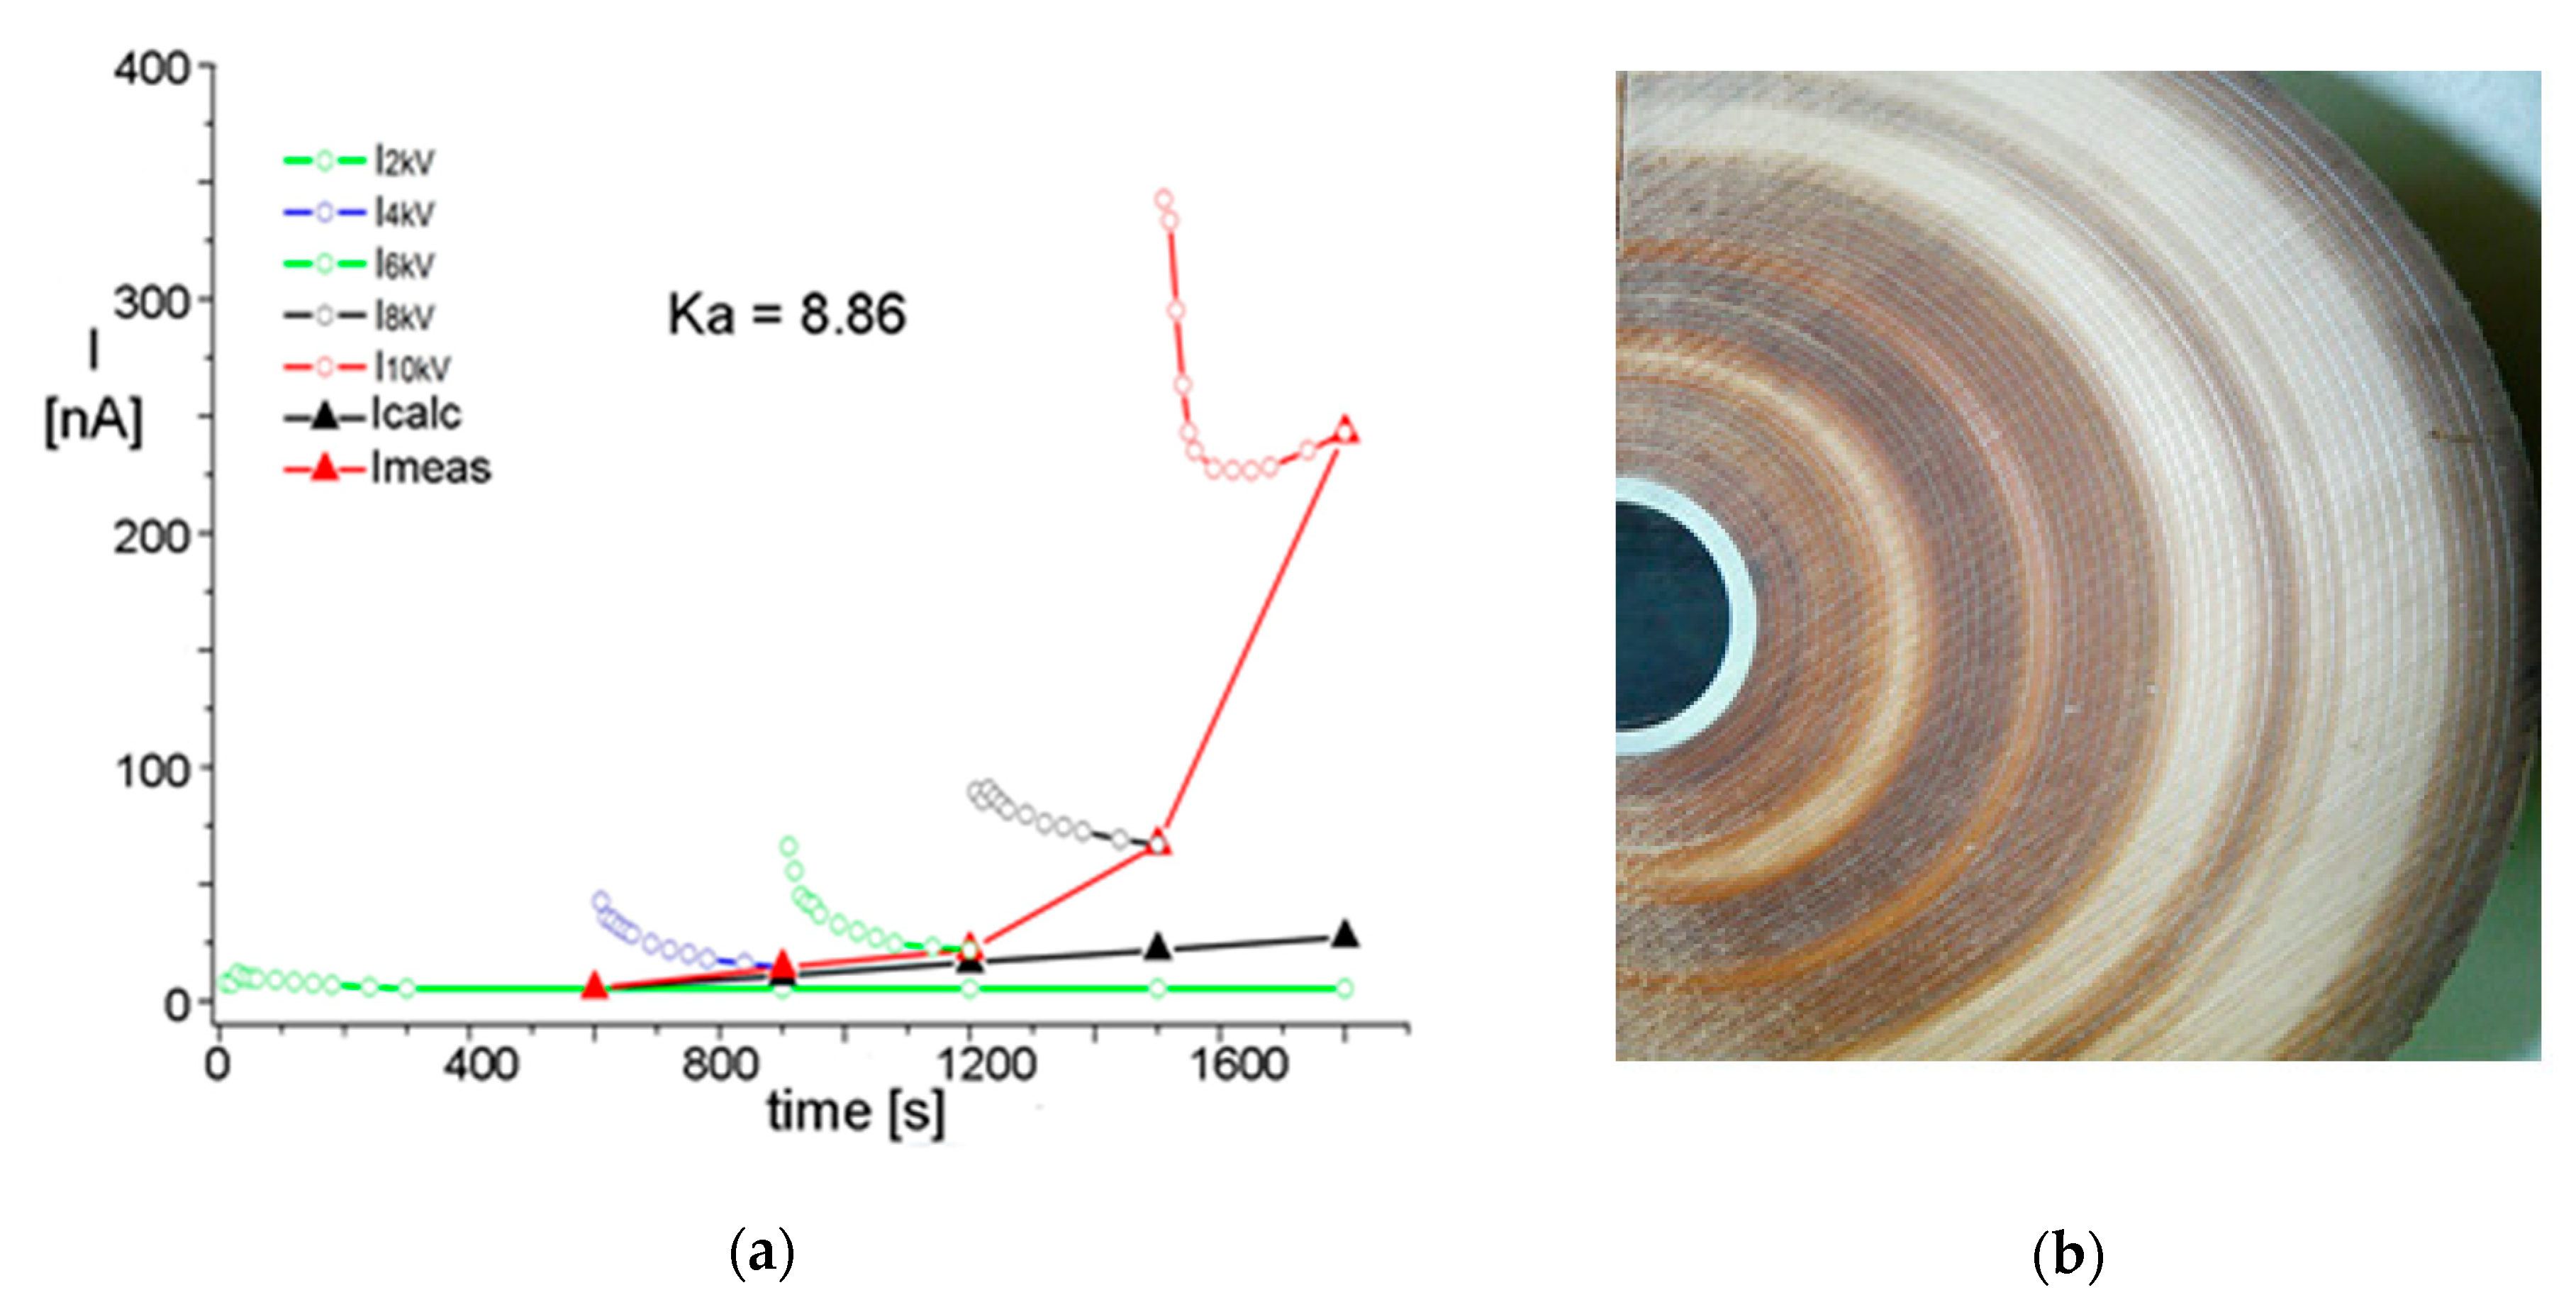
3.2. SVM Test of RIP Type Bushings after Long-Term Operation

Figure 7a shows the SVM test results of RIP-insulated CTF 245 kV (serial number 75D76) bushing, which was in operation for around 30 years. Similar to the laboratory aging experiments, a significant non-linearity in the dielectric response (leakage current) was observed, especially for the voltage steps of 8 and 10 kV. The calculated absorption coefficient Ka = 8.86 grades the insulation as being heavily aged. This diagnosis was validated with the measurements of the dielectric loss factor, which was measured at tgδ50Hz = 1.68%, significantly exceeding the permissible value for this class of bushings (tgδ50Hz ≤ 0.7%) [17,18]. Therefore, the bushing was withdrawn from further operation.
Figure 7b presents the cross-section of the analyzed bushing, which was performed slightly above the mounting flange at around one-third of the insulation height. According to the insulation’s morphology, two fundamental areas can be distinguished. The first, which includes over a dozen layers near the current rod, shows clear symptoms of thermal aging, especially on the boundary with the aluminum screen. Furthermore, the presence of carbon compounds was found in this part. It needs to be emphasized that the performed simulations of the temperature distribution have shown that, in this area, the distribution is much higher than in the other parts. The second area, which included the outer layers of the composite, showed a morphology typical for insulation in a good technical condition [15].
Taking into consideration the distribution of the electrical field intensity in the SVM test (Figure 2), an assumption can be made that the first few layers were diagnosed. Therefore, the obtained value of the absorption coefficient Ka = 8.86 seems reasonable.
On the other hand, Figure 8 presents the SVM test results of Micafil type CTF 245/630 bushings, which were deinstalled after 25 years of service. The absorption coefficient Ka of the bushings with serial numbers 73D56979 and 73D56981 were, respectively, 4.17 and 6.8, which in line with standard practice marks them as excessively aged. In contrast, the serial number 73D56980 bushing (Ka = 2.34) shows symptoms of the early process of insulation decomposition. These conclusions were verified with the Dielectric Frequency Response tests (FDS), which will be discussed later in this paper.
Figure 9 presents the changes in the coefficient Ka values of the selected bushings depending on the aging time. The assumption was made that in case of bushings which were in service for 20–30 years, there were usually 12 days annually with an ambient temperature T ≈ 28–35 °C, which led to a temperature rise of the porcelain cover to 50–60 °C. Considering the thermal model of the bushings, this indicated that for tgδ50Hz ≈ 0.006–0.008, the insulation surrounding the current rod exceeded a temperature of 100 °C [14,18]. These conditions may result in accelerated paper degradation and some other types of resins (e.g., epoxy or phenol-formaldehyde) within RBP and RIP composites. Additionally, the assumption was made that the duration of such insulation during these days is around 4–5 h. Assuming these conditions, the timespan has been evaluated in which the accelerated processes are likely to occur. In the case of 25 years of service time, the insulation lasts circa 1200–1500 h, whereas for 20 years of operation, there is a duration of circa 1440–1800 h [19,20]. Figure 9 reveals that the experiment performed in the operational conditions confirmed the laboratory observations. The insulation subjected to long-term aging factors, regardless of the bushing and composite type, is generally distinguished by higher Ka coefficient values.
Since temperature is a crucial factor influencing the dielectric response characteristic of insulation, it needs to be taken into consideration during analysis. This issue also concerns the SVM tests, as the temperature of the bushings may influence the calculated value of the absorption coefficient Ka. This especially applies when measurements were taken in conditions of a big temperature difference within the bushings’ core. For this reason, an experiment was conducted to determine the dependence between temperature and Ka coefficient values. Measurements were taken for the temperature range of 15–110 °C. Figure 10 presents the Ka values as a function of temperature for the PTK 52 kV bushing. The absorption coefficient ranged in value from 0.7 to 0.98, which means that, for a temperature of ∆T = 95 °C, the relative changes of Ka amounted to around 40%. Considering that the impact of the temperature on the dissipation factor tgδ50Hz is much higher, the absorption coefficient Ka as a descriptor of the condition of insulation is much more temperature-independent compared to the dielectric loss factor. Furthermore, Ka changes in a wide temperature range, classifying it within a certain range of criteria values for insulation assessment.

3.3. FDS Analysis of Bushings Insulation

The spectroscopic measurements of the dielectric response of the insulation CTF 245 kV (serial number 75D76) bushing is presented in Figure 11.
Primarily, a clear relaxation process was observed which occurred within a frequency range of 10–4000 Hz (Figure 11a). Based on the dielectric response representation on the Cole–Cole plot (Figure 11b), the value of the resonant frequency was estimated to be in the range of 90–110 Hz which corresponds to the relaxation time of τ ≈ 1.4–1.8 × 10⁻³ s. The presence of this process is the reason for the excessive increase in the value of tgδ50Hz which leads to a withdrawal from further operation. In terms of medium (MF) and low (LF) frequencies, the changes of tgδ and the capacity values were typical for thermosetting composites at an early stage of the thermal degradation, which is characterized by the presence of relaxation with a large time constant and small capacity increases [21].
The frequency characteristics of the dissipation factor tgδ of the selected CTF 245 kV bushings are presented in Figure 12. In all cases, the shape of the response characteristics was typical for insulation in the advanced degradation process. Additional relaxation processes were observed both in high (HF) and low (LF) frequencies, which suggest the presence of the products of the composite decomposition or the potential delamination of the layers. The relaxation in the high-frequency range in all bushings shows that a thermal decomposition of resin or paper had already begun on the screen–insulation boundary.
The characteristics of the 73D56980 bushing attract attention as they show a fairly acceptable absorption coefficient Ka = 2.34 with no clear relaxation process in the MF range, which occurs typically for advanced insulation degradation and the presence of Maxwell–Wagner charge.
In the case of the bushing with serial number 73D56981, with a very high coefficient Ka = 6.83, it was observed that two relaxation processes in the LF range were present, and the insulation capacity increased by almost two orders of magnitude. These data prove the poor condition of the core insulation, which requires immediate withdrawal from operation.

4. Conclusions

In bushings with solid insulation, thermal aging in operating conditions mainly causes the decomposition of the insulation layers close to the current rod. A similar morphology of layered insulation in high-voltage electrical machines and high-voltage bushings makes the SVM method suitable for diagnostics in RIP and RBP bushings. This procedure can be used for both RIP and RBP insulation assessment due to the specific static electrical field distribution in the layered insulation of the bushings’ cores. The electrical stresses which occurred during the SVM test in the first layers of the insulation are comparable to the stresses occurring in high-voltage electrical machine insulation.
The experiments have shown that the development of the aging processes in RIP and RBP insulation leads to the increase of the absorption coefficient calculated from the SVM test. The assessment of insulation based on Ka values was positively verified with measurements of the dissipation factor tgδ and the capacity in a wide spectrum of frequency (FDS method). Furthermore, the great advantage of the SVM test is the practically stable and temperature-independent coefficient Ka value. As a result, insulation evaluation is somewhat dependent on temperature values and the distribution within the core, which is generally hard to define.
The measurements carried out—especially using the SVM method—determine the condition of aging of the crucial area of the bushing insulation located close to the current channel; i.e., the place in which the processes of damage and electrical breakdown are initiated most often.

Author Contributions

Conceptualization, J.S and A.M.; methodology A.M. and M.Z.; resources, J.S.; investigation, A.M., P.B. and M.Z.; supervision, J.S.; visualization, A.M., P.B. and M.Z.; writing—original draft preparation, J.S., A.M., P.B. and M.Z.; writing—review and editing, A.M. and P.B. All authors have read and agreed to the published version of the manuscript.

Funding

This research received no external funding.

Conflicts of Interest

The authors declare no conflict of interest.

References

  1. Akbari, M.; Allahbakhshi, M.; Mahmoodian, R. Heat analysis of the power transformer bushings in the transient and steady states considering the load variations. Appl. Therm. Eng. 2017, 121, 999–1010. [Google Scholar] [CrossRef]
  2. Eliss, K. Bushings for Power Transformers: A Handbook for Power Engineers; Author House: Bloomington, IN, USA, 2011. [Google Scholar]
  3. Kassihin, S.D.; Lizunov, S.D.; Lipstein, G.R.; Lokhanin, A.K.; Morozova, T.I. Service experience and reasons of bushing failures of EHV transformers and shunt reactors. Trans. CIGRE 1996, 12–105. [Google Scholar]
  4. Marques, A.P.; de Jesus Ribeiro, C.; Azevedo, C.H.B.; Lopes dos Santos, J.A.; de Carvalho Sousa, F.R.; da Cunha Brito, L. Power transformer distruptions—A case study. IEEE Electr. Insul. Mag. 2014, 30, 17–21. [Google Scholar] [CrossRef]
  5. Mehta, A.K.; Sharma, R.N.; Chauhan, S.; Agnihotri, S.D. Study and diagnosis of the power transformer bushing insulation system. In Proceedings of the 2011 IEEE Pulsed Power Conference, Chicago, IL, USA, 19–23 June 2011; pp. 700–705. [Google Scholar] [CrossRef]
  6. Zink, M.; Klipfel, V.; Berger, F. Ageing—Condition Assessment of Generator Transformer Buhings by means of Dielectric Simulation Models. In Proceedings of the IEEE International Conference on Condition Monitoring and Diagnosis, Bali, Indonesia, 23–27 September 2012; pp. 137–140. [Google Scholar]
  7. Tenbohlen, S.; Jagers, J.; Vahidi, F.; Müller, P.; Lapworth, J.; Yukiyasu, S.; Desai, B.; McIntosh, A.; Bastos, G.; Bo, L. Transformer Realiability Survey; CIGRE: Paris, France, 2015. [Google Scholar]
  8. Smith, D.J.; Mcmeekin, S.G.; Stewart, B.G.; Wallace, P.A. The modelling of electric field, capacitance and dissipation factor of a high voltage bushing over varying frequency. In Proceedings of the 2012 47th International Universities Power Engineering Conference (UPEC), London, UK, 4–7 September 2012; pp. 1–6. [Google Scholar] [CrossRef]
  9. Seifert, J.M.; Stietzel, U.; Kärner, H.C. The Aging of Composite Insulating Materials—New possibilities to detect and classify ageing phenomena with dielectric diagnosis tools. In Proceedings of the IEEE International Symposium on Electrical Insulation, Arlington, VA, USA, 7–10 June 1998. [Google Scholar] [CrossRef]
  10. Helgeson, A. Analysis of Dielectric Response Measurement Methods and Dielectric Properties of Resin-Rich Insulation during Processing. Depart. Electr. Power Eng. Stockh. 2000, 1100–1593. [Google Scholar]
  11. IEC Report. Publication 505, Guide for Evaluation and Identification of Insulation Systems of Electrical Equipment; 1975. Available online: https://webstore.iec.ch/publication/16396 (accessed on 5 February 2020).
  12. Kimura, K.; Kaneda, Y. The Role of Microscopic Defects in Multistress Aging of Micaceous Insulation. IEEE Trans. 1995, 2, 426–432. [Google Scholar] [CrossRef]
  13. Theocaris, P.S.; Varias, A.G. Thermal Expansion Properties of Particulates Based on the Concept of Mesophase. J. Appl. Polym. Sci. 1985, 30, 2979–2995. [Google Scholar] [CrossRef]
  14. Ban, D.; Cettolo, M.; Miletic, B. Electrical Motor Insulation Conditons dc Testing. IEEE Trans. 1998, 5, 917–921. [Google Scholar]
  15. Subocz, J.; Zenker, M.; Mrozik, A. The Analysis of Relaxation Processes in Thermally Aged Solid Insulation Bushing (in Polish—Analiza procesów relaksacyjnych w starzonym termicznie przepuście z izolacją stałą). Prz. Elektrotech. 2012, 88, 212–214. [Google Scholar]
  16. Subocz, J.; Zenker, M.; Mrozik, A.; Bohatyrewicz, P. The Effect of Thermal Aging Process on Dielectric Response of Bushings with RBP and RIP Insulation. In Proceedings of the 2018 Innovative Materials and Technologies in Electrical Engineering (i-MITEL), Sulecin, Poland, 18–20 April 2018. [Google Scholar]
  17. IEEE Standard for Performance Characteristics and Dimensions for Power Transformer and Reactor Bushings. IEEE Stand. 2018. [CrossRef]
  18. Przybyłek, P.; Morańda, H.; Walczak, K.; Mościcka-Grzesiak, H. The bubble effect in bushings—Investigations on models. IEEE Trans. Dielectr. Electr. Insul. 2015, 22, 3405–3412. [Google Scholar] [CrossRef]
  19. Polish Institute of Meteorology and Water Management—National Research Institute (in Polish—Instytut Meteorologii I Gospodarki Wodnej—Państwowy Instytut Badawczy). Available online: http://klimat.imgw.pl/wp-content/uploads/2013/01/1_25.pdf (accessed on 14 December 2019).
  20. Weather and Climate (in Polish—Pogoda I Klimat). Available online: http://meteomodel.pl/BLOG/?p=10757 (accessed on 14 December 2019).
  21. Subocz, J. Dielectric Conductivity and Relaxation of Layered Insulation Systems (in Polish—Przewodnictwo I Relaksacja Warstwowych Układów Izolacyjnych); West Pomeranian University of Technology: Szczecin, Poland, 2012; ISBN 978-83-7663-113-4. [Google Scholar]
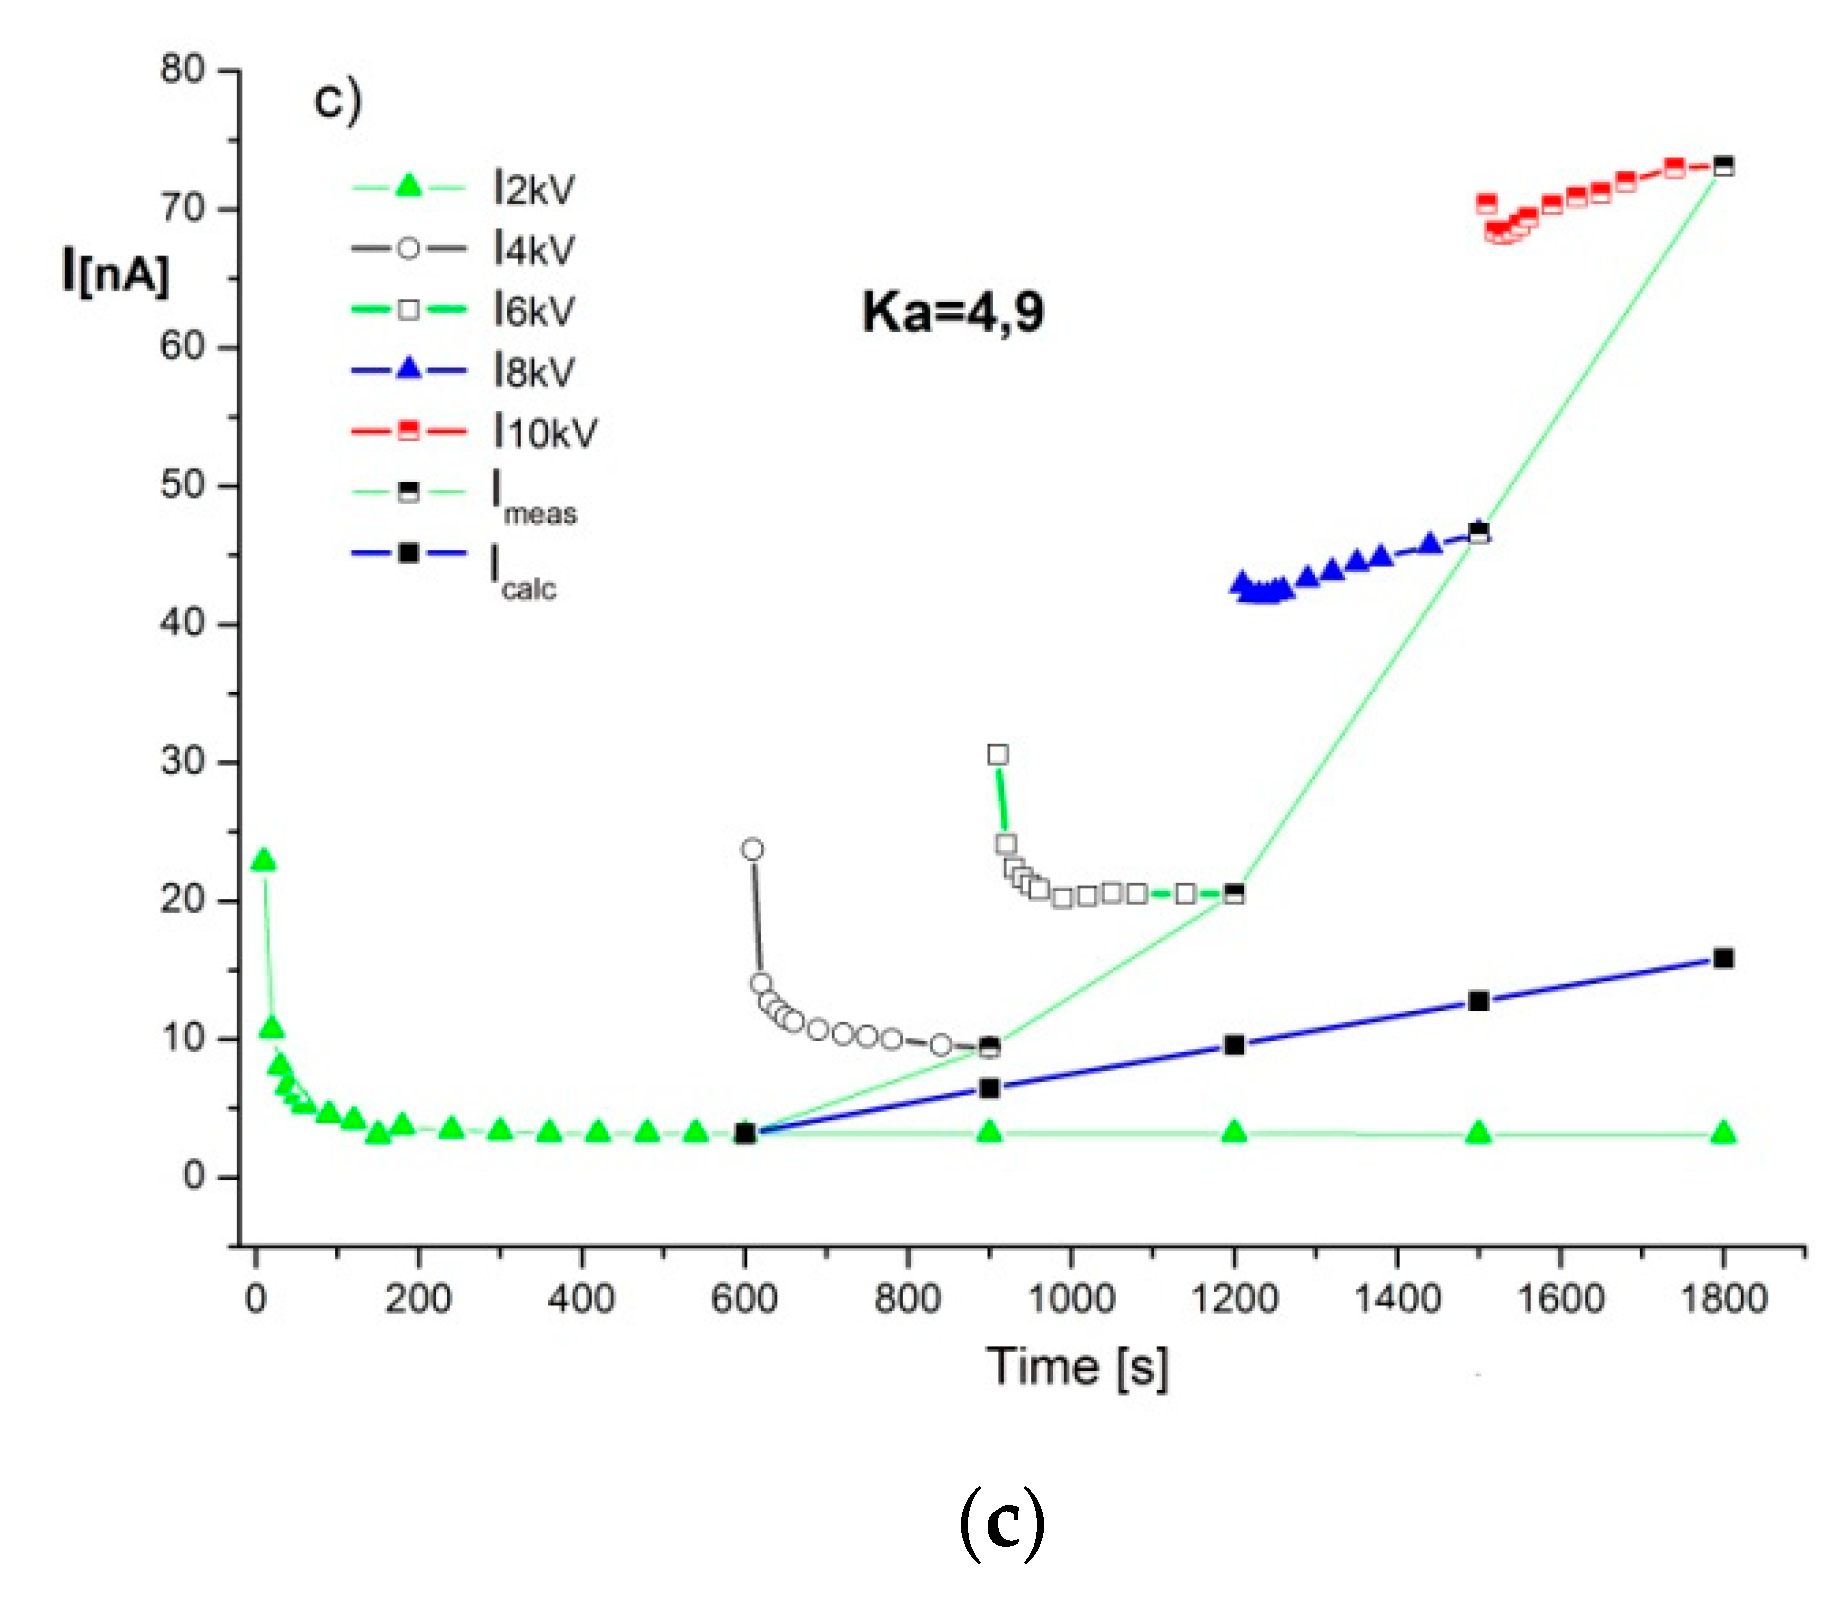
Figure 1. Schematic diagram of the generation and development of microdefects during the impact of combined exposure on composite insulation.
Energies 13 00853 g001
Figure 2. Conception of the “polymer–filler” interphase.
Energies 13 00853 g002
Figure 3. Typical relationships tgδ = f(f) for RIP bushings insulation under different conditions.
Energies 13 00853 g003
Figure 4. The experimental setup for: (a) CRPT bushing; (b) CTKF bushing, (c) diagnostic scheme of the Frequency Dielectric Spectroscopy (FDS) method.
Energies 13 00853 g004
Figure 5. The SVM test chart of CRPT 52 kV bushing insulation after (a) 10 years of operation; (b) an additional 340 h of aging after deinstallation; (c) an additional 740 h of aging after deinstallation [16].
Energies 13 00853 g005aEnergies 13 00853 g005b
Figure 6. The SVM test chart of CTKF 145 kV bushing insulation after (a) 10 years of operation; (b) an additional 740 h of aging after deinstallation [16].
Energies 13 00853 g006
Figure 7. The analysis of the CTF 245 kV (serial number 75D76) bushing: (a) SVM test chart; (b) cross-section of the core [16].
Energies 13 00853 g007
Figure 8. The SVM test results of CTF 245 kV bushings after 25 years of operation: (a) serial number 73D56979; (b) serial number 73D56980; (c) serial number 73D56981 [16].
Energies 13 00853 g008
Figure 9. The impact of the aging time on the absorption coefficient Ka value calculated for different RBP and RIP-insulated bushings [16].
Energies 13 00853 g009
Figure 10. The effect of temperature on Ka values for PTK 52 kV bushing [16].
Energies 13 00853 g010
Figure 11. The dependencies measured in the CTF 245 kV bushing: (a) tgδ = f(f); (b) ε’’ = f(ε’).
Energies 13 00853 g011
Figure 12. Frequency characteristics of the tgδ coefficient of CTF 245 kV bushings after 25 years of service.
Energies 13 00853 g012
Table 1. The voltage levels and time sequence used in the Step Voltage Measurement (SVM) tests.
Voltage LevelTime Interval
2 kV10 min
4 kV5 min
6 kV5 min
8 kV5 min
10 kV5 min

