Review

The Development Strategies and Technology Roadmap of Bioenergy for a Typical Region: A Case Study in the Beijing-Tianjin-Hebei Region in China

1
Advanced Research Center of Thermal and New Energy Technologies, Xingtai Polytechnic College, Xingtai 054035, China
2
School of Aeronautic Science and Engineering, Beihang University, Beijing 100191, China
3
Institute of Engineering Thermophysics, North China University of Water Resources and Electric Power, Zhengzhou 450045, China
4
Beijing Key Laboratory of Space Thermal Control Technology, Beijing Institute of Space System Engineering, Beijing 100094, China
*
Author to whom correspondence should be addressed.
Energies 2020, 13(4), 844; https://doi.org/10.3390/en13040844
Submission received: 26 December 2019 / Revised: 28 January 2020 / Accepted: 11 February 2020 / Published: 14 February 2020
(This article belongs to the Special Issue Bioenergy from Organic Waste)

Abstract

:
The Beijing-Tianjin-Hebei region has abundant biomass resources, which are difficult to collect and thus are underutilized. However, the potential estimation of biomass energy can result in a comprehensive understanding of bioenergy resources in order to establish a technology roadmap for the region’s bioenergy development. Therefore, it is essential to estimate the potential of Beijing-Tianjin-Hebei biomass resources and bioenergy utilization. In this paper, the amount of main biomass resources for possible energy use and bioenergy utilization are calculated based on a statistical data estimation method for crop residues; human, poultry, and livestock manure; and municipal solid wastes. On the basis of biomass resources and bioenergy utilization potential, the technology roadmap is established. The results show that the amount for available biomass energy use is unevenly distributed in the Beijing-Tianjin-Hebei region, and the largest amount of resources is crop residues (36.52 million tons or 18.26 million tons coal equivalent). The biogas from human, poultry, and livestock manure and densified solids from crop residue technology roadmap is suitable for the Beijing-Tianjin-Hebei region.

Graphical Abstract

1. Introduction

National economic growth is related to energy consumption, and there are many studies on the relationship between economic growth and energy consumption [1,2,3,4,5]. The relationship between renewable and economic growth have established bi-directional causation for 18 emerging economies [6]. Sadorsky reports that per capita income rose by 1% and renewable energy consumption increased 3.5% in the long term [6]; however, a positive unidirectional causality arose between household renewable energy consumption and GDP [7]. For example, biomass energy consumption increased by 1% and GDP increased by 0.85% in 51 African countries [8]. Therefore, the rapid development of social economy promotes the sustained growth of energy demand and consumption.
According to the Statistical Review of World Energy in 2019, we found that world primary energy consumption increased to 13.9 billion tons of oil equivalent in 2018, along with an average annual growth rate of 2.9% per year, and the consumption of oil, nature gas, and coal have increased at the same time. What is more, nuclear energy, hydroelectricity, and renewables consumption have grown [9]. In addition, traditional fossil energy will run out in the near future, and carbon dioxide emissions are increasing year by year [10,11]. Thus, it is inevitable for countries to develop renewable energy [12,13,14]. The Paris Agreement Conference of Parties (COP) announced that the fossil fuel age has ended, and many countries have agreed that “to undertake rapid reductions thereafter, in accordance with the best available science, so as to achieve a balance between anthropogenic emissions by sources and removals by sinks of greenhouse gases in the second half of this century, on the basis of equity and in the context of sustainable development and efforts to eradicate poverty” derived from the COP 21 report [12]. Sustainable development goals have been highlighted by the United Nations, and the importance of renewable energy for changing the world was highlighted in goals 7 and 3 of clean energy and health [15]. China is the largest emitter of greenhouse gases (GHG) [16]; hence, China plans to reduce the GHG emissions by 40–45% by 2020 [17]. For this reason, renewable energy can be used as a clean alternative to fossil fuels and is sustainable.
As per REN21′s 2019 reported, biomass energy contributed the largest to renewable energy consumption in the global energy supply, including traditional biomass utilization. By the end of 2017, the contribution of bioenergy to final energy consumption was about 12.4%, which is about 46.0 exajoules (EJ), with modern sustainable bioenergy (excluding the traditional use of biomass) providing around half of all renewable energy in the final energy consumption [18]. The world biofuels value was estimated at 7.5 billion bbl of diesel or 60 quads for the world, which were produced from annual residue [19]. Bioenergy is carbon neutral because the carbon dioxide that is released by burning is offset by the carbon dioxide absorbed when the plant in question was grown [20,21]. Thus, bioenergy production based on biomass resources is an essential substitute for fossil energy and has attracted general attention around the world [1,2,22,23,24,25].
Based on feedstock, biofuels are classified into four categories—first, second, third, and fourth generation biofuels [26]—and biomass energy can be divided into solid, liquid, and gas [25] on the basis of the form of energy utilization in power generation, heating, and transportation [27]. We can use farm wastes, forest wastes, living wastes, and industrial wastes [28] as raw materials for biomass energy in order to reduce GHG [27]. As a result, waste is reduced and it simultaneously becomes an economic resource and provides jobs for the unemployed [25,29,30]. For example, Diamantis et al. studied the different processes of cheese whey anaerobic treatment of three systems and the final net profit of biogas production, which is especially meaningful for the biomass industry and may create economic benefit for individuals and nations [28]. Global biofuel production is on the rise—in 2018, 95 million tons oil equivalent was produced worldwide, with North America, South and Central America, and Europe contributing 39, 25, and 16 million tons oil equivalent, respectively (see Figure 1). Europe is the world’s largest producer of biomass diesel, while North America is the biggest producer of ethanol (see Figure 1b). In particular, the US is the world leader in biomass ethanol production (see Figure 1c) [31].
Because bioenergy potential estimation is the first step to understanding bioenergy from the industrial chain and its development potential in the future, it is necessary to estimate biomass potential. So far, bioenergy estimation has been highlighted in the renewable energy field in order to establish a comprehensive understand of bioenergy development [29]. Biomass energy estimation methods include the statistical data method [32,33], estimation integrating remote sensing (RS), and geographic information system (GIS) techniques [34,35,36]. Owing to the ease in data acquisition, the statistical data method is the most commonly used method in biomass and bioenergy potential estimation at present [37]. The statistical data method of estimation involves subtracting the amount of resources used for other purposes and the amount of each possible type of biomass that can be used for bioenergy production, as well as the losses incurred in the process of collection, transportation, etc. The amount remaining is multiplied by the energy conversion coefficient and converted into a unit of energy [38,39]. As new methods, RS and GIS are mainly used to estimate biomass energy potential and obtain land area information for biomass cultivation. However, RS and GIS apply only to specific types of biomass because their theoretical basis is to measure the biomass of vegetation in the ecological domain and require a large workload, large scale, and suffer from lack of spatial information and other problems [40,41].
The total potential of using crop residues and waste crops to produce bioethanol was 491 GL per year, of which 73.9 Tg of dry waste crops can produce 49.1 GL bioethanol and about 1.5 Pg dry lignocellulosic biomass (442 GL bioethanol) every year [42]. Smeets et al. adopted a bottom-up solution to assess agricultural and forestry residues and potential wastes for a total 76–96 EJ yr−1 in the year 2050, and the bioenergy potential generated by surplus forest growth was 74 EJ yr−1 by 2050 [43]. Thrän et al. applied scenario approaches in three different global scenarios for 2010, 2015, 2020, and 2050. Their results showed a potential change in the development of “business as usual,” from 27 EJ in 2010 to 96 EJ in 2050. By contrast, the potential for “sustainable land use” schemes is much lower, with 18 EJ in 2010 and 16 EJ in 2050 [44]. In addition, there are also estimates of regional biomass energy potential. In extreme cases, De Wit et al. assumed the average yield of bioenergy crops and Europe’s bioenergy potential could be 5.1–9.3 EJ yr−1. High-yielding lignocellulosic crops could double this potential [45]. Across Europe, the bioenergy potential of specialty bioenergy crops ranges from 1.7 to 12.8 EJ/y, with agricultural residues at 3.1–3.9 EJ/y and forestry residues at 1.4–5.4 EJ/y, respectively [46]. A total of 23.7 billion liters of second-generation ethanol could be produced from sugarcane residues, and 4.4 billion liters of Brazil’s corn and wheat residues extracted 600 million liters a year [23]. Furthermore, the potential of bioenergy in the Pacific Northwest states of the US [47], Albania [48], Switzerland [49], Poland [50], China [51], Malaysia [52], Japan [53], etc. were also more studied.
However, previous research has mainly focused on whole nations or a single zone. What is more, the biomass technology roadmap and bioenergy potential estimation of the Beijing-Tianjin-Hebei (B-T-H) region has not reported. In this paper, we successfully estimated three types biomass resources potential and bioenergy utilization potential based on a simple statistical data method and established the biomass energy technology roadmap of the B-T-H region. The rest of this paper is structured as follows: First, the description of technology roadmap and case information are presented in Section 2. Second, the energy potentials of specific types of bioenergy including crops straw, livestock and poultry waste, and municipal solid waste are estimated in Section 3. Third, the technology roadmap and bioenergy utilization potential of the B-T-H region and conclusion are discussed in Section 4 and Section 5, respectively.

2. The Description of the Technology Roadmap and Case Information

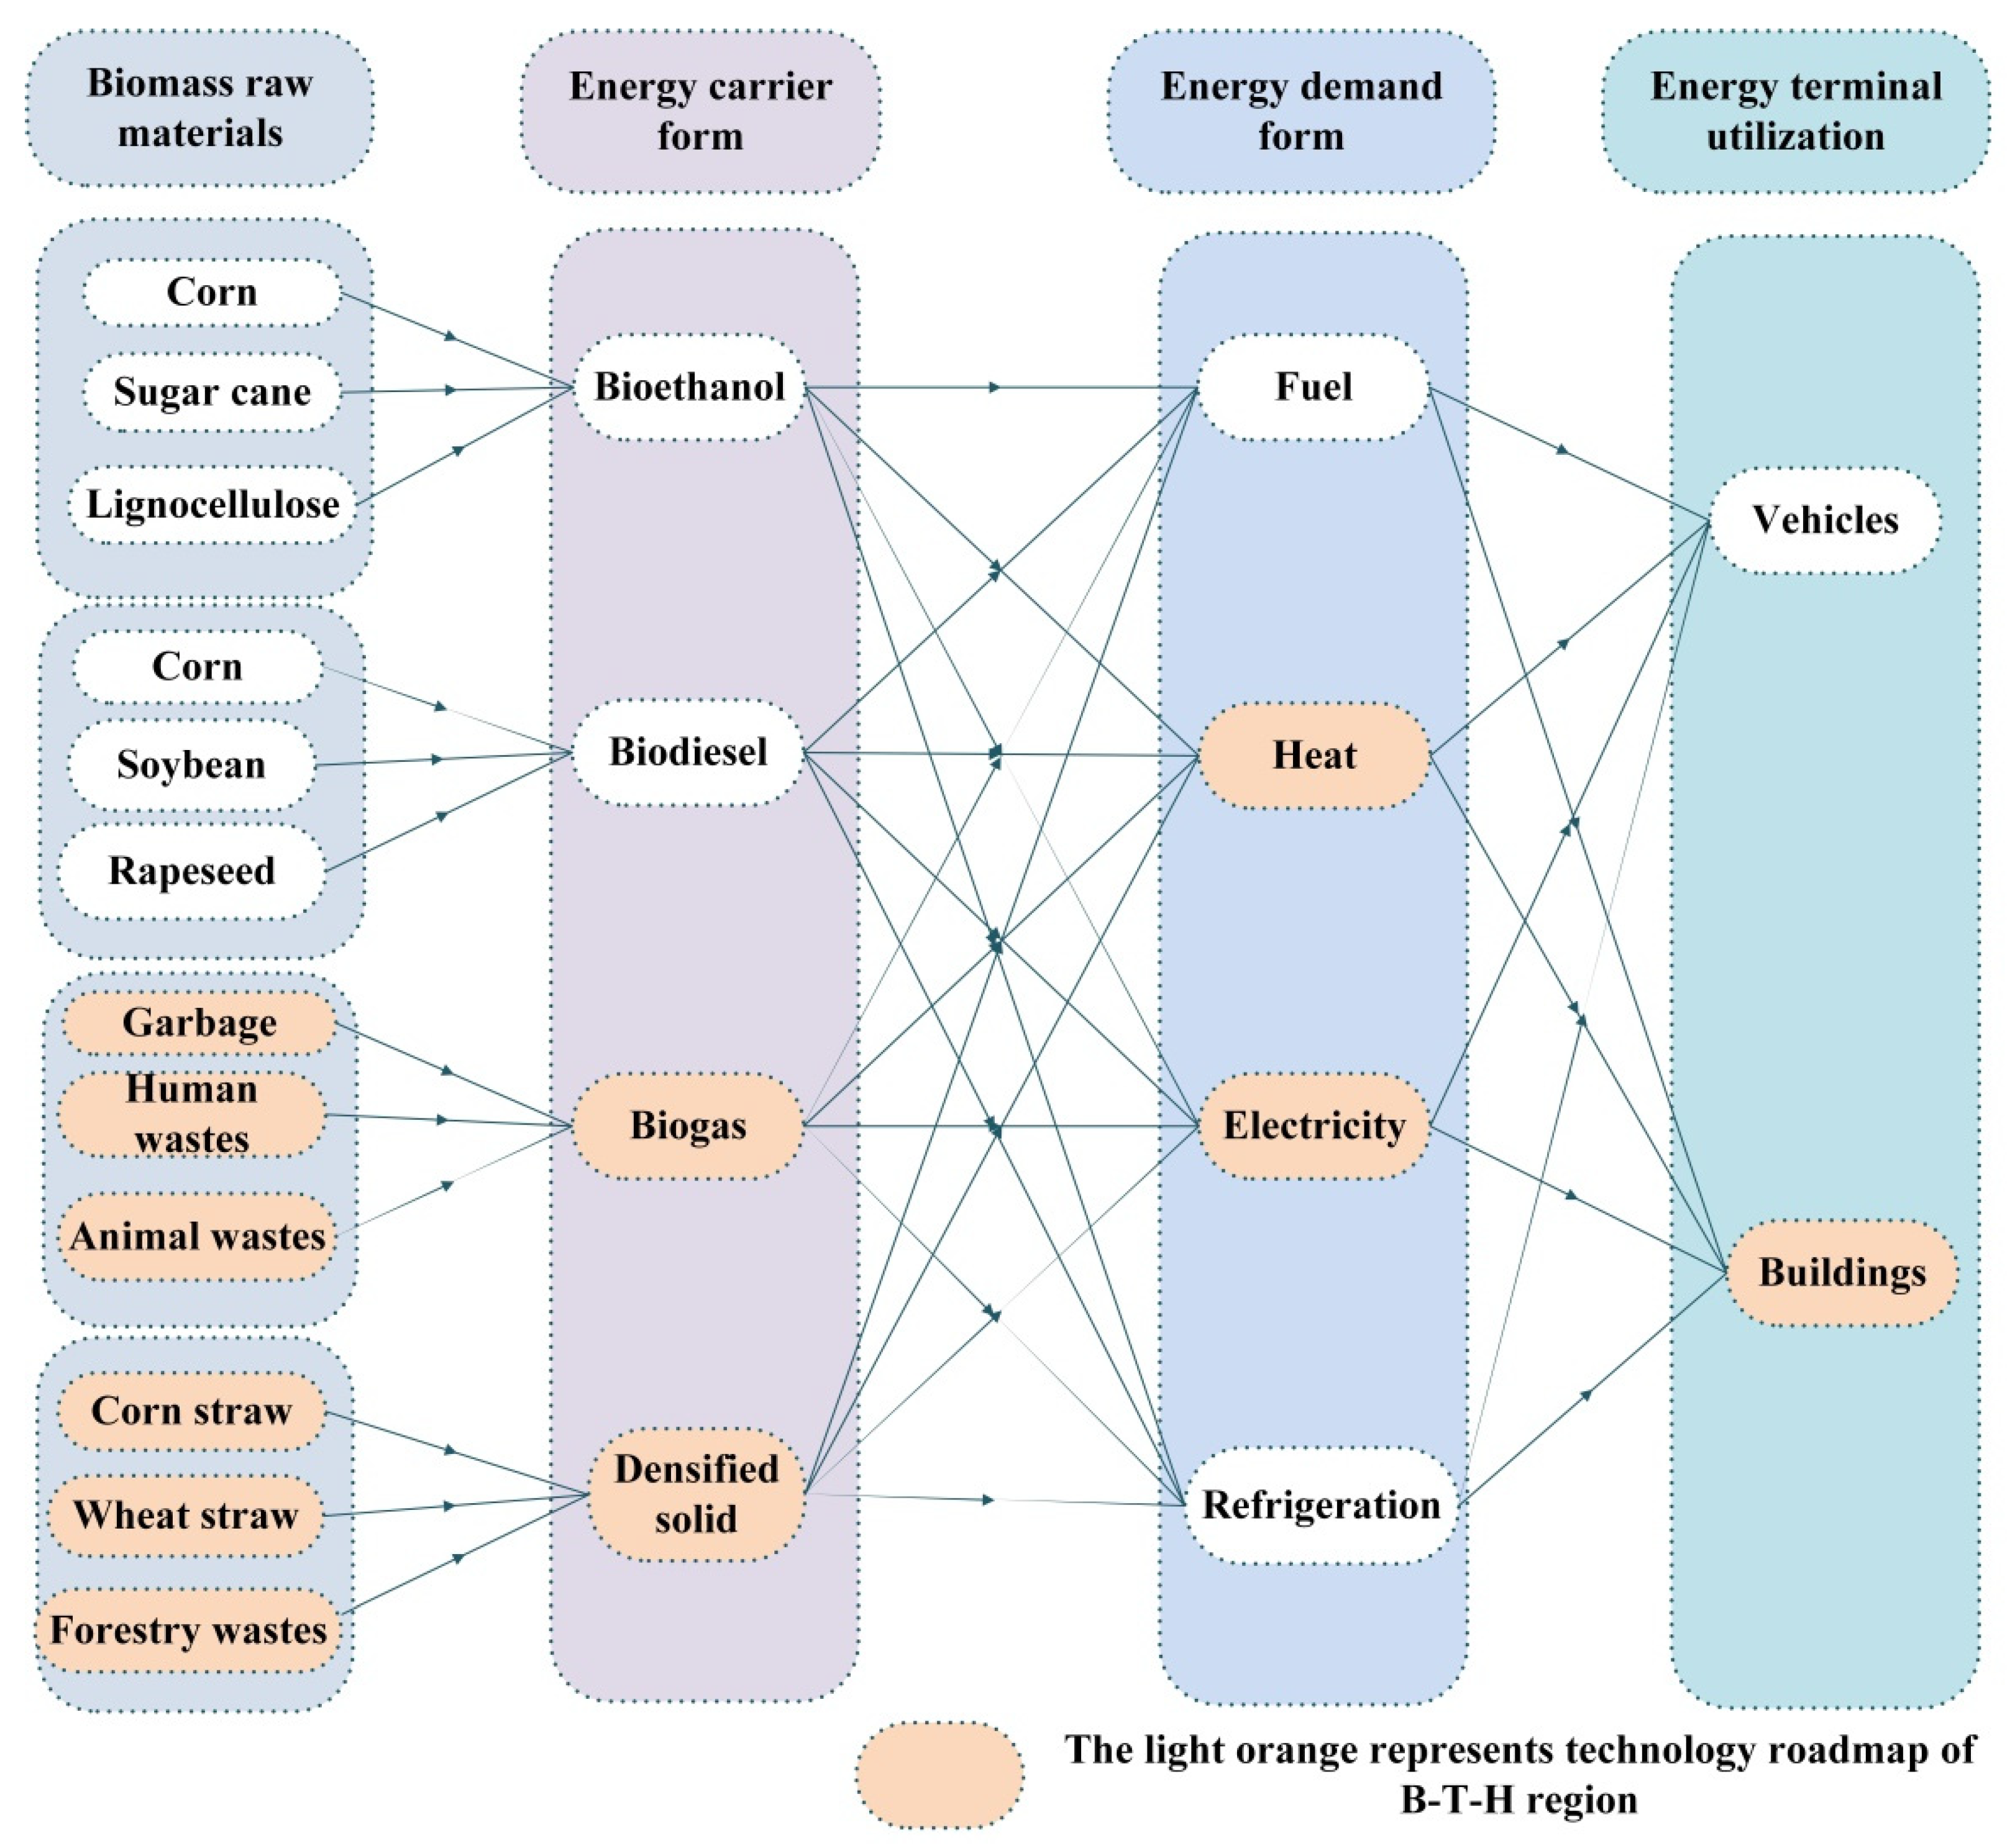
2.1. The Description of the Technology Roadmap

Roadmaps can be developed for different levels of deployment, including global, national, and regional levels, as well as sector-specific or technology-specific roadmaps. A roadmap is a strategy or plan that describes the steps taken to achieve defined and agreed upon goals within a specified time frame. It defines the range of technical, policy, legal, financial, market, and organizational barriers to these goals and the known solutions to overcome them. The goal of the technology roadmaps is to accelerate the deployment of specific technologies or groups of technologies [27]. Existing roadmaps include the International Energy Agency (IEA) reported technology roadmap of bioenergy for transport in 2011 [54], the Technology Roadmap for Bioenergy Heat and Power in 2012 [55], and the Technology Roadmap for Delivering Sustainable Bioenergy in 2017 [27]. The technology roadmap for biomass energy, as depicted in Figure 2, maps the movement of energy from the supply of raw materials to the use of the final energy [56]. The technology roadmap is divided into the following four parts: biomass raw materials, biomass energy carrier forms, biomass energy demand forms, and energy end-use forms. The technology roadmap can provide solutions for regional biomass energy development and formulate energy development models according to the characteristics of different regions [27,46].
Biomass raw materials include crops (such as corn, wheat, sugarcane, soybean, rapeseed, etc.), forest waste, crop straw, human waste, animal waste, and municipal solid wastes [30] (see Figure 2). The basic function of the raw materials supply is to provide raw materials for the preparation of biomass energy. The supply of raw biomass material is the basis for the production of biomass energy. Raw material harvesting, material selection, storage and drying, and transport are the premise of energy technology transformation [57]. Different energy carriers are obtained from raw biomass material using certain transformation technologies. There are four forms of energy carriers—bioethanol, biodiesel, biogas, and densified solid. Corn, sugarcane, and wheat can be hydrolyzed by fermentation to produce bioethanol [58]. Lignocellulose is mainly used to prepare bioethanol through fermentation, gas synthesis, liquefaction, and refining [59]. Biodiesel oil is prepared by pyrolysis, transesterification, or catalytic hydrogenation from rapeseed, soybean, and other oil plants [60]. Biogas is generated from human waste, animal waste, and municipal solid waste through fermentation and pyrolysis gasification technology [61]. Densified solid fuel is processed by densification technology from corps straw and forest wastes [62,63,64].
Energy demand is related to the different energy carriers. The relationship between specific energy carriers and different forms of energy demand are shown in the Figure 2. The different forms of energy demand include fuel [65], heat [66], electricity [67], and refrigeration [68], depending on the application scenario. Different forms of energy terminal utilization have different forms of energy demand—for example, energy requirements for building energy come in the form of heating, electricity generation, and cooling [69,70,71].

2.2. The Description of Case Information

The B-T-H region is China’s “capital economic circle.” The GDP of the B-T-H region accounted for 9.54% of the country’s total GDP. The per capita income in 2018 of Beijing, Tianjin, and Hebei residents was $20,030 USD, $17,244 USD, and $6824 USD, respectively, which can be seen from Appendix A. While world biofuel production is increasing progressively year after year, China’s biomass development is in its stage, and biomass development in the B-T-H region still requires significant progress. Biofuel production data in the Beijing-Tianjin-Hebei region are incomplete or even absent. Economic development promotes the development of biomass energy. Therefore, the biomass production of Beijing, Tianjin, and Hebei by analogy based on the same level of economic development in the world is shown in Appendix A.
The region covers an area of 216,000 square kilometers, accounting for 2.3% of China’s total area, and has a population of 110 million, accounting for 7.2% of China’s total. Due to rapid economic development, the environmental pollution in this area is serious, particularly in Hebei. Hebei Province has the highest density of coal consumption and heavily polluting industries in China [72]. Additionally, the B-T-H region has some of the most severe air pollution in China. In 2015, among the top 10 polluted cities in China, seven were located in the B-T-H region, and six cities were located in this region in 2016 [73,74].
The B-T-H region belongs to the northern plain, and its crop straw yield is very high, amounting to approximately 50 million tons per year. However, most of these resources are discarded or incinerated in the fields by local farmers, which leads to the waste of resources and seriously pollutes the environment. In response to the thorny issue of environmental pollution, the steel industry’s ultra-low emissions and bulk coal replacement policies in the B-T-H region have improved the environmental situation, at least to some extent. Nevertheless, it is still necessary to control environmental pollution from the source. The biofuel process can turn waste straw, feces, and urban household waste into usable biomass energy and can take advantage of it in areas such as heating and power generation in the region. Based on the above facts, estimating the region’s bioenergy potential is therefore a top priority in developing a technology roadmap, which is particularly important in this article.

2.3. The Limitations of This Work

The B-T-H region has a limited variety of biomass resources, and not all biomass potential has been estimated. The types of biomass energy available are also limited, and the rice ratio, collection efficiency, and energy conversion efficiency are different from each other. The estimation method based on statistical data is theoretical, and we need to systematically map the process of biomass energy production from the collection of raw materials to the final energy utilization. The planning and utilization of the B-T-H region’s biomass technology roadmap needs to be considered in many aspects, such as the support of national policies, the formulation of relevant laws, and the demand stability of the energy market, which all need to be studied over a long period of time.

3. The Potential Estimation of Bioenergy in the B-T-H Region

There are various kinds of biomass resources in the B-T-H region, including agricultural waste, livestock and poultry waste, and municipal solid waste. For those biomass resources, the amount of biomass resources and the potential for energy utilization are estimated by statistical data. All data are from the National Bureau of Statistics and are up-to-date.

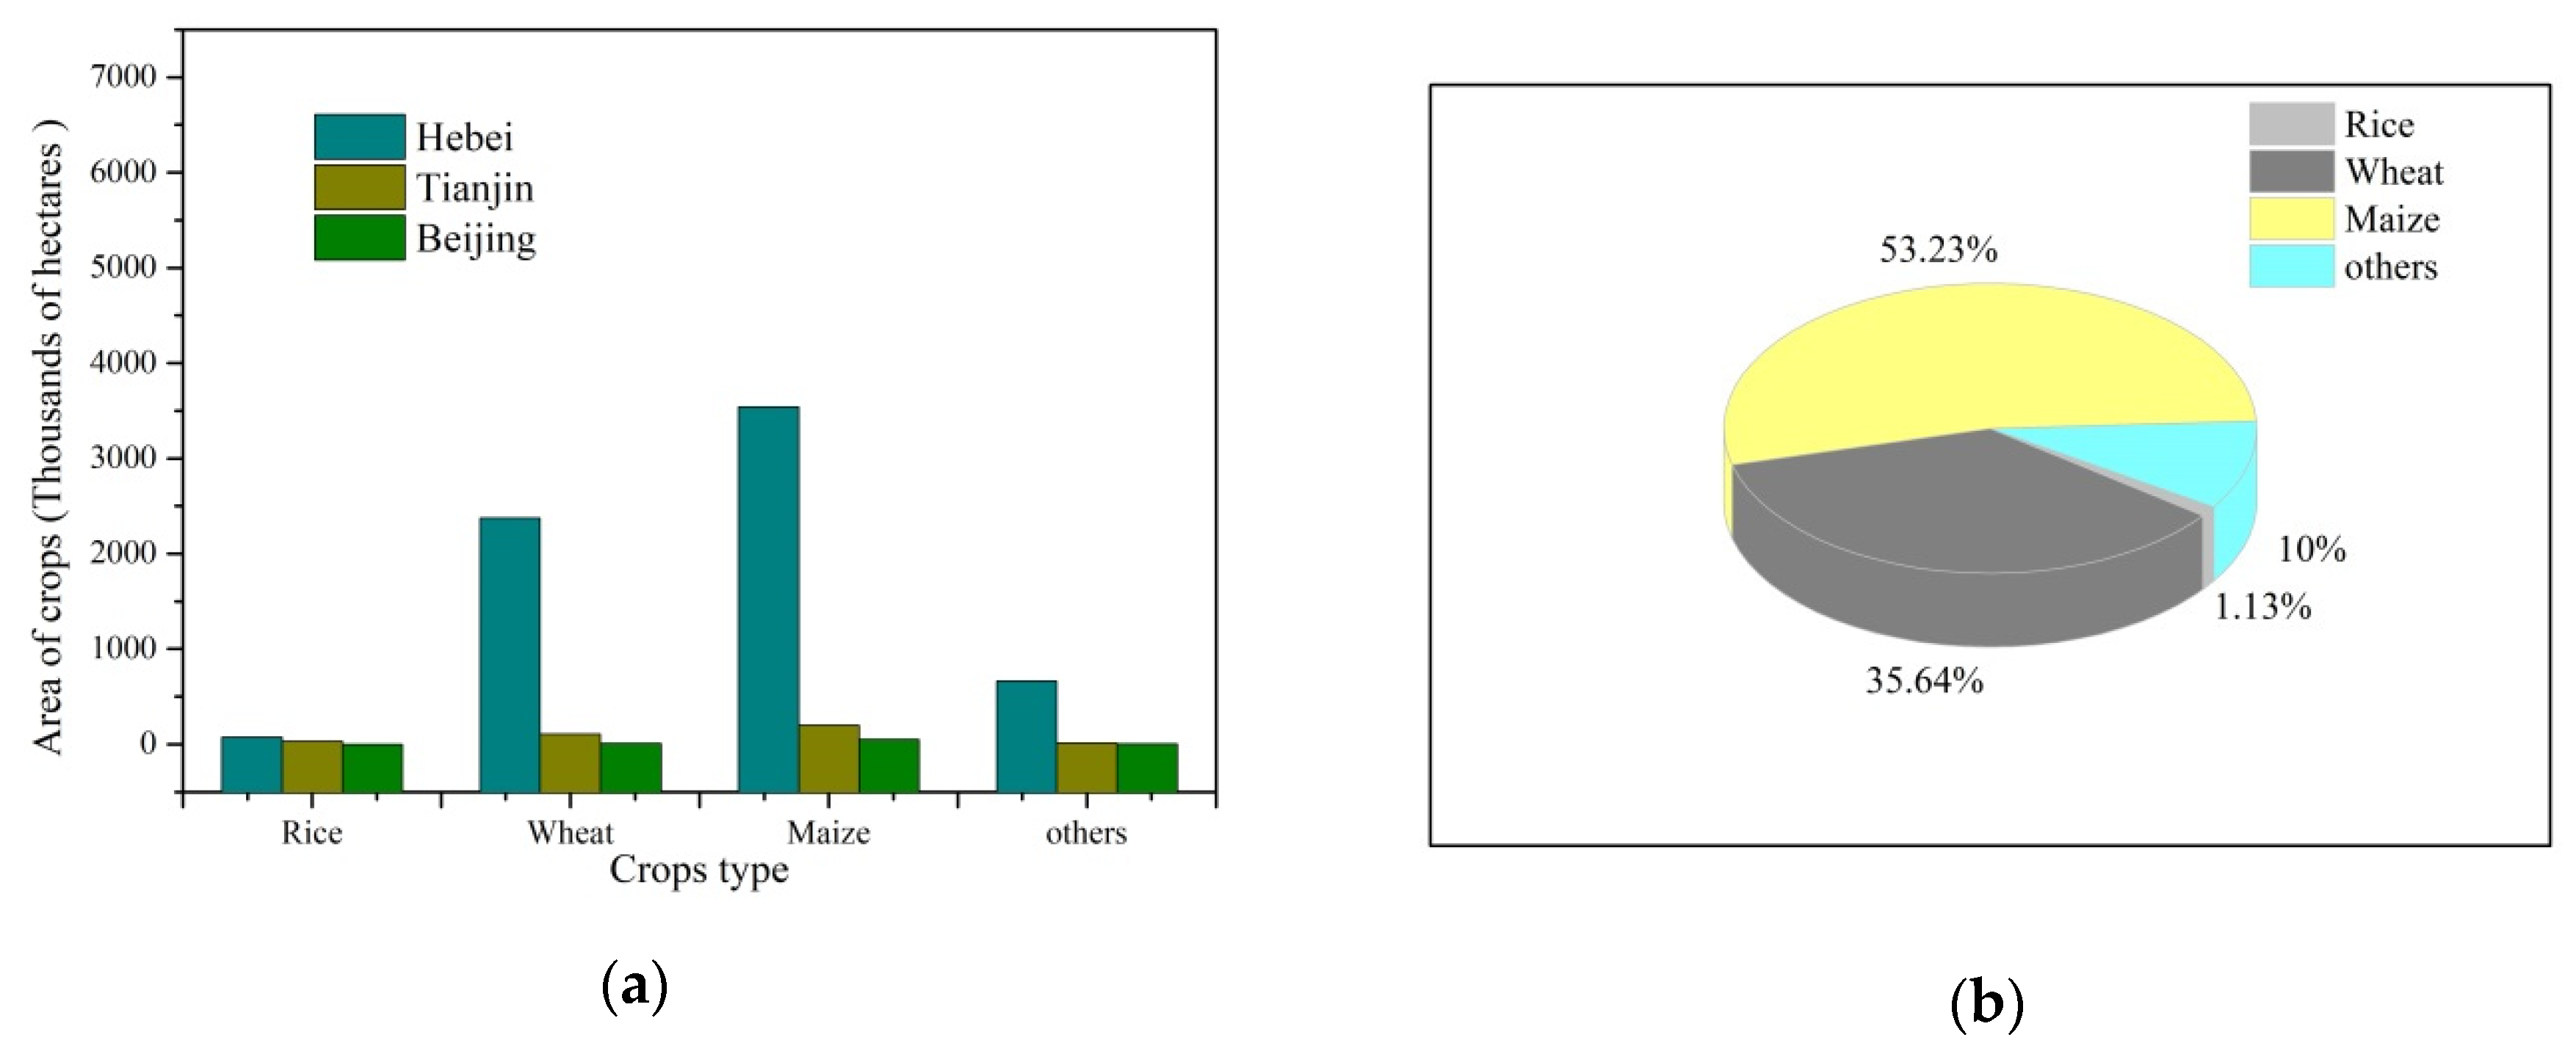
3.1. The Estimation of Crops Straw Bioenergy Potential

3.1.1. Crop Residues

Generally speaking, crops residues are inedible plant parts left in the field after harvest. Some researchers also classify residues from crop packaging plants or residues discarded during crop processing as general crop residues [19]. The National Bureau of Statistics does not record special statistics on crops residues yield. There are also significant differences in the nature and rate of decomposition of crops residues. Rather than being directly measured, crops residues yield are estimated based on area and yield data for different crops and from research information on the straw/grain ratio [31,64,65,66]. Crops straw residues equation as follows:
M i = 1 n C i r i β
where M i is the crops residues, C i is the crops yield, r i is the straw/grain ratio, n is the crop species, i is the number of crop species, and β is the collection coefficient. The straw/grain ratio of different crop species is shown in Table 1. The Appendix C is the straw/grain ratio range and collection coefficient.
In order to estimate the potential of straw residues resources, classified crops yield, per land area amount of crops, and per capita amount of crops of the B-T-H region in 2017 are shown in Table 2. The crops including maize, wheat, potato, peanut, sugar beet, rice, cotton, rapeseed, legumes, and tobacco. According to the official statistics presented in Table 2, maize and wheat production were 20.35 million tons/year and 15.04 million tons/year in Hebei province, respectively. However, the two regions of Tianjin and Beijing produced 0.12 million tons/year and 0.03 million tons/year of maize and 0.06 million tons/year and 0.06 million tons/year of wheat. Apparently, Hebei produced far more wheat and corn than Tianjin and Beijing combined. The rest of the crop yields are very low compared to maize and wheat. The reason for this phenomenon is that, in Hebei, the area sown for grain crops large (Figure 3a), and the area sown to wheat and corn is much higher than that of other kinds of crops (Figure 3b).
As a renewable resource, a large quantity of residue is produced annually by a wide range of crops grown in the B-T-H region. Crops residues of B-T-H region in 2017 are shown in Table 3. The estimated maize residues in the B-T-H region are 18.05 million tons, which is the highest amount of crop residue. Currently, estimated residues from Hebei constitute 93% of total residues from the region. Maize is the most widely grown crop in Hebei. Wheat residue production is about 15.098 million tons in 2017 in the B-T-H region; thus, maize and wheat together account for 91% of total crop residues in the B-T-H region. After corn, wheat is the second most widely used starchy crop for food or feed in the B-T-H region. Due to the lack of effective utilization in the B-T-H region, a large amount of concentrated agricultural waste (e.g., corncobs) is produced every year, causing environmental pollution. In the B-T-H region, crops residue is mainly used as food or feed, and this produces about 36.69 million tons of straw, stem, and leaf residues, which can be used in fermentation processes, considering that 50% of these residues are simply left in the field [19]. According to one calculation method [23], 3.49 billion liters of cellulosic ethanol could be produced from this surplus biomass. In addition, these residues can be made into solid fuel via densification technology. Song et al. studied the densified solid fuel of corn residues in district heating systems for rural and urban heating in winter [67]. The economic value of collected crop residues is shown in Appendix B.1.

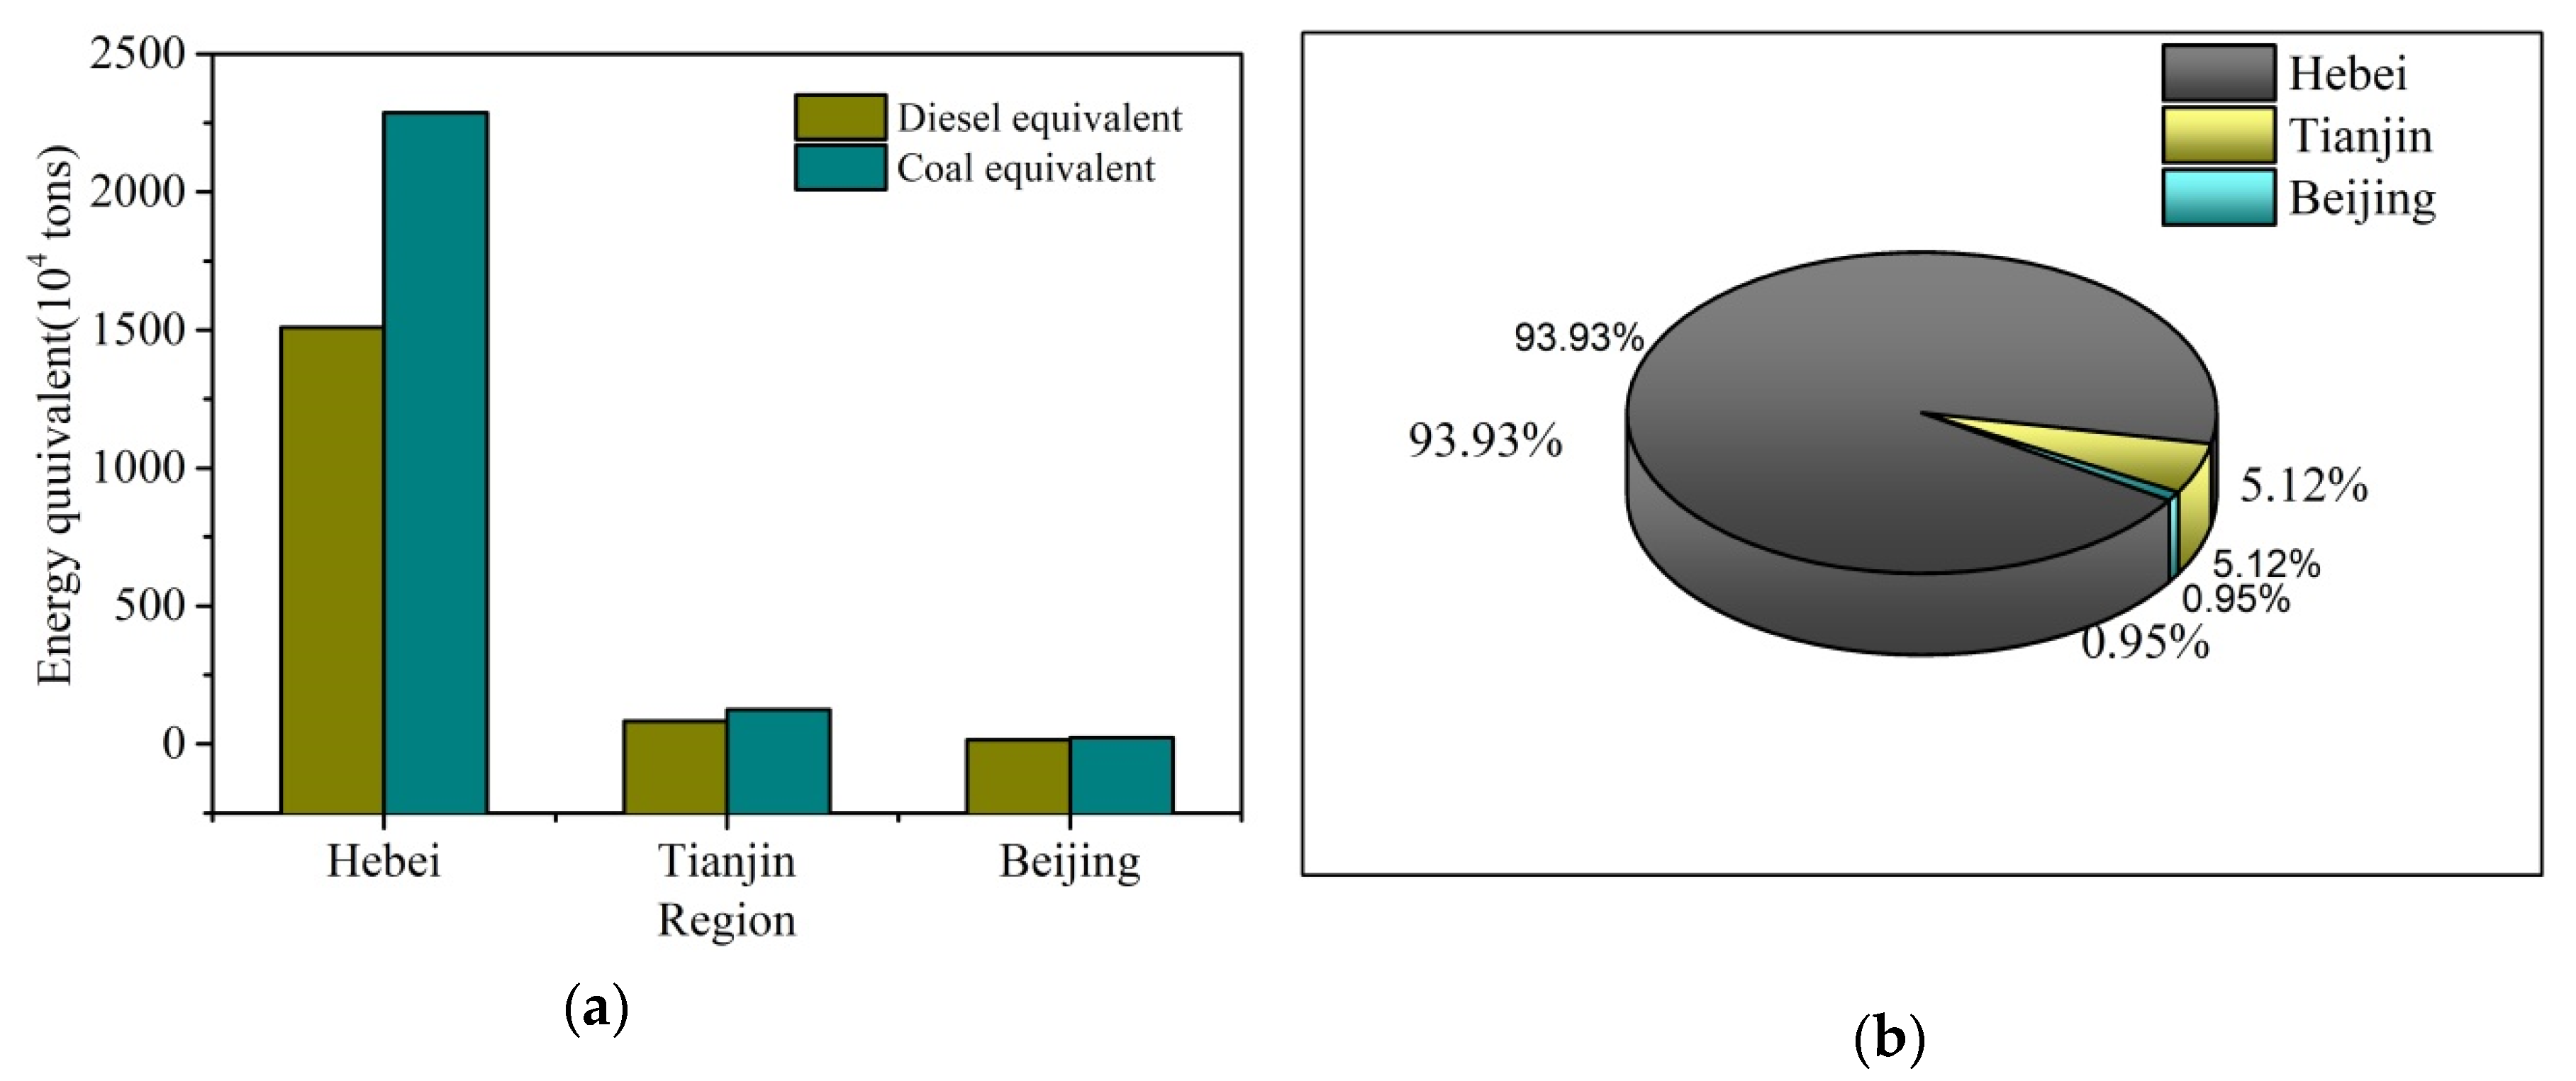
3.1.2. The Energy Potential Estimation of Crops Residues

Biomass energy is converted into the energy demand form used by consumers. It is necessary to convert crop residues into available forms of heat, electricity, or solid fuels. The solid fuels for home heating or cooking can replace coal. In the B-T-H region, families install modified coal gas plants in order to use natural gas for heating or cooking, so it is very important to estimate the energy end-use value.
Formula for calculating energy potential of crop straw is as follows [75]:
Q i = 1 n M i k i
where Q i is the energy potential of the crop straw and k i is the low value of the crop coal coefficient.
The heating value of crop residues is about 3 × 10⁶ kcal/Mg (1 Tg = million Mg), which is about 50% of that of coal and 33% of that of diesel [76]. The value of crop residue energy varies with different kinds of crops. For example, the energy value of rice is 3015 kcal/kg, and that of hay is 3738 kcal/kg [78]. Besides, the crop residue fuel value is 18.6 × 10⁹ J, two barrels (bbl) of diesel, 3 × 10⁶ kcal, or 16 × 106 BTU [79]. In this paper, the same coefficient of folded coal is applied to the estimation of crop residue energy. Table 4 presents the coal equivalents for crops residues in the B-T-H region for the year 2017. According to these estimates, straw resources in the region have a potential of about 36.52 million tons of coal equivalent (Table 3). As corn and wheat straw resources are the largest, their crop residue coal equivalents are also highest, at 9.02 million tons and 7.5 million tons, respectively. Hebei has the highest share of crop residue coal equivalence, with a value of about 17.15 million tons, which is equal to 0.1 ×10¹⁵ kcal of total energy of crops residues in this area and accounts for 93% of the B-T-H region. Tianjin’s and Beijing’s share of the straw are far less than the potential resources of Hebei, with coal equivalent values 0.93 and 0.17 million tons, respectively, which are equal to 0.5 × 10¹³ kcal and 0.75 × 10¹² kcal (Figure 4). Obviously, the crops residues potential of the B-T-H region is enormous. Hebei is the region with the greatest potential for the use of crop residues in energy generation. Therefore, according to the characteristics of the B-T-H region, in terms of crop residue biomass resources, there is a huge market for energy development in Hebei.

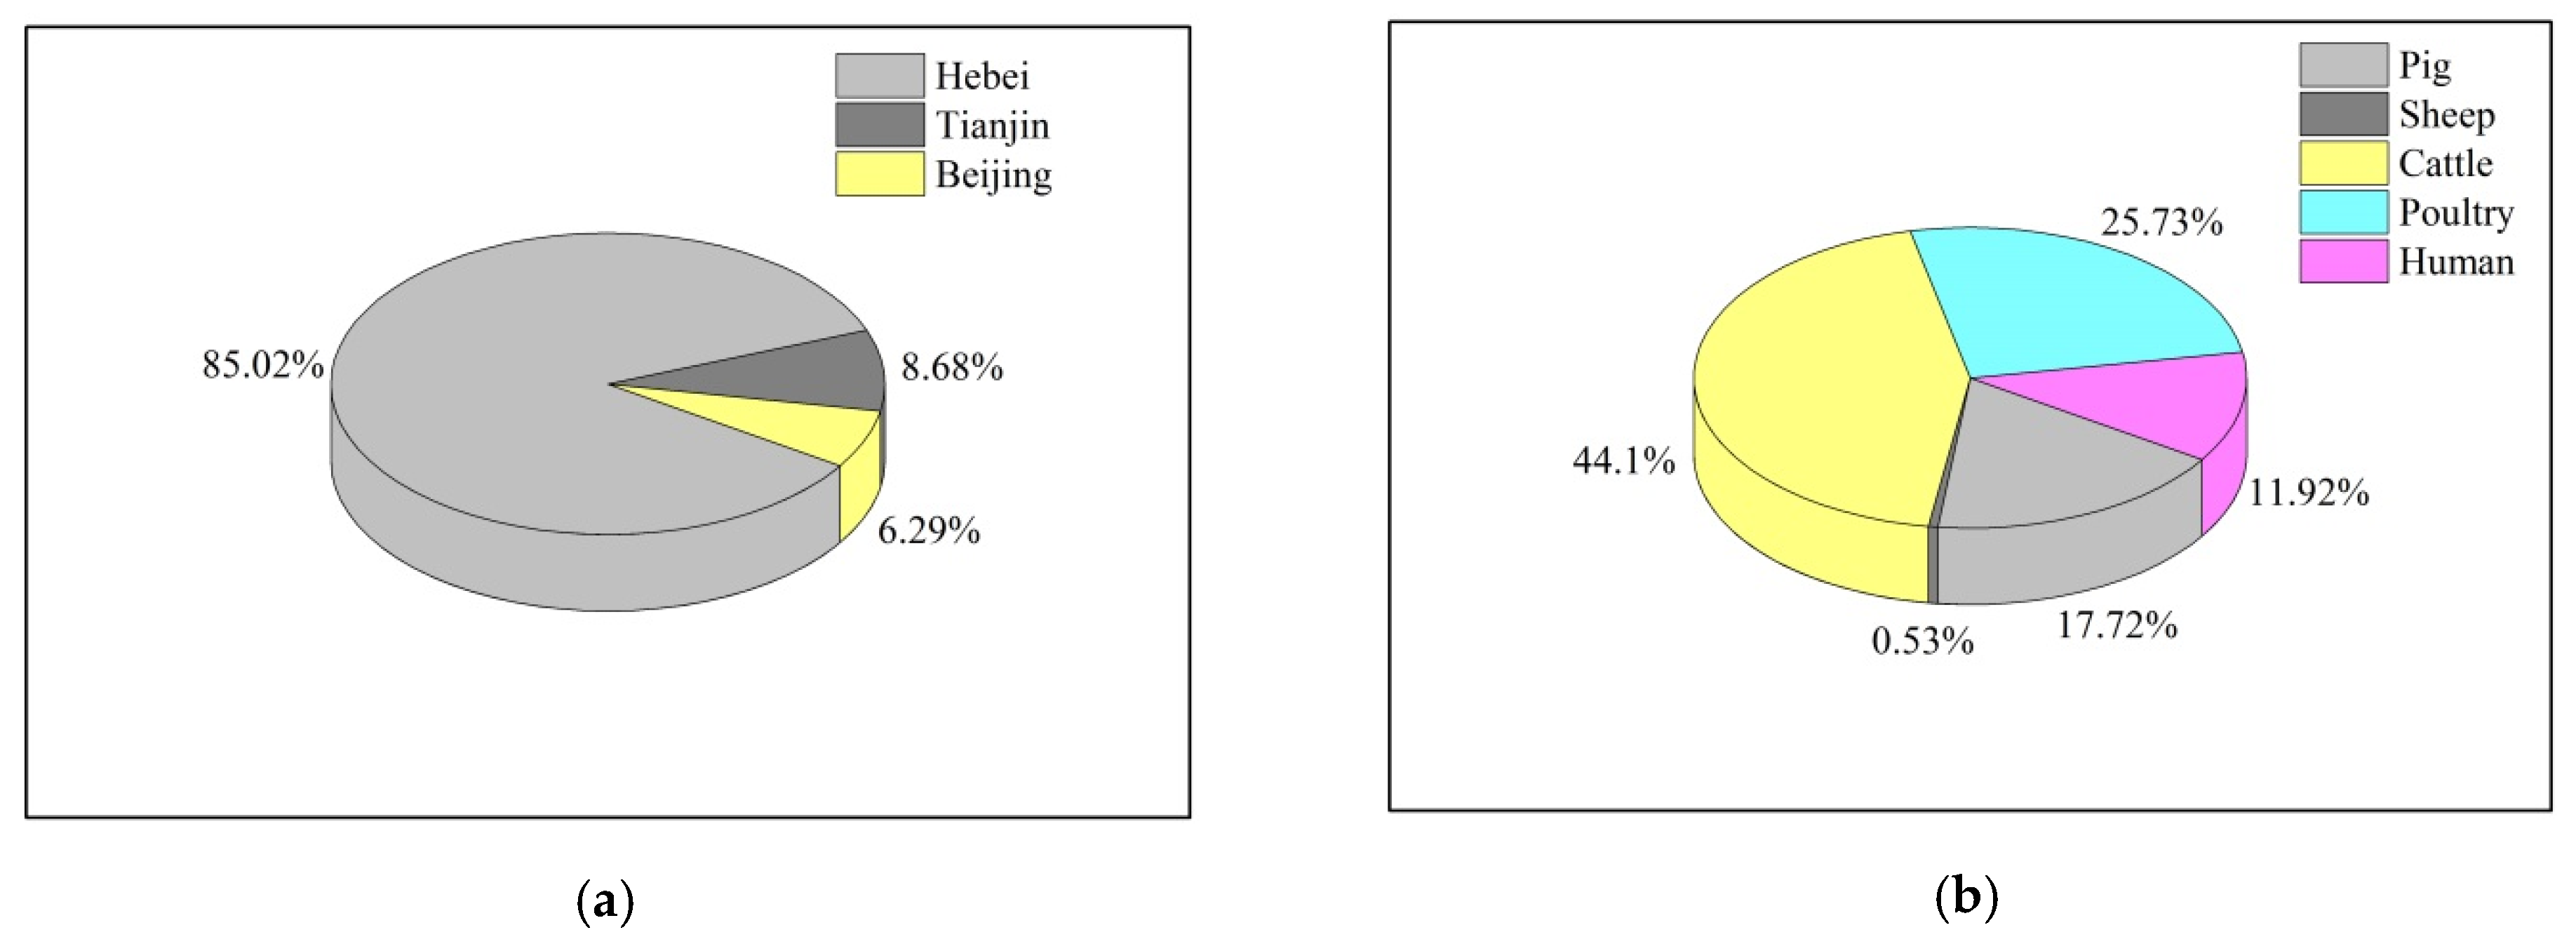
3.2. The Estimation of Human, Poultry, and Livestock Manure Bioenergy Potential

3.2.1. The Estimation of Human, Poultry, and Livestock Manure Production

Livestock and poultry manure are important biomass resources and are the main raw materials of biogas fermentation. The development of livestock and poultry breeding has produced a large amount of feces. If it is not treated, directly piled up, or discharged at will, serious ecological and environmental problems will result, which will pollute water and air and waste organic nutrient resources. From the perspective of circular agriculture and economy, livestock and poultry are ideal sources of biogas raw materials. The biogas project organically combines pollution control of livestock and poultry waste with energy recycling, thus promoting the healthy development of the livestock and poultry breeding industry and alleviating energy shortage problems.
This section is mainly based on the livestock and poultry species, livestock and poultry output, and end-of-year data provided by the National Bureau of Statistics, which is combined with the excretion coefficient, feeding cycle, COD emissions, and methane production coefficient to estimate the physical volume [80,81], methane production volume, and energy potential of livestock and poultry feces resources in the B-T-H region in 2016. COD is the general term for the amount of organic matter in feces.
Livestock and poultry excrement and COD yield are calculated as follows [75]:
M j = ξ 1 n ( N i T i η j a + N j T j η j b )
Where M j is poultry and livestock manure production, ξ is collection coefficient of 60%, N j is breeding quantity, T j is feeding cycle, η j a is fecal coefficient, η j b is urinary fecal coefficient, j is livestock and poultry species, and j = 1, 2, 3 ... n.
The feeding cycle for pigs is 199 days; the feeding cycle for cattle, sheep, horses, donkeys, and poultry is more than one year, and 365 days is the feeding cycle. Table 5 shows the excretion coefficient, COD production coefficient, and feeding cycle [75,77,80,81].
Livestock waste can be used in three ways—as fertilizer, feed, and energy. To estimate the energy potential of human, animal, and poultry wastes, the number of humans, animals, and poultry must be found. Fecal-based feeds are currently not recommended due to potential safety concerns. In the anaerobic fermentation process, the manure can produce methane and provide organic matter, so it is recommended that the manure be converted into energy fertilizer in order to extract biogas from the slurry [67]. The quantity of humans, livestock, and poultry is shown in Table 6. The B-T-H region is home to large populations of humans, livestock, and poultry.
According to Table 7, the total excrement production in the B-T-H region is about 159.63 million tons, including human feces, of which the total livestock and poultry excrement production in Hebei region is 139.35 million tons, 12.05 million tons in Tianjin, and 7.63 million tons in Beijing, respectively. The total livestock and poultry excrement production in Hebei accounts for 87.21% of the whole B-T-H region. Therefore, the excrement in the B-T-H region mainly comes from Hebei. In terms of livestock and poultry species, poultry feces in the B-T-H region ranked first, accounting for 35.33% of the total, followed by cow feces (accounting for 33.03%), pig feces (accounting for 15.65%), and sheep feces (accounting for 14.29%). The excrement of horses, donkeys, mules, and humans is very small, and the excrement of these three kinds of livestock are 0.02 million tons total. It can be seen that cattle, poultry, pigs, and sheep are the main sources of feces in the B-T-H region. The proportion of human, animal, and poultry excrement in Tianjin and Beijing is basically the same as that in Hebei.
COD is the general term for the content of organic matter in feces, and methane is mainly produced by COD. Therefore, it is very necessary to calculate the amount of COD in feces in order to calculate the potential methane produced from feces. Table 8 shows the amount of COD produced by livestock and poultry feces in the B-T-H region. As can be seen from Table 8, the main human, livestock, and poultry COD production in the B-T-H region is 15.46 million tons, of which Hebei accounts for 85.02% of the total, Tianjin accounts for 8.68%, and Beijing accounts for 6.29% (Figure 5). The amount of COD produced by cattle accounts for 44.06% of the total, the amount of COD produced by poultry accounts for 25.69% of the total, the amount of COD produced by pigs accounts for 6.91% of the total, and the amount of COD produced by sheep is very small (accounting for approximately 0.53%).

3.2.2. The Energy Potential Estimation of Human, Livestock, and Poultry Waste

The energy potential of livestock and poultry manure is estimated by the amount of biogas produced by COD in feces. The biogas potential formula from manure is as follows [75]:
W j = 1 n M C O D g β
where W j is the biogas potential from manure, M C O D is the COD yield, g is COD removal rate, value of 85%, β is the methane coefficient produced by COD, which is 0.538 m3/kg.
Table 9 shows the potential of the B-T-H region to produce biogas, which is estimated to be 7.07 billion m3. The livestock and human manure capacity for Hebei province is 6.01 billion m3, accounting for 85.55% of the total. The poultry and animal feces biogas production quantity of Tianjin was 0.61 billion m3, accounting for 8.66% of the total. For Beijing, the poultry and animal feces biogas production quantity is 0.44 billion m3, accounting for 6.28% of the total. The coal equivalent of feces waste for the B-T-H region is shown in Table 10. The coal equivalent energy potential of human, livestock, and poultry wastes is 5.18 million tons. According to Table 9 and Table 10, the potentials of total livestock and human manure in the B-T-H region are significantly different between regions, which may be ascribed to the level of economic development, population base, and topography. The economic evaluation is shown in Appendix B.2.

3.3. The Estimation of Municipal Solid Waste (MSW) Bioenergy Potential

3.3.1. The Production of MSW

Municipal solid waste (MSW) refers to materials disposed of in urban areas, including domestic waste and commercial waste, which are collected and disposed of by municipal authorities [82]. The three main MSW disposal methods are landfill, incineration, and composting [83]. The dominant form of wastes disposal in China is landfill, handling over 80% of the treated MSW [84]. Methane is produced as a byproduct of the anaerobic decomposition of MSW in landfill [85]. According to statistics, the per capita daily garbage production volume of large cities is up to 1.4 kg and about 1 kg in small and medium-sized cities [77].
The astonishing amount of municipal solid wastes produced per year is presented in Table 11. The municipal solid waste clearance is 9.24 million tons in Beijing, 6.99 million tons in Hebei province, and 3.06 million tons in Tianjin, respectively, which amounts to a total of 19.31 million tons in the B-T-H region. Harmless garbage treatment no longer pollutes the environment and can be used. The rate of harmless garbage treatment has reached more than 99%, according to the National Bureau of Statistics. According to Table 11, harmless waste disposal amounted to 9.23 million tons in Beijing, including 4.38 million tons of sanitary landfill waste and 3.26 million tons of burning waste, which is the largest amount in the B-T-H region.

3.3.2. The Energy Potential Estimation of MSW

The calculation formula for methane production from municipal solid waste landfill treatment is as follows [65]:
M CH 4 = ( M T × M F × L O R ) × ( 1 O X )
where M CH 4 is the methane yield of domestic garbage (104 tons), M T is the volume of urban domestic garbage collection (104 tons), and M F is the sanitary landfill treatment rate of urban domestic garbage. L O is methane production potential per ton of garbage in each management plant, and R is methane recovery volume of 0, O X is oxidation factor of 0.1.
L O = ( MFC × DOC × DOC F × F × 16 / 12 )
where MFC is the methane correction factor of each management plant landfill, and the MFC of a well-managed landfill is 1, DOC refers to biodegradable organic carbon (kg carbon/kg waste) in domestic waste (with a value of 9.0%), DOC F is the decomposable DOC ratio in household garbage (whose value is 0.5), F is methane volume ratio of 0.5, and 16 / 12 refers to the molecular weight ratio of methane to carbon [75].
The energy potential of methane from municipal solid wastes landfill is calculated as follows:
E = M CH 4 × d × k
where E is the energy potential of methane production from urban domestic waste (104 tons standard coal), M CH 4 is the methane production volume of urban domestic waste, d is the density of methane of 0.69 kg/m3, k is the conversion coal coefficient of methane, the low calorific value of methane is 35,822 KJ/m3, and the conversion coal coefficient is 1.78 [75].
The energy potential estimation of MSW is shown in Table 12. In terms of total amount, the total amount of methane treated by urban household waste in the B-T-H region is 0.27 million tons (384 million m3), equivalent to 0.47 million tons of standard coal. From a regional perspective, Beijing has the highest methane production from urban household waste, with an output of 0.12 tons, followed by Hebei with 0.11 million tons, and Tianjin with 0.04 million tons.

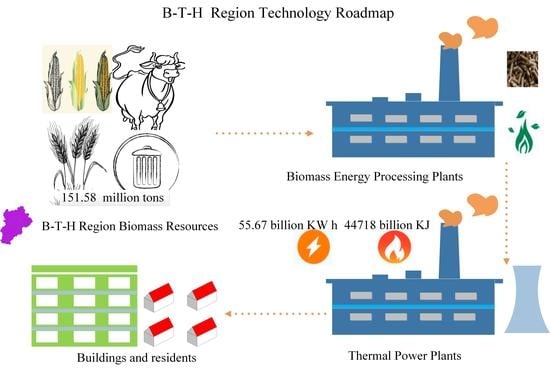
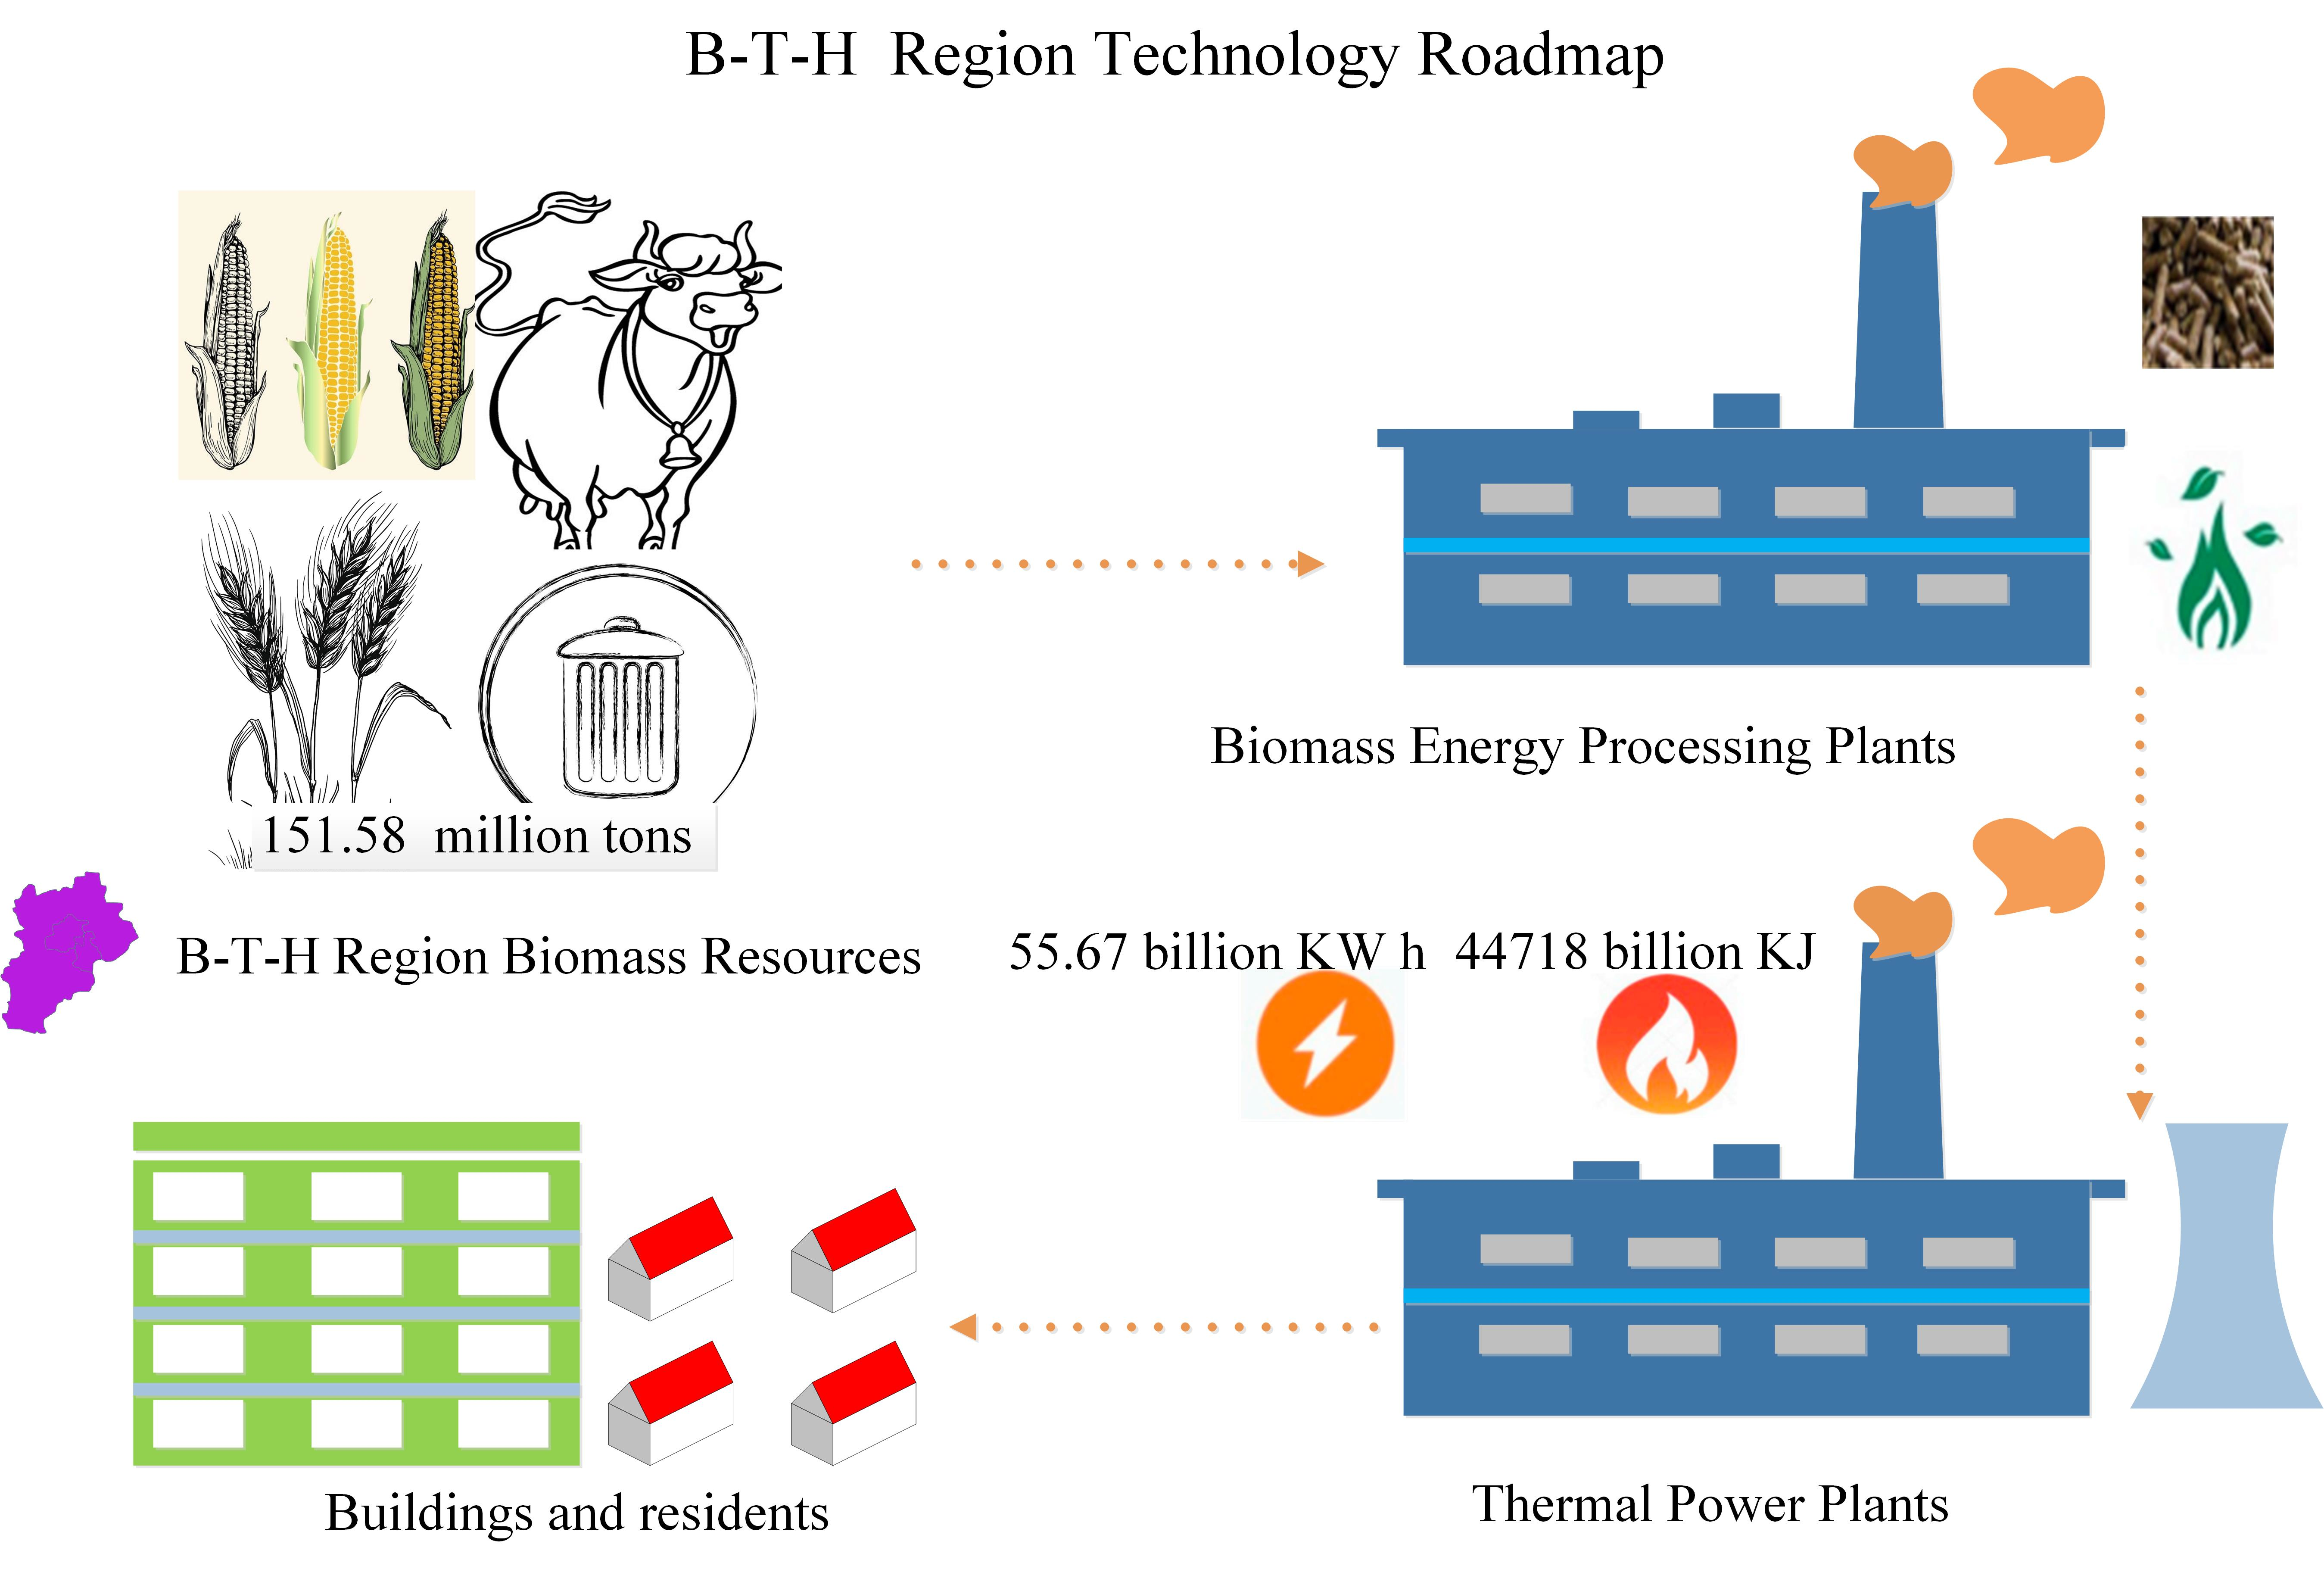
4. The Technology Roadmap of the B-T-H Region

By estimating the available potential of B-T-H region, the distribution of crops residues; human, poultry, and livestock manure; and MSW are illustrated in Figure 6a–c, respectively. In terms of crop residues, Hebei has abundant biomass resources, of which the crop residue coal equivalent is more than 18 million tons (Figure 6a). It can be concluded from Figure 6b that MSW resources are mainly distributed in Beijing. According to Figure 6c, the human, poultry, and livestock manure resources are mainly concentrated in Hebei. As a result, economically underdeveloped areas are rich in crop residues and livestock and poultry excrement resources, and economically developed cities are rich in urban household garbage.
On the basis of abundant biomass resources in the B-T-H region, the suitable technology roadmap of biomass energy development in the B-T-H region from a resource perspective is shown in Figure 7, where the light orange items represent the technology roadmap for the B-T-H region. The biogas roadmap presents the movement from garbage, human waste, and animal waste to building energy demand, which is suitable for the development of the B-T-H region’s urban household garbage and livestock manure biomass resources. The densified solid roadmap presents the movement from the corn straw, wheat straw, and forestry wastes to building energy demands. Forest resources in B-T-H region are limited, so this paper does not address their use.
When biomass raw materials are collected, processed, and converted into usable energy forms, energy waste and incomplete conversion are inevitable. Due to technical problems, conversion efficiency is crucial to the full utilization of energy. Of course, in the process of using energy, the loss of equipment will waste a certain percentage of energy. Therefore, the energy conversion parameters from raw materials collection to energy utilization is shown in Table 13. Figure 8 gives the energy gird in each progress according to references [67,75,76,77]. Urban household garbage and livestock waste resources are used by advanced gasification and fermentation technologies, which can obtain 7.45 billion m3 of biogas. Furthermore, biogas is used to generate electricity and heat. Based on the excrement conversion efficiency of 75.83% and utilization efficiency of 55% [65], biogas in the B-T-H region can generate 79.45 billion KJ heat (Figure 8).
Although methane power generation technology is not as mature as methane heating technology, the application of biogas in power generation can still be used as the roadmap for biomass energy technology in the B-T-H region. The goal of the technology roadmap is to accelerate the deployment of specific technologies or groups of technologies; therefore, it is also a challenge for the biomass energy technology to make a good use of urban household garbage and livestock and poultry excrement for power generation in the B-T-H region. If the biogas power generation conversion efficiency is the same as that of crop straw (1.25 KW h/m3 and utilization efficiency of 45% [77]), then 9.30 billion KW h of electric energy will be produced (Figure 8). Buildings such as shopping malls, homes, and office buildings need to consume a lot of electric energy every day and a lot of thermal energy in the winter. Therefore, the electric energy and thermal energy generated by livestock and poultry excrement and urban household garbage in the B-T-H region can be used for the heat and power consumption of buildings. Among various biomass uses, densification technology is a typical means of the crop residue conversion. Crops residues are produced, harvested, collected, pretreated, stored, and converted into solid particles. Assuming that the compressing and shaping technology conversion efficiency is 92% and the utilization efficiency is 55% with a caloric value of 12,572.70 KJ/Kg [77], then 54,576 billion KJ will be generated. If the crop residue power generation conversion efficiency is the same as that of forest biomass (0.56 kW h/Kg [77]), it would product 12.654 billion kW h, which can be used in buildings (Figure 8).
According to references [86,87,88], the total energy demand of B-T-H is 455.29 million tons of coal equivalent, which is shown in Table 14. Among them, the percentage of total energy demand for coal, petroleum, and natural gas in Hebei are 87.31%, 7.97%, and 4.23% respectively. We found that the total residential demand of Tianjin and Beijing are 11.02 and 16.97 million tons coal equivalent. So, a final calculation on how much percent of the total energy demand can be obtained from biomass is completed. The total 29.31 million tons of coal equivalent calculated from biomass wastes can account for 5.30% of the total energy demand of B-T-H and exceeds 5% of the total residential demand in Tianjin and Beijing. Therefore, only 5.30% of the total energy demand can be provided from biomass wastes for the B-T-H region’s total energy demand, but it can address the energy needs of some residents in Beijing and Tianjin. Therefore, it is very necessary and wise to pursue this technology roadmap.

5. Conclusions

This paper conducted research into the estimation of the B-T-H region’s biomass energy potential from crop residue, livestock and poultry manure, and municipal solid wastes by the statistical data estimation method. According to the characteristics of the three types of energy potential in the B-T-H region, the corresponding technology roadmaps have been formulated. The available energy of biomass is obtained by a comprehensive consideration of energy utilization and energy efficiency.
The following conclusions may be drawn:
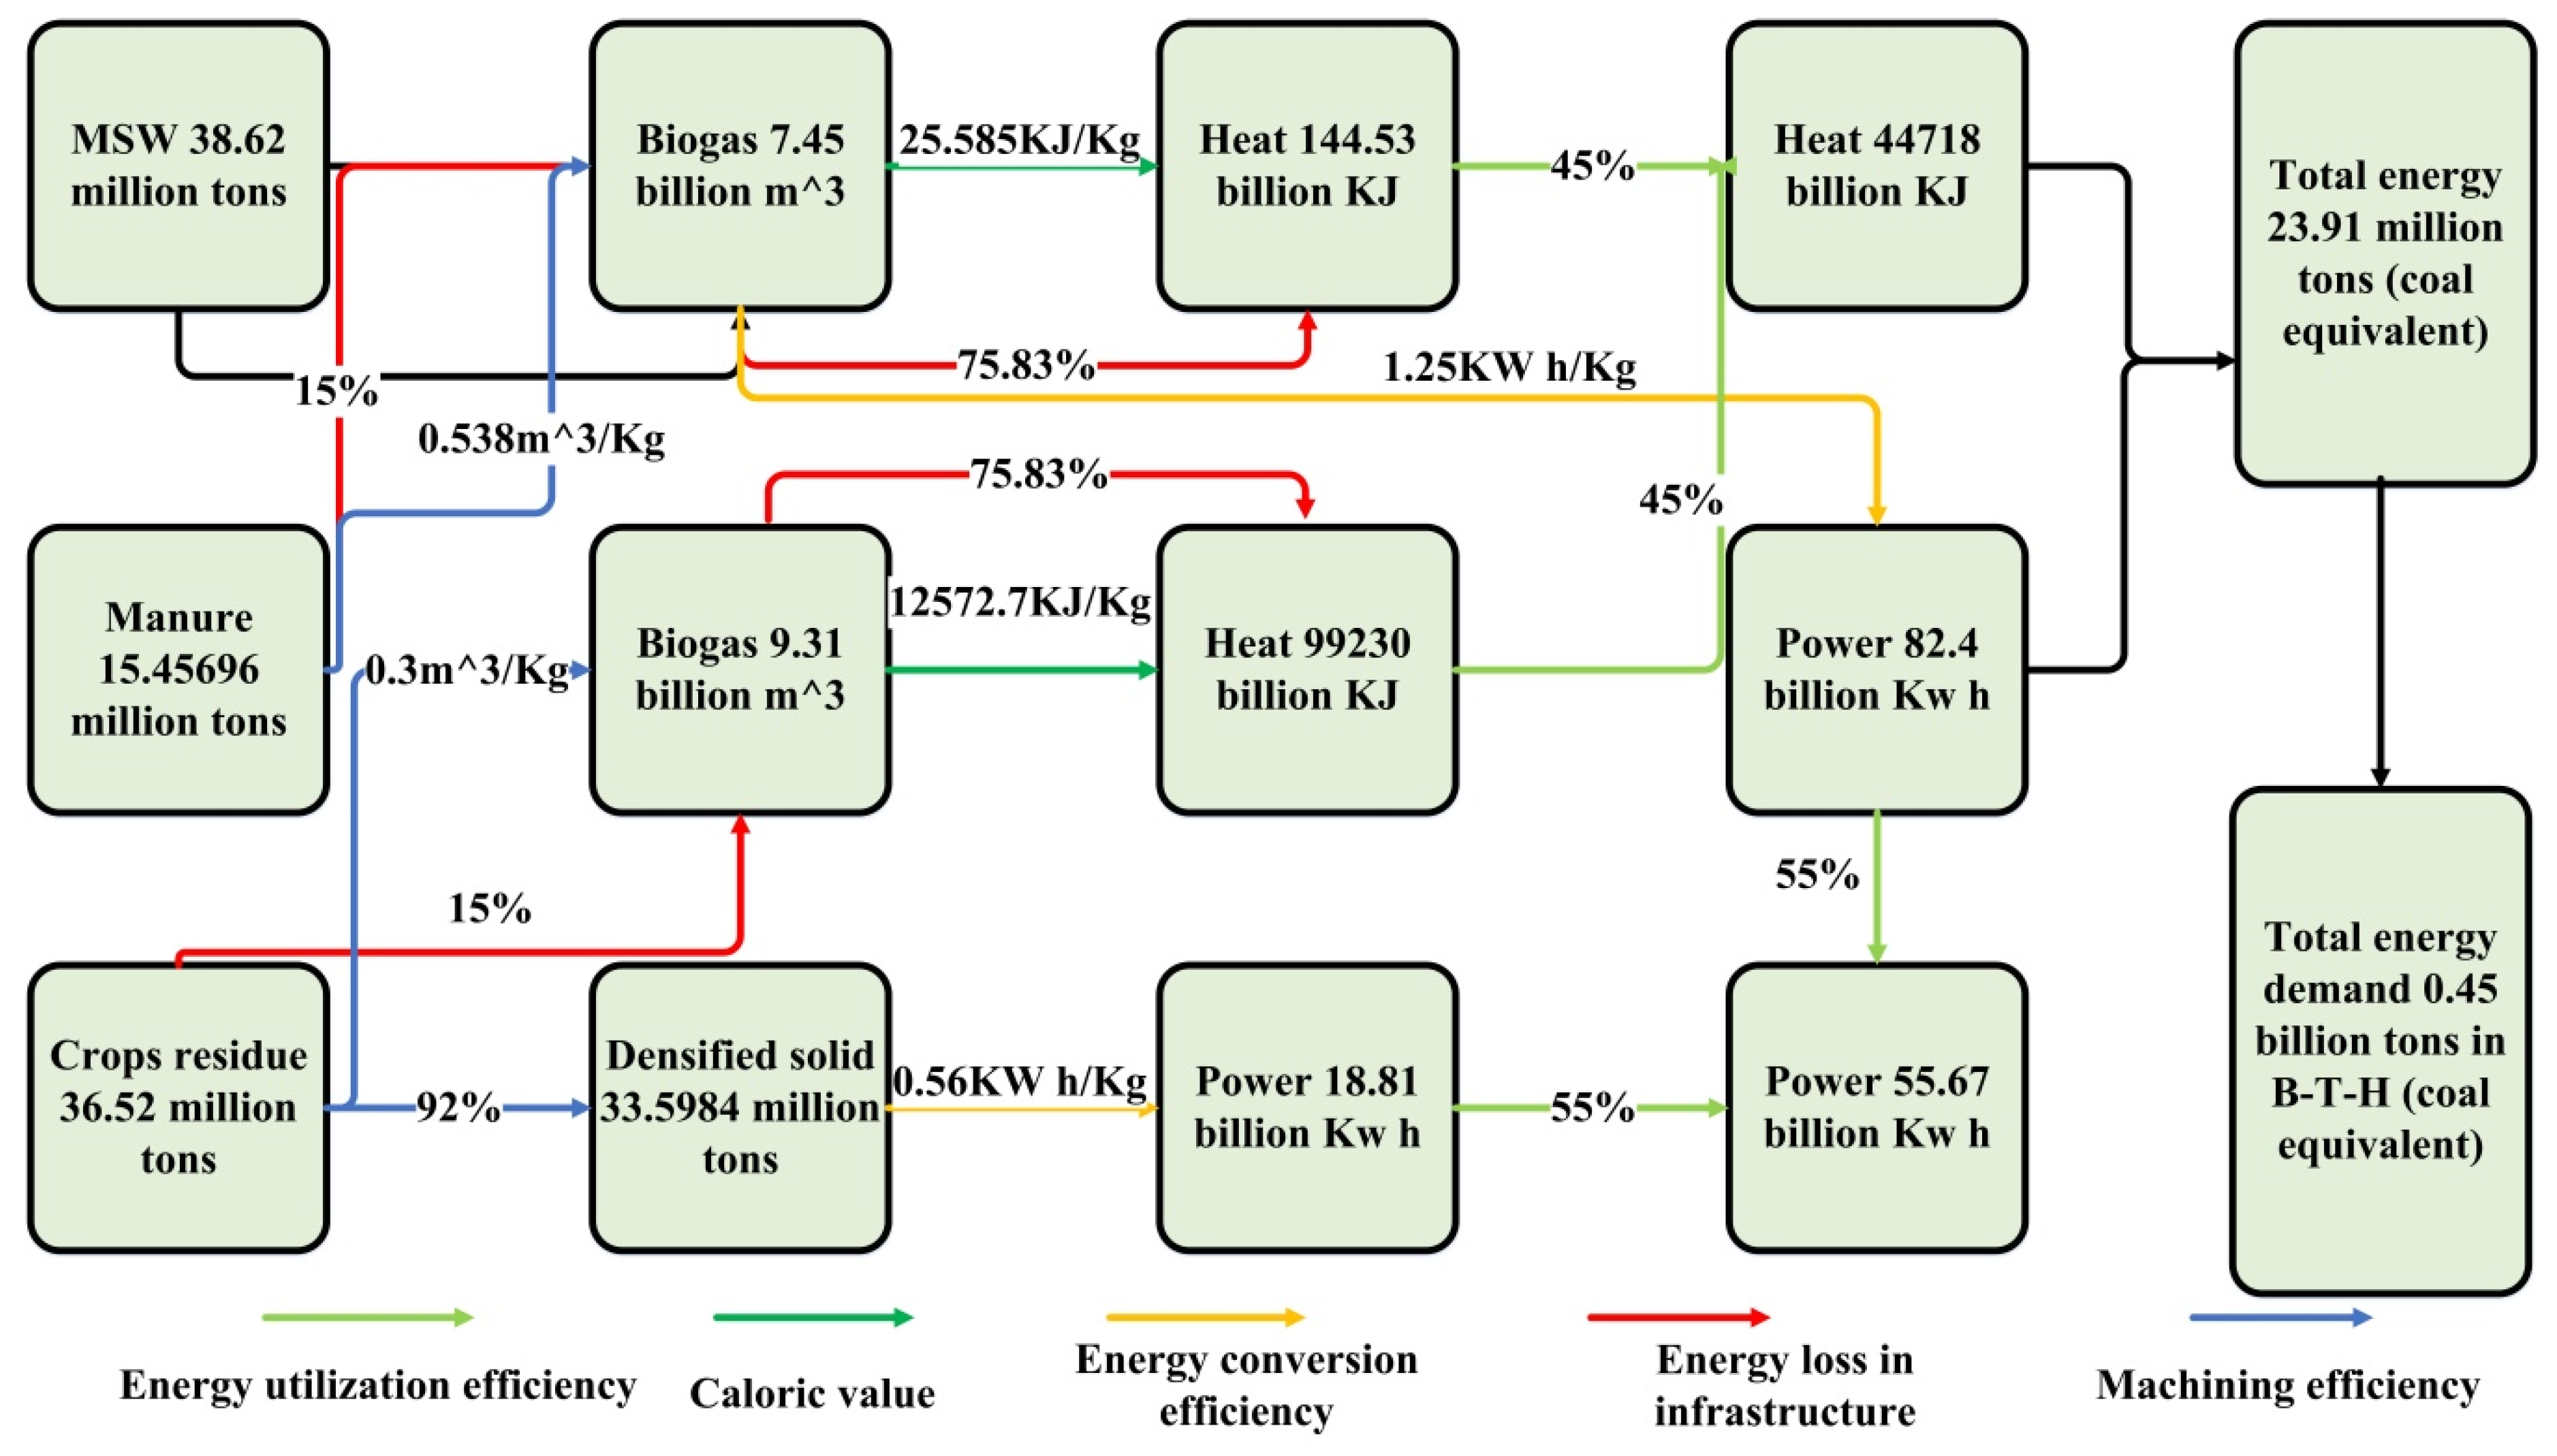
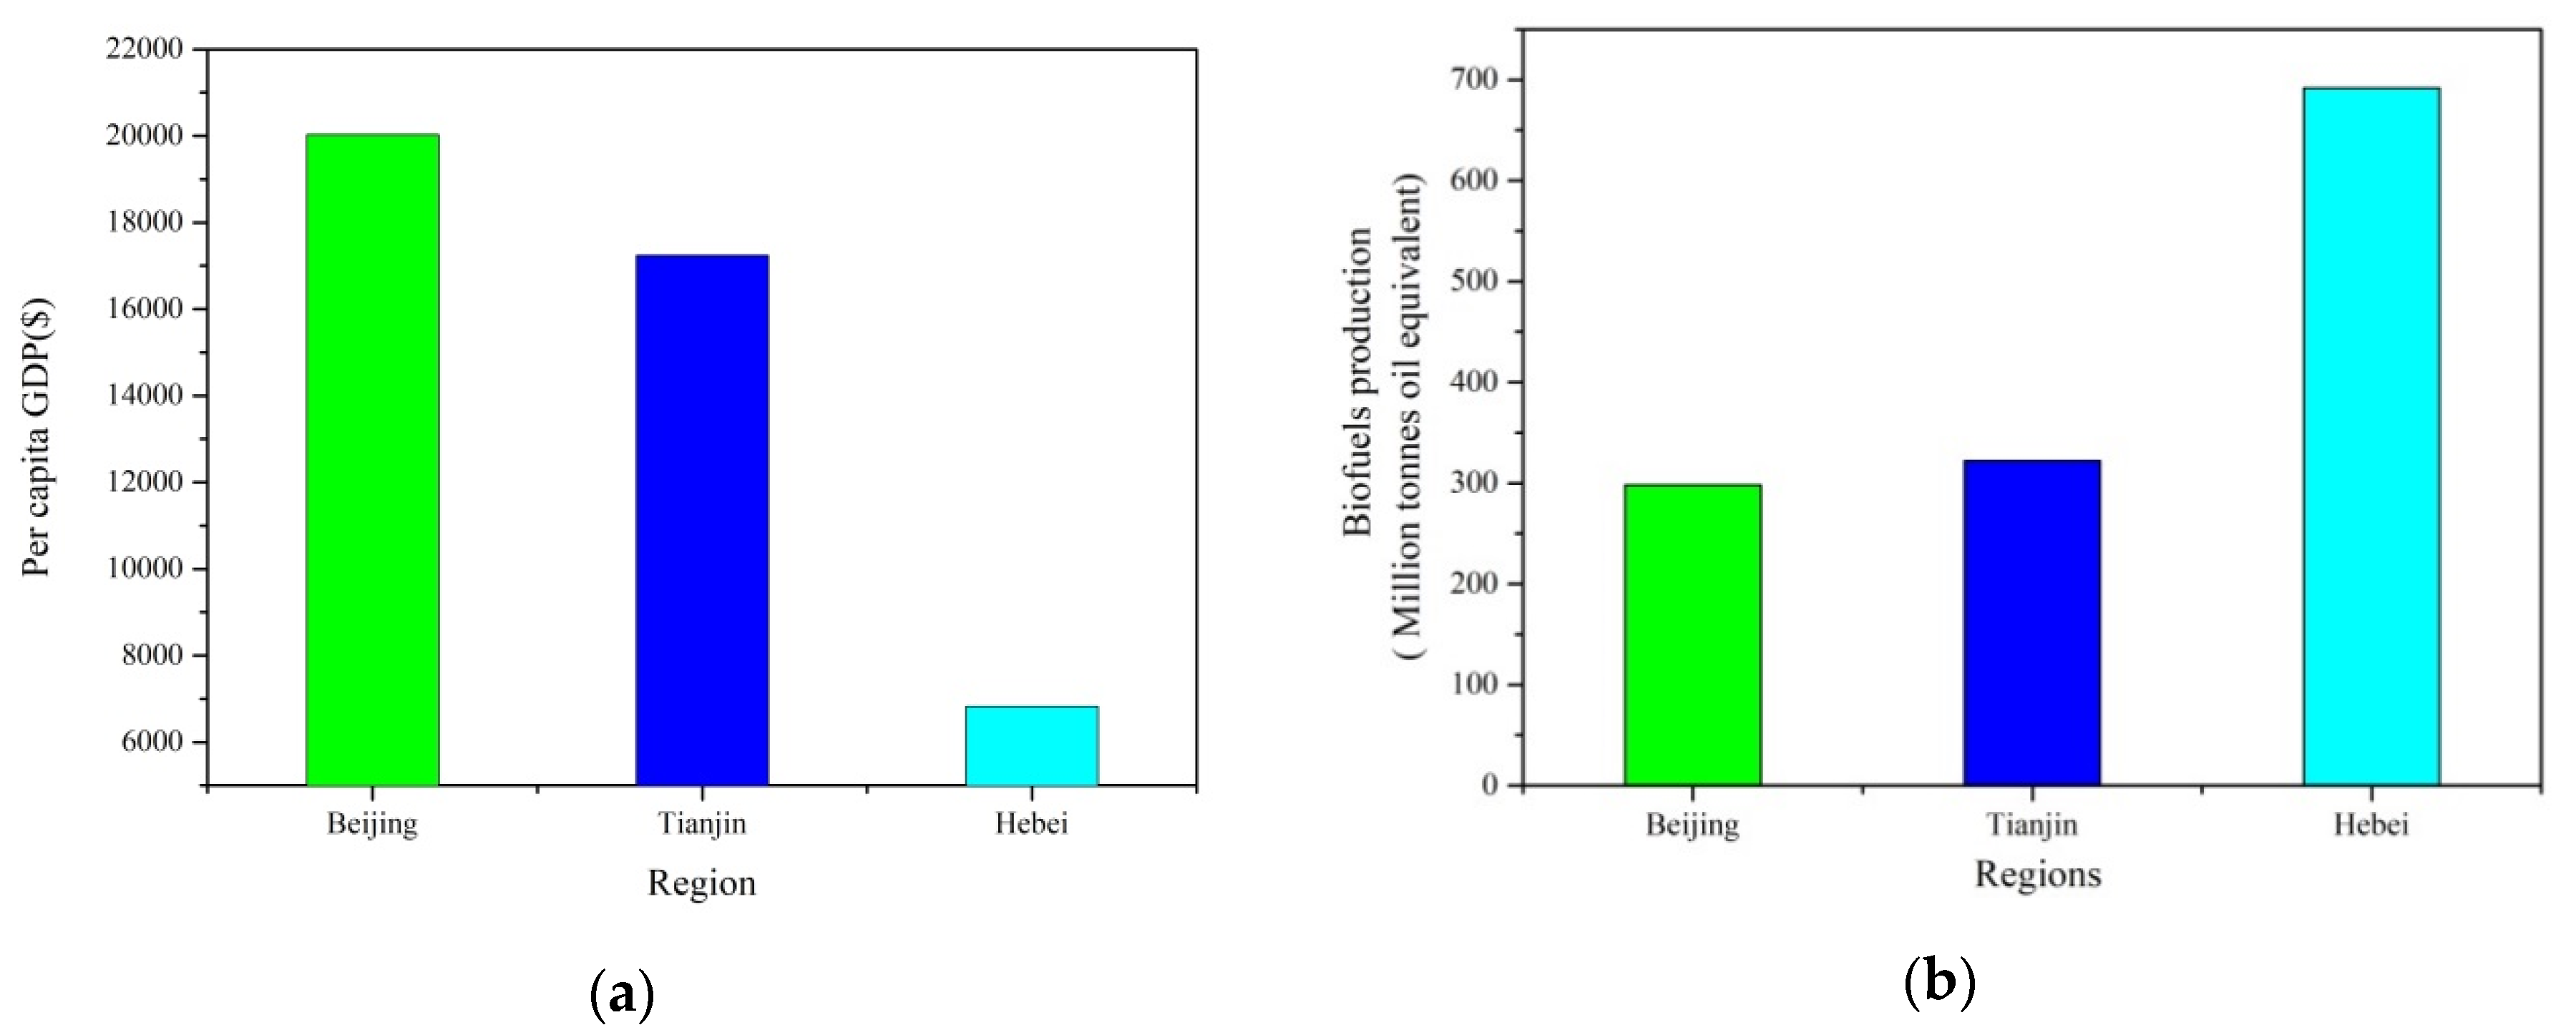
  • Through statistical data analysis, the total available biomass resource is 90.60 million tons, of which 36.52 million tons come from crop residue, 15.46 million tons from manure, and 38.62 million tons from MSW. The crops residue potential of Heibei region is enormous, accounting for 93% of the B-T-H region total, which is equal to 0.10 × 10¹⁵ kcal of total energy of crops residues in this area. Therefore, a huge energy development market in Hebei may exist.
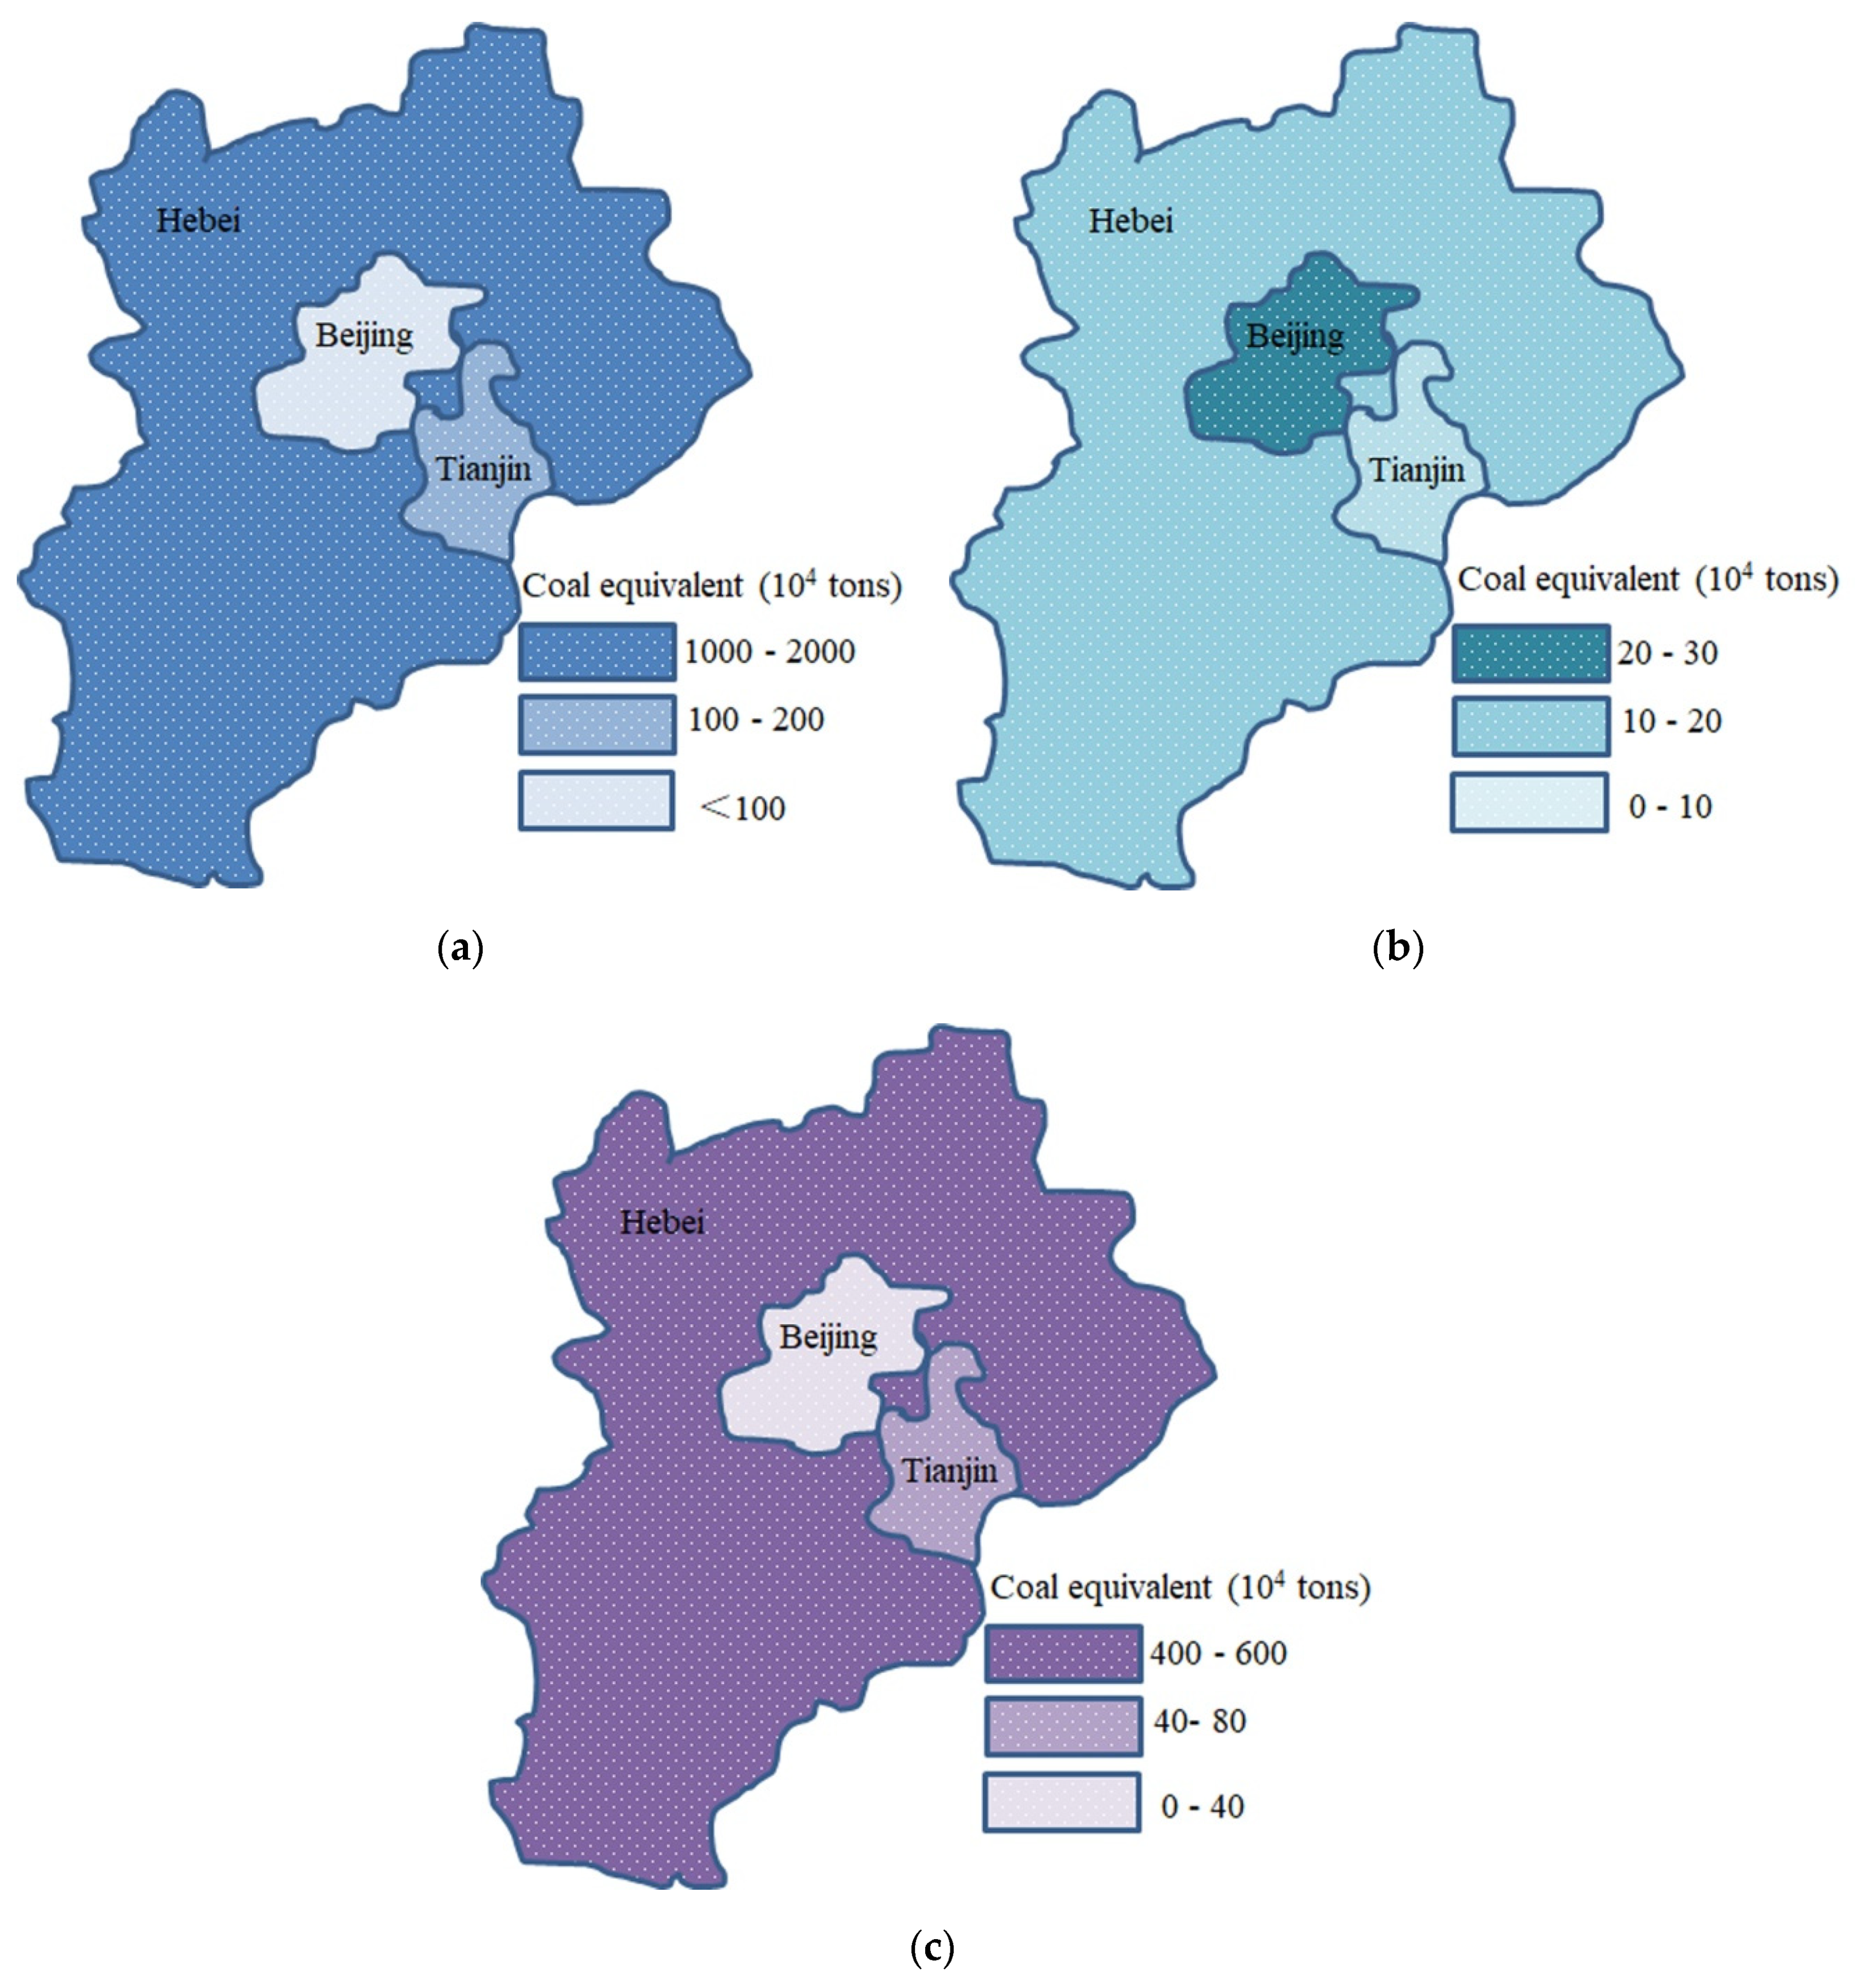
  • The potentials of crops residue and livestock and human manure in the different components of the B-T-H region have significant regional difference, which may be ascribed to the level of economic development, population base, and topography. From a resource perspective, the suitable technology roadmaps are the biogas development roadmap and the densified solid development roadmap.
  • Taking into conversion efficiency and energy use efficiency account, an estimate of the final energy use of available biomass energy is obtained. The total available bioenergy of heat is 44,718 billion KJ, the total available bioenergy of power is 55.67 billion KW h and the total available bioenergy of coal equivalent is 23.91 million tons.
In conclusion, it is important for the B-T-H region to develop technology roadmaps. Further policy, legal, financial, and market research in the B-T-H region is necessary to develop accurate technology roadmaps for the region.

Author Contributions

Conceptualization, Y.-Z.L.; methodology, X.Z.; validation, A.-B.W. and H.-J.X.; formal analysis, L.-J.G.; investigation, X.Z.; resources, X.-W.N.; data curation, X.Z.; writing—original draft preparation, X.Z.; writing—review and editing, X.Z.; visualization, X.Z.; supervision, Y.-Z.L.; project administration, Y.-Z.L.; funding acquisition, X.-W.N. All authors have read and agreed to the published version of the manuscript.

Funding

This research was funded by National Nature Science Foundation of China through grant no.11472040.

Conflicts of Interest

The authors declare no conflict of interest.

Appendix A

Figure A1. Biofuel production and per capita GDP of the Beijing, Tianjin, and Hebei regions. (a) The per capita GDP of the Beijing, Tianjin, and Hebei regions (source: https://data.worldbank.org.cn/); (b) Biofuel production of the Beijing, Tianjin, and Hebei regions by analogy based on the same level of economic development in the world (source: http://data.stats.gov.cn/and [9]).
Energies 13 00844 g0a1

Appendix B

Appendix B.1. Crop Residue Economic Value

Table A1. Cost table for crop residue collection process [67].
CategoryAgricultural Machinery Capital RecoveryOperation and Maintenance CostsHuman Resources CostManagement FeesCorn Straw Price
Unit price($/t)3.06.92.91.122.85
Total corp residue economic value (million USD)318

Appendix B.2. Excrements Economic Value

Table A2. Economic value of excrements [28].
CategoryBiogas
Unit price ($ USD/m3)1.047
Total cattle excrement economic value (million USD)7400
Total excrement economic value (million USD)3261

Appendix B.3. Economic Feasibility of the Available Biomass

Economic feasibility is the core problem of biomass energy development and utilization in China. An economic feasibility study is a kind of gain and loss comparison study. The comparison of gain and loss is a specific quantitative comparison. This paper cannot clearly define the specific evaluation object. Therefore, economic feasibility is only a structural argument rather than a specific computational analysis. Economic feasibility analysis includes the following three aspects of analysis.
(1) Economic feasibility of the operator
From the perspective of operators, the economic feasibility of the development and utilization of biomass energy sporadic production activities is mainly considered as follows: cash inflows including product sales revenue, state financial support and related subsidies and outflows including own capital investment, raw material acquisition costs, processing costs, storage and transportation costs, and risks. Due to inadequate scale, inaccurate product positioning, weak market demand, and high risks, the economic feasibility of risks is mainly dependent on direct state investment, which can quickly turn sporadic production into a prairie fire, shortening the process from project construction to industrial development.
(2) Economic feasibility of local project construction
Generally speaking, the economic feasibility of this type is based on the economic feasibility of the project itself. As long as the project has good economic benefits, it is conducive to the development of local economy, increasing tax revenue, expanding employment, and increasing economic aggregate. The economic feasibility calculation should be carried out in accordance with the criterion of project economic evaluation (financial evaluation). First, cash inflow includes product sales revenue, recovery of fixed assets balance, recovery of working capital, and national financial transfer payments. Second, cash outflow includes the construction investment of processing enterprises, raw material acquisition costs, processing costs, storage and transportation costs, and tax payment. Third, it includes the calculation of relevant indicators and the economic evaluation of certainty and uncertainty.
It must be pointed out that the economic feasibility of the project cannot be generalized, and different conclusions may be drawn according to the specific project. The proposed project is the result of the economic feasibility study and is an economically feasible project.
(3) Economic feasibility of industrial development of national
At the national level, the formation and development of the biomass energy industry has great economic significance for China. First, it can ease energy pressure and improve the energy structure. Second, it may increase national income. Third, meeting the emission reduction requirements will result in substantial economic compensation. Fourth, it will result in reduced environmental pressure and reduce the social cost of environmental protection. Fifth, turns waste into a valuable resource and make rational use of energy. Of course, the development of the biomass energy industry also needs national support. The country also has to pay a certain cost, including price subsidies, tax relief, and energy restrictions. As long as the intensity is appropriate, the development of the biomass energy industry is economically rational and feasible.

Appendix C

Appendix C.1. Range of Straw/Grain Ratio

Table A3. Range of straw/grain ratio [19,77].
CropsRange of Straw/Grain Ratio
Rice0.75–1.5
Wheat1.1–2.57
Maize0.55–1.1
Legumes1.25–1.5
Potato0.2–1
PeanutNA a
Rapeseed1.25–2
Cotton1.4–5.51
Sugar beet0.2–0.25
TobaccoNA a
a Means none available.

Appendix C.2. Range of Collection Coefficient

Table A4. Range of collection coefficient [19].
CropsRange of Collection Coefficient
Crops0.75–0.9
Livestock excretion0.6–0.9
Municipal solid waste0.9

References

  1. Bilan, Y.; Streimikiene, D.; Vasylieva, T.; Lyulyov, O.; Pimonenko, T.; Pavlyk, A. Linking between Renewable Energy, CO2 Emissions, and Economic Growth: Challenges for Candidates and Potential Candidates for the EU Membership. Sustainability 2019, 11, 1528. [Google Scholar] [CrossRef] [Green Version]
  2. Bhattacharya, M.; Paramati, S.R.; Ozturk, I.; Bhattacharya, S. The effect of renewable energy consumption on economic growth: Evidence from top 38 countries. Appl. Energy 2016, 162, 733–741. [Google Scholar] [CrossRef]
  3. Bhattacharya, M.; Rafiq, S.; Bhattacharya, S. The role of technology on the dynamics of coal consumption-economic growth: New evidence from China. Appl. Energy 2015, 154, 686–695. [Google Scholar] [CrossRef]
  4. Wolde-Rufael, Y. Energy consumption and economic growth: The experience of African countries revisited. Energy Econ. 2009, 31, 217–224. [Google Scholar] [CrossRef]
  5. Costantini, V.; Martini, C. The causality between energy consumption and economic growth: A multi-sectoral analysis using non-stationary cointegrated panel data. Energy Econ. 2010, 32, 591–603. [Google Scholar] [CrossRef] [Green Version]
  6. Sadorsky, P. Renewable energy consumption and income in emerging economies. Energy Policy 2009, 37, 4021–4028. [Google Scholar] [CrossRef]
  7. Bowden, N.; Payne, J.E. Sectoral analysis of the causal relationship between renewable and non-renewable energy consumption and real output in the US. Energy Sources Part B Econ. Plan Policy 2010, 5, 400–408. [Google Scholar] [CrossRef]
  8. Ozturk, I.; Bilgili, F. Economic growth and biomass consumption nexus: Dynamic panel analysis for Sub-Sahara African countries. Appl. Energy 2015, 137, 110–116. [Google Scholar] [CrossRef]
  9. British Petroleum UK. Available online: https://www.bp.com/content/dam/bp/business-sites/en/global/corporate/pdfs/energy-economics/statistical-review/bp-stats-review-2019-full-report.pdf (accessed on 21 November 2019).
  10. Landman, W. Climate change 2007: The physical science basis. S. Afr. Geogr. J. 2010, 92, 86–87. [Google Scholar] [CrossRef] [Green Version]
  11. Okkerse, C.; Van Bekkum, H. From fossil to green. Green Chem. 1999, 1, 107–114. [Google Scholar] [CrossRef]
  12. Conference of the Parties Twenty-First Session. Available online: http://unfccc.int/resource/docs/2015/cop21/eng/l09.pdf (accessed on 10 November 2019).
  13. European Environment Agency (EEA). Available online: https://ec.europa.eu/eurostat/tgm/table.do?tab=table&init=1&plugin=1&language=en&pcode=t2020_31 (accessed on 26 November 2019).
  14. Ruddiman, W.F. The anthropogenic greenhouse era began thousands of years ago. Clim. Chang. 2003, 61, 261–293. [Google Scholar] [CrossRef]
  15. United Nations Sustainable Development Goal. Available online: https://www.un.org/sustainabledevelopment/sustainable-development-goals/ (accessed on 15 November 2019).
  16. Energy Information Administration (EIA), International Energy Outlook. Available online: https://www.eia.gov/pressroom/presentations/sieminski_07252013.pdf (accessed on 15 November 2019).
  17. Energy and Climate Goals of China’s 12th Five-Year Plan. Available online: https://www.c2es.org/site/assets/uploads/2011/03/energy-climate-goals-chinas-twelfth-five-year-plan.pdf (accessed on 22 November 2019).
  18. REN21. Available online: https://www.ren21.net/wp-content/uploads/2019/05/gsr_2019_full_report_en.pdf (accessed on 10 November 2019).
  19. Lal, R. World crop residues production and implications of its use as a biofuel. Environ. Int. 2005, 31, 575–584. [Google Scholar] [CrossRef] [PubMed]
  20. Pradhan, P.; Mahajani, S.M.; Arora, A. Production and utilization of fuel pellets from biomass: A review. Fuel Process. Technol. 2018, 181, 215–232. [Google Scholar] [CrossRef]
  21. Saidur, R.; Abdelaziz, E.A.; Demirbas, A.; Hossain, M.S.; Mekhilef, S. A review on biomass as a fuel for boilers. Renew. Sustain. Energy Rev. 2011, 15, 2262–2289. [Google Scholar] [CrossRef]
  22. Chisti, Y. Biodiesel from microalgae beats bioethanol. Trends Biotechnol. 2008, 26, 126–131. [Google Scholar] [CrossRef] [PubMed]
  23. Ferreira-Leitão, V.; Gottschalk, L.M.F.; Ferrara, M.A.; Nepomuceno, A.L.; Molinari, H.B.C.; Bon, E.P.S. Biomass Residues in Brazil: Availability and Potential Uses. In Waste Biomass Valorization; Springer: Berlin/Heidelberg, Germany, 2010; Volume 1, pp. 65–76. [Google Scholar]
  24. Balogun, A.O.; Lasode, O.A.; McDonald, A.G. Thermo-physical, Chemical and Structural Modifications in Torrefied Biomass Residues. In Waste Biomass Valorization; Springer: Berlin/Heidelberg, Germany, 2016; Volume 9, pp. 131–138. [Google Scholar]
  25. Chen, W.-H.; Peng, J.; Bi, X.T. A state-of-the-art review of biomass torrefaction, densification and applications. Renew. Sustain. Energy Rev. 2015, 44, 847–866. [Google Scholar] [CrossRef]
  26. Abdullah, B.; Syed Muhammad, S.A.F.; Shokravi, Z.; Ismail, S.; Kassim, K.A.; Mahmood, A.N.; Aziz, M.M.A. Fourth generation biofuel: A review on risks and mitigation strategies. Renew. Sustain. Energy Rev. 2019, 107, 37–50. [Google Scholar] [CrossRef]
  27. International Energy Agency. Available online: https://www.iea.org/publications/freepublications/publication/Technology_Roadmap_Delivering_Sustainable_Bioenergy.pdf (accessed on 25 November 2019).
  28. Diamantis, V.I.; Kapagiannidis, A.G.; Ntougias, S.; Tataki, V.; Melidis, P.; Aivasidis, A. Two-stage CSTR–UASB digestion enables superior and alkali addition-free cheese whey treatment. Biochem. Eng. J. 2014, 84, 45–52. [Google Scholar] [CrossRef]
  29. Long, H.; Li, X.; Wang, H.; Jia, J. Biomass resources and their bioenergy potential estimation: A review. Renew. Sustain. Energy Rev. 2013, 26, 344–352. [Google Scholar] [CrossRef]
  30. Ahorsu, R.; Medina, F.; Constantí, M. Significance and Challenges of Biomass as a Suitable Feedstock for Bioenergy and Biochemical Production: A Review. Energies 2018, 11, 3366. [Google Scholar] [CrossRef] [Green Version]
  31. Alternative Fuels Data Center. Available online: https://afdc.energy.gov/fuels/ethanol.html (accessed on 15 November 2019).
  32. Forbord, M.; Vik, J.; Hillring, B.G. Development of local and regional forest based bioenergy in Norway—Supply networks, financial support and political commitment. Biomass Bioenergy 2012, 47, 164–176. [Google Scholar] [CrossRef] [Green Version]
  33. Kraxner, F.; Nordström, E.-M.; Havlík, P.; Gusti, M.; Mosnier, A.; Frank, S.; Obersteiner, M. Global bioenergy scenarios—Future forest development, land-use implications, and trade-offs. Biomass Bioenergy 2013, 57, 86–96. [Google Scholar] [CrossRef]
  34. Perez-Verdin, G.; Grebner, D.L.; Sun, C.; Munn, I.A.; Schultz, E.B.; Matney, T.G. Woody biomass availability for bioethanol conversion in Mississippi. Biomass Bioenergy 2009, 33, 492–503. [Google Scholar] [CrossRef]
  35. Duku, M.H.; Gu, S.; Hagan, E.B. A comprehensive review of biomass resources and biofuels potential in Ghana. Renew. Sustain. Energy Rev. 2011, 15, 404–415. [Google Scholar] [CrossRef]
  36. Wicke, B.; Smeets, E.; Watson, H.; Faaij, A. The current bioenergy production potential of semi-arid and arid regions in sub-Saharan Africa. Biomass Bioenergy 2011, 35, 2773–2786. [Google Scholar] [CrossRef]
  37. Cai, J.; Liu, R.; Deng, C. An assessment of biomass resources availability in Shanghai: 2005 analysis. Renew. Sustain. Energy Rev. 2008, 12, 1997–2004. [Google Scholar] [CrossRef]
  38. Steubing, B.; Ballmer, I.; Gassner, M.; Gerber, L.; Pampuri, L.; Bischof, S.; Zah, R. Identifying environmentally and economically optimal bioenergy plant sizes and locations: A spatial model of wood-based SNG value chains. Renew. Energy 2014, 61, 57–68. [Google Scholar] [CrossRef]
  39. Jasinskas, A.; Sakalauskas, A.; Domeika, R. Evaluation of physical–mechanical properties of herbaceous bioenergy plants. Biomass Bioenergy 2008, 32, 952–958. [Google Scholar] [CrossRef]
  40. Niblick, B.; Monnell, J.D.; Zhao, X.; Landis, A.E. Using geographic information systems to assess potential biofuel crop production on urban marginal lands. Appl. Energy 2013, 103, 234–242. [Google Scholar] [CrossRef]
  41. Sliz-Szkliniarz, B.; Vogt, J. A GIS-based approach for evaluating the potential of biogas production from livestock manure and crops at a regional scale: A case study for the Kujawsko-Pomorskie Voivodeship. Renew. Sustain. Energy Rev. 2012, 16, 752–763. [Google Scholar] [CrossRef]
  42. Kim, S.; Dale, B.E. Global potential bioethanol production from wasted crops and crop residues. Biomass Bioenergy 2004, 26, 361–375. [Google Scholar] [CrossRef]
  43. Smeets, E.M.W.; Faaij, A.P.C.; Lewandowski, I.M.; Turkenburg, W.C. A bottom-up assessment and review of global bio-energy potentials to 2050. Prog. Energy Combust. Sci. 2007, 33, 56–106. [Google Scholar] [CrossRef] [Green Version]
  44. Thrän, D.; Seidenberger, T.; Zeddies, J.; Offermann, R. Global biomass potentials—Resources, drivers and scenario results. Energy Sustain. Dev. 2010, 14, 200–205. [Google Scholar] [CrossRef]
  45. De Wit, M.; Londo, M.; Faaij, A. Productivity developments in European agriculture: Relations to and opportunities for biomass production. Renew. Sustain. Energy Rev. 2011, 15, 2397–2412. [Google Scholar] [CrossRef]
  46. De Wit, M.; Faaij, A. European biomass resource potential and costs. Biomass Bioenergy 2010, 34, 188–202. [Google Scholar] [CrossRef]
  47. Banowetz, G.M.; Boateng, A.; Steiner, J.J.; Griffith, S.M.; Sethi, V.; El-Nashaar, H. Assessment of straw biomass feedstock resources in the Pacific Northwest. Biomass Bioenergy 2008, 32, 629–634. [Google Scholar] [CrossRef]
  48. Karaj, S.H.; Rehl, T.; Leis, H.; Müller, J. Analysis of biomass residues potential for electrical energy generation in Albania. Renew. Sustain. Energy Rev. 2010, 14, 493–499. [Google Scholar] [CrossRef]
  49. Steubing, B.; Zah, R.; Waeger, P.; Ludwig, C. Bioenergy in Switzerland: Assessing the domestic sustainable biomass potential. Renew. Sustain. Energy Rev. 2010, 14, 2256–2265. [Google Scholar] [CrossRef] [Green Version]
  50. Szymańska, D.; Chodkowska-Miszczuk, J. Endogenous resources utilization of rural areas in shaping sustainable development in Poland. Renew. Sustain. Energy Rev. 2011, 15, 1497–1501. [Google Scholar] [CrossRef]
  51. Zhuang, D.; Jiang, D.; Liu, L.; Huang, Y. Assessment of bioenergy potential on marginal land in China. Renew. Sustain. Energy Rev. 2011, 15, 1050–1056. [Google Scholar] [CrossRef]
  52. Mekhilef, S.; Saidur, R.; Safari, A.; Mustaffa, W.E.S.B. Biomass energy in Malaysia: Current state and prospects. Renew. Sustain. Energy Rev. 2011, 15, 3360–3370. [Google Scholar] [CrossRef]
  53. Minowa, T.; Kojima, T.; Matsuoka, Y. Study for utilization of municipal residues as bioenergy resource in Japan. Biomass Bioenergy 2005, 29, 360–366. [Google Scholar] [CrossRef]
  54. Energy Information Administration (IEA). Available online: https://www.iea.org/publications/freepublications/publication/Biofuels_Roadmap_WEB.pdf (accessed on 29 November 2019).
  55. Energy Information Administration (IEA). Available online: https://www.iea.org/publications/freepublications/publication/2012_Bioenergy_Roadmap_2nd_Edition_WEB.pdf (accessed on 29 November 2019).
  56. How2Guide for Bioenergy Roadmap Development and Implementation. Available online: https://www.iea.org/publications/freepublications/publication/How2GuideforBioenergyRoadmapDevelopmentandImplementation.pdf (accessed on 29 November 2019).
  57. Mitchell, C.P.; Bridgwater, A.V.; Mackie, K.L. Bioenergy Systems. In Developments in Thermochemical Biomass Conversion, 1st ed.; Bridgwater, A.V., Boocock, D.G.B., Eds.; Springer Netherlands: Dordrecht, The Netherlands, 1997; Volume 1, pp. 1509–1524. [Google Scholar]
  58. Manochio, C.; Andrade, B.R.; Rodriguez, R.P.; Moraes, B.S. Ethanol from biomass: A comparative overview. Renew. Sustain. Energy Rev. 2017, 80, 743–755. [Google Scholar] [CrossRef]
  59. Azadi, P.; Inderwildi, O.R.; Farnood, R.; King, D.A. Liquid fuels, hydrogen and chemicals from lignin: A critical review. Renew. Sustain. Energy Rev. 2013, 21, 506–523. [Google Scholar] [CrossRef]
  60. Rawat, I.; Ranjith Kumar, R.; Mutanda, T.; Bux, F. Biodiesel from microalgae: A critical evaluation from laboratory to large scale production. Appl. Energy 2013, 103, 444–467. [Google Scholar] [CrossRef]
  61. Achinas, S.; Achinas, V.; Euverink, G.J.W. A Technological Overview of Biogas Production from Biowaste. Engineering 2017, 3, 299–307. [Google Scholar] [CrossRef]
  62. Bajwa, D.S.; Peterson, T.; Sharma, N.; Shojaeiarani, J.; Bajwa, S.G. A review of densified solid biomass for energy production. Renew. Sustain. Energy Rev. 2018, 96, 296–305. [Google Scholar] [CrossRef]
  63. Wang, W.; Ouyang, W.; Hao, F. A Supply-Chain Analysis Framework for Assessing Densified Biomass Solid Fuel Utilization Policies in China. Energies 2015, 8, 7122–7139. [Google Scholar] [CrossRef] [Green Version]
  64. Zhou, Y.; Zhang, Z.; Zhang, Y.; Wang, Y.; Yu, Y.; Ji, F.; Dong, R. A comprehensive review on densified solid biofuel industry in China. Renew. Sustain. Energy Rev. 2016, 54, 1412–1428. [Google Scholar] [CrossRef]
  65. Chen, L.J.; Li, X.; Han, L.J. Renewable energy from agro-residues in China: Solid biofuels and biomass briquetting technology. Renew. Sustain. Energy Rev. 2009, 13, 2689–2695. [Google Scholar] [CrossRef]
  66. Castrillón Mendoza, R.; Rey Hernández, J.; Velasco Gómez, E.; San José Alonso, J.; Rey Martínez, F. Analysis of the Methodology to Obtain Several Key Indicators Performance (KIP), by Energy Retrofitting of the Actual Building to the District Heating Fuelled by Biomass, Focusing on nZEB Goal: Case of Study. Energies 2019, 12, 93. [Google Scholar] [CrossRef] [Green Version]
  67. Song, S.; Liu, P.; Xu, J.; Ma, L.; Chong, C.; He, M.; Huang, X.Z.; Li, Z.; Ni, W. An Economic and Policy Analysis of a District Heating System Using Corn Straw Densified Fuel: A Case Study in Nong’an County in Jilin Province, China. Energies 2016, 10, 8. [Google Scholar] [CrossRef] [Green Version]
  68. Dwivedi, P.; Khanna, M.; Fuller, M. Is wood pellet-based electricity less carbon-intensive than coal-based electricity? It depends on perspectives, baselines, feedstocks, and forest management practices. Environ. Res. Lett. 2019, 14, 024006. [Google Scholar] [CrossRef]
  69. Inayat, A.; Raza, M. District cooling system via renewable energy sources: A review. Renew. Sustain. Energy Rev. 2019, 107, 360–373. [Google Scholar] [CrossRef]
  70. Vallios, I.; Tsoutsos, T.; Papadakis, G. Design of biomass district heating systems. Biomass Bioenergy 2009, 33, 659–678. [Google Scholar] [CrossRef]
  71. Thomson, H.; Liddell, C. The suitability of wood pellet heating for domestic households: A review of literature. Renew. Sustain. Energy Rev. 2015, 42, 1362–1369. [Google Scholar] [CrossRef]
  72. Complied by National Bureau of Statistics of China, Chinese Statistical Yearbook in 2017. Available online: http://www.stats.gov.cn/tjsj/ndsj/2017/indexch.htm (accessed on 3 December 2019).
  73. Ministry of Ecology and Environment of the People’s Republic of China (MEP). Chinese Environment status bulletin in 2015. Available online: http://www.mee.gov.cn/hjzl/zghjzkgb/lnzghjzkgb/201606/P020160602333160471955.pdf (accessed on 12 December 2019).
  74. Ministry of Ecology and Environment of the People’s Republic of China (MEP). Chinese Environment Status Bulletin in 2016. Available online: http://www.mee.gov.cn/hjzl/zghjzkgb/lnzghjzkgb/201706/P020170605833655914077.pdf (accessed on 12 December 2019).
  75. Zhang, B.B. Assessment of Raw Material Supply Capability and Energy Potential of Biomass Resources in China. Ph.D. Thesis, China Agricultural University, Beijing, China, 2018. (In Chinese). [Google Scholar]
  76. Larson, W.E. Crop residue: Energy production on erosion control. J. Soil Water Conserv. 1979, 34, 74–76. [Google Scholar]
  77. Yanli, Y.; Peidong, Z.; Wenlong, Z.; Yongsheng, T.; Yonghong, Z.; Lisheng, W. Quantitative appraisal and potential analysis for primary biomass resources for energy utilization in China. Renew. Sustain. Energy Rev. 2010, 14, 3050–3058. [Google Scholar] [CrossRef]
  78. Stout, B.A. Energy from Biomass. In Handbook of Energy for World Agriculture, 1st ed.; Elsevier Science: New York, NY, USA, 1990; pp. 1–504. [Google Scholar]
  79. Lal, R. The role of residues management in sustainable agricultural systems. J. Sustain. Agric. 1995, 5, 51–78. [Google Scholar] [CrossRef]
  80. Wang, F.H.; Ma, W.Q.; Dou, Z.X.; Ma, L.; Liu, X.L.; Xu, J.X.; Zhang, F.S. The estimation of the production amount of animal manure and its environmental effect in China. China Environ. Sci. 2006, 26, 614–617. [Google Scholar]
  81. Peng, L.; Wang, D.Y. Estimation of annual quantity of total excretion from livestock and poultry in Chongqing Municipality. Trans. CSAE 2004, 20, 288–291. (In Chinese) [Google Scholar]
  82. Zhu, L.; Zhang, L.; Fan, J.; Jiang, P.; Li, L. MSW to synthetic natural gas: System modeling and thermodynamics assessment. Waste Manag. 2016, 48, 257–264. [Google Scholar] [CrossRef] [PubMed]
  83. Demirbas, A.; Alamoudı, R.H.; Ahmad, W.; Sheıkh, M.H. Optimization of municipal solid waste (MSW) disposal in Saudi Arabia. Energy Sources Part A Recovery Util. Environ. Eff. 2016, 38, 1929–1937. [Google Scholar] [CrossRef]
  84. Lima, R.M.; Santos, A.H.M.; Pereira, C.R.S.; Flauzino, B.K.; Pereira, A.C.O.S.; Nogueira, F.J.H.; Valverde, J.A.R. Spatially distributed potential of landfill biogas production and electric power generation in Brazil. Waste Manag. 2018, 74, 323–334. [Google Scholar] [CrossRef]
  85. Yao, X.; Guo, Z.; Liu, Y.; Li, J.; Feng, W.; Lei, H.; Gao, Y. Reduction potential of GHG emissions from municipal solid waste incineration for power generation in Beijing. J. Clean. Prod. 2019, 241, 118283–118297. [Google Scholar] [CrossRef]
  86. Complied by Beijing Bureau of Statistics, National Bureau of Statistics Beijing Investigation Team, Beijing Statistical Yearbook of 2019. Available online: http://navi.cnki.net/KNavi/YearbookDetail?pcode=CYFD&pykm=YOFGE&bh= (accessed on 1 January 2020).
  87. Complied by Tianjin Bureau of Statistics, National Bureau of Statistics Tianjin Investigation Team, Tianjin Statistical Yearbook of 2019. Available online: http://navi.cnki.net/KNavi/YearbookDetail?pcode=CYFD&pykm=YTJTJ&bh= (accessed on 1 January 2020).
  88. Complied by Hebei Provincial Bureau of Statistics, Hebei Economic Yearbook of 2018. Available online: http://navi.cnki.net/KNavi/YearbookDetail?pcode=CYFD&pykm=YMAWW&bh= (accessed on 1 January 2020).
Figure 1. The situation of global and regions biofuel production. (a) World biofuel production (adapted from BP 2019 [9]); (b) world bioethanol and biodiesel production (adapted from BP 2019 [9]); (c) global bioethanol production (source: www.afdc.energy.gov/data/).
Energies 13 00844 g001aEnergies 13 00844 g001b
Figure 2. The technology roadmap of bioenergy: from biomass raw materials to final energy use [27].
Energies 13 00844 g002
Figure 3. The cultivated area of crops in the B-T-H region in 2017. (a) The cultivated area of maize, wheat, rice, and crops total in Hebei, Tianjin, and Beijing, respectively. (b) The cultivated area of maize, wheat, rice, and crops total in Hebei (source: http://www.stats.gov.cn/).
Energies 13 00844 g003
Figure 4. The energy value in the B-T-H region in 2017. (a) The curve of diesel equivalent and coal equivalent in Hebei, Tianjin, and Beijing, respectively. (b) The energy value proportion of Hebei, Tianjin, and Beijing, respectively.
Energies 13 00844 g004
Figure 5. The COD value in the B-T-H region. (a) A pie chart of COD production in Hebei, Tianjin, and Beijing, respectively. (b) The COD value proportion of pigs, sheep, cattle, poultry, and humans, respectively.
Energies 13 00844 g005
Figure 6. Biomass energy potential in the B-T-H region. (a) The distribution of crops residues energy potential in the B-T-H region. (b) The distribution of MSW energy potential in the B-T-H region. (c) The distribution of human, poultry, and livestock manure energy potential in the B-T-H region.
Energies 13 00844 g006
Figure 7. The suitable technology roadmap of biomass energy development in the B-T-H region.
Energies 13 00844 g007
Figure 8. The energy grid of three biomass energy with energy demand total in the B-T-H region [67,75,76,77].
Energies 13 00844 g008
Table 1. The straw/grain ratio of different crop species [19,23,42,75,76,77].
CropsStraw/Grain Ratio
Rice1.00
Wheat1.28
Maize1.10
Legumes1.50
Potato0.50
Peanut1.01
Rapeseed1.01
Cotton3.62
Sugar beet0.10
Tobacco0.66
Table 2. Classified crops yield (106 tons), per land area amount of crops (106 tons) and per capita amount of crops (kg) of the Beijing-Tianjin-Hebei (H-B-T) region in 2017 (source: http://www.stats.gov.cn/).
CropsCategoryHebeiTianjinBeijingTotal
RiceProduction0.500.260.000.76
Per land area amount0.030.230.000.26
Per capita amount6.7114.970.0321.71
WheatProduction15.040.620.0615.72
Per land area amount0.800.550.041.39
Per capita amount200.0235.472.85238.34
MaizeProduction20.351.190.3321.88
Per land area amount1.081.060.202.33
Per capita amount270.6867.8115.30353.79
LegumesProduction0.200.010.010.22
Per land area amount0.010.010.000.02
Per capita amount2.770.490.273.53
PotatoProduction13.400.150.0 1.36
Per land area amount0.070.010.000.08
Per capita amount17.810.850.2818.94
PeanutProduction1.030.01N/A 11.04
Per land area amount0.060.010.000.07
Per capita amount13.750.300.1914.24
RapeseedProduction0.00N/A 1N/A 10.00
Per land area amount0.00N/A 1N/A 10.00
Per capita amount0.55N/A 1N/A 10.55
CottonProduction0.020.02N/A 10.04
Per land area amount0.010.02N/A 10.03
Per capita amount3.191.42N/A 14.61
Sugar beetProduction0.06N/A 1N/A 10.06
Per land area amount0.03N/A 1N/A 10.03
Per capita amount8.30N/A 1N/A 18.30
TobaccoProduction0.00N/A 1N/A 10.00
Per land area amount0.00N/A 1N/A 10.00
Per capita amount0.00N/A 1N/A 10.03
1 Means none available, because of no statistics for crop production according to National Bureau of Statistics.
Table 3. Crops residues in 2017 (106 tons).
CropsHebeiTianjinBeijingTotal
Rice0.380.200.000.58
Wheat14.440.600.0615.10
Maize16.790.980.2718.05
Legumes0.230.010.010.25
Potato0.500.010.000.51
Peanut1.160.010.001.17
Rapeseed0.09N/A 1N/A 10.09
Cotton0.650.07N/A 10.72
Sugar beet0.05N/A 1N/A 10.05
Tobacco0.00N/A 1N/A 10.00
Total34.301.870.3536.52
1 Means none available, because of no statistics for crop production according to the National Bureau of Statistics.
Table 4. Crop residue coal equivalent calculations in 2017 (106 tons).
CropsHebeiTianjinBeijingTotal
Rice0.190.100.000.29
Wheat7.220.300.037.55
Maize8.400.490.149.03
Legumes0.120.000.000.13
Potato0.250.000.000.26
Peanut0.580.000.000.59
Rapeseed0.05N/A 1N/A 10.05
Cotton0.330.03N/A 10.36
Sugar beet0.02N/A 1N/A 10.02
Tobacco0.00N/A 1N/A 10.00
Total17.150.930.1718.26
1 Means none available, because of no statistics for crop production according to the National Bureau of Statistics.
Table 5. Excretion coefficient, COD production coefficient, and feeding cycle in 2016 [75,77,80,81].
SpeciesExcretion Coefficient (kg/day)COD Production Coefficient (kg/day)Feeding Cycle (day)
Pig3.390.36199
Sheep2.600.01365
Cattle30.404.09365
Poultry0.370.025365
Horse15N/A 1365
Donkey13N/A 1365
Mule13N/A 1365
Human0.080.075365
1 Means none available.
Table 6. The quantity of humans, livestock, and poultry in 2016 (106) (source: http://www.stats.gov.cn/).
SpeciesSituationHebeiTianjinBeijing
PigMarketable stock34.343.752.75
Standing stock19.581.801.65
SheepMarketable stock23.040.690.70
Standing stock12.280.430.60
CattleMarketable stock3.320.200.07
Standing stock3.600.260.16
PoultryMarketable stock607.7279.1138.83
HorseStanding stock0.060.000.00
DonkeyStanding stock0.170.010.00
MuleStanding stock0.050.000.00
HumanYear-end residents74.7015.6221.73
Table 7. The estimation of human, livestock, and poultry waste production (106 tons).
SpeciesSituationHebeiTianjinBeijingTotal
PigMarketable stock13.901.521.1116.53
Standing stock7.920.730.679.32
SheepMarketable stock13.120.390.4013.91
Standing stock6.990.250.347.58
CattleMarketable stock22.101.340.4923.93
Standing stock23.931.721.0826.73
PoultryMarketable stock49.246.413.1558.80
HorseStanding stock0.190.000.010.20
DonkeyStanding stock0.490.020.010.52
MuleStanding stock0.150.000.000.15
HumanYear-end resident 1.310.270.381.96
Total139.3512.657.63159.63
Table 8. The estimated COD production of human, livestock, and poultry waste (106 tons).
SpeciesSituationHebeiTianjinBeijingTotal
PigMarketable stock1.480.160.121.76
Standing stock0.840.080.070.99
SheepMarketable stock0.050.000.000.05
Standing stock0.030.000.000.03
CattleMarketable stock2.970.180.073.22
Standing stock3.220.230.143.60
PoultryMarketable stock3.330.430.213.97
HumanYear-end resident1.230.260.361.84
Total13.141.340.9715.46
Table 9. The estimation of feces waste for biogas production (108 m3).
SpeciesSituationHebeiTianjinBeijingTotal
PigMarketable stock6.750.740.548.03
Standing stock3.850.350.324.52
SheepMarketable stock0.230.010.010.25
Standing stock0.120.010.010.13
CattleMarketable stock13.600.820.3014.72
Standing stock14.721.060.6616.45
PoultryMarketable stock15.221.980.9718.17
HumanYear-end resident5.611.181.638.42
Total60.106.144.4570.68
Table 10. The coal equivalent of feces waste (106 tons).
SpeciesSituationHebeiTianjinBeijingTotal
PigMarketable stock0.490.050.040.59
Standing stock0.280.030.020.33
SheepMarketable stock0.020.000.000.02
Standing stock0.010.000.000.01
CattleMarketable stock1.000.060.021.08
Standing stock1.080.080.051.21
PoultryMarketable stock1.120.150.071.33
HumanYear-end resident0.410.090.120.62
Total4.410.450.335.18
Table 11. Municipal solid waste (MSW) production in 2017 (source: http://www.stats.gov.cn/).
CategoryBeijingHebeiTianjinTotal
Wastes clearance volume (106 tons)9.247.003.071.93
Harmless disposal volume (106 tons)9.247.002.901.93
Sanitary landfill wastes (106 tons)4.383.911.5238.62
Burning wastes326.50284.80137.67724.84
Harmless treatment rate99.00%99.80%99.40%None
Table 12. The biogas production and coal equivalent of MSW.
CategoryBeijingHebeiTianjinTotal
Methane production from landfill treatment (106 tons)0.120.110.410.27
Methane coal equivalent produced by landfill treatment (106 tons)0.210.190.730.47
Methane produced by landfill treatment (hundred million m3)1.711.530.603.84
Table 13. Energy conversion parameter [75,76,77].
Biomass
Raw Materials
Collection CoefficientEnergy Carrier FormEnergy Loss in InfrastructureMachining EfficiencyEnergy
Demand form
Energy Conversion EfficiencyCaloric Value (KJ/Kg)Energy Utilization Efficiency
Crops75%Biogas5%0.30 m3/kgHeating75.83%12,572.7055%
Power (central)N/A3N/A 1
Densification5%92%Heating75.83%12572.7045%
Power (central)0.56KW h/KgN/A 1
MSW90%BiogasN/A 1N/A 1Heating75.83%25.5855%
Power (central)1.25 KW h/m3N/A 155%
Excrement60%Biogas15%0.54 m3/kgHeating75.83%25.5855%
Power (central)1.25 KW h/m3N/A 155%
1 Means none available.
Table 14. Energy demand of the B-T-H region in 2017 [86,87,88].
EnergyHebeiTianjinBeijing
Total energy demand (106 tons coal equivalent)303.8580.1171.32
Coal percentage of total energy demand (%)83.7148.005.65
Petroleum percentage of total energy demand (%)7.97N/A 133.8
Natural gas percentage of total energy demand (%)4.231.0231.8
Total residential demand (106 tons coal equivalent)N/A 111.0216.97
Residential demandHeat (106 million KJ)N/A 1102.18N/A 1
Electricity (102 million KW h)N/A 199.68N/A 1
1 Means none available.

