Abstract
This article presents a method for the Maximum Power Point Tracking (MPPT) of a Photovoltaic (PV) panels array with partial shading, applying an Improved Pattern Search Method (IPSM). The method is simulated in PSIM and then implemented in hardware in the loop system, emulating the PV array on an industrial computer (Speedgoat) that allows real-time emulations and the IPSM is applied in an Arduino DUE. The experiments were carried out with TP245S-20/WD, KYOCERA KC200GT, YINGLY SOLAR JS65, and MSX60 photovoltaic panels. The results are the proper MPPT with changes in partial shading over time, inducing the increase and decrease of the maximum power point. The results obtained are the search for the global maximum power point in a matrix of panels in which, due to partial shading, it might have several local maximum power points, and thanks to the IPSM algorithm, it always manages to find the global maximum power point. Finally, the results are compared with other methods where it was found that IPSM had faster answers.
1. Introduction
Electricity is mostly generated through systems that deteriorate the environment, such as the burning of fossil fuels. This method of conventional generation has caused strong criticism from the scientific community and society in general due to its direct impact on global warming. The need for electric power has grown exponentially in recent decades and issues related to current power supply systems are fundamental to this [1], making the development of sustainable, renewable energy generation processes a highly interesting topic for the academic community.
As a solution to all these problems, smart grid systems are being worked on. This consists of migrating from a centralized energy generation system to a distributed energy generation system. Among the energy conversion systems most used for these systems are renewable generation systems [2].
Among the renewable generation systems, the most commonly used are wind turbines and photovoltaic (PV) panels. Wind-powered systems, whose fuel is abundant and free, present an intermittent flow since it depends both on the geographical location of the turbine and, on the season of the year. On the other hand, photovoltaic systems (in this case the fuel is solar radiation) have been gaining strength in the last decade, transforming the energy of the light into electrical energy. PV systems are attractive due its (i) high availability of solar radiation in most territories around the globe, (ii) its maintenance cost is cheap, and (iii) it being environmentally friendly [3].
However, photovoltaic systems have difficulties in extracting the maximum available power, as this varies according to circumstantial variations, so it works with MPPT [4].
Several methodologies have been used for the MPPT in PV arrays, the ones that use optimization algorithms aim to find the Maximum Power Point (MPP) and techniques based on data comparison. For instance, [5] presents a method called Adaptive Radial Movement Optimization (ARMO) to mitigate the effect of the Partial Shading (PS) problem in the MPP detection for PV systems with additional dynamic applications. In [6,7] a voltage-oriented MPPT method is proposed, where the perturb and observe (P&O) algorithm is combined with the proposed external voltage control based on an adaptive integral-derivative sliding mode. Authors in [8] introduce a method based on a power versus static conductance curve of a PV panel, where the MPP is obtained by comparing the PV array instantaneous power to a varying power reference generated by the MPPT algorithm. Authors in [9] suggests an overall distributed MPPT algorithm to rapidly search the area near the global MPP, which is further integrated with the Particle Swarm Optimization (PSO) algorithm to improve the accuracy of the MPP location. As is reported in the literature, the classical optimization algorithms can be found in: Particle swarm optimization (PSO) [10,11,12,13], Cukoo search [14], and Artificial Neural Network (ANN) [15,16]. However, the most widely-used solutions are probably the classical P&O [17,18,19] and those based on the Incremental Conductance (IC) [20]. Nevertheless, it has been shown that P&O MPPT and the MPPT based on IC, exhibit a bad behavior when the system is under a partial shading condition or the temperature is variable [21,22]. Hence, partial shading represents a main operational challenge for PV arrays analysis.
Due to the lack of hardware implementations for this topic found in the literature, in contrast with the validations made by simulations that are commonly used, to show the potential real-life application, hardware implementation must be sought since this is an active search field. For instance, an implementation of a P&O MPPT in Arduino can be found in [23]. In [24] a MPPT based on a modified incremental conductance is implemented in hardware. Recently, authors in [25] proposed a hybrid MPPT algorithm in combination with a Whale Optimization algorithm.
Therefore, this paper proposes an optimization algorithm based on the improved pattern search method (IPSM) applied to the MPPT with partial shading. The study was performed with four PV of different references (MSX60, STP245S, KC200GT, and JS65) connected in series, taking into account different levels of solar radiation. To validate the proposed application, a circuit analysis is applied with four PV panels in a series connection with its corresponding simulation in PSIM software applying the IPSM. In addition, through a hardware in the loop emulation implemented with a SpeedGoat, the operation of the MPPT algorithm based on IPSM in simulation was demonstrated, emulating a three PV panels array connected in series. The IPSM for the MPPT was applied from an external device, in this case an Arduino DUE, to evidence the efficiency of the applied algorithm.
The paper is organized as follows: The mathematical models for both a single PV panel and an array of PV panels are introduced in Section 2. In Section 3, the Partial Shading problem is exposed. Section 4 presents the proposed MPPT based on IPSM. Simulation and experimental results are presented in Section 5. Finally, Section 7 summarizes the main conclusions.
2. Mathematical Model
2.1. Mathematical Model of a Photovoltaic Panel
For the proper study of the MPPT algorithms, it is necessary to have a mathematical model of the PV panel able to perform the simulations with changes in solar radiation or Irradiance (G) and Temperature (T), different from what is supplied by the manufacturer. This is in order to work in a controlled environment to guarantee the results on variable operating conditions.
The model utilized is the single diode model is the most common mathematical model found in the literature and is explained in [26,27,28,29]. Its equivalent circuit is presented in Figure 1.
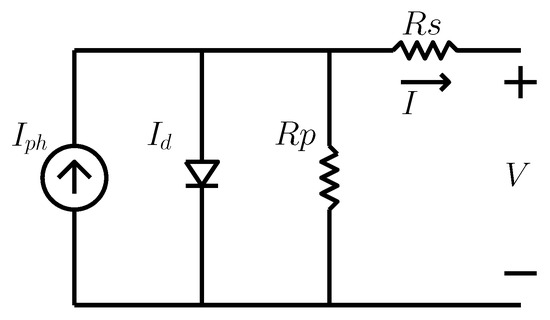
Figure 1.
Single diode model circuit.
The I-V characteristic of the circuit is given by Equation (1), with the following parameters: Saturation current (), Series Resistance (), Shunt Resistance (), Photovoltaic current (), and Thermal voltage () depends on the Ideality factor (m) of the diode as seen in Equation 2. Number of cells in series (), Boltzman’s constant (K) which value is ( J/K), and the Electron charge (q) ( C). To estimate the variables , and , optimization algorithms can be used basing on the data of a known PV panel. An example of such optimization-based identification algorithms can be seen in [30], where the variables , and are estimated and the curve representing the PV panel is generated as shown in Figure 2 where the power vs voltage (P-V) curve is depicted.
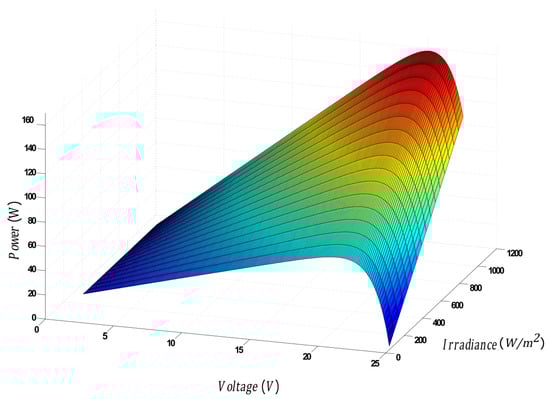
Figure 2.
Characteristic PV (photovoltaic) panel curve with different irradiance (G).
Equation (4) describes the short circuit current relation with the solar radiation whose measure unit is W/m and its measure in standard conditions is G = 1000 W/m. The equation obtained from [31] shows how the solar radiation affects the PV panel characteristic curve, affecting the MPP directly. Equation (5) corresponds to the Panel voltage (). In this equation , Diode Saturation Inverse Current (A), and Lambert function W (). With Equations (1) and (5) the power in Equation (6) can be calculated. It can be concluded that the power is directly dependent on G parameter, since current is in both equations, and the irradiance affects the . Regarding this idea, G change due to partial shading, taking into account that the partial shading can modify the PV panel characteristic curve drastically and in turn the MPP through time.
2.2. Mathematical Model of an Array of Photovoltaic Panels
The mathematical models of PV panels are widely known, whether they have one or two diodes, depending on the kind of PV panel, that is to say whether it is mono crystalline or poly crystalline technology. To study a PV array it is necessary to connect several cells in series or parallel. For the partial shading case, it is considered a PV array of panels connected in series where, changes in the characteristic curve can be observed when three or more panels are connected in series. In this case, it presents one peak for every PV panel, considering that each panel might have a different irradiance. It can happen due to partial shading, the generation of multiple-peaks in the P-V curve, thus limiting the MPPT operation. In this study, the implemented configuration was a four panels series connection, which is the configuration that presents difficulty in finding the MPP when there are changes in irradiance (G) or temperature (T) in the PV panels.
The papers [32,33,34] propose the circuit illustrated in Figure 3, Equation (7) represents the circuit with the following parameters: is the saturation current of the diode, Output Current of the Panel (I) in the physical terminals, Panel Voltage at the terminals (V), is the equivalent series resistance of the panel due to ohmic losses of the metal connections between the photovoltaic cells, is the parallel resistance of the panel due to leakage currents dissipated in the equivalent diode, and the amount of series and parallel PV panels are specified with and Number of cells in paralel () respectively, for this case .
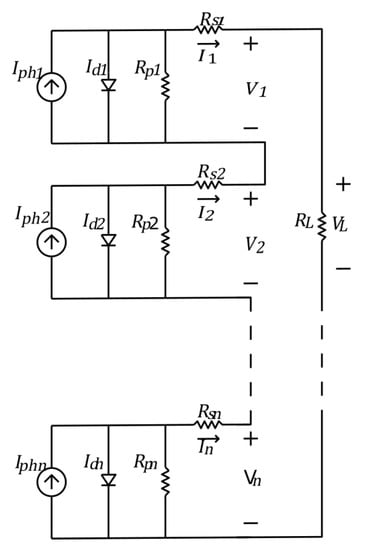
Figure 3.
Multy array diode model circuit.
Figure 4 shows a good example about partial shading, where four PV panels were used. In this example, each panel has a different irradiance, obtaining the dynamic illustrated in the P-V curve. It can be seen that the GMPP corresponds to the global maximum and three local maximums. As a result of this behavior, it is difficult to find the global maximum online, since every change in irradiance influences the PV panels performance. For this reason, optimization techniques become adequate to find all the peaks and select the proper voltage value to obtain the maximum power.
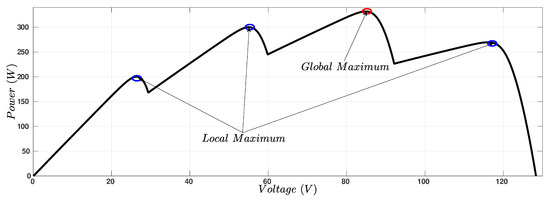
Figure 4.
Characteristic multi PV panel curve with different irradiance.
3. Shading Partial Problem
PV panels have a non-linear behavior and their performance depend on the MPPT technique. In Figure 2, it is depicted the characteristic curve of a PV panel, highlighting the strong dependency between the power and solar radiation. The maximum power, around 160 W/h, is obtained when the irradiance is about 1000 W/m. On the other hand, if the irradiance is 200 W/m the power will decrease to 60 W/h. These irradiance changes can be generated frequently due to the partial shading that can be presented by stationary clouds or unknown objects that can overlap on the PV panel.
The problem becomes more complicated with several panels connected in series as shown in Figure 5, where for instance, there are 4 PV panels connected in series. Table 1 shows the irradiance that each PV panel receives in each case. In case (a), there is a partial shading in PV panel 2, 3, and 4, and total irradiation in PV panel 1. As a result of this partial shading profile, a characteristic curve with four different peaks is generated. Moreover, the irradiation and partial shading profiles continuously change over time, for this reason it is necessary to have a continuous and fast response MPPT control.
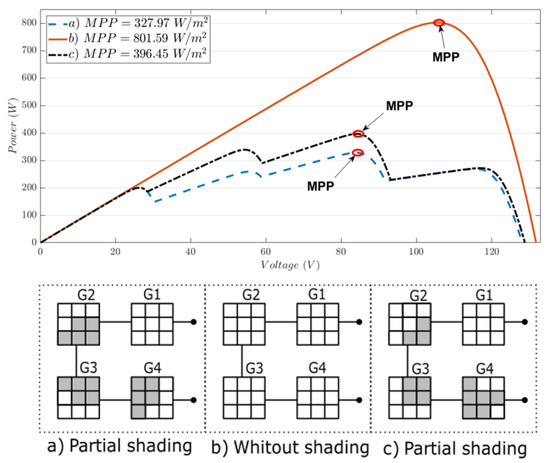
Figure 5.
Curve of four panels in series changing its partial irradiance (G).

Table 1.
Partial shading (W/m).
4. Proposed Improved Pattern Search Method (IPSM) Based on PSM
4.1. Pattern Search Method (PSM)
Metaheuristic algorithms are used in the optimization of non-linear functions due to the guarantee of convergence to the global optimum regardless of the number of local maximums that the function might have. The pattern search method (PSM) is presented in [35] where it is explained how the algorithm carries out an exhaustive search to find the global extreme, always ensuring convergence. It selects a working area and throws equidistant particles , as shown in Figure 6. The exploratory movements are conducted determining what the local minimum or maximum is according to the objective function requirements, leaving the latter as a pattern. Once the pattern has been determined, all other particles must make jumps of amplitude previously defined. Hence, the particles will move towards the standard particle. Once this movement has been made, an exploratory movement will be conducted again. If any of the particles in the iteration have a new global minimum or maximum better than the previous pattern, this will become the new pattern, determining new directions of other particles.
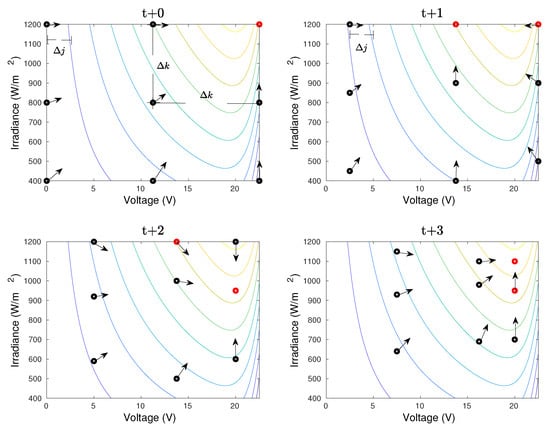
Figure 6.
PSM (pattern search method) coordination.
PSM applications as reported in [36], have been applied to a constrained system. In Figure 7 [37], PSM has worked to MPPT in PV arrays with partial shading conditions, whereby a global or general pattern search lead to results in Matlab comparing it with other optimization algorithms.
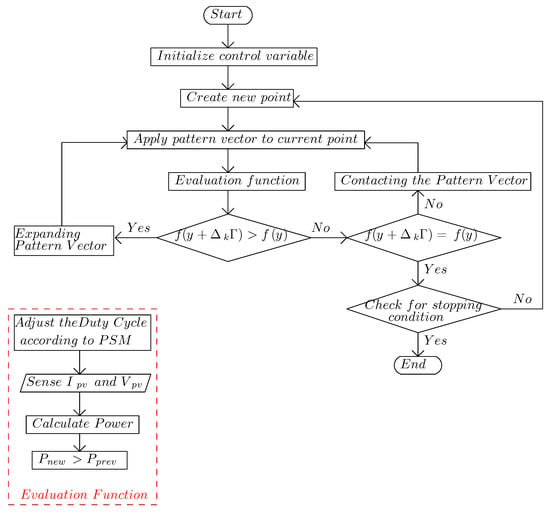
Figure 7.
PSM algorithm applied to partial shading taken from [37].
4.2. Proposed Method
The IPSM algorithm is presented in this subsection. It is a variation of the PSM presented in Section 4.1, so it inherits the properties of the PSM. The IPSM has the same philosophy of the PSM, where equidistant particles are generated at the beginning in the selected work area , as is illustrated in Figure 8. In the , the exploratory movements are conducted determining the minimum or maximum according to need and this is marked as a pattern. From this pattern, a new equidistant mesh is generated, taking as limits the closest particles already evaluated. An example is given in Figure 8 in . At this point, the exploratory movement is performed again and the process is repeated until it reaches a previously determined stop criterion when an error or a certain number of iterations. It is important to note that for the number of initial particles, it is necessary to know previously the number of peaks that can be generated to establish the minimum amount of particles to start.
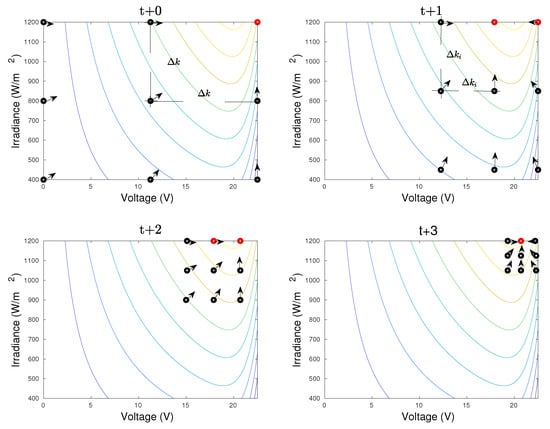
Figure 8.
IPSM (improved pattern search method) coordination.
In Figure 9 it is possible to observe how this restriction might affect some applications but for some approaches, such as the MPPT of a PV array in which the number of peaks can be known since it is equal to the amount of PV panels in series, the improvement in the algorithm is ideal, developing a faster response and obtaining fewer energy losses as shown later.
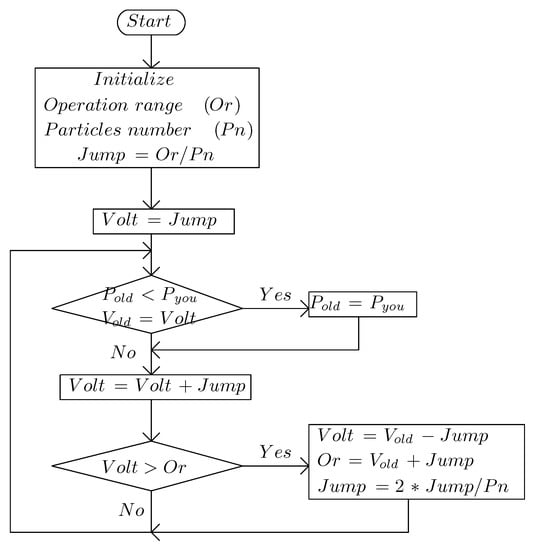
Figure 9.
IPSM flow chart taken from [38].
5. Simulation Setup
The PSIM@ simulation of four panels connected in series was performed to generate a controlled environment simulating partial shading conditions, changing the irradiance time in different PV panels.
First, the setup was implemented as proposed by [38] for the MPPT of a PV system. For this assembly, a DC-DC converter commonly used for photovoltaic systems as for example in [39], the parameters of the sliding surface were taken into account, as well as the Proportional, Integral, Derivative (PID) control parameters proposed, changing only the load, since there are four panels in a series connection. In Figure 10 the total experimental assembly is displayed, with a battery as a load of V. The PV panels used were Kyocera KC200GT0, which have a maximum power in standard conditions (i.e., G = 1000 W/m and T = 298 K) of 200 W, therefore, the PV system have a total power of 800 W.
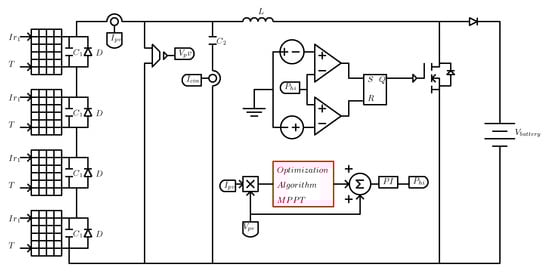
Figure 10.
Assembly in PSIM with four photovoltaic panels and IPSM algorithm.
Simulation Results
In the simulation, in a period of 0.12 s, 6 changes were generated in the G of the PV panels over time. A sample of the changes performed with their profiles can be observed in Figure 5, where it is evidenced the MPP for each of the profiles to which the optimization algorithm must arrive. Table 1 reports the changes of irradiance G on each panel every 0.02 s.
The following describes the results obtained from the simulation, by which the speed of response will depend directly on the equipment with which you are working.
With the changes in the irradiance, the simulation yields the MPPT as is shown in Figure 11, that is to say, the ideal power level to which the algorithm should arrive on the blue dashed line (Model MPP). As is depicted, in the first 0.02 s the MPPT reaches the ideal power of 396 W, according to the irradiance described in Table 1. Nevertheless, in the 0.10 s time frame, the MPPT gets very close to the ideal power but there is a small lag of 8 W, having an error of 2%. It was necessary to apply changes on G (both ascending and descending) in the simulation to validate that the algorithm works in all conditions by constantly having results with an error below 2%. Thus, the proposed IPSM proves its accuracy for the MPPT of PV arrays in a series connection under different irradiance conditions.
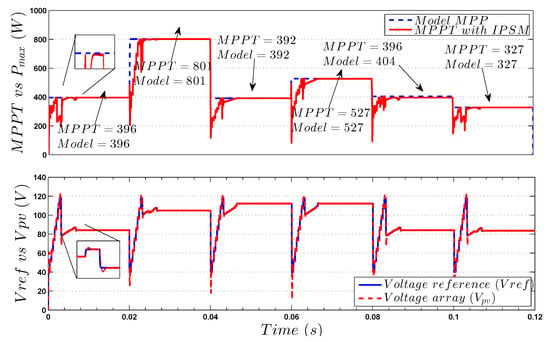
Figure 11.
Simulation MPPT (maximum power point tracking algorithms) with multipeaks with 4 PV panel KC200GTO in series and changes in the irradiance (G).
6. Experimental Setup
Figure 12 illustrates the experiment configuration: A Speedgoat IO-02 which has the processing capacity to emulate a real-time PV panel, an Arduino DUE where the IPSM was applied, and a ROHDE & SCHWARZ RTE 1204 oscilloscope to visualize the results.
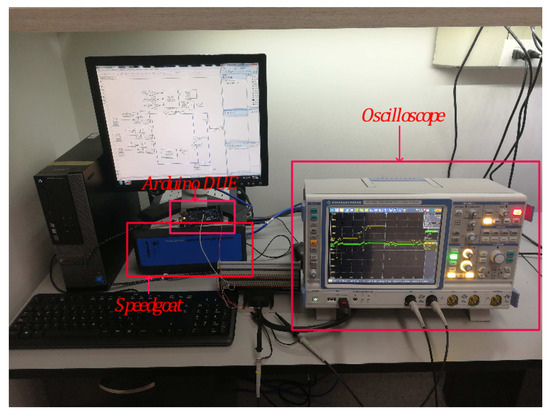
Figure 12.
Experimental setup of a Speedgoat and an arduino in hardware in the loop validating the results in an oscilloscope.
The first step was to make the circuit diagram of PV panels series connection as seen in Figure 13 in Simulink/Matlab R2011 software which is compatible with Speedgoat. This model depends on several sub-circuits. The first sub-circuit, presented in Figure 14, emulates a PV panel, the second sub-circuit will emulate the irradiance.
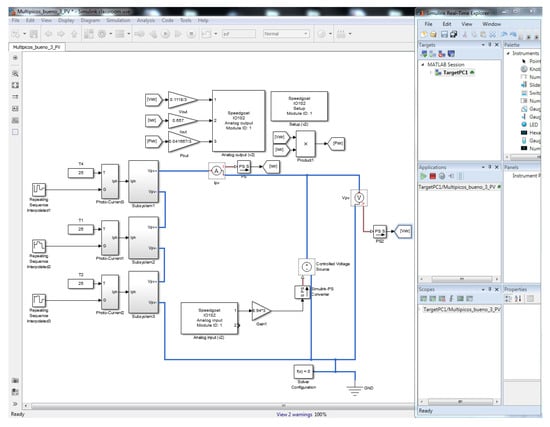
Figure 13.
Model of three panels in series with irradiation blocks and control system in the speedgoat.
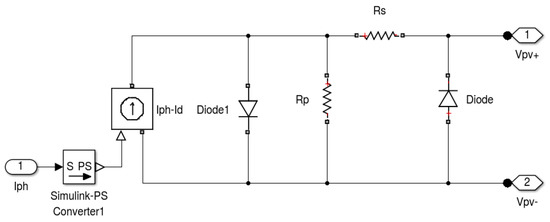
Figure 14.
Circuit model of a PV panel of a diode applied in simulink.
Regarding the PV panel model presented in Section 2, the variables to tune are: , and , for each PV panel these variables change. To identify these parameters, several authors [33,40] propose a method based on improved methods that take into account the PV panel parameters obtained from the datasheet of each manufacturer. The experiment was carried out four times with different PV panels: Solarex MSX60, SUNTECH STP245S-20/Wd, Kyocera KC200GT, and Yingli solar JS65. Table 2 expose the technical data for each PV panel and Table 3 presents the parameters used for each PV panel.
Table 2.
Technical data of the PV panel.
Table 3.
Parameters of the mathematical model , and for each PV panel.
The circuit that emulates the irradiance is presented in Figure 15. [41] proposes a Simulink system which depends on °C) of each panel. Finally, the model is implemented for three PV panels connected in series. In this way, the input and output of the Speedgoat are set to be able to read the current power (W) and the input to create the changes in the voltage (V).
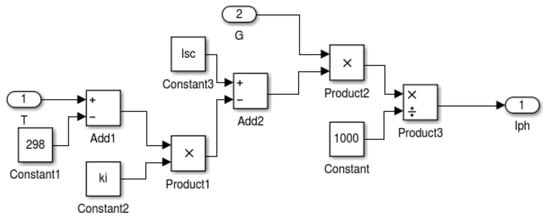
Figure 15.
Model of the irradiation system in simulink.
Different voltage sweeps to the series connection were performed, while G was constant for every sweep. That is to say, a voltage sweep for the series connection was the first test with a G value, for the second one, which changes the G values and the sweep voltage.
Figure 16 illustrates the characteristic curves of each configuration in the oscilloscope. With the emulation of the PV series connection suitably working, the Arduino DUE connects the analog input and output with the output and input of the Speedgoat respectively, where the input will indicate the power generated by the PV array and the output will change the voltage of the PV array, which is where the IPSM algorithm established in Section 4.2 will work. The algorithm requires several changes in the G parameter on each one of the PV arrays, in an aim to perform a MPPT in different situations.
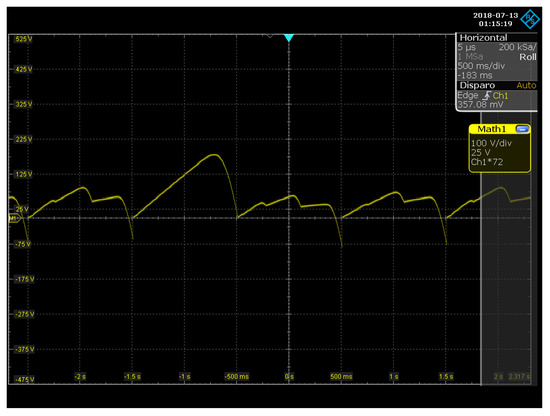
Figure 16.
Testing of the model of three PVs panels series emulated with different G.
Experimental Results
Figure 17, Figure 18, Figure 19 and Figure 20 represents the test results with the PV arrays of Kyocera, MSX60, Solar-SJ65, and STP245S PV panels respectively. As an example, for Figure 17, the blue line depicts the scanning of the PV array, performed under the previously described irradiance conditions, emulating a partial shading in the first 5 s. The black dotted line represents the maximum power at which the system can be transformed if the MPP is reached and the red line is the MPPT. As this figure represents, the algorithm, during the exploration process, identify the area of the most significant peak in the first 2 s. As a starting point, it makes exploitation refining the MPP, finding it at the end in the green circles. The blue line in the box below, which is the reference voltage, represents the Arduino DUE output and this behavior indicates the IPSM search for the MPPT. With a voltage change, there will exist a change in the delivered power, thereby, if the MPPT is located at a local maximum, it could not reach the global MPP. This is also an indicator that the algorithm is doing a search and is not stationary. This analysis confirms not only the algorithm’s stable behavior in the MPPT search but the IPSM accuracy to estimate the MPPT under different power points in a PV panels series connection ensuring that the MPP will be reached in a short amount of time as Figure 17, Figure 18, Figure 19 and Figure 20 show.
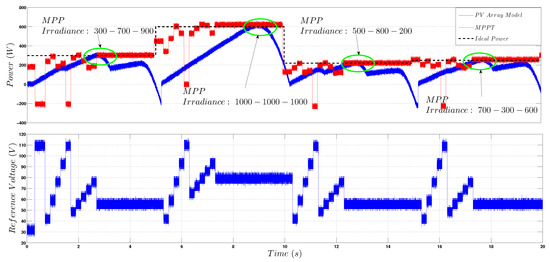
Figure 17.
MPPT of the PV panel Kyocera array with curves of the model generated by the speedgoat.
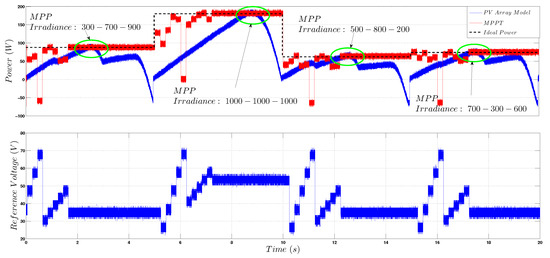
Figure 18.
MPPT of the array of PV panel MSX60 with curves of the model generated by the speedgoat.
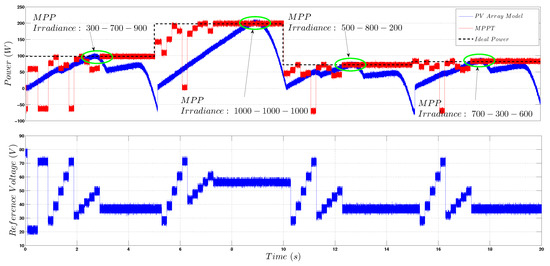
Figure 19.
MPPT of the array of PV panel Solar-Sj65 with curves of the model generated by the speedgoat.
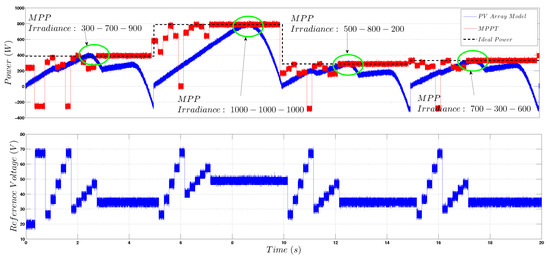
Figure 20.
MPPT of the array of PV panel STP245S with curves of the model generated by the speedgoat.
7. Conclusions
In this paper the IPSM optimization algorithm was implemented for a MPPT in a series connected PV array in which, due to PS conditions, its P-V curve presented multi peaks. As shown in the results, the applied algorithm demonstrated the accuracy by having different PV arrays of different types of PV panels as well as the validation with PSIM simulations and the corresponding emulations in the hardware in the loop system, the Speedgoat, and the Arduino DUE. The IPSM algorithm application to MPPT worked correctly under adverse circumstances, to be specific, the irradiance changes. Authors in [37] simulate a PV array in which the algorithm applied to the MPPT for partial shading condition was a PSM, its fastest response time was 24 ms, in contrast with the 4 ms time response of the simulation test performed in this paper, as seen in Figure 11. Having a similar PV panels connection previously proposed by the authors, this result led to an improvement in the time response by 96%, however, for the same hardware in the loop test, the response to find the MPP was 3 s. The differences between the simulated and emulated results are due to the different data transmissions speed of the devices.
Author Contributions
Conceptualization, A.I. and J.H.; methodology, A.T.; software, A.T.; validation, J.M., J.P.-R.; formal analysis, J.H.; investigation, A.I.; resources, A.T.; data curation, J.M.; writing–original draft preparation, M.D.; writing–review and editing, M.D.; visualization, J.P.-R.; supervision, A.I.; project administration, A.T.; funding acquisition, A.I. All authors have read and agreed to the published version of the manuscript.
Funding
This work was supported by the Instituto Tecnológico Metropolitano (ITM) of Medellin, Colombia through grant P14105, by the thesis master “Methodology to optimize the maximum power point tracking of a photovoltaic cells generator employing multi-model control techniques” code PM-14101 and the project P14220, and A. Ibeas is partially supported by the Basque Government through project IT1207-19.
Conflicts of Interest
The authors declare no conflict of interest.
References
- Lee, H.G.; Huh, J.H. A cost-effective redundant digital excitation control system and Test Bed Experiment for safe power supply for process industry 4.0. Processes 2018, 6, 85. [Google Scholar] [CrossRef]
- Hashemi-Dezaki, H.; Hariri, A.M.; Hejazi, M.A. Impacts of load modeling on generalized analytical reliability assessment of smart grid under various penetration levels of wind/solar/non-renewable distributed generations. Sustain. Energy Grids Netw. 2019, 20, 100246. [Google Scholar] [CrossRef]
- Kish, G. Modelling and control of photovoltaic panels utilising the incremental conductance method for maximum power point tracking. IET Renew. Power Gener. 2012, 6, 259–266. [Google Scholar] [CrossRef]
- Du, Y.; Yan, K.; Ren, Z.; Xiao, W. Designing localized MPPT for PV systems using fuzzy-weighted extreme learning machine. Energies 2018, 11, 2615. [Google Scholar] [CrossRef]
- Seyedmahmoudian, M.; Soon, T.K.; Horan, B.; Ghandhari, A.; Mekhilef, S.; Stojcevski, A. New ARMO-based MPPT Technique to Minimize Tracking Time and Fluctuation at Output of PV Systems under Rapidly Changing Shading Conditions. IEEE Trans. Ind. Informat. 2019. [Google Scholar] [CrossRef]
- Kihal, A.; Krim, F.; Laib, A.; Talbi, B.; Afghoul, H. An improved MPPT scheme employing adaptive integral derivative sliding mode control for photovoltaic systems under fast irradiation changes. ISA Trans. 2019, 87, 297–306. [Google Scholar] [CrossRef]
- Kim, J.C.; Huh, J.H.; Ko, J.S. Improvement of MPPT control performance using fuzzy control and VGPI in the PV system for micro grid. Sustainability 2019, 11, 5891. [Google Scholar] [CrossRef]
- Lopez-Santos, O.; Garcia, G.; Martinez-Salamero, L.; Giral, R.; Vidal-Idiarte, E.; Merchan-Riveros, M.C.; Moreno-Guzmán, Y. Analysis, design, and implementation of a static conductance-based MPPT method. IEEE Trans. Power Electron. 2019, 34, 1960–1979. [Google Scholar] [CrossRef]
- Li, H.; Yang, D.; Su, W.; Lü, J.; Yu, X. An overall distribution particle swarm optimization MPPT algorithm for photovoltaic system under partial shading. IEEE Trans. Ind. Electron. 2019, 66, 265–275. [Google Scholar] [CrossRef]
- Wu, Z. Application of improved chicken swarm optimization for MPPT in photovoltaic system. Optim. Control Appl. Meth. 2018, 39, 1029–1042. [Google Scholar] [CrossRef]
- Ishaque, K.; Salam, Z.; Amjad, M.; Mekhilef, S. An Improved Particle Swarm Optimization (PSO)–Based MPPT for PV With Reduced Steady-State Oscillation. IEEE Trans. Power Electron. 2012, 27, 3627–3638. [Google Scholar] [CrossRef]
- Chao, K.H.; Lin, Y.S.; Lai, U.D. Improved particle swarm optimization for maximum power point tracking in photovoltaic module arrays. Appl. Energy 2015, 158, 609–618. [Google Scholar] [CrossRef]
- Phimmasone, V.; Kondo, Y.; Kamejima, T.; Miyatake, M. Evaluation of extracted energy from PV with PSO-based MPPT against various types of solar irradiation changes. In Proceedings of the 2010 International Conference on Electrical Machines and Systems (ICEMS), Incheon, Korea, 10–13 October 2010; pp. 2–6. [Google Scholar]
- Ahmed, J.; Salam, Z. A Maximum Power Point Tracking (MPPT) for PV system using Cuckoo Search with partial shading capability. Appl. Energy 2014, 119, 118–130. [Google Scholar] [CrossRef]
- Tajuddin, M.F.N.; Arif, M.S.; Ayob, S.M.; Salam, Z. Perturbative methods for maximum power point tracking (MPPT) of photovoltaic (PV) systems: A review. Int. J. Energy Res. 2015, 39, 1153–1178. [Google Scholar] [CrossRef]
- Ahmed, J.; Salam, Z. A soft computing MPPT for PV system based on Cuckoo Search algorithm. In Proceedings of the International Conference on Power Engineering, Energy and Electrical Drives, Istanbul, Turkey, 13–17 May 2013; pp. 558–562. [Google Scholar]
- Tokushima, D.; Uchida, M.; Kanbei, S.; Ishikawa, H.; Naitoh, H. A New MPPT Control for Photovoltaic Panels by Instantaneous Maximum Power Point Tracking. Electr. Eng. Jpn. 2006, 157, 1182–1188. [Google Scholar] [CrossRef]
- Robles Algarín, C.; Taborda Giraldo, J.; Rodríguez Álvarez, O. Fuzzy logic based MPPT controller for a PV system. Energies 2017, 10, 2036. [Google Scholar] [CrossRef]
- Liu, X.; Wang, Y. Reconfiguration Method to Extract More Power from Partially Shaded Photovoltaic Arrays with Series-Parallel Topology. Energies 2019, 12, 1439. [Google Scholar] [CrossRef]
- Gopal, Y.; Birla, D.; Lalwani, M. Selected Harmonic Elimination for Cascaded Multilevel Inverter Based on Photovoltaic with Fuzzy Logic Control Maximum Power Point Tracking Technique. Technologies 2018, 12, 62. [Google Scholar] [CrossRef]
- Hammami, M.; Grandi, G. A single-phase multilevel PV generation system with an improved ripple correlation control MPPT algorithm. Energies 2017, 10, 2037. [Google Scholar] [CrossRef]
- Carannante, G.; Fraddanno, C.; Pagano, M.; Piegari, L. Experimental Performance of MPPT Algorithm for Photovoltaic Sources Subject to Inhomogeneous Insolation. IEEE Trans. Ind. Electron. 2009, 56, 4374–4380. [Google Scholar] [CrossRef]
- Guiza, D.; Ounnas, D.; Soufi, Y.; Maamri, M. Implementation of Perturb and Observe Based MPPT Algorithm for Photovoltaic System. In Proceedings of the International Symposium on Technology and Sustainable Industry Development. ISTSID’2019, EL OUED, Algeria, 24–26 February 2019. [Google Scholar]
- Necaibia, S.; Kelaiaia, M.S.; Labar, H.; Necaibia, A.; Castronuovo, E.D. Enhanced auto-scaling incremental conductance MPPT method, implemented on low-cost microcontroller and SEPIC converter. Sol. Energy 2019, 180, 152–168. [Google Scholar] [CrossRef]
- Premkumar, M.; Sumithira, R. Humpback Whale Assisted Hybrid Maximum Power Point Tracking Algorithm for Partially Shaded Solar Photovoltaic Systems. J. Power Electron. 2018, 18, 1805–1818. [Google Scholar]
- De la Parra, I.; Muñoz, M.; Lorenzo, E.; García, M.; Marcos, J.; Martínez-Moreno, F. PV performance modelling: A review in the light of quality assurance for large PV plants. Renew. Sustain. Energy Rev. 2017, 78, 780–797. [Google Scholar] [CrossRef]
- Oshaba, A.S.; Ali, E.S.; Elazim, S.M.A.B.D. PI Controller Design Using Artificial Bee System Supplied DC Motor-Pump Load. Complexity 2015, 21, 1–13. [Google Scholar]
- Ortiz-valencia, P.A. Photovoltaic System Regulation Based on a PID Fuzzy Controller to Ensure a Fixed Settling Time Regulación de un Sistema Fotovoltaico Basada en un Controlador PID Fuzzy para Asegurar un Tiempo de Establecimiento Constante. TecnoLógicas 2013, 605–616. [Google Scholar] [CrossRef]
- De Brito, M.A.G.; Galotto, L.; Sampaio, L.P.; e Melo, G.d.A.; Canesin, C.A. Evaluation of the Main MPPT Techniques for Photovoltaic Applications. IEEE Trans. Ind. Electron. 2013, 60, 1156–1167. [Google Scholar] [CrossRef]
- Tobon-Mejia, A.F.; Herrera-Cuartas, J.A.; Pelaez-Restrepo, J. Estimación de los Parámetros de un Modelo de una Celda Fotovoltaica Utilizando un Algoritmos de Optimización de Búsqueda de Patrones. Revista Ingenio Magno 2014, 5, 95–101. [Google Scholar]
- Achouby, H.E.; Zaimi, M.; Ibral, A.; Assaid, E.M. New analytical approach for modelling effects of temperature and irradiance on physical parameters of photovoltaic solar module. Energy Convers. Manag. 2018, 177, 258–271. [Google Scholar] [CrossRef]
- Messalti, S.; Harrag, A.; Loukriz, A. A new variable step size neural networks MPPT controller: Review, simulation and hardware implementation. Renew. Sustain. Energy Rev. 2017, 68, 221–233. [Google Scholar] [CrossRef]
- Kang, T.; Yao, J.; Jin, M.; Yang, S.; Duong, T. A novel improved cuckoo search algorithm for parameter estimation of photovoltaic (PV) models. Energies 2018, 11, 1060. [Google Scholar] [CrossRef]
- Safari, A.; Mekhilef, S. Simulation and hardware implementation of incremental conductance MPPT with direct control method using cuk converter. IEEE Trans. Ind. Electron. 2011, 58, 1154–1161. [Google Scholar] [CrossRef]
- Torczon, V. On the Convergence of Pattern Search Algorithms. SIAM J. Optim. 1997, 7, 1–25. [Google Scholar] [CrossRef]
- Liu, L.; Zhang, X. Generalized pattern search methods for linearly equality constrained optimization problems. Appl. Math. Comput. 2006, 181, 527–535. [Google Scholar] [CrossRef]
- Javed, M.Y.; Murtaza, A.F.; Ling, Q.; Qamar, S.; Gulzar, M.M. A Novel MPPT design using Generalized Pattern Search for Partial Shading Condition. Energy & Build. 2016, 133, 59–69. [Google Scholar]
- Tobón, A.; Peláez-Restrepo, J.; Villegas-Ceballos, J.; Serna-Garcés, S.; Herrera, J.; Ibeas, A. Maximum Power Point Tracking of Photovoltaic Panels by Using Improved Pattern Search Methods. Energies 2017, 10, 1316. [Google Scholar] [CrossRef]
- Spiazzi, G.; Buso, S.; Mattavelli, P. Analysis of MPPT algorithms for photovoltaic panels based on ripple correlation techniques in presence of parasitic components. In Proceedings of the 2009 Brazilian Power Electronics Conference, Bonito-Mato Grosso do Sul, Brazil, 27 September–1 October 2009; pp. 88–95. [Google Scholar]
- Rajasekar, N.; Krishna Kumar, N.; Venugopalan, R. Bacterial Foraging Algorithm based solar PV parameter estimation. Sol. Energy 2013, 97, 255–265. [Google Scholar] [CrossRef]
- Pandiarajan, N.; Muthu, R. Mathematical Modeling of Photovoltaic Module with Simulink. In Proceedings of the International conference on Electrical Energy System, Newport Beach, CA, USA, 3–5 January 2011; pp. 4–9. [Google Scholar]


© 2020 by the authors. Licensee MDPI, Basel, Switzerland. This article is an open access article distributed under the terms and conditions of the Creative Commons Attribution (CC BY) license (http://creativecommons.org/licenses/by/4.0/).