Abstract
A technique to analyse the economic viability of offshore farms composed of wave energy converters is proposed. Firstly, the inputs, whose value will be considered afterwards in the economic step, was calculated using geographic information software. Secondly, the energy produced by each wave converter was calculated. Then the economic factors were computed. Finally, the restriction that considers the depth of the region (bathymetry) was put together with the economic outputs, whose value depends on the floating Wave Energy Converter (WEC). The method proposed was applied to the Cantabric and Atlantic coasts in the north of Spain, a region with a good offshore wave energy resource. In addition, three representative WECs were studied: Pelamis, AquaBuoy and Wave Dragon; and five options for electric tariffs were analysed. Results show the Wave Energy Converter that has the best results regarding its LCOE (Levelized Cost of Energy), IRR (Internal Rate of Return) and NPV (Net Present Value), and which area is best for the development of a wave farm.
1. Introduction
On December 2015, the meeting of the UNFCCC (United Nations Framework Convention on Climate Change) achieved the Paris Agreement, which explains the importance of combating climate change in areas such as the long-term temperature objective, global peaking and mitigation, among others [1]. In this context, repowering wind farms [2] and offshore renewable energies are being developed as alternatives to fossil fuels, being of interest to institutions [3].
There are several categories of offshore renewable resources: waves, tides, offshore wind [4,5], salinity gradient and ocean thermal energy [6]. These types of energies can be developed in oceanic areas where traditional resources are not feasible [7]. In addition, according the bathymetry where the offshore renewable energy farm was installed, it can be classified in fixed and floating offshore renewable energies, depending on the depth [8]: up to 50 m (shallow waters) or more than 50 m (deep waters), respectively [9].
Wave energy is considered by researchers by following two approaches: designing and testing wave energy devices and studying the wave energy resource to find the best locations where wave converters can be installed and to improve the energy extraction of the platforms [10,11,12]. This is especially important for large coastal areas, as the problem of supplying wave energy to an isolated island is more specific and the needs are often more demanding, but even there studies are required [13,14,15,16,17,18,19].
The energy of waves is extracted using a WEC (Wave Energy Converter), which is classified depending on its working principle [20,21]. The oscillating water column structure uses an air turbine [22,23]. Some examples of this type of technology are Pico [24], LIMPET, Mighty Whale [25], Sperboy [26] and Oceanlinx [9]. The oscillating devices, for example AquaBuoy (AquaEnergy Group, New South Wales, Australia) [27], IPS Buoy (Interproject Service, Bettna Sweden) [28], FO3 (Fred Olsen Ltd, Oslo Norway) [29], Wavebob (Tonn Energy, Dublin Ireland) [30], PowerBuoy (Ocean Power Technologies, Houston USA) [31], Pelamis (Pelamis Wave Power, Edinburgh, Scotland, UK) [32], PS Frog (Lancaster University Renewable Energy Group, Lancaster UK) [33], SEAREV (École Centrale de Nantes, Nantes, France) [34], AWS (AWS Ocean Energy, Dochgarroch, UK), WaveRoller (AW Energy, Vantaa, Finland) [35] and Oyster (Aquamarine Power, Edinburgh, UK) [36], use a hydraulic engine and turbine, and a linear electrical generator. Finally, the overtopping structure uses a low-head hydraulic turbine. Some known devices are TAPCHAN (Norwave A/S, Oslo, Norway) [25], SSG (WAVEenergy AS, TANANGER Norway) [37] and Wave Dragon (Wave Dragon, København K, Denmark) [38]. These devices are developed based on numerical and experimental hydrodynamic techniques [39,40].
The second approach is the study of the wave energy resource. Therefore, forecasting waves for deep and shallow waters [12,41] in the long-term temporal scales is very important to study the energy produced. López-Ruiz et al. [12] developed a “method for the medium to the long-term stochastic forecasting” of the parameters that influence the wave energy. Lin et al. [42] determined the wave energy resource distribution in a large area and applied an algorithm to choose the hotspots for placing wave energy farms.
In addition, the calculation of the wave energy resource of the site selected is crucial to determine the main economic aspects of WECs [37,41]. There are authors that considered the wave resource in different locations: [13], Canary Islands (Spain) [18], Oregon and South-West Washington (USA) [43], Cornish coast (UK) [44], Atlantic Coast [45] and Cape Verde Islands [19], among others. Others analysed some global economic aspects of wave energy in different locations in the European Union [46]. However, it is very difficult to calculate the data of all the life-cycle costs of a floating wave energy farm because there are no data about real locations in real offshore wave farms. In this context, Castro-Santos et al., developed a method to determine the costs of floating offshore wind [47], combined wave energy and offshore wind [48] and the comparison of floating offshore wind, as well as combined systems and wave energy [49]. However, all these studies were focused on the calculation of the costs for a particular location. In this sense, the present paper takes into consideration the calculation of the costs in these previous studies and calculates the factors of the economic feasibility of the wave energy farm, but instead of considering only one point of the geography, it considers all the points of the geography selected in the study. Therefore, the result of the study will not be a particular value for a particular point, but it will be a map for a particular location that the user wants. In this paper one specific location was selected, but the user can select the location that he wants, which made this tool very versatile in terms of wave energy planning. Therefore, this article integrates the economic calculation of a wave energy farm in geographical information system (GIS) software, used for other purposes [50,51], and which is more useful in terms of analysis for investors than a particular point of one location considered in the previous papers.
The aim of this article is to carry out a procedure to estimate the economic viability of floating offshore farms dedicated to the exploitation of wave energy, especially in terms of their economic characteristics, such as the Levelized Cost Of Energy (LCOE), which allows to compare different energy technologies at the same location, or its Internal Rate of Return (IRR) and Net Present Value (NPV), whose value are associated to the economic feasibility of the farm. The technique proposed begins calculating the input maps considering geographic information systems: the shape parameter of the offshore wind, the scale parameter of the offshore wind, the height and period of the waves, the bathymetry and the main distances of the farm. Secondly, the energy generated by each wave device is calculated, it can be estimated contemplating several procedures, varying the available input data and the desired precision. Otherwise, the economic parameters are computed taking into account the inputs provided in the earlier steps. Finally, the restriction of bathymetry will be added to each map of each economic parameter, whose value depends on the kind of WEC.
The method proposed was applied to the Cantabric and Atlantic coast of the north of Spain, where the offshore wave energy resource assessment shows good results in terms of wave resource [52]. In addition, three WECs were analysed: AquaBuoy, Wave Dragon and Pelamis; and five scenarios for electric tariffs were analysed. Results show the best wave converter in economic terms, considering its NPV, IRR and LCOE, and where the optimal location is for installing a farm of the characteristics defined within the chosen region.
2. Method
2.1. General Description
The four phases of the proposed method are described in Figure 1.
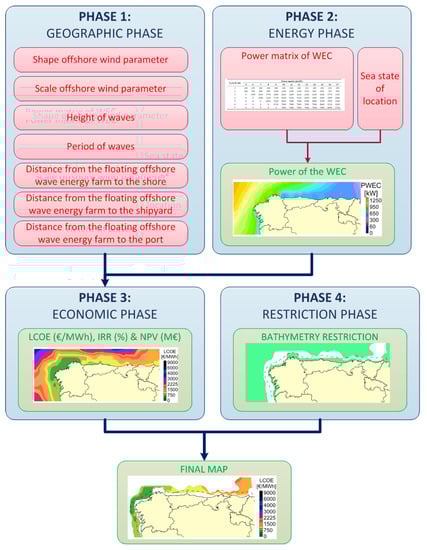
Figure 1.
Method proposed.
The geographic stage generated the inputs, which were applied in the economic stage: the shape and scale parameter of wind, the period and height of waves and the depth of the area, as well as the distance of the WEC farm to shore, WEC farm to shipyard and WEC farm to port.
The second stage is the estimation of the energy produced by each wave device, which was estimated contemplating two procedures, depending on the accessible information and the wanted exactitude.
Otherwise, the whole life-cycle cost of the WEC farm was estimated considering the energy produced and the initial inputs. Then, using the costs and the energy, the main parameters in the feasibility study could be developed: the IRR, NPV and LCOE.
At the end, the restriction of bathymetry will be considered, because the installation of a WEC is dependent on it. Although, it would be very interesting for future studies to consider other restrictions, such as navigation routes, seismic fault lines, conservation protected areas, etc. These restrictions were not considered in this study.
2.2. Phase 1
In the first stage (geographic), the inputs of the economic stage were calculated. They were introduced as input maps in the methodology, which will output the economic maps. The input values were shape and scale parameter of the offshore wind, the period and height of waves and the depth of the area selected, as well as the distance of the WEC farm to shore, WEC farm to shipyard and WEC farm to port.
The wind shape and scale parameters were obtained from the Era-Interim’s wind transport vectors (u, v). The intensity of the wind was calculated using Equation (1):
Afterwards, a probability distribution function (PDF) was fitted to the calculated wind intensity data set. The Weibull distribution was chosen, considering that it is the most commonly used for this parameter [53]. Using the Matlab function wblfit, applied to the mentioned data set, it was possible to obtain the scale and shape parameters, done so by using the Maximum Likelihood method with a 95% confidence interval.
The wave factors Wave Period (Tm) (“mean of all wave periods in a time-series representing a certain sea state” [54]) and Significant Wave Height (Hs) (“average height of the highest waves in a waves in a wave group” [54]) were taken from a hindcast study previously performed [55] with the wave models WW (Wavewatch) III [56] and SWAN (Simulating Waves Nearshore) [57].
Considering the size of the grid, it was important to guarantee that the farm was located inside the cell. The wave devices were installed (see Figure 2) following a general distribution:
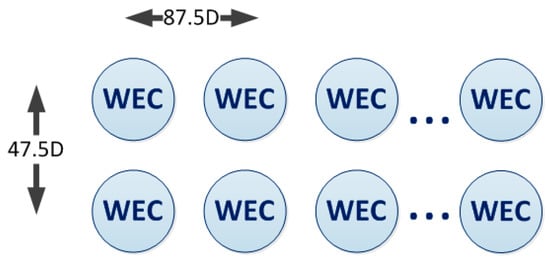
Figure 2.
Configuration of the wave farm grid.
- Between devices: a distance of 87.5 times D (characteristic diameter).
- Between lines of devices: a distance of 47.5 times D.
The bathymetry studied was provided by GEBCO (General Bathymetric Chart of the Oceans), and it was considered for both the SWAN simulations and the bathymetry restriction assessment. However, to have the cell size recommended for application of the wave farm, the bathymetry resolution and the parameters aforementioned (Hs, Tm and I) were interpolated from a grid resolution of 0.05°×0.1° for Hs and Tm, and 0.5° × 0.5° for I to 0.15° × 0.3°. To do so, the function interp2, from Matlab (MathWorks, USA), which uses a linear interpolation, was applied to the data.
2.3. Phase 2
The energy stage calculates the energy generated by the wave converters (). There are two approaches to calculate the energy: one of them considers the power matrix of the WEC and the probability matrix of the sea states of the place taken into account, as is shown in Equation (2); being the % of energy related to the bin described by line and column . On the other hand, is the electric power related to the identical energy bin for the wave energy converter studied [21], which is a function of wave height () and wave period (); the other methodology depends on the water density (), gravity (), wave period (), wave height () and % efficiency (), as is shown in Equation (3):
Then the energy generated by one wave energy converter is computed, as Equation (4) indicates. It depends on the quantity of annual hours (), the power generated (), the availability () and the losses generated by the transmission system (), as
In this paper, the first method will be applied, because it is more detailed and gives better results. Consequently, it is essential to provide the power matrix of the wave device, provided by the enterprise of the wave device, and the matrix of probability of the sea states for each point of the layout of the location of the study.
2.4. Phase 3
The economic stage uses the inputs of Phase 1 and the results obtained in Phase 2 to determine two aspects:
- The investment of the wave farm.
- The economic factors needed to determine if the farm is economically viable.
All these inputs (the shape and scale factors of the offshore wind, wave height, wave period, the depth of the region, the distances from the farm to the shore, shipyard and port) and the energy generated by the converter change, their value depending on the “k” point of the map, were taken into account. For instance, the wind parameters affect to the mooring cost, the wave height and period affect the calculation of the energy produced; the depth affects the calculation of mooring; and the distances affect the cost of installing, exploiting and dismantling.
Therefore, the estimation of the total cost of a Floating Offshore Wave Energy Farm () is calculated adapting the lifecycle cost of an offshore energy farm, which has been developed in previous analyses [58,59].
The global cost of the farm () can be divided in several sub-costs [1]: defining (C1), developing and designing (C2), manufacturing (C3), installing (C4), exploiting (C5) and, finally, dismantling (C6).
On the other hand, the LCOE uses the costs (), the total energy generated () (MWh/year) and the cost of capital () [60].
Nevertheless, NPV consists in the net value of the cash flows of the project, taking into account its discount from the initial years, when the investment is developed [58] (Castro-Santos et al., 2016). It depends on the cash flow (), the life of the project (), the initial investment () and the capital cost () (Castro-Santos et al., 2016).
On the other hand, IRR is the capital cost obtained when the NPV is equal to zero [58,61].
The WACC (Weighted Average Cost of Capital) (Equation (9)) depends on the total equity () and its cost (), the total debt () and its cost () and the tax shield ().
The FOWEF is economically viable if:
- The net present value is higher than zero.
- The internal rate of return is higher than the weighted average capital cost.
- The levelized cost of energy has reduced values comparing different types of technologies.
2.5. Phase 4
Phase 4 consists of applying restrictions to the area where the FOWEF would be installed. In this context, a good region in economic terms (IRR, NPV and LCOE) can be limited by some restrictions (seismic areas, conservation regions, offshore electric cables, navigation routes, etc.). However, the only restriction taken into account in this work was the bathymetry. In this context, the value considered as a restriction regarding depth has been calculated considering some increasing of the maximum draft of all the platforms. The main reason is because the platform needs a space from the lowest part of the structure to the seabed in order to install the mooring and anchoring systems. This process was made using the geographic information system software QGIS (QGIS Development Team, GNU GPL).
On the other hand, it is important to restrict the maps in Phase 4 and not in Phase 1 because the value of the restrictions can change. For instance, regarding bathymetry restrictions: changes due to the improvement of the technology, which reduce the value of the draft; and regarding navigation routes: changes in the navigation areas due to changes in the world trade, etc. Therefore, it is better to calculate the economic map for all the points of the location and, afterwards, limiting the map using the restrictions.
3. Case Study
The location of the case study is the Cantabric and Atlantic regions in the northwest of Spain, as shown in Figure 3.
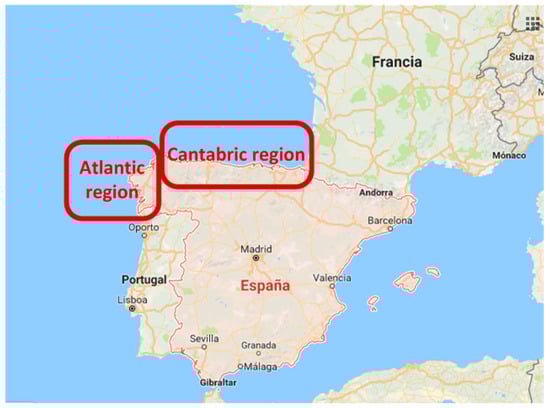
Figure 3.
Spanish area selected.
This location is characterized by a good offshore wave resource and deep waters (more than 500 m very closed to the Galician shore (Figure 4).
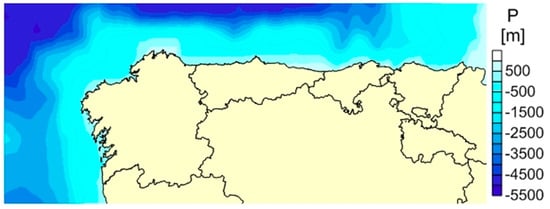
Figure 4.
Bathymetry of the north of Spain.
Three different floating wave devices were studied: Pelamis, AquaBuoy and Wave Dragon. Properties of the farm vary depending on the type of converter studied (see Figure 5), as shown in Table 1.

Figure 5.
Types of devices studied: Pelamis (1) [62], AquaBuoy (2) [63] and Wave Dragon (3) [64].

Table 1.
Properties of the farms considering different converters.
Twenty years is the life considered for the farm, with the dimension of the grid being 16 km × 33 km.
The Spanish electric tariff regulation is always changing, making it an unstable energy situation for enterprises [65]. Therefore, several different tariffs were considered [66]: 100 €/MWh (S1), 200 €/MWh (S2), 300 €/MWh (S3), 400 €/MWh (S4) and 600 €/MWh (S5).
Figure 6 shows the restriction studied for depth: 50 m, whose value is created by adding 20 m onto the highest draft of all the structures taken into account.

Figure 6.
Bathymetry restriction.
The energy produced by a wave device in all the points of the geography selected depends on its power matrix (Table 2, Table 3 and Table 4) and the number of occurrences of each sea state, in each point. Table 5 and Table 6 represent an example of the number of occurrences of each sea state for two aleatory points of the coast. However, each point of the geography is characterized by one matrix similar to these.
Table 2.
Power matrix of D1, Hs being the significant wave height and Tp the peak wave period (“wave period with the highest energy” [54]) [60].
Table 3.
Power matrix of D2, Hs being the significant wave height and Te the wave energy period [60].
Table 4.
Power matrix of D3, Hs being the significant wave height and Tp the peak period [60].
Table 5.
Example of the number of occurrences for each sea state (monthly average) for a point in the Atlantic region of Spain.
Table 6.
Example of the number of occurrences for each sea state (monthly average) for a point in the Atlantic region of Spain.
Therefore, the power produced by each WEC can be calculated. Figure 7, Figure 8 and Figure 9 show the power produced by the different WECs considered depending on the region selected. In this sense, Wave Dragon is the structure that takes advantage of the resource of waves in the north of Spain. However, although this fact is very important, the calculation of the economic feasibility is also dependent on the investment required for installing the farm. Therefore, it should be also analysed in order to determine the best structure in economic terms.
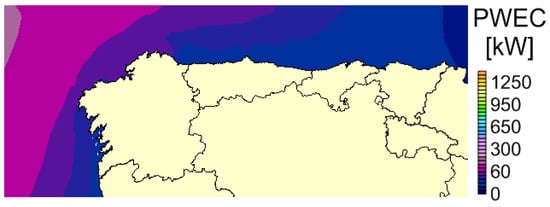
Figure 7.
Power of Pelamis.
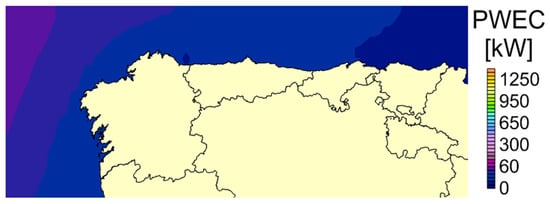
Figure 8.
Power of AquaBuoy.

Figure 9.
Power of Wave Dragon.
The value considered for and is 0.9. Finally, the main economic parameters are shown in Table 7.
Table 7.
Economic parameters.
4. Results
The best LCOE has a value of 513.17 €/MWh for the Wave Dragon (Figure 10c). It is followed by 1710.98 €/MWh for the Pelamis, see Figure 10a, and 2627.60 €/MWh for the AquaBuoy (Figure 10b). Figure 10 also shows that the best area for exploiting wave energy is the northwest area of the Galician region, where all the platforms have the lowest LCOE.
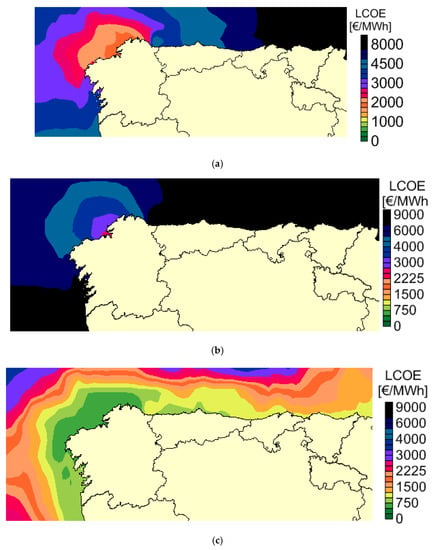
Figure 10.
Results for levelized cost of energy without restrictions for D1 (a), D2 (b) and D3 (c).
Nevertheless, the previous maps (Figure 10) cannot be available in all the area that they have been developed. It is due to the fact that the installation of WECs depends on the bathymetry. In this context, a restriction for bathymetry has been considered. It generates a different map of LCOE, with restrictions for each different WEC.
Figure 11, Figure 12 and Figure 13 show the values of LCOE, IRR and NPV limited by the restriction of bathymetry. It is important because there are areas where the economic values can be good, but whose depth limits the installation of the farm.
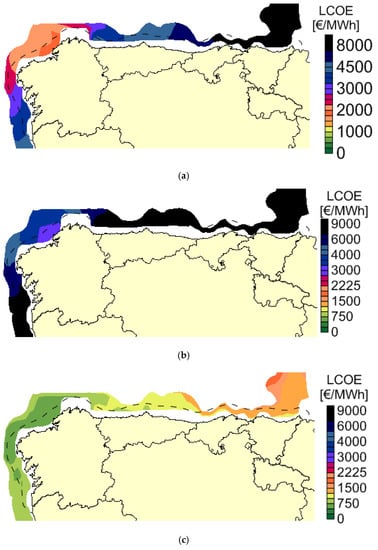
Figure 11.
Levelized cost of energy with restrictions for D1 (a), D2 (b) and D3 (c).
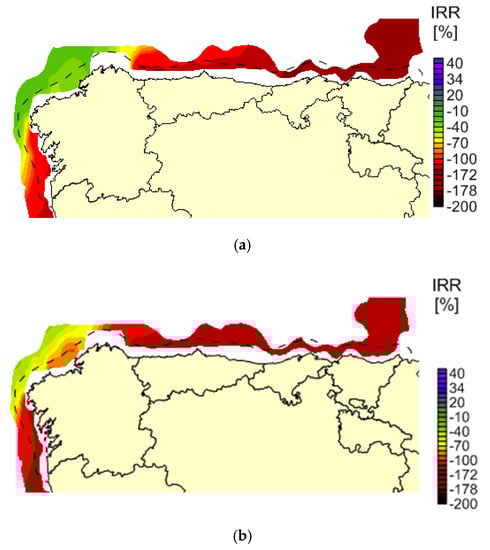
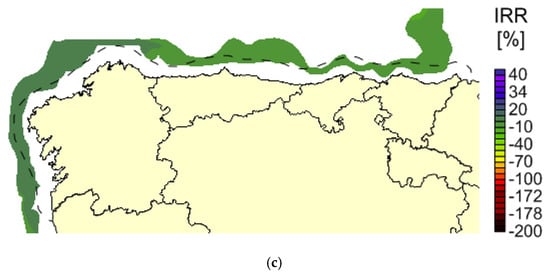
Figure 12.
Internal rate of return contemplating a 600 €/MWh tariff and a depth restriction for D1 (a), D2 (b) and D3 (c).
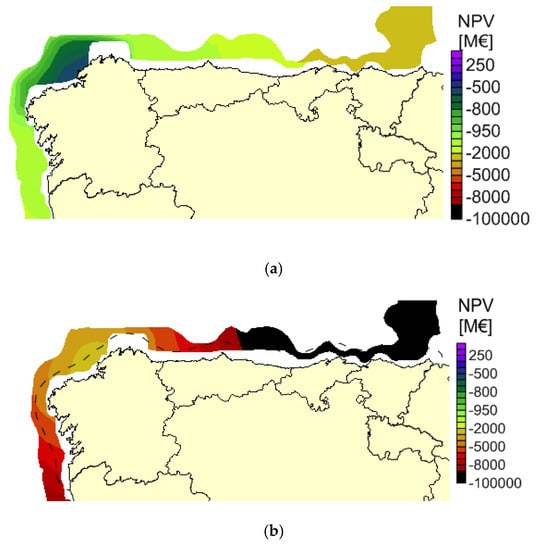
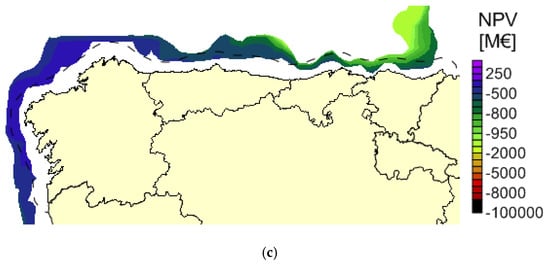
Figure 13.
Outputs for net present value studying a 600 €/MWh tariff and a depth restriction for D1 (a), D2 (b) and D3 (c).
Nevertheless, in this study, it does not affect to the best values for the LCOE for all the WECs, being the best areas located in the area selected considering the bathymetry restriction, as is shown in Figure 11.
However, studying S1 with the 100 €/MWh electric tariff, all the results are not economically feasible. In this context, the best value for IRR is −17.45% for Wave Dragon. All the values are inferior to the WACC. In addition, the best values for NPV go from −725.29 M€ for Wave Dragon to −829.00 M€ for Pelamis and to −2664.39 M€ for AquaBuoy, all of them being less than zero, which indicates that the project would not be economically feasible with the electric tariff taken into consideration.
Moreover, results for S2 with the 200 €/MWh electric tariff have better results than S1, but they are also not economically feasible. Then, the best value for IRR is −8.13% for Wave Dragon. All the results calculated for the IRR in S2 are less than the WACC; therefore, the project will not be economically feasible in these conditions. In addition, the best values for NPV go from −553.05 M€ for Wave Dragon to −776.97 M€ for Pelamis and to −2558.95 M€ for AquaBuoy. Therefore, the values of NPV for S2 are all negative. It indicates that this project is not economically feasible with the electric tariff proposed in S2.
Results for S3 with the 300 €/MWh electric tariff are better than S1 and S2, but they are also not economically feasible. Then, the best value for IRR is −2.77% for Wave Dragon. All the results calculated for the IRR in S3 are less than the WACC; therefore, the project will not be economically feasible in these conditions. In addition, the best values for NPV go from -382.28 M€ for Wave Dragon to −724.66 M€ for Pelamis and to −2453.11 M€ for AquaBuoy—all of them negative—which indicates that this project would not be economically feasible with the electric tariff proposed in S3.
Results for S4 with the 400 €/MWh electric tariff are superior than S1, S2 and S3, but they are also not economically feasible. Then, the best value for IRR is 1.33% for Wave Dragon. All the results calculated for the IRR in S4 are less than the WACC; therefore, the project will not be economically feasible in these conditions. In addition, the best values for NPV go from −213.29 M€ for Wave Dragon to −671.99 M€ for Pelamis and to −2346.78 M€ for AquaBuoy—all of them negative—which indicates that this project would not be economically feasible with the electric tariff proposed in S4.
However, S5, which studies a 600 €/MWh electric tariff, has the best outcome compared to the previous ones. In this sense, the best values for IRR go from 7.66% for Wave Dragon (Figure 12c) to -21.58% for Pelamis (Figure 12a) and to -28.89% for AquaBuoy (Figure 12b).
The value for WACC depends on the location, because it changes depending on the total equity (MV_e) and the total debt (MV_d), which is dependent on the life-cycle costs of the site. In this sense, values of WACC go from 6% to 7%. Therefore, Wave Dragon would be economical for S5.
Considering the net present value, its best values for S5 go from 95.16 M€ for Wave Dragon (Figure 13c) to −564.93 M€ for Pelamis (Figure 13a) and to −2132.19 M€ for AquaBuoy (Figure 13b). Therefore, Wave Dragon is the unique structure that is economically feasible regarding NPV, because it has positive values.
Maps show that the best area is located close to the city of Ferrol, A Coruña, in NW Spain. In addition, this area has technology and technicians to support this development. Therefore, it is a good region to install wave farms in the future, especially when the decrease in costs due to the commercial phases and the stability of the electric tariff would guarantee the confidence of investors.
5. Conclusions
The goal of this paper was to establish a procedure to analyse, economically, where to install offshore farms composed of wave energy converters. For this purpose, their IRR, NPV and LCOE were studied. Firstly, the inputs were created considering geographic information systems: the shape parameter of wind, the scale parameter of wind, the period and height of waves, the depth and the most important distances. Secondly, the energy generated by each converter was calculated. It can be determined considering some approaches, considering the available data or the desired precision. Afterwards, the economic factors were computed. Finally, the restriction of bathymetry was introduced onto the maps of the economic factors.
A feasibility model was developed for the Cantabric and Atlantic shores in the north of Spain, where the offshore wave energy has good values. In particular, three WECs were taken into consideration: Wave Dragon, AquaBuoy and Pelamis; and five scenarios for electric tariffs were studied. Although all three WECs studied are physically different, they can be compared in economic terms (mainly LCOE) in order to establish the most appropriate to be installed in the location selected.
Results show the economically preferable converter considering its LCOE, IRR and NPV and the best region to install a wave farm. The best LCOE has a value of 513.17 €/MWh for Wave Dragon. It is followed by 1710.98 €/MWh for Pelamis and 2627.60 €/MWh for AquaBuoy. According the IRR and the NPV, they only have economic feasible values for the case of an electric tariff of 600 €/MWh and for the Wave Dragon platform.
The best area is located close to the city of Ferrol (NW Spain). In addition, this area has technology and technicians to support this development. Therefore, installing this type of energy converters is a good opportunity for the future of the region, when the diminution of costs becomes significant so as to invest in this type of technology.
Author Contributions
Introduction: L.C.S., A.R.B., C.G.S.; Method: L.C.S., A.R.B.; Case study: L.C.-S., A.R.B.; Results: L.C.-S.; Conclusions: L.C.-S., A.R.B., C.G.S. All authors have read and agreed to the published version of the manuscript.
Funding
This work contributes to the Strategic Research Plan of the Centre for Marine Technology and Ocean Engineering (CENTEC), which is financed by the Portuguese Foundation for Science and Technology (Fundação para a Ciência e Tecnologia-FCT) under contract UID/Multi/00134/2013-LISBOA-01-0145-FEDER-007629.
Conflicts of Interest
The authors declare no conflict of interest.
Nomenclature
| Nomenclature | Concept |
| WEC | Wave Energy Converter |
| FOWEF | Floating Offshore Wave Energy Farm |
| LCOE | Levelized Cost of Energy |
| IRR | Internal Rate of Return |
| NPV | Net Present Value |
| Tm | Wave period |
| Hs | Significant wave height |
| Water density | |
| Gravity | |
| Annual hours | |
| % availability | |
| % losses generated by the transmission system | |
| C1 | Defining cost |
| C2 | Developing and Designing cost |
| C3 | Manufacturing cost |
| C4 | Installing cost |
| C5 | Exploiting cost |
| C6 | Dismantling cost |
| Total energy generated | |
| Initial investment | |
| Cash flow | |
| Total equity | |
| Cost of capital/Cost of equity | |
| Total debt | |
| Cost of debt | |
| Tax shield |
References
- United Nations. Framework Convention on Climate Change Paris Agreement; United Nations: New York, NY, USA, 2015. [Google Scholar]
- Filgueira, A.; Seijo, M.A.; Muñoz, E.; Castro-Santos, L.; Piegiari, L.; Munoz, E.; Castro, L.; Piegari, L. Technical and Economic Study of Two Repowered Wind Farms in Bustelo and San Xoán, 24.7 MW and 15.84 MW respectively. In Proceedings of the 2009 International Conference on Clean Electrical Power, Capri, Italy, 9–11 June 2009; pp. 545–549. [Google Scholar]
- Kahia, M.; Kadria, M.; Ben Aissa, M.S.; Lanouar, C. Modelling the treatment effect of renewable energy policies on economic growth: Evaluation from MENA countries. J. Clean. Prod. 2017, 149, 845–855. [Google Scholar] [CrossRef]
- Snyder, B.; Kaiser, M.J. Ecological and economic cost-benefit analysis of offshore wind energy. Renew. Energy 2009, 34, 1567–1578. [Google Scholar] [CrossRef]
- Guedes Soares, C.; Bhattacharjee, J.; Karmakar, D. Overview and prospects for development of wave and offshore wind energy. Brodogradnja 2014, 65, 87–109. [Google Scholar]
- Ma, Z.; Wang, Y.; Wang, S.; Yang, Y. Ocean thermal energy harvesting with phase change material for underwater glider. Appl. Energy 2016, 178, 557–566. [Google Scholar] [CrossRef]
- Li, Y.; Willman, L. Feasibility analysis of offshore renewables penetrating local energy systems in remote oceanic areas—A case study of emissions from an electricity system with tidal power in Southern Alaska. Appl. Energy 2014, 117, 42–53. [Google Scholar] [CrossRef]
- Myhr, A.; Bjerkseter, C.; Ågotnes, A.; Nygaard, T.A. Levelised cost of energy for offshore floating wind turbines in a life cycle perspective. Renew. Energy 2014, 66, 714–728. [Google Scholar] [CrossRef]
- Esteban, M.; Leary, D. Current developments and future prospects of offshore wind and ocean energy. Appl. Energy 2012, 90, 128–136. [Google Scholar] [CrossRef]
- Geeraerts, J.; Troch, P.; De Rouck, J.; Verhaeghe, H.; Bouma, J.J. Wave overtopping at coastal structures: Prediction tools and related hazard analysis. J. Clean. Prod. 2007, 15, 1514–1521. [Google Scholar] [CrossRef]
- Falnes, J. A review of wave-energy extraction. Marine Structures 2007, 20, 185–201. [Google Scholar] [CrossRef]
- López-Ruiz, A.; Bergillos, R.J.; Ortega-Sánchez, M. The importance of wave climate forecasting on the decision-making process for nearshore wave energy exploitation. Appl. Energy 2016, 182, 191–203. [Google Scholar] [CrossRef]
- Iglesias, G.; Carballo, R. Wave resource in El Hierro-an island towards energy self-sufficiency. Renew. Energy 2011, 36, 689–698. [Google Scholar] [CrossRef]
- Rusu, E.; Pilar, P.; Guedes Soares, C. Evaluation of the Wave Conditions in Madeira Archipelago with Spectral Models. Ocean Eng. 2008, 35, 1357–1371. [Google Scholar] [CrossRef]
- Rusu, L.; Guedes Soares, C. Wave energy assessments in the Azores islands. Renew. Energy 2012, 45, 183–196. [Google Scholar] [CrossRef]
- Vicinanza, D.; Contestabile, P.; Ferrante, V. Wave energy potential in the north-west of Sardinia (Italy). Renew. Energy 2013, 50, 506–521. [Google Scholar] [CrossRef]
- Sierra, J.P.; González-Marco, D.; Sospedra, J.; Gironella, X.; Mösso, C.; Sánchez-Arcilla, A. Wave energy resource assessment in Lanzarote (Spain). Renew. Energy 2013, 55, 480–489. [Google Scholar] [CrossRef]
- Gonçalves, M.; Martinho, P.; Guedes Soares, C. Wave energy assessment based on a 33-year hindcast for the Canary Islands. Renew. Energy 2020, 152, 259–269. [Google Scholar] [CrossRef]
- Bernardino, M.; Rusu, L.; Guedes Soares, C. Evaluation of the wave energy resources in the Cape Verde Islands. Renew. Energy 2017, 101, 316–326. [Google Scholar] [CrossRef]
- de Falcão, A.F.O. Wave energy utilization: A review of the technologies. Renew. Sustain. Energy Rev. 2010, 14, 899–918. [Google Scholar]
- Guedes Soares, C.; Bhattacharjee, J.; Tello, M.; Pietra, L. Review and classification of wave energy converters. In Maritime Engineering and Technology; Guedes Soares, C., Garbatov, Y., Sutulo, S., Santos, T.A., Eds.; CRC Press: Boca Raton, FL, USA, 2012; pp. 585–594. [Google Scholar]
- Elhanafi, A.; Macfarlane, G.; Fleming, A.; Leong, Z. Experimental and numerical investigation of the hydrodynamic performance of an oscillating water column wave energy converter. Appl. Energy 2017, 106, 1–16. [Google Scholar] [CrossRef]
- Rezanejad, K.; Guedes Soares, C. Enhancing the primary efficiency of an oscillating water column wave energy converter based on a dual-mass system analogy. Renew. Energy 2018, 123, 730–747. [Google Scholar] [CrossRef]
- Falcao, A.F.O.; Sarmento, A.J.N.A.; Gato, L.M.C.; Brito-Melo, A. The Pico OWC wave power plant: its life from conception to closure 1993–2018. In Advances in Renewable Energies Offshore; Guedes Soares, C., Ed.; Taylor and Francis Group: London, UK, 2019; pp. 745–843. [Google Scholar]
- Clément, A.; McCullen, P.; de Falcão, A.F.O. Wave energy in Europe: Current status and perspectives. Renew. Sustain. Energy Rev. 2002, 6, 405–431. [Google Scholar] [CrossRef]
- MarineEnergy Sperboy Webpage. Available online: https://marineenergy.biz/tag/sperboy/ (accessed on 15 August 2019).
- Weinstein, A.; Fredrikson, G.; Claeson, L.; Forsberg, J.; Parks, M.J.; Nielsen, K.; Jenses, M.S.; Zandiyeh, K.; Frigaard, P.; Kramer, M.; et al. AquaBuOY-the offshore wave energy converter numerical modeling and optimization. In Proceedings of the Oceans ‘04 MTS/IEEE Techno-Ocean’ 04 (IEEE Cat. No.04CH37600), Kobe, Japan, 9–12 November 2003; Volume 4, pp. 1988–1995. [Google Scholar]
- Baddour, R.E.; Song, S. On the interaction between waves and currents. Ocean Eng. 1990, 17, 1–21. [Google Scholar] [CrossRef]
- Magagna, D.; Uihlein, A. Ocean energy development in Europe: Current status and future perspectives. Int. J. Mar. Energy 2015, 11, 84–104. [Google Scholar] [CrossRef]
- Muliawan, M.J.; Karimirad, M.; Gao, Z.; Moan, T. Extreme responses of a combined spar-type floating wind turbine and floating wave energy converter (STC) system with survival modes. Ocean Eng. 2013, 65, 71–82. [Google Scholar] [CrossRef]
- Dalton, G.; Ó Gallachóir, B.P. Building a wave energy policy focusing on innovation, manufacturing and deployment. Renew. Sustain. Energy Rev. 2010, 14, 2339–2358. [Google Scholar] [CrossRef]
- Carcas, M.C. The OPD Pelamis WEC: Current status and onward programme (2002). Int. J. Ambient Energy 2003, 24, 21–28. [Google Scholar] [CrossRef]
- McCabe, A.P.; Bradshaw, A.; Meadowcroft, J.A.C.; Aggidis, G. Developments in the design of the PS Frog Mk 5 wave energy converter. Renew. Energy 2006, 31, 141–151. [Google Scholar] [CrossRef]
- Ruellan, M.; Ben Ahmed, H.; Multon, B.; Josset, C.; Babarit, A.; Clement, A. Design Methodology for a SEAREV Wave Energy Converter. IEE Trans. Energy Convers. 2010, 25, 760–767. [Google Scholar] [CrossRef]
- Calvario, M.; Gaspar, J.F.; Kamarlouei, M.; Guedes Soares, C. Optimal power take-off parameters for a bottom-hinged plate wave energy converter. In Proceedings of the 13th European Wave and Tidal Energy Conference (EWTEC 2019), Napoli, Italy, 1–6 September 2019. [Google Scholar]
- Pérez-Collazo, C.; Greaves, D.; Iglesias, G. A review of combined wave and offshore wind energy. Renew. Sustain. Energy Rev. 2015, 42, 141–153. [Google Scholar] [CrossRef]
- Veigas, M.; López, M.; Iglesias, G. Assessing the optimal location for a shoreline wave energy converter. Appl. Energy 2014, 132, 404–411. [Google Scholar] [CrossRef]
- Kofoed, J.P.; Frigaard, P.; Friis-Madsen, E.; Sorensen, H.C. Prototype testing of the wave energy converter Wave Dragon. Renew. Energy 2006, 31, 181–189. [Google Scholar] [CrossRef]
- Veigas, M.; López, M.; Romillo, P.; Carballo, R.; Castro, A.; Iglesias, G. A proposed wave farm on the Galician coast. Energy Convers. Manag. 2015, 99, 102–111. [Google Scholar] [CrossRef]
- Carballo, R.; Iglesias, G. A methodology to determine the power performance of wave energy converters at a particular coastal location. Energy Convers. Manag. 2012, 61, 8–18. [Google Scholar] [CrossRef]
- Liang, B.; Shao, Z.; Wu, G.; Shao, M.; Sun, J. New equations of wave energy assessment accounting for the water depth. Appl. Energy 2017, 188, 130–139. [Google Scholar] [CrossRef]
- Lin, Y.; Dong, S.; Wang, Z.; Guedes Soares, C. Wave energy assessment in the China adjacent seas on the basis of a 20-year SWAN simulation with unstructured grids. Renew. Energy 2019, 136, 275–295. [Google Scholar] [CrossRef]
- García-Medina, G.; Özkan-Haller, H.T.; Ruggiero, P. Wave resource assessment in Oregon and southwest Washington, USA. Renew. Energy 2014, 64, 203–214. [Google Scholar] [CrossRef]
- Van Nieuwkoop, J.C.C.; Smith, H.C.M.; Smith, G.H.; Johanning, L. Wave resource assessment along the Cornish coast (UK) from a 23-year hindcast dataset validated against buoy measurements. Renew. Energy 2013, 58, 1–14. [Google Scholar] [CrossRef]
- Guedes Soares, C.; Bento, A.R.; Gonçalves, M.; Silva, D.; Martinho, P. Numerical evaluation of the wave energy resource along the Atlantic European coast. Comput. Geosci. 2014, 71, 37–49. [Google Scholar] [CrossRef]
- Astariz, S.; Iglesias, G. The economics of wave energy: A review. Renew. Sustain. Energy Rev. 2015, 45, 397–408. [Google Scholar] [CrossRef]
- Castro-Santos, L. Methodology Related to The Development of the Economic Evaluation of Floating Offshore Wind Farms in Terms of the Analysis of the Cost of Their Life-Cycle Phases. Ph.D. Thesis, Universidade da Coruña, Ferrol, Spain, 2013. [Google Scholar]
- Castro-Santos, L.; Martins, E.; Guedes Soares, C. Cost assessment methodology for combined wind and wave floating offshore renewable energy systems. Renew. Energy 2016, 97, 866–880. [Google Scholar] [CrossRef]
- Castro-Santos, L.; Martins, E.; Guedes Soares, C. Economic comparison of technological alternatives to harness offshore wind and wave energies. Energy 2017, 140, 1121–1130. [Google Scholar] [CrossRef]
- Singh, L.K.; Jha, M.K.; Chowdary, V.M. Multi-criteria analysis and GIS modeling for identifying prospective water harvesting and artificial recharge sites for sustainable water supply. J. Clean. Prod. 2017, 142, 1436–1456. [Google Scholar] [CrossRef]
- Venier, F.; Yabar, H. Renewable energy recovery potential towards sustainable cattle manure management in Buenos Aires Province: Site selection based on GIS spatial analysis and statistics. J. Clean. Prod. 2017, 162, 1317–1333. [Google Scholar] [CrossRef]
- Bento, A.R.; Martinho, P.; Guedes Soares, C. Wave energy assessement for Northern Spain from a 33-year hindcast. Renew. Energy 2018, 127, 322–333. [Google Scholar] [CrossRef]
- Salvação, N.; Guedes Soares, C. Wind resource assessment offshore the Atlantic Iberian coast with the WRF model. Energy 2018, 145, 276–287. [Google Scholar] [CrossRef]
- Dronkers, J. Most Commonly Used Variables in Coastal Engineering. Available online: http://www.coastalwiki.org/wiki/Statistical_description_of_wave_parameters (accessed on 16 January 2020).
- Silva, D.; Bento, A.R.; Martinho, P.; Guedes Soares, C. High Resolution local wave energy modelling in the Iberian Peninsula. Energy 2015, 91/94, 857–858, 1099–1112. [Google Scholar] [CrossRef]
- Tolman, H.L. A Third-Generation Model for Wind Waves on Slowly Varying, Unsteady, and Inhomogeneous Depths and Currents. J. Phys. Oceanogr. 1991, 21, 782–797. [Google Scholar] [CrossRef]
- Booij, N.; Ris, R.C.; Holthuijsen, L.H. A third-generation wave model for coastal regions: 1. Model description and validation. J. Geophys. Res. 1999, 104, 7649–7666. [Google Scholar] [CrossRef]
- Castro-Santos, L.; Diaz-Casas, V. Life-cycle cost analysis of floating offshore wind farms. Renew. Energy 2014, 66, 41–48. [Google Scholar]
- Castro-Santos, L.; Martins, E.; Guedes Soares, C. Methodology to calculate the costs of a floating offshore renewable energy farm. Energies 2016, 9, 324. [Google Scholar] [CrossRef]
- Silva, D.; Rusu, E.; Guedes Soares, C. Evaluation of Various Technologies for Wave Energy Conversion in the Portuguese Nearshore. Energies 2013, 6, 1344–1364. [Google Scholar] [CrossRef]
- Castro-Santos, L.; Diaz-Casas, V. Economic influence of location in floating offshore wind farms. Ocean Eng. 2015, 107, 13–22. [Google Scholar] [CrossRef]
- Wikipedia Pelamis Bursts out of a Wave. Available online: https://es.m.wikipedia.org/wiki/Archivo:Pelamis_bursts_out_of_a_wave.JPG (accessed on 8 January 2020).
- Natural Capital Project Wave energy. Available online: https://vimeo.com/41315464 (accessed on 8 January 2020).
- Friis-Madsen, E. Wave Dragon. Available online: https://en.m.wikipedia.org/wiki/File:WaveDragon.JPG (accessed on 8 January 2020).
- Hertenstein, J.H.; Mckinnon, S.M. Solving the puzzle of the cash flow statement. Bus. Horiz. 1997, 40, 69–76. [Google Scholar] [CrossRef]
- EMEC Pelamis Wave Power. Available online: http://www.emec.org.uk/about-us/wave-clients/pelamis-wave-power/ (accessed on 1 September 2016).


© 2020 by the authors. Licensee MDPI, Basel, Switzerland. This article is an open access article distributed under the terms and conditions of the Creative Commons Attribution (CC BY) license (http://creativecommons.org/licenses/by/4.0/).