Product Distribution and Characteristics of Pyrolyzing Microalgae (Nannochloropsis oculata), Cotton Gin Trash, and Cattle Manure as a Cobiomass

 , , , , and
Abstract
1. Introduction
2. Materials and Methods
2.1. Preparation of Cobiomass
2.2. Experimental Setup
2.3. Experimental Design
2.4. Chemical Analysis
2.5. Statistical Analysis
3. Results
3.1. Characterization of Three Biomass
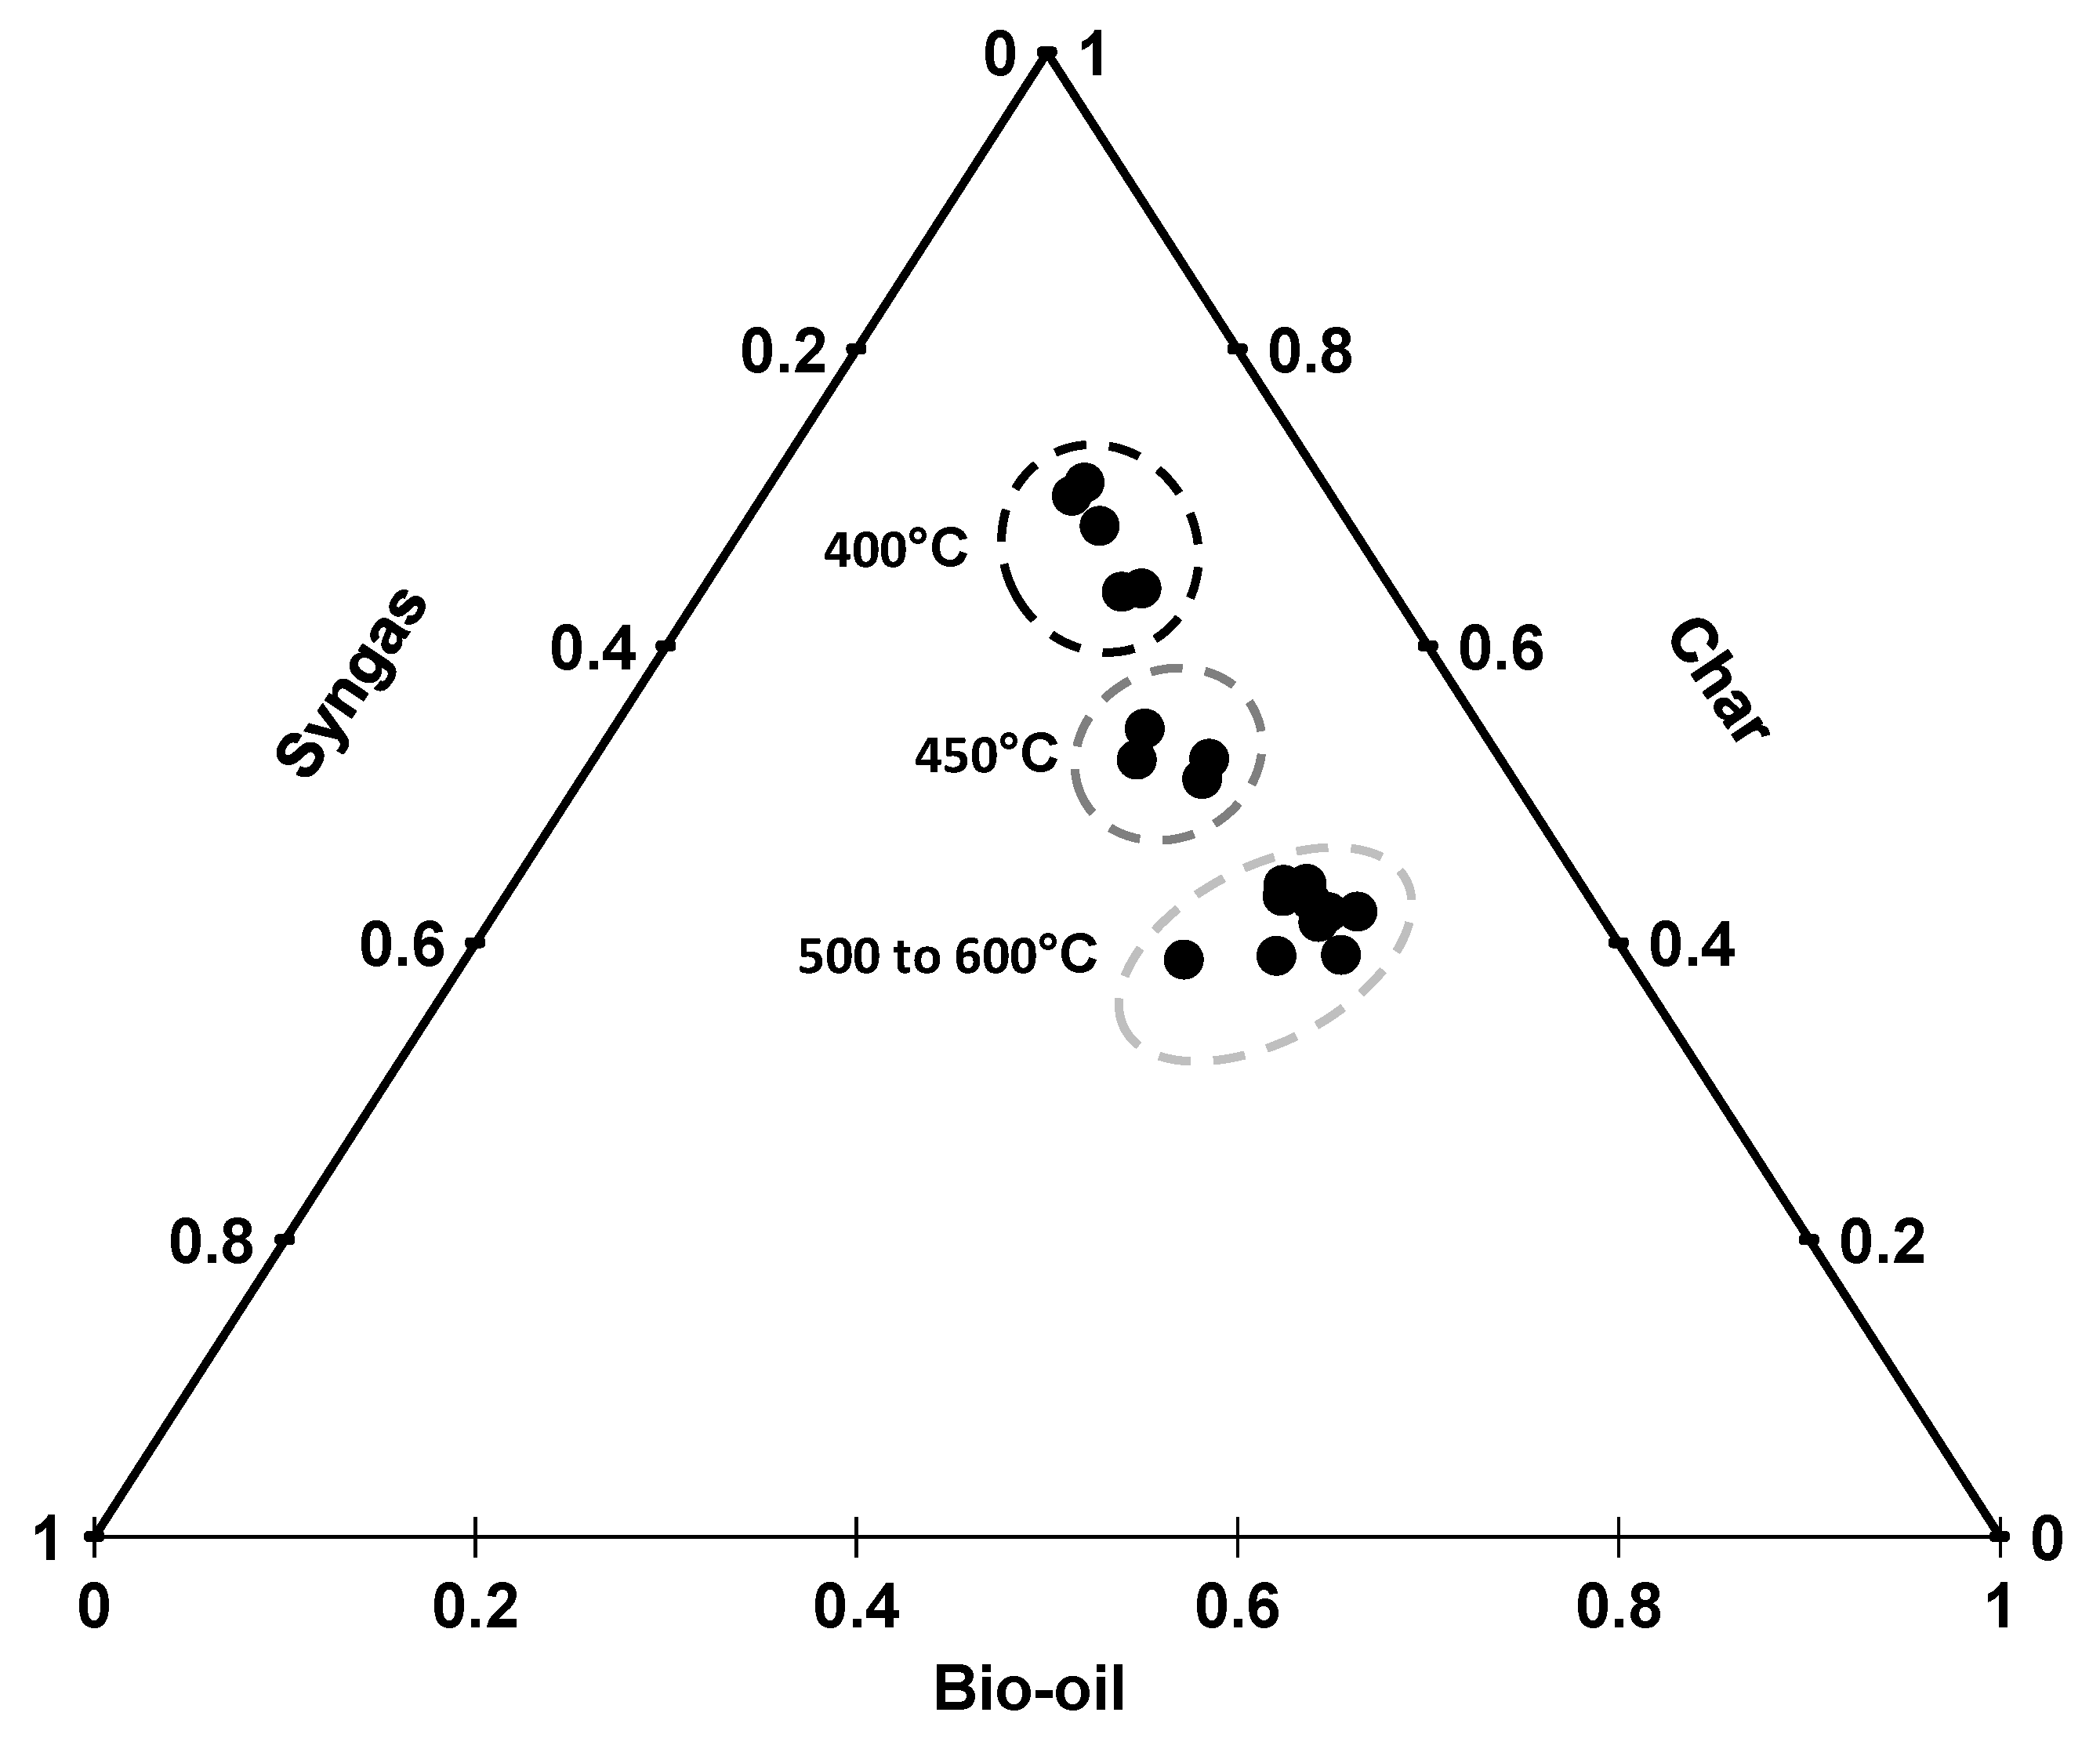
3.2. Products Distribution
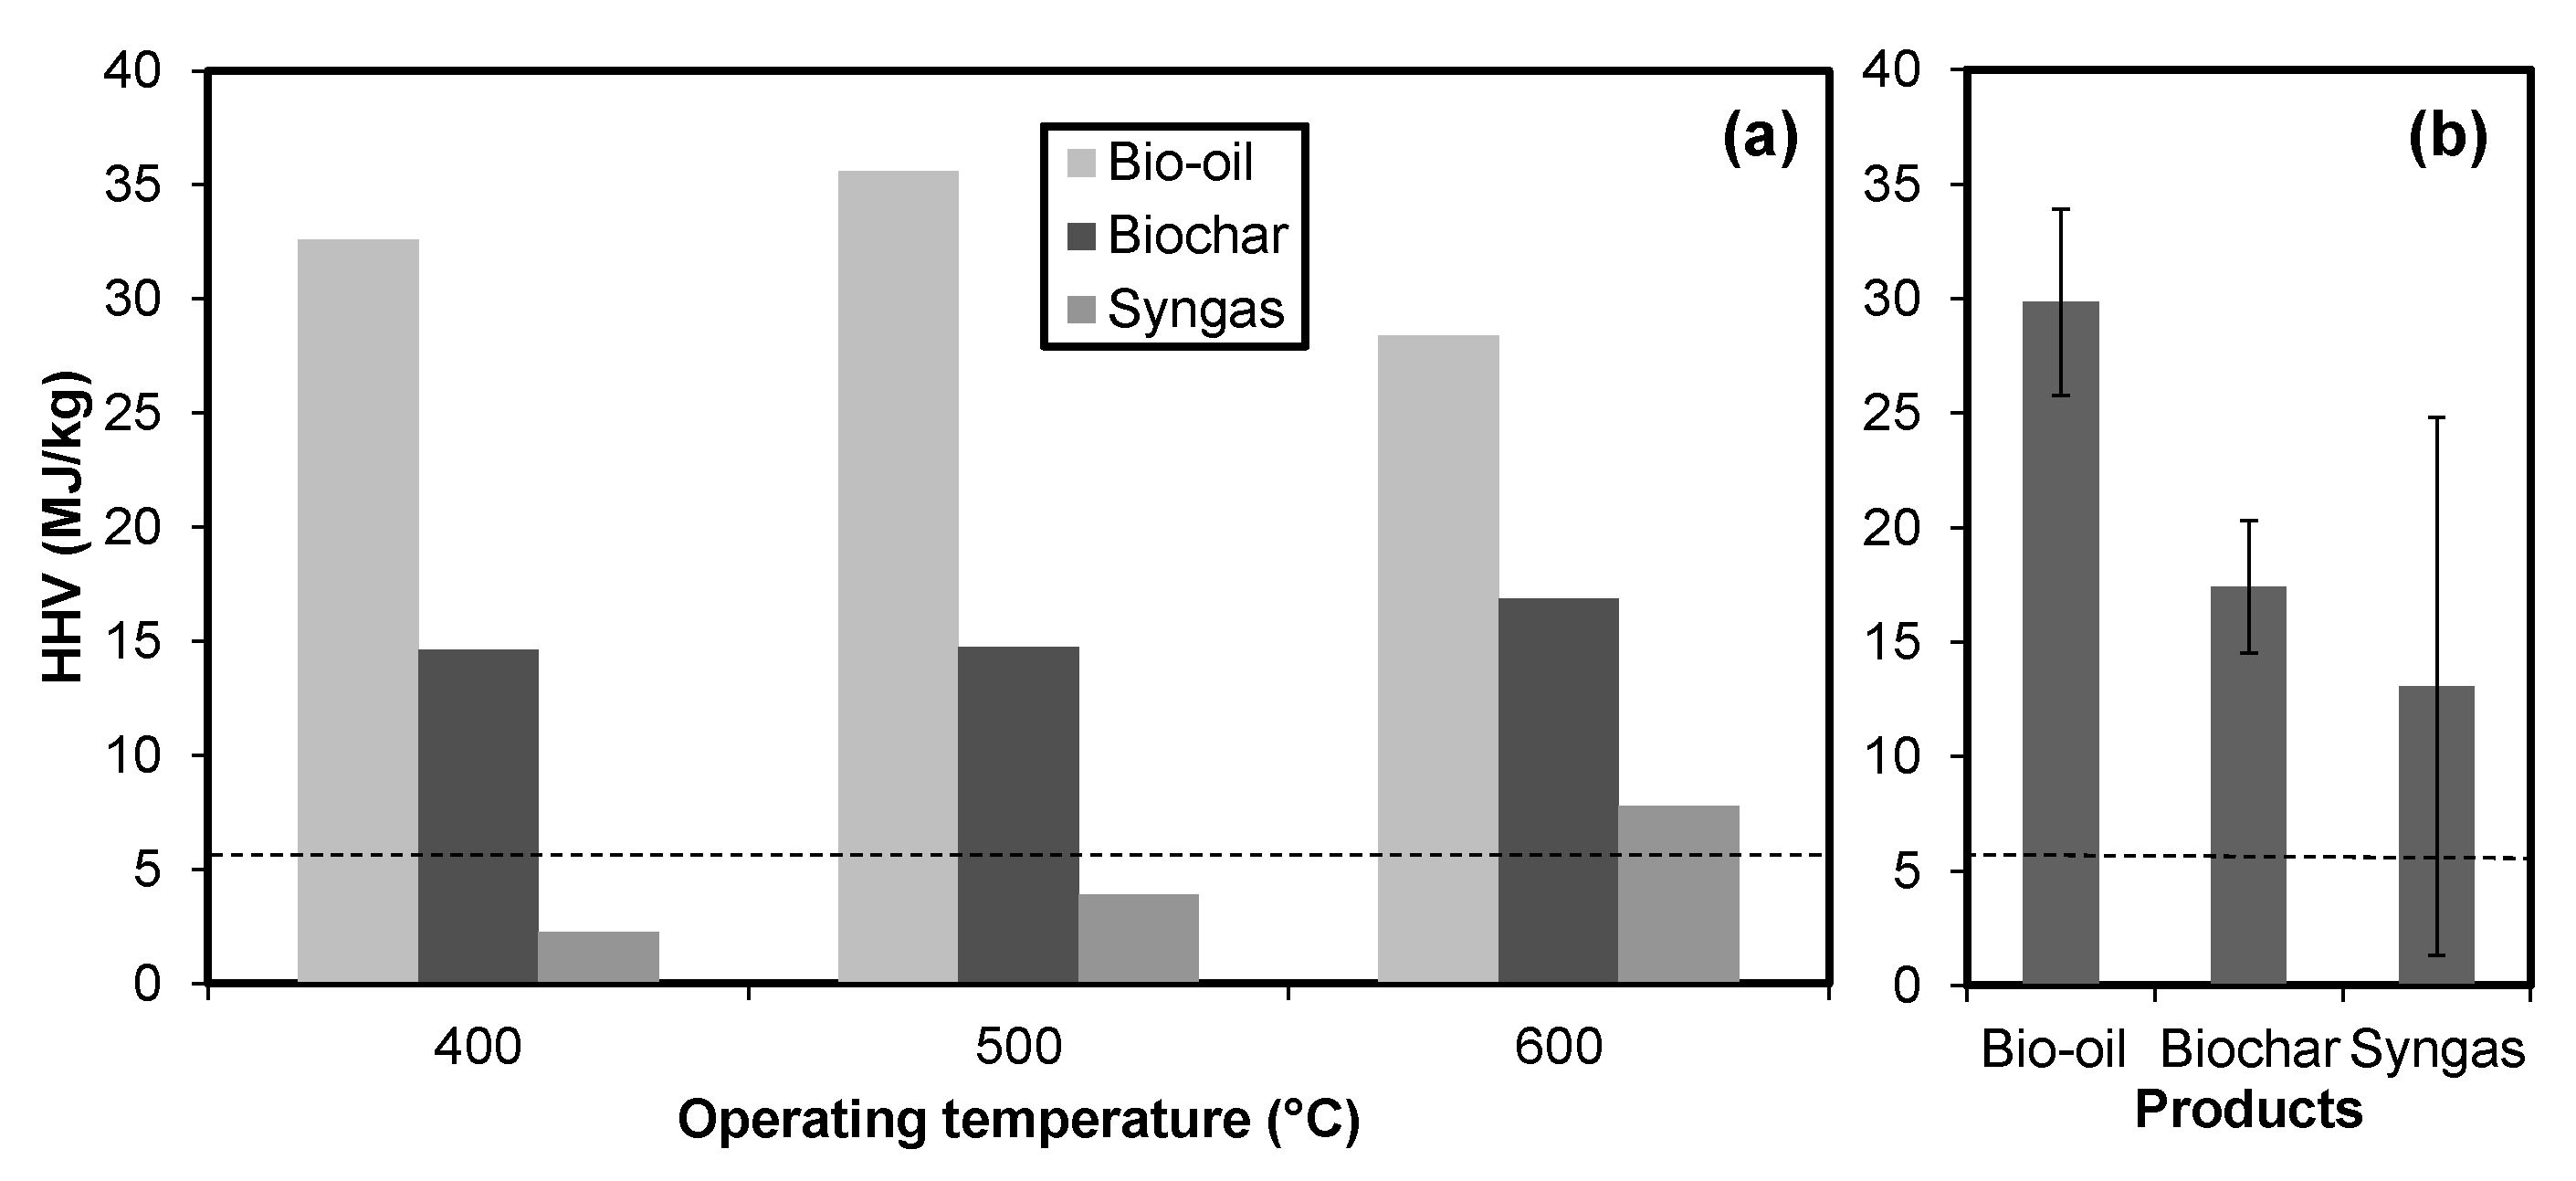
3.3. Products Characteristics
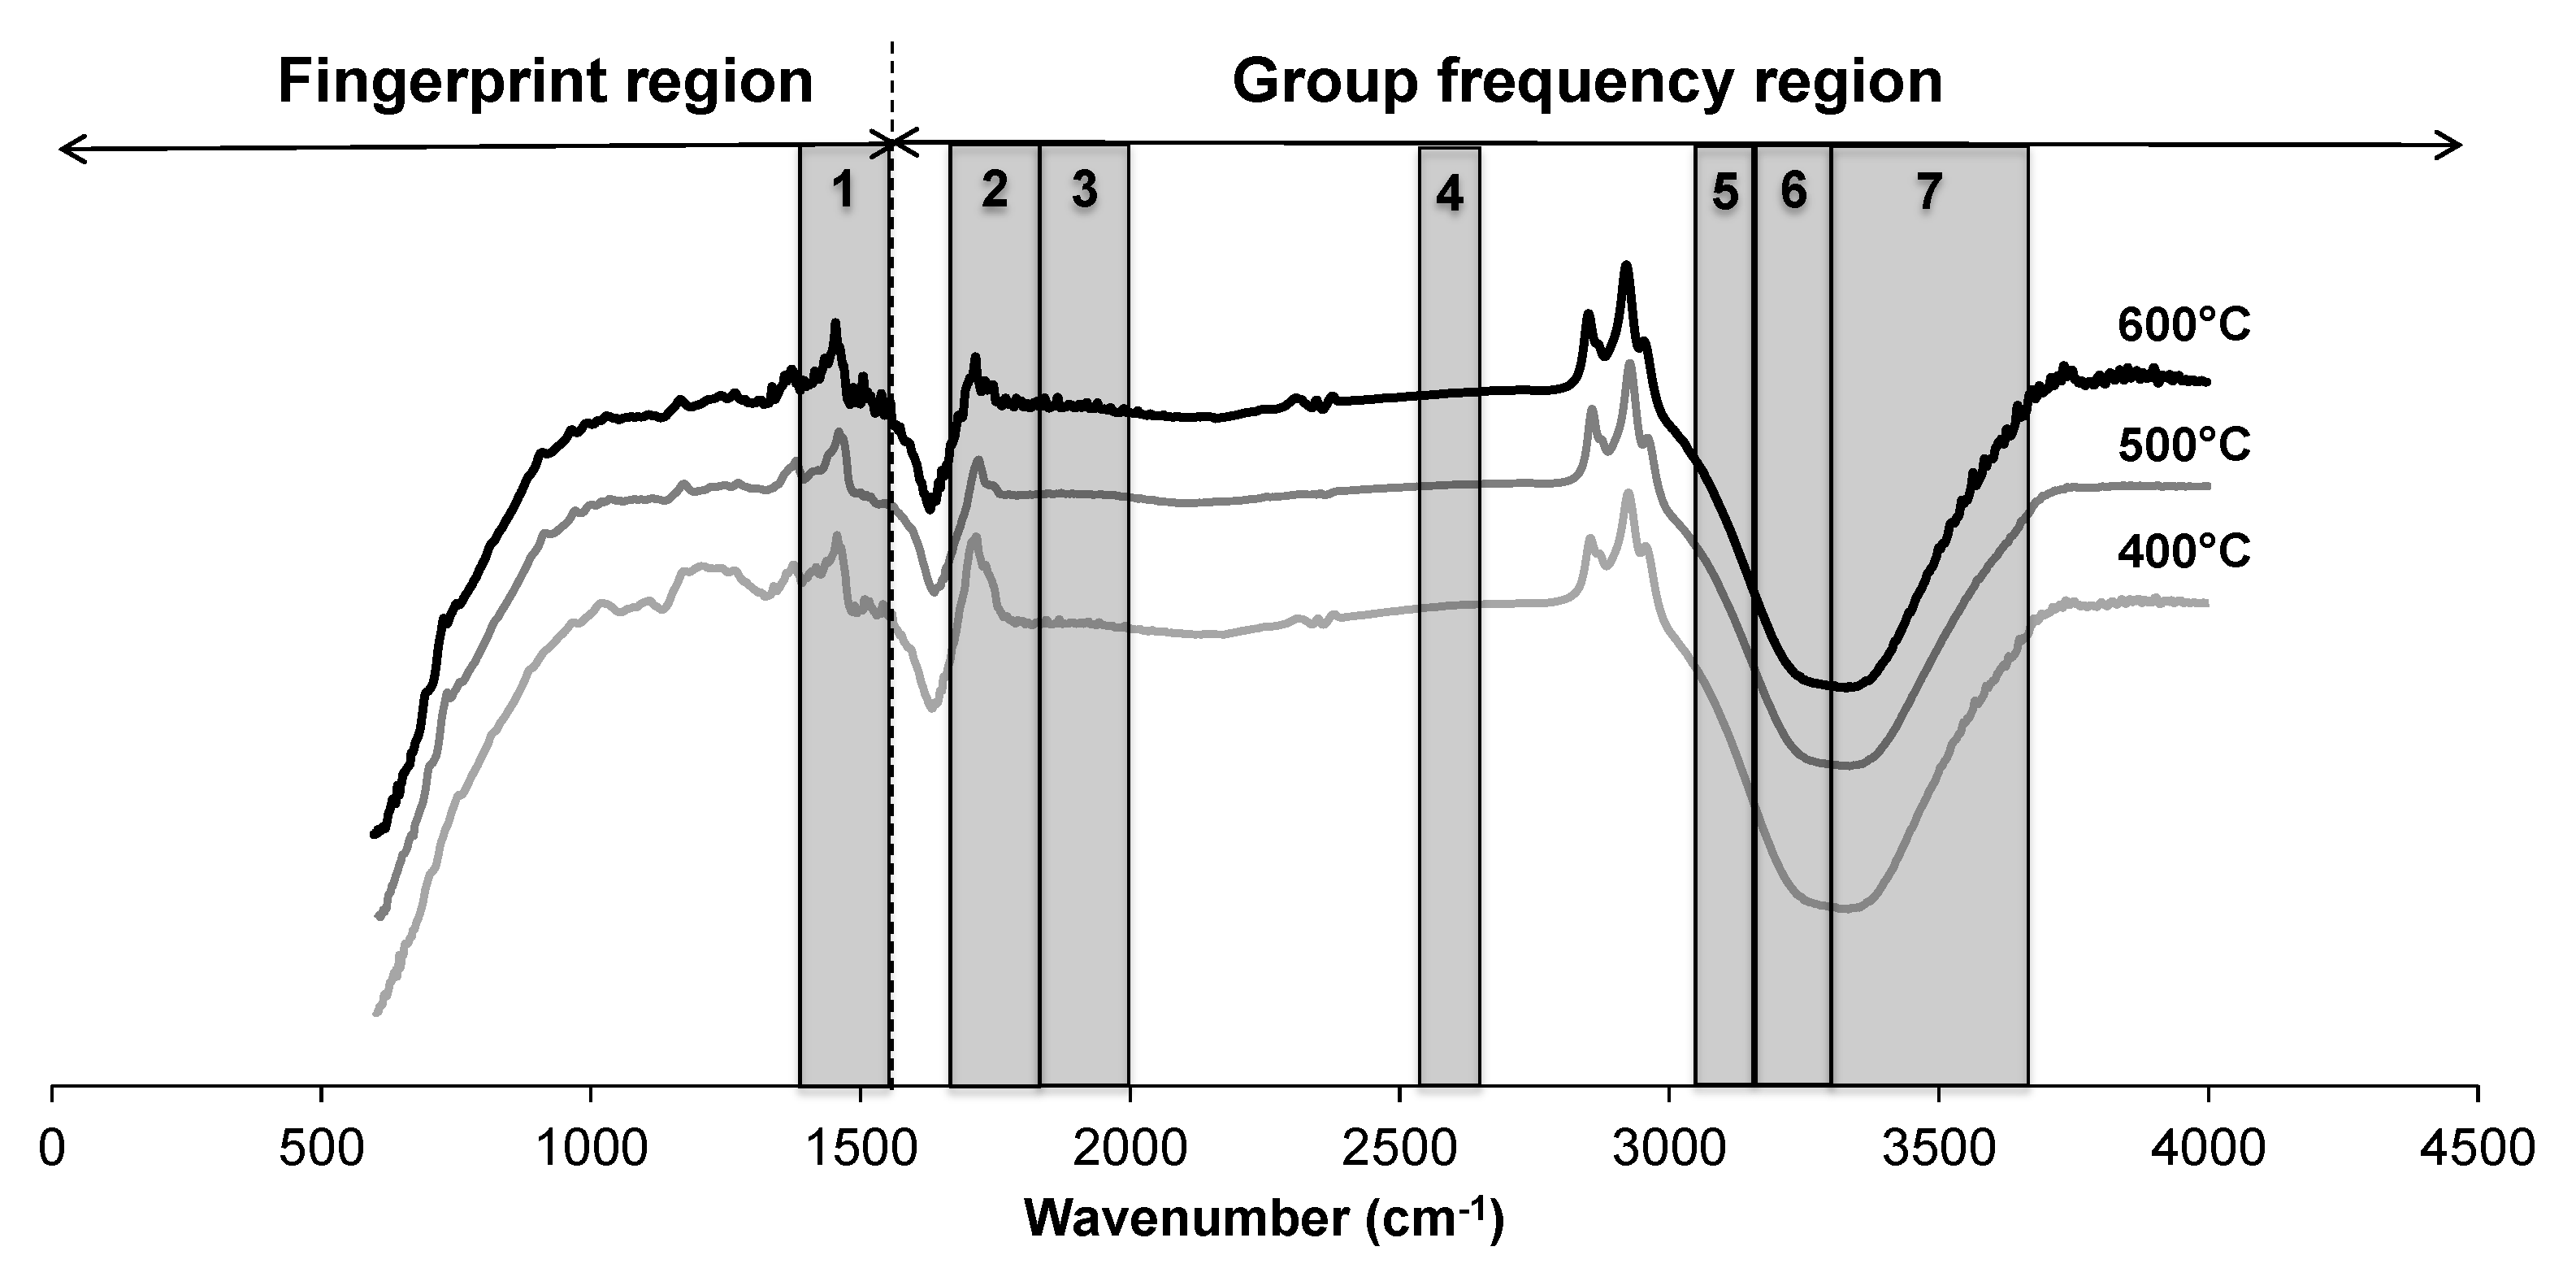
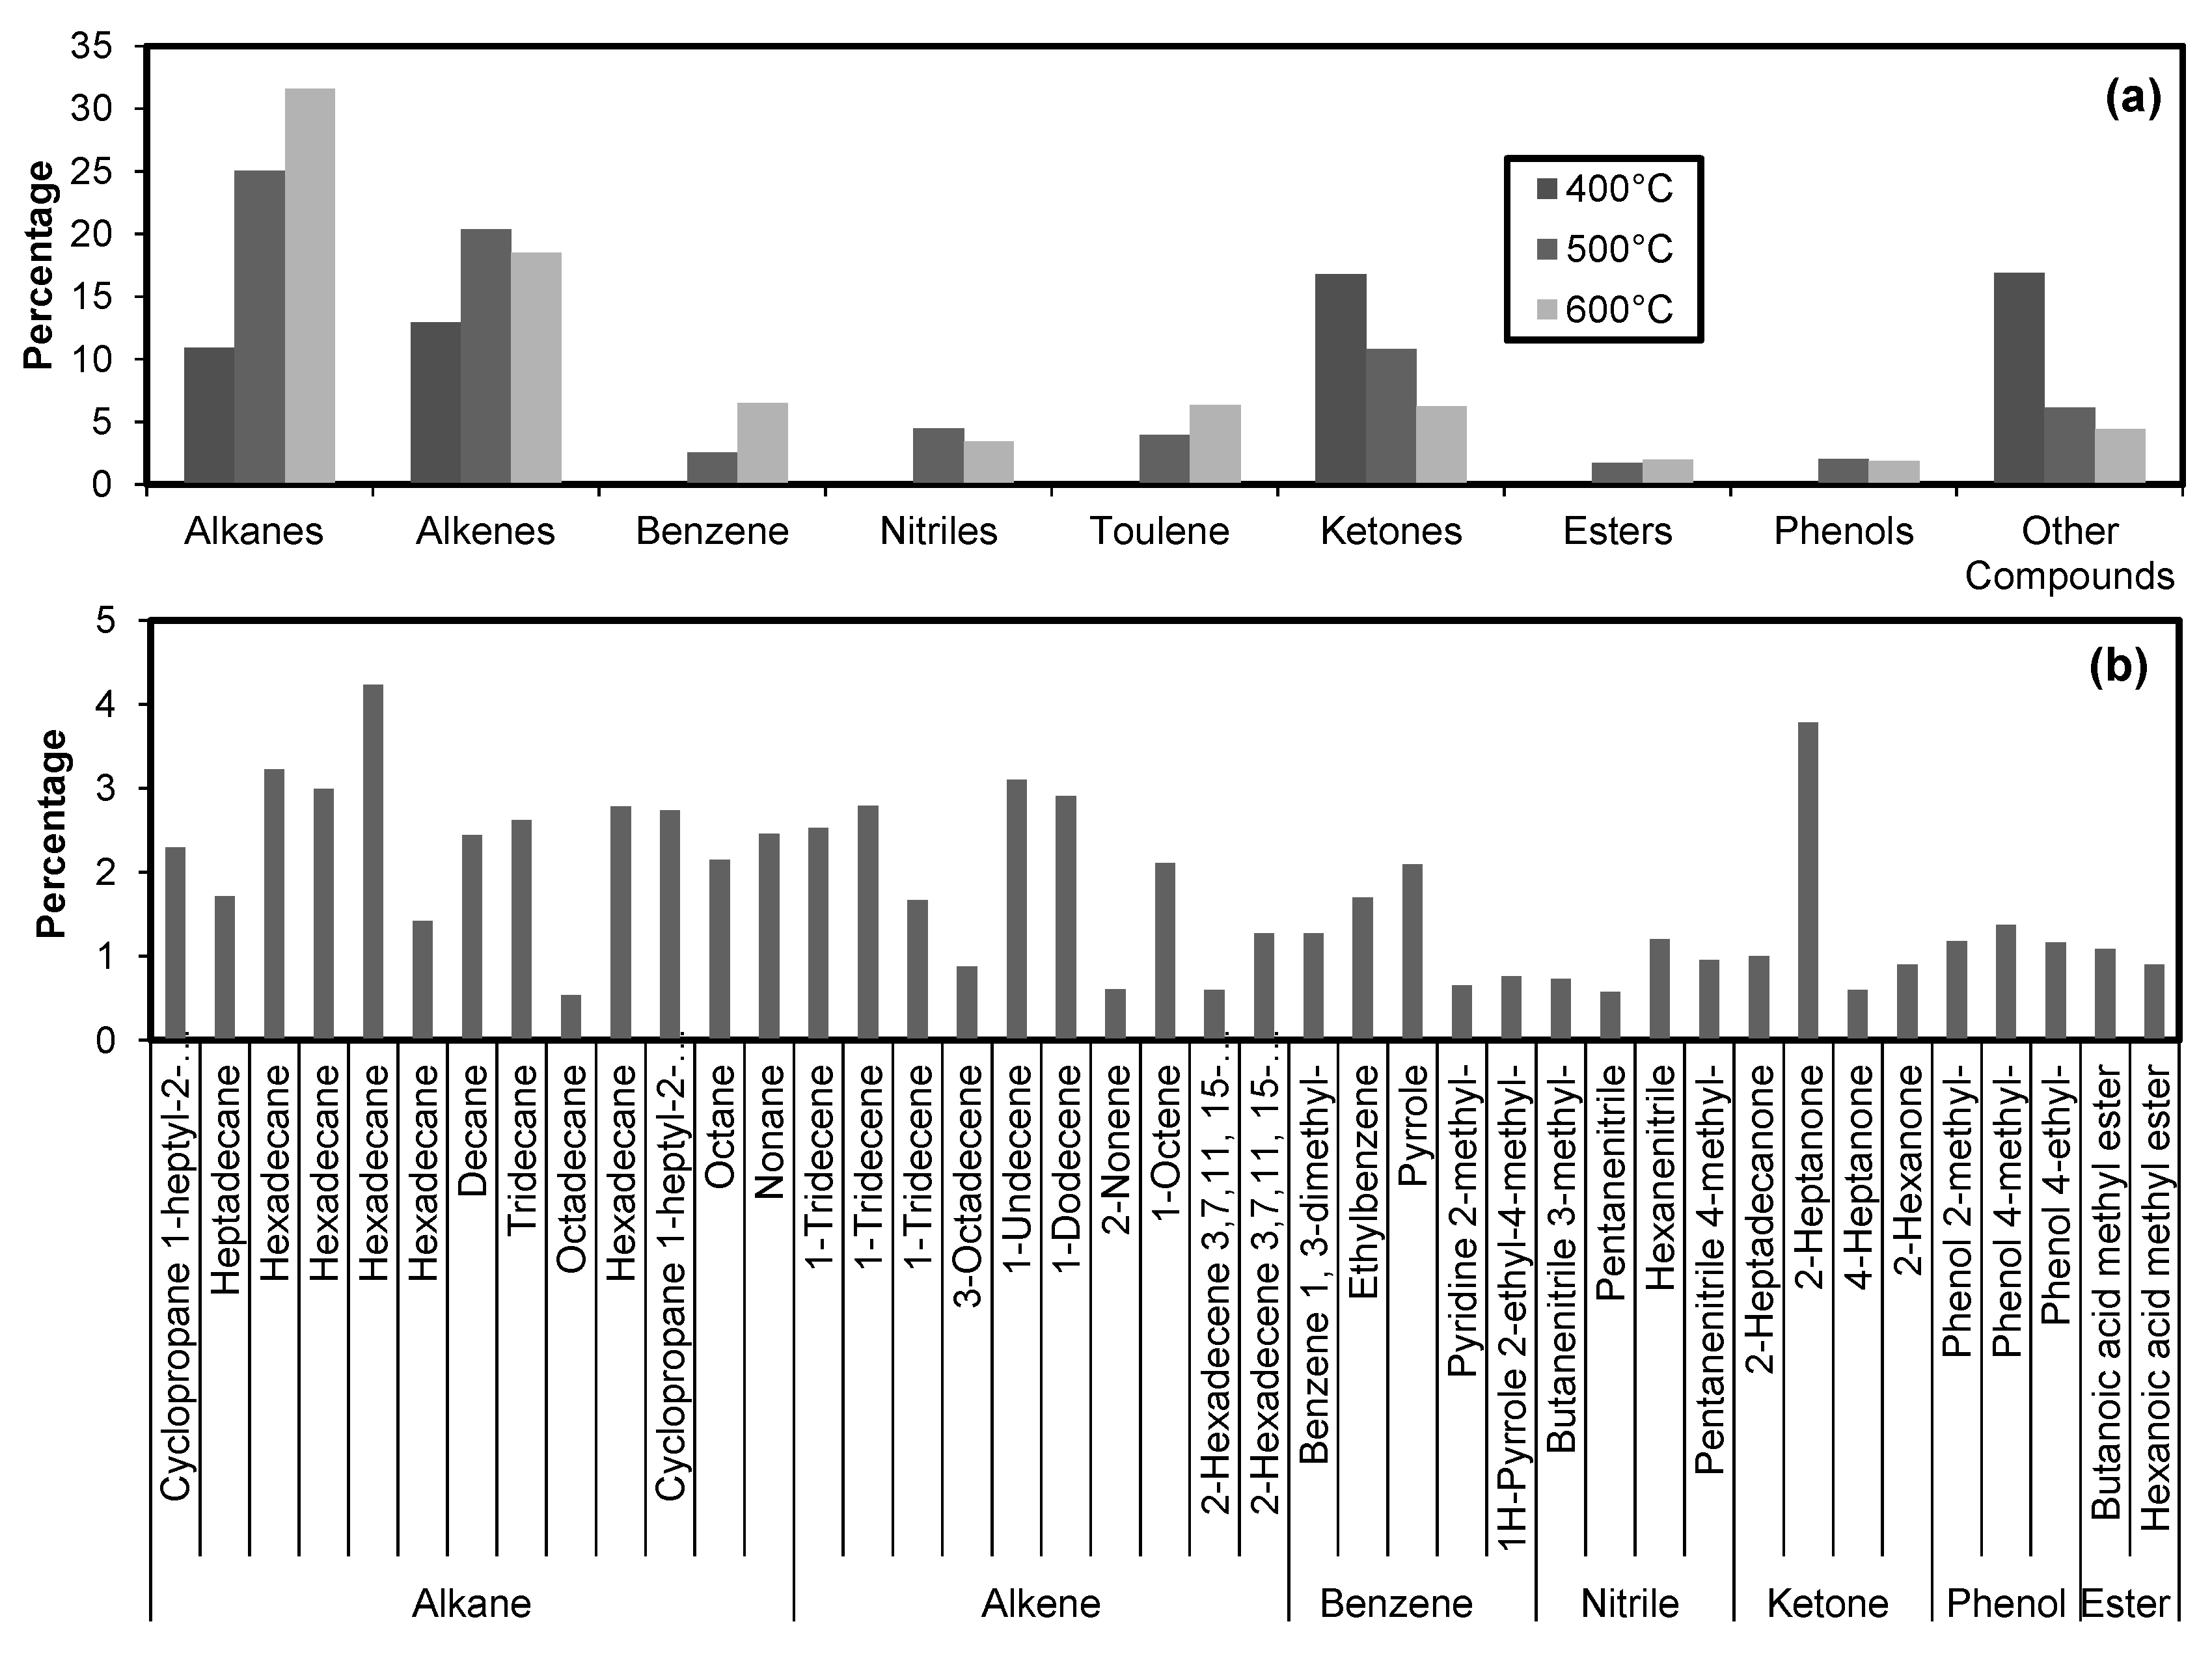
3.3.1. Bio-Oil
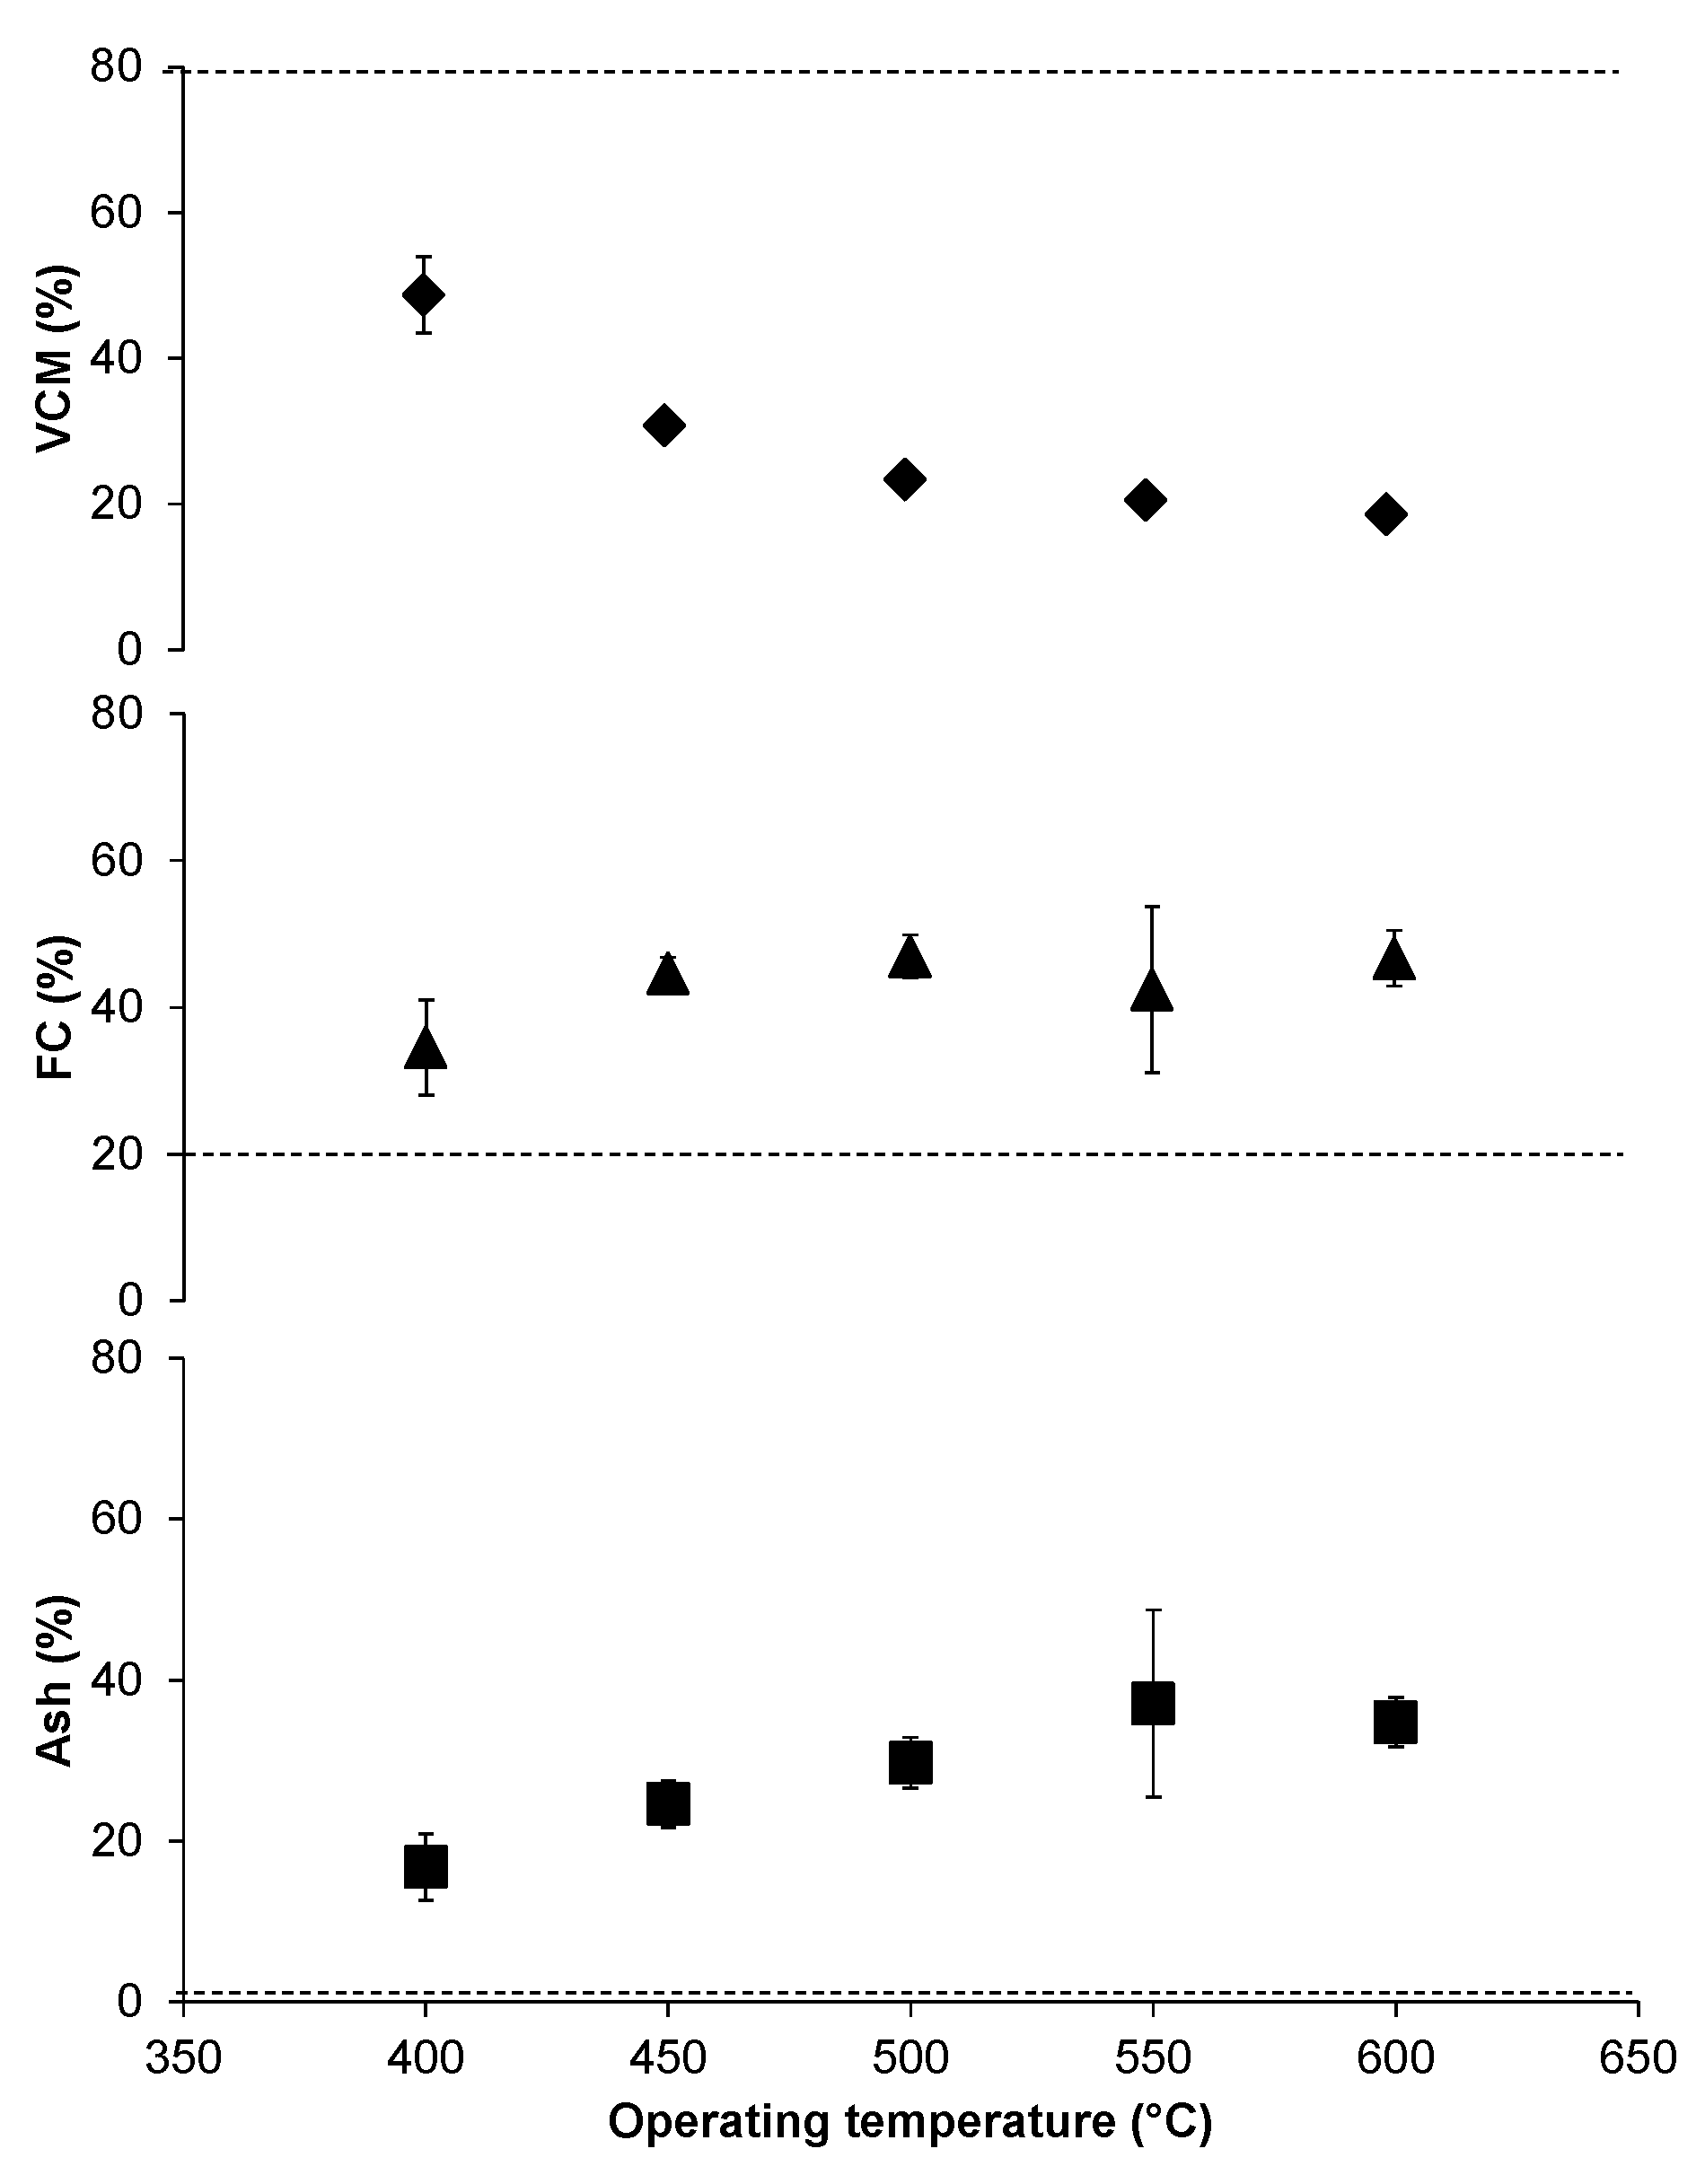
3.3.2. Char
3.3.3. Syngas
4. Conclusions
Author Contributions
Funding
Acknowledgments
Conflicts of Interest
References
- Maguyon, M.C.; Capareda, S.C. Evaluating the effects of temperature on pressurized pyrolysis of Nannochloropsis oculata based on products yields and characteristics. Energy Convers. Manag. 2013, 76, 764–773. [Google Scholar] [CrossRef]
- McKendry, P. Energy production from biomass (part 2): Conversion technologies. Bioresour. Technol. 2002, 83, 47–54. [Google Scholar] [CrossRef]
- Alvarez, J.; Lopez, G.; Amutio, M.; Bilbao, J.; Olazar, M. Bio-oil production from rice husk fast pyrolysis in a conical spouted bed reactor. Fuel 2014, 128, 162–169. [Google Scholar] [CrossRef]
- Isa, Y.M.; Ganda, E.T. Bio-oil as a potential source of petroleum range fuels. Renew. Sustain. Energy Rev. 2018, 81, 69–75. [Google Scholar]
- Aneke, M.; Wang, M. Thermodynamic Comparison of alternative Biomass Gasification Techniques for producing Syngas for Gas Turbine Application. Energy Procedia 2017, 142, 829–834. [Google Scholar] [CrossRef]
- Mafu, L.D.; Hein, W.J.P. Neomagus and Raymond C. Everson and Christien A. Strydom and Marion Carrier and Gregory N. Okolo and John R. Bunt, Chemical and structural characterization of char development during lignocellulosic biomass pyrolysis. Bioresour. Technol. 2017, 243, 941–948. [Google Scholar] [CrossRef]
- Gomez-Casanovas, N.; DeLucia, N.J.; Hudiburg, T.W.; Bernacchi, C.J.; DeLucia, E.H. Conversion of grazed pastures to energy cane as a biofuel feedstock alters the emission of GHGs from soils in Southeastern United States. Biomass Bioenerg. 2018, 108, 312–322. [Google Scholar] [CrossRef]
- Naqvi, S.R.; Naqvi, M.; Noor, T.; Hussain, A.; Iqbal, N.; Uemura, Y.; Nishiyama, N. Catalytic Pyrolysis of Botryococcus Braunii (microalgae) Over Layered and Delaminated Zeolites For Aromatic Hydrocarbon Production. Energy Procedia 2017, 142, 381–385. [Google Scholar] [CrossRef]
- Wang, X.; Sheng, L.; Yang, X. Pyrolysis characteristics and pathways of protein, lipid and carbohydrate isolated from microalgae Nannochloropsis sp. Bioresour. Technol. 2017, 229, 119–125. [Google Scholar] [CrossRef]
- Huang, F.; Tahmasebi, A.; Maliutina, K.; Yu, J. Formation of nitrogen-containing compounds during microwave pyrolysis of microalgae: Product distribution and reaction pathways. Bioresour. Technol. 2017, 245, 1067–1074. [Google Scholar] [CrossRef]
- Wu, Z.; Yang, W.; Tian, X.; Yang, B. Synergistic effects from co-pyrolysis of low-rank coal and model components of microalgae biomass. Energy Convers. Manag. 2017, 135, 212–225. [Google Scholar] [CrossRef]
- Hanifzadeh, M.; Sarrafzadeh, M.; Nabati, Z.; Tavakoli, O.; Feyzizarnagh, H. Technical, economic and energy assessment of an alternative strategy for mass production of biomass and lipid from microalgae. J. Environ. Chem. Eng. 2018, 6, 866–873. [Google Scholar] [CrossRef]
- Yue, Y.; Singh, H.; Singh, B.; Mani, S. Torrefaction of sorghum biomass to improve fuel properties. Bioresour. Technol. 2017, 232, 372–379. [Google Scholar] [CrossRef] [PubMed]
- Yuan, X.; He, T.; Cao, H.; Yuan, Q. Cattle manure pyrolysis process: Kinetic and thermodynamic analysis with isoconversional methods. Renew. Energy 2017, 107, 489–496. [Google Scholar] [CrossRef]
- Xin, Y.; Wang, D.; Li, X.Q.; Yuan, Q.; Cao, H. Influence of moisture content on cattle manure char properties and its potential for hydrogen rich gas production. J. Aanal. Appl. Pyrol. 2018, 130, 224–232. [Google Scholar] [CrossRef]
- Ranjithkumar, M.; Ravikumar, R.; Sankar, M.K.; Kumar, M.N.; Thanabal, V. An Effective Conversion of Cotton Waste Biomass to Ethanol: A Critical Review on Pretreatment Processes. Waste Biomass Valori. 2017, 8, 57–68. [Google Scholar] [CrossRef]
- Chen, J.; Li, C.; Ristovski, Z.; Milic, A.; Gu, Y.; Islam, M.S.; Wang, S.; Hao, J.; Zhang, H.; He, C. A review of biomass burning: Emissions and impacts on air quality, health and climate in China. Sci. Total Environ. 2017, 579, 1000–1034. [Google Scholar] [CrossRef]
- White, R.H. Effect of lignin content and extractives on the higher heating value of wood. Wood Fiber Sci. 1987, 19, 446–452. [Google Scholar]
- Hanif, M.U.; Capareda, S.C.; Iqbal, H.; Arazo, R.O.; Baig, M.A. Effects of Pyrolysis Temperature on Product Yields and Energy Recovery from Co-Feeding of Cotton Gin Trash, Cow Manure, and Microalgae: A Simulation Study. PLoS ONE 2016, 11, 1–11. [Google Scholar]
- Parikh, J.; Channiwala, S.A.; Ghosal, G.K. A correlation for calculating HHV from proximate analysis of solid fuels. Fuel 2005, 84, 487–494. [Google Scholar] [CrossRef]
- Bui, H.; Tran, K.; Chen, W. Pyrolysis of microalgae residues—A kinetic study. Bioresour. Technol. 2016, 199, 362–366. [Google Scholar] [CrossRef] [PubMed]
- Pan, P.; Hu, C.; Yang, W.; Li, Y.; Dong, L.; Zhu, L.; Tong, D.; Qing, R.; Fan, Y. The direct pyrolysis and catalytic pyrolysis of Nannochloropsis sp. residue for renewable bio-oils. Bioresour. Technol. 2010, 101, 4593–4599. [Google Scholar] [CrossRef] [PubMed]
- Imam, T.; Capareda, S. Characterization of bio-oil, syn-gas and bio-char from switchgrass pyrolysis at various temperatures. J. Aanal. Appl. Pyrol. 2012, 93, 170–177. [Google Scholar] [CrossRef]


| Treatments | Temperature (°C) | Cobiomass (g) | ||
|---|---|---|---|---|
| CGT a | MA b | CM c | ||
| 1 | 450 | 105 | 35 | 140 |
| 2 | 600 | 98 | 42 | 140 |
| 3 | 400 | 98 | 42 | 140 |
| 4 | 500 | 98 | 42 | 140 |
| 5 | 550 | 105 | 35 | 140 |
| 6 | 500 | 84 | 56 | 140 |
| 7 | 400 | 112 | 28 | 140 |
| 8 | 450 | 112 | 28 | 140 |
| 9 | 600 | 98 | 42 | 140 |
| 10 | 600 | 84 | 56 | 140 |
| 11 | 400 | 84 | 56 | 140 |
| 12 | 600 | 112 | 28 | 140 |
| 13 | 600 | 112 | 28 | 140 |
| 14 | 550 | 91 | 49 | 140 |
| 15 | 400 | 84 | 56 | 140 |
| 16 | 500 | 112 | 28 | 140 |
| 17 | 600 | 84 | 56 | 140 |
| 18 | 450 | 91 | 49 | 140 |
| 19 | 400 | 112 | 28 | 140 |
| Biomass Characteristics | Cotton Gin Trash | Microalgae | Cattle Manure | Wood * | |
|---|---|---|---|---|---|
| HHV (MJ/kg) | 19.82 | 24.9 | 17.98 | 20.5 | |
| Proximate analysis (wt%) | VCM | 73.1 | 80.79 | 70.12 | 79.72 |
| Fixed Carbon | 16.7 | 6.21 | 12.1 | 19.92 | |
| Ash | 10.2 | 13.01 | 17.1 | 0.36 | |
| Ultimate analysis (wt%) | C | 41.23 | 47.9 | 42.07 | 53.1 |
| H | 5.03 | 7.3 | 5.06 | 6.4 | |
| N | 2.63 | 5.1 | 1.75 | 0.4 | |
| S | 0 | 0.9 | 0.9 | 0 | |
| O | 34 | 25.12 | 30.09 | 42.7 | |
| Treatment | Microalgae (g) | Temperature (°C) | Composition (% Vol) | |||||||
|---|---|---|---|---|---|---|---|---|---|---|
| H2 | CH4 | C2H4 | C2H6 | C3H6 | C3H8 | O2 | CO2 | |||
| 3 | 42 | 400 | 0.0 | 1.2 | 0.4 | 0.4 | 0.6 | 0.2 | 2.9 | 94.4 |
| 4 | 42 | 500 | 14.1 | 36.9 | 5.7 | 14.1 | 4.9 | 0.5 | 18.4 | 5.5 |
| 9 | 42 | 600 | 29.3 | 33.9 | 2.5 | 7.6 | 2.0 | 2.1 | 0.7 | 21.9 |
| 16 | 28 | 500 | 8.7 | 61.0 | 4.6 | 9.1 | 0.7 | 0.9 | 10.8 | 4.3 |
| 4 | 42 | 500 | 14.1 | 36.9 | 5.7 | 14.1 | 4.9 | 0.5 | 18.4 | 5.5 |
| 6 | 56 | 500 | 10.9 | 42.4 | 3.7 | 8.5 | 0.3 | 1.6 | 5.8 | 26.8 |
© 2020 by the authors. Licensee MDPI, Basel, Switzerland. This article is an open access article distributed under the terms and conditions of the Creative Commons Attribution (CC BY) license (http://creativecommons.org/licenses/by/4.0/).
Share and Cite
Hanif, M.U.; Zwawi, M.; Capareda, S.C.; Iqbal, H.; Algarni, M.; Felemban, B.F.; Bahadar, A.; Waqas, A. Product Distribution and Characteristics of Pyrolyzing Microalgae (Nannochloropsis oculata), Cotton Gin Trash, and Cattle Manure as a Cobiomass. Energies 2020, 13, 796. https://doi.org/10.3390/en13040796
Hanif MU, Zwawi M, Capareda SC, Iqbal H, Algarni M, Felemban BF, Bahadar A, Waqas A. Product Distribution and Characteristics of Pyrolyzing Microalgae (Nannochloropsis oculata), Cotton Gin Trash, and Cattle Manure as a Cobiomass. Energies. 2020; 13(4):796. https://doi.org/10.3390/en13040796
Chicago/Turabian StyleHanif, Muhammad U., Mohammed Zwawi, Sergio C. Capareda, Hamid Iqbal, Mohammed Algarni, Bassem F. Felemban, Ali Bahadar, and Adeel Waqas. 2020. "Product Distribution and Characteristics of Pyrolyzing Microalgae (Nannochloropsis oculata), Cotton Gin Trash, and Cattle Manure as a Cobiomass" Energies 13, no. 4: 796. https://doi.org/10.3390/en13040796
APA StyleHanif, M. U., Zwawi, M., Capareda, S. C., Iqbal, H., Algarni, M., Felemban, B. F., Bahadar, A., & Waqas, A. (2020). Product Distribution and Characteristics of Pyrolyzing Microalgae (Nannochloropsis oculata), Cotton Gin Trash, and Cattle Manure as a Cobiomass. Energies, 13(4), 796. https://doi.org/10.3390/en13040796