Abstract
Passage vortex exists as one of the typical secondary flows in turbomachines and generates a significant total pressure loss and degrades the aerodynamic performance. Herein, a dielectric barrier discharge (DBD) plasma actuator was utilized for an active flow control of the passage vortex in a linear turbine cascade. The plasma actuator was installed on the endwall, 10 mm upstream from the leading edge of the turbine cascade. The freestream velocity at the outlet of the linear turbine cascade was set to range from UFS,out = 2.4 m/s to 25.2 m/s, which corresponded to the Reynolds number ranging from Reout = 1.0 × 10⁴ to 9.9 × 10⁴. The two-dimensional velocity field at the outlet of the linear turbine cascade was experimentally analyzed by particle image velocimetry (PIV). At lower freestream velocity conditions, the passage vortex was almost negligible as a result of the plasma actuator operation (UPA,max/UFS,out = 1.17). Although the effect of the jet induced by the plasma actuator weakened as the freestream velocity increased, the magnitude of the peak vorticity was reduced under all freestream velocity conditions. Even at the highest freestream velocity condition of UFS,out = 25.2 m/s, the peak value of the vorticity was reduced approximately 17% by the plasma actuator operation at VAC = 15 kVp-p (UPA,max/UFS,out = 0.18).
1. Introduction
Axial-flow turbines are a main component of many modern turbomachines, and are commonly utilized in a vast array of industrial applications including aircraft propulsion jet engines, and electricity power generating gas turbines. In a turbine passage, the secondary flow, which is defined as the cross-flow deviated from the design freestream flow, gives rise to secondary vortices [1]. As shown in Figure 1, a passage vortex is a typical vortex in the secondary flow field among the turbine blades. The inlet boundary layer hits the leading edge of the blade, which leads to the formation of the horseshoe vortex. The pressure gradient within the turbine passage moves the pressure side leg of the horseshoe vortex towards the suction side of the neighboring blade, and causes the growth of a passage vortex. With the migration downstream, the rotation of the passage vortex is strengthened, and the vortex lifts from the endwall.
Figure 1.
Passage vortex generated among turbine blades.
Endwall secondary losses occur because of the vortex formations due to the interaction between the endwall boundary layers and the blades in the turbine cascade passage. According to Sharma and Butler [2], the loss owing to the secondary flows in the endwall region accounts for almost 30–50% of the aerodynamic total pressure loss in a turbine passage. A typical value of the endwall secondary total pressure loss of turbine blades ranges from 0.01 to 0.04, which depends on the low-turning or high-turning blade designs [3]. Therefore, the secondary flow field in a turbine passage has been an important research subject for several decades, as shown in Langston [4], Sieverding [5], Wang et al. [6], and Coull [7].
The Reynolds number is an important dimensionless aerodynamic parameter, which represents the ratio of internal force to viscous force within a fluid. In general, the Reynolds number is defined as follows:
where ρ is the density of the fluid (SI units: kg/m3), U is the reference velocity of the fluid (m/s), L is the reference length (m), and μ is the dynamic viscosity of the fluid (Pa·s or kg/m·s). Turbines for aircraft propulsion systems operate over a very wide range of Reynolds number conditions. The operational Reynolds number is high when taking-off and landing, however, it can drop below 2.5 × 10⁴ while cruising at high-altitudes due to low air density [8]. Although the secondary losses are largely insensitive to the variation of high values of the Reynolds number [9], the secondary losses increase significantly at the lower values of the Reynolds number, below Re = 1 × 10⁵ [10,11].
To reduce the secondary flow and the associated losses, various passive and active flow control applications in turbines are discussed in the literature [12]. Passive flow control initiatives, non-axisymmetric endwall contouring [13], leading-edge fillets/bulbs [14], a boundary layer endwall fence [15], tubercles [16], undulated blade [17], etc., have all been pursued with varying degrees of success, however, they have the disadvantage of being permanent; thus, they produce an unwanted penalty loss at different operating conditions. As the active flow control initiatives, air suction [18], steady jet blowing [19], and pulsed jet blowing [20], have been demonstrated for secondary flow reduction. For example, Bloxham and Bons [18] found that the air suction of the endwall boundary layer yields up to a 28% reduction in total pressure loss, and Benton et al. [19] found that the steady vortex-generating jet blowing from the endwall yields up to a 40% reduction of the total pressure loss. The active flow control devices can be turned off when control is unnecessary, and avoid the negative effects of permanent passive flow control devices [21]. However, such air suction and injection devices impose substantial weight penalties.
A dielectric barrier discharge (DBD) plasma actuator is an attractive active flow control device, which is a simple, thin, light-weight actuator that converts electricity directly into flow acceleration with no moving parts. First, Roth et al. [22] measured the plasma wall jet induced by the DBD plasma actuator in quiescent air using a pitot probe. A recent review of the DBD plasma actuator was presented by Corke et al. [23,24] and Wang et al. [25]. Figure 2 shows the schematic illustration of the DBD plasma actuator. A common DBD plasma actuator configuration consists of an asymmetric pair of metallic electrodes, separated by a dielectric material. One electrode is exposed to the surrounding air, and the other electrode is completely encapsulated within the dielectric material. When a high voltage alternating current (AC) is supplied between the two electrodes, an electric discharge is initiated. The surrounding air is partially ionized, and charged particles are accelerated by the electric field formed around the electrodes, resulting in a two-dimensional one-way wall jet induced along the surface. Computational fluid dynamics (CFD) was performed on the models and applications of the DBD plasma actuators [26,27,28,29].
Figure 2.
Schematic illustration of dielectric barrier discharge (DBD) plasma actuator.
For the application of plasma actuator to the turbine flow, the separation control on the blade suction surface [30,31,32,33,34], and tip leakage vortex reduction [35,36,37,38,39,40,41,42] were conducted. However, there are few studies about the passage vortex reduction in the turbine cascade using the DBD plasma actuator. For the application of the DBD plasma actuator for the passage vortex reduction in a compressor cascade, De Giorgi et al. [43] investigated the effects of the actuator installed at the sidewall on the blade suction surface, and found successful reduction of total pressure loss owing to the passage vortex. In general, compressor blades are low-turning blades with weak secondary vortices, and hence, turbine blades are high-turning blades with strong secondary vortices. Therefore, the secondary flow fields, including the passage vortex, differ significantly for the compressor and turbine blades.
The aim of this study is to investigate the active flow control effects of the DBD plasma actuator on the inlet endwall for the reduction of the passage vortex generated in the linear turbine cascade. The velocity distributions at the outlet of the linear turbine cascade were analyzed using particle image velocimetry (PIV). The effects of input voltage of the plasma actuator and the freestream velocity (Reynolds number) are discussed in the paper. As mentioned, previous studies of DBD plasma actuator applications to turbine flows focused on the active flow control of the separation on the blade suction surface and the tip leakage flow through the blade tip clearance. To the best of our knowledge, the work presented in this paper is the first investigation of the passage vortex reduction of the high-turning turbine cascade by active flow control using the DBD plasma actuator.
2. Experimental Methods
2.1. Wind Tunnel and Linear Turbine Cascade
Figure 3 shows the test section of a linear turbine cascade. The overall view is shown in Figure 3a. The test section is located downstream of a low-speed, open circuit, blower-type wind tunnel. The top view of the test section and blade geometry is shown in Figure 3b. Table 1 shows the specifications of the linear turbine cascade. The turbine cascade consists of six blades, with a chord length of 58.65 mm, and blade height of 75 mm. The geometry of the linear turbine cascade is replicated in the turbine rotor hub shape of the annular turbine wind tunnel at National Institute of Advanced Industrial Science and Technology (AIST) [44,45]. The turbine cascade was made of high-transparent heat-resistant resin (TSR-884B, CMET Inc., Yokohama, Japan) using a stereolithography machine (ATOMm-4000, CMET Inc.). The forming layer pitch of the machine was set at 100 μm. The turbine blades were sprayed with matt black paint in order to reduce both the reflection of laser radiation and the roughness of the blade surface. The surfaces of the blades were polished with ultra-fine grit abrasive paper which had an approximate average particle diameter of 10 μm. The centerline average roughness of the blade surface is estimated as Ra = 1.25 μm. The ratio of the centerline average roughness and blade chord length is Ra/C = 2.1 × 10⁻⁵, which is considered a smooth surface [46]. Note that the surface roughness of turbine blade affects the total pressure losses [47]. The profile loss at a low Reynolds number is reduced by the surface roughness due to a reduction of separation on the blade suction surface, while the profile loss at a higher Reynolds number increases by the surface roughness due to a growth of the boundary layer transition [46,48]. However, the secondary loss is almost unaffected by the surface roughness [48]. A plasma actuator was installed in the acrylic endwall at 10 mm upstream from the leading edge of the linear turbine cascade. Details regarding the plasma actuator are described in Section 2.3.
Figure 3.
Test section of linear turbine cascade.
Table 1.
Specifications of linear turbine cascade.
The rotating speed of the wind tunnel blower was set from 113 Hz to 1125 Hz, in order to change the freestream velocity in the test section. As shown in Table 2, the freestream velocity at the inlet and outlet of the linear turbine cascade, UFS,in and UFS,out, was varied from 2.0 m/s to 21.2 m/s, and 2.4 m/s to 25.2 m/s, respectively. The Reynolds number based on the freestream velocity at the turbine cascade outlet, UFS,out, and the blade chord length, C = 0.05865 m, was changed from Reout = 1.0 × 10⁴ for UFS,out = 2.4 m/s to Reout = 9.9 × 10⁴ for UFS,out = 25.2 m/s.
Table 2.
Inlet and outlet freestream velocity and Reynolds number of linear turbine cascade.
2.2. Particle Image Velocimetry (PIV) Measurements and Data Processing
PIV was employed to quantify the two-dimensional velocity field at the exit of the linear turbine cascade, using a 15 mJ/pulse, double-pulse Nd-YAG laser (NANO S30-15PIV, Litron Lasers Ltd., Rugby, England). Atomized dioctyl sebacate (DOS) oil with a mean particle diameter of 1 μm was injected upstream of the test section, via a pressurized oil chamber. Flow-image pairs were captured by a camera (PIV CAM 13-8, TSI, Inc., Shoreview, MN, USA) with 1280 × 1024 pixel resolution, and a frame rate of 3.75 Hz. A PIV software (Insight, TSI, Inc.) calculated the velocity vectors from the peak correlation of groups of particles between frames, using conventional cross-correlation algorithms on a 32 × 32 pixel grid. Time-averaged velocity distributions were analyzed using 300 instantaneous velocity pairs by PIV. Turbulence intensity was also calculated as follows:
where ux’ and uy’ are the velocity random fluctuation components of x and y directions.
The velocity and turbulence intensity were nondimensionalized by the freestream velocity at the turbine outlet, UFS,out, from 2.4 m/s to 25.2 m/s.
Vorticity was calculated as follows:
where Ux and Uy are the horizontal and vertical velocity components.
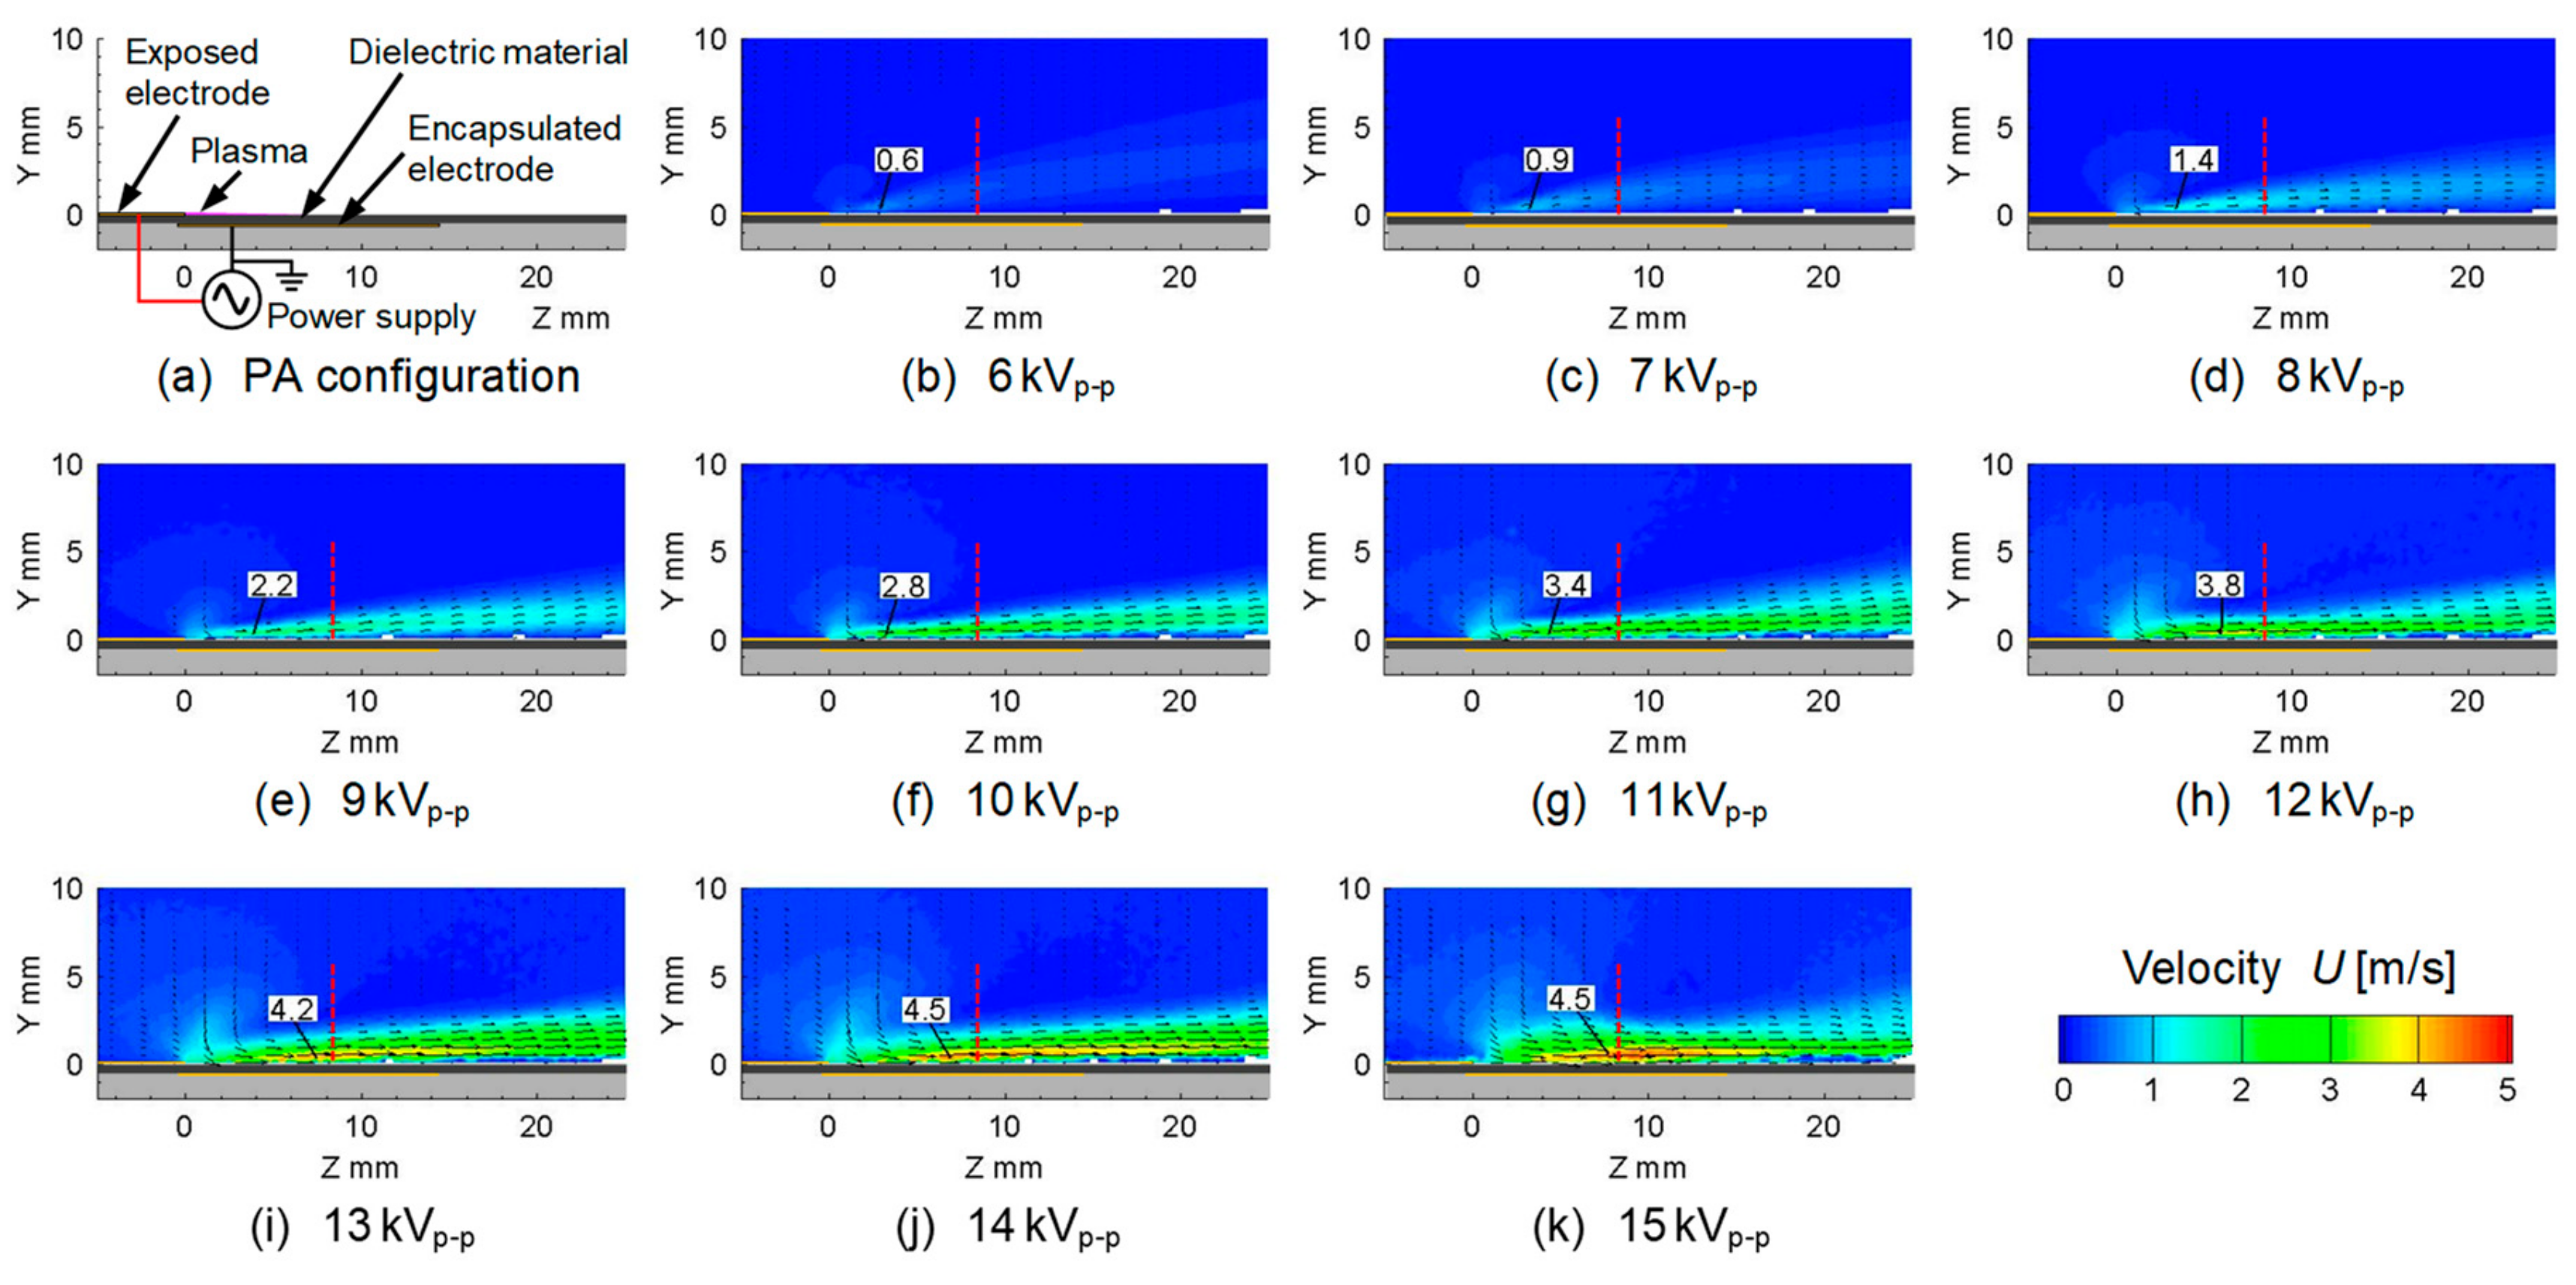
2.3. Plasma Actuator
Figure 4 shows the photographs of the top and bottom views, and cross-sectional schematic of the plasma actuator, along with its geometrical dimensions. The plasma actuator used in this study was created by a printed-circuit board (PCB) process. The exposed and encapsulated electrodes were designed by a CAD software and formed by etching a double-sided copper-clad laminate with a dielectric barrier layer made of silicone resin (CS-3975A, Risho Kogyo Co., Ltd., Osaka, Japan). The thicknesses of the copper exposed and encapsulated electrodes, and the silicone resin dielectric barrier are 0.018 mm and 0.44 mm, respectively. The spanwise width of electrodes is designed to be 150 mm. The streamwise lengths of the exposed and encapsulated electrodes are 5 mm and 15 mm, respectively. As shown in Figure 4, the electrodes are arranged asymmetrically in the streamwise direction and overlapped 0.5 mm in order to generate uniform DBD plasma near one edge of the side of the exposed electrode.
Figure 4.
Photographs of top- and bottom-views and cross-sectional schematic of plasma actuator.
The plasma actuator was excited with a sinusoidal waveform from a power supply (HAPS-10B40, Matsusada Precision Inc., Kusatsu, Japan). The amplitude of the input peak-to-peak voltage to the plasma actuator was varied from 6 kVp-p to 15 kVp-p, and the frequency of the input voltage was fixed at 10 kHz. The minimum input voltage, 6 kVp-p, was limited due to the lower voltage for plasma emission, and the maximum input was limited due to the power supply capability.
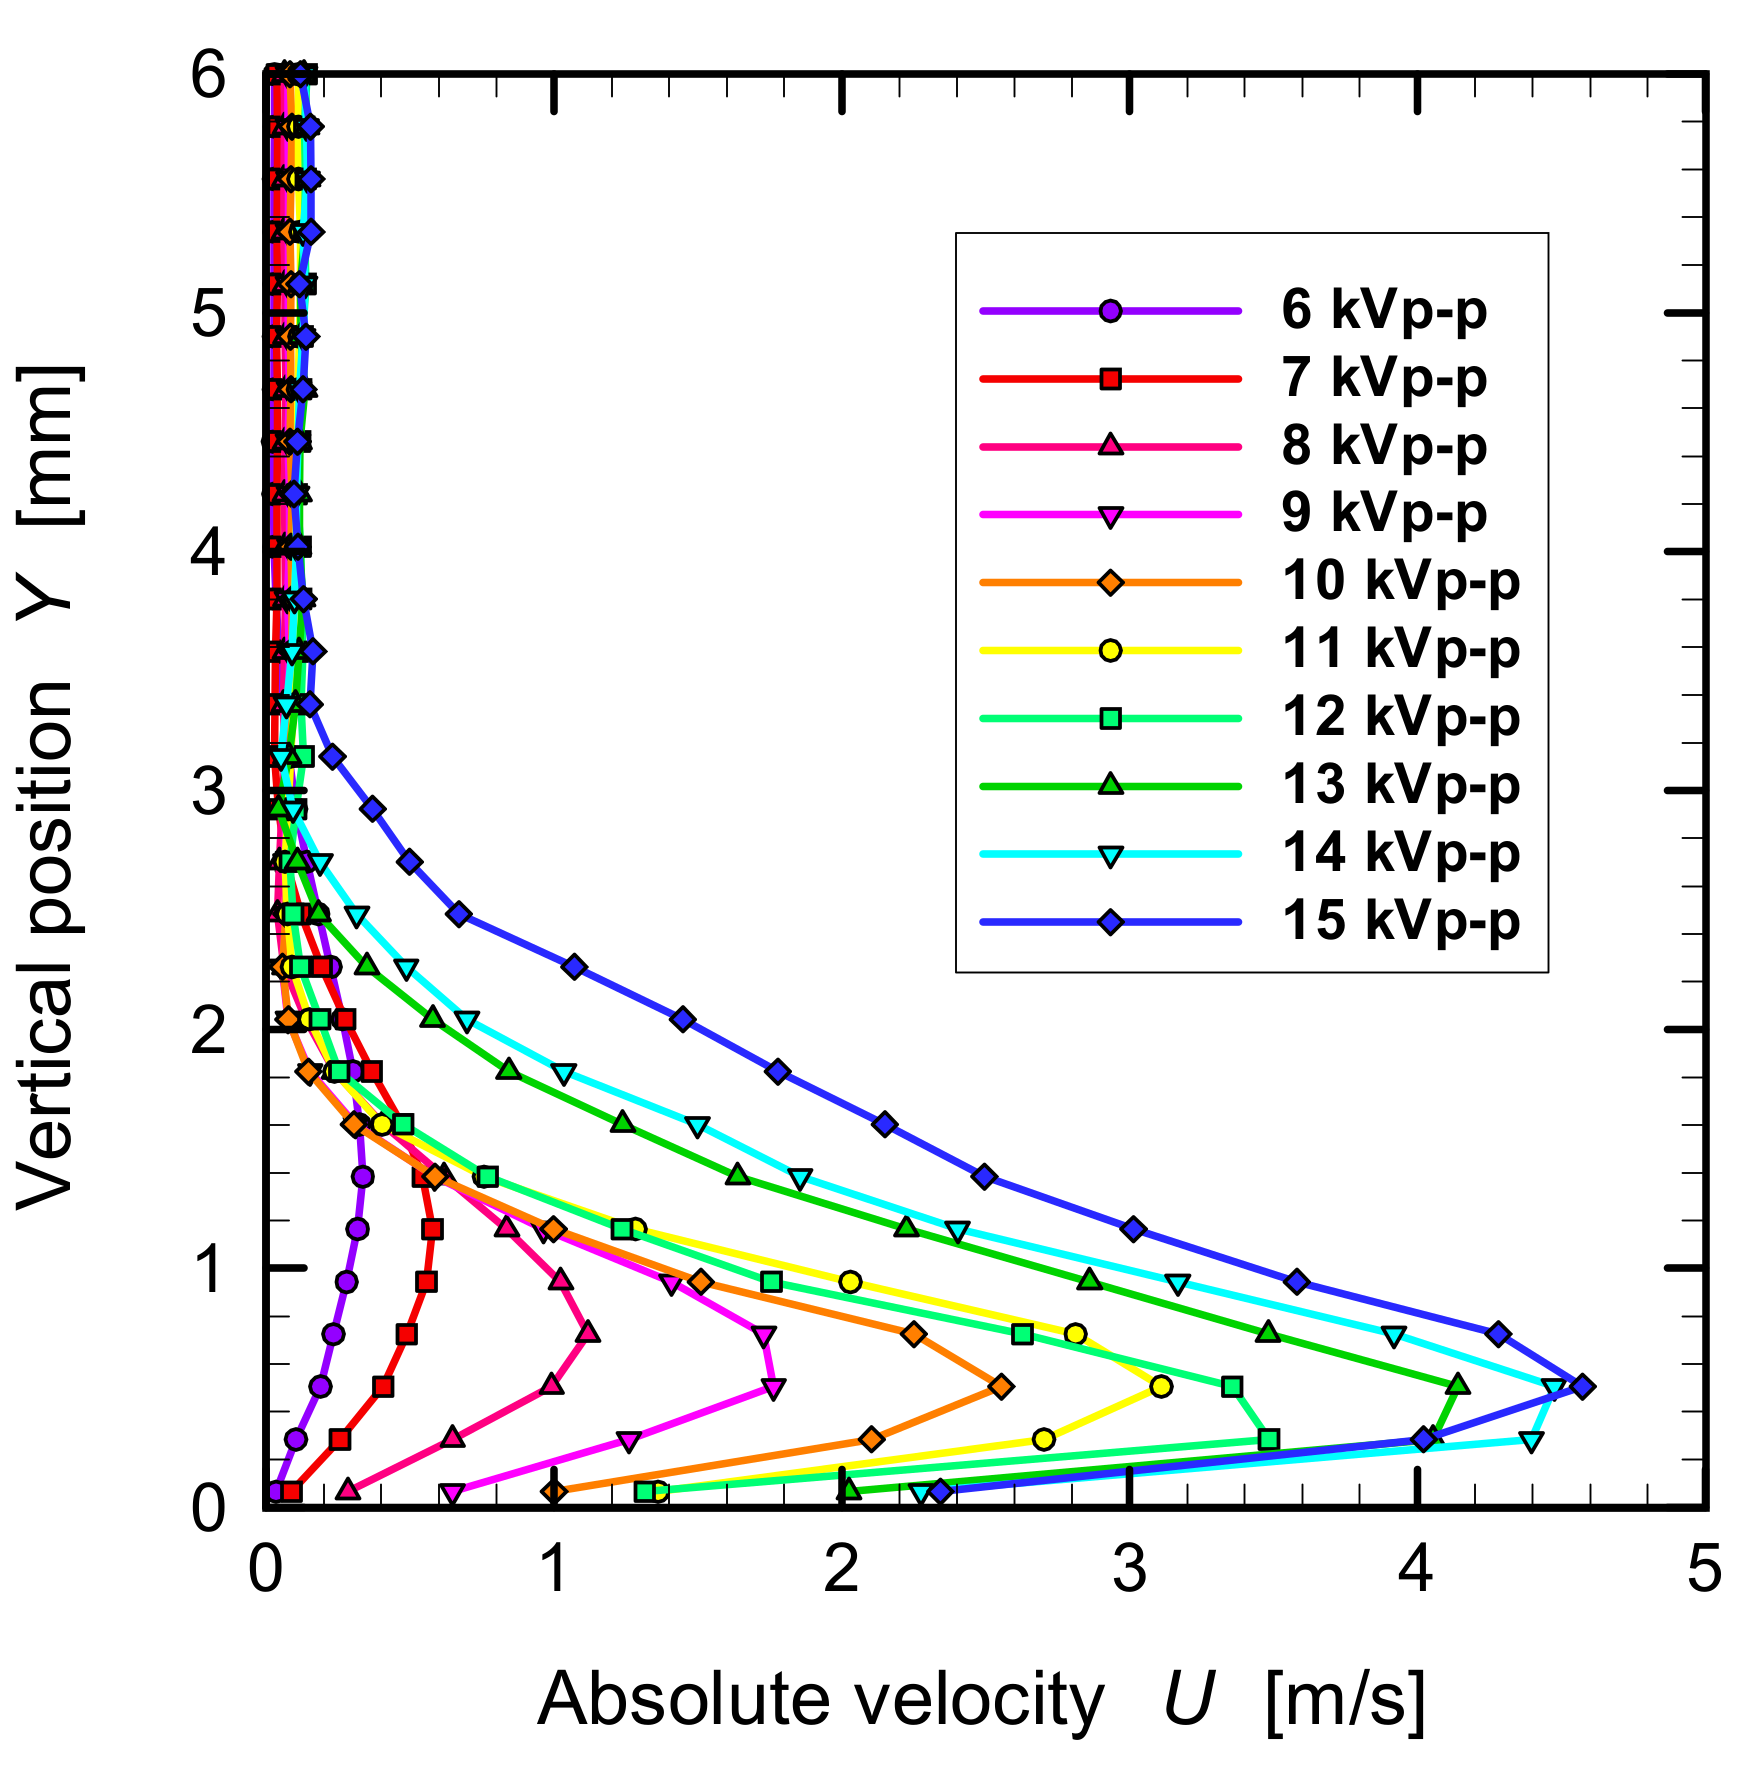
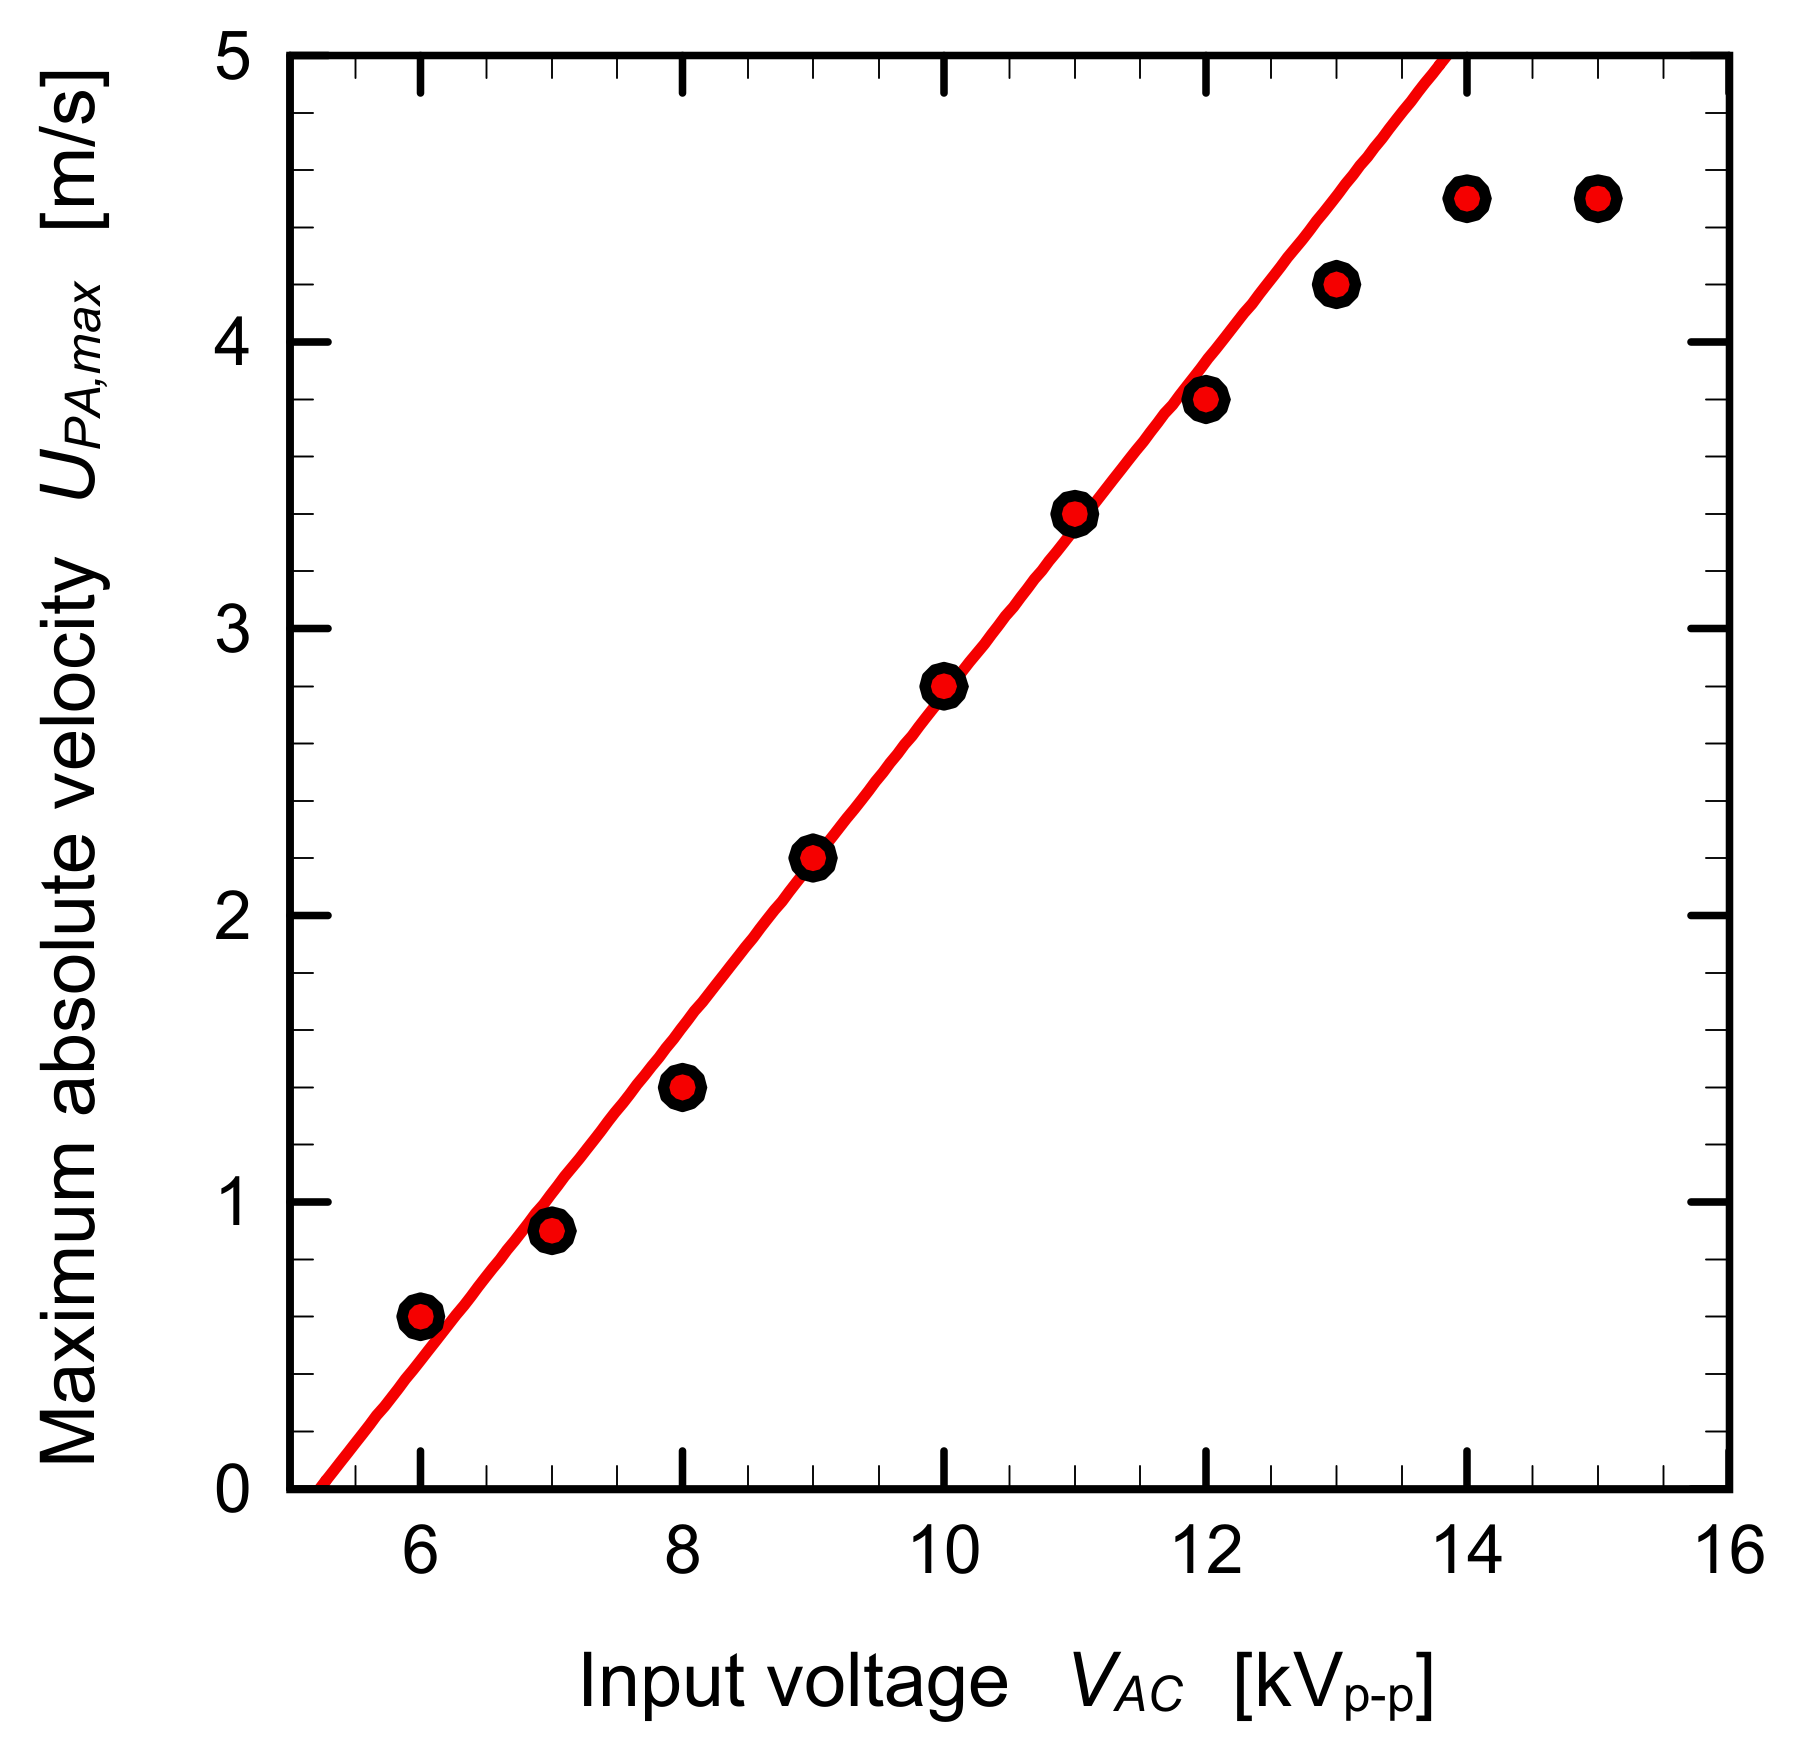
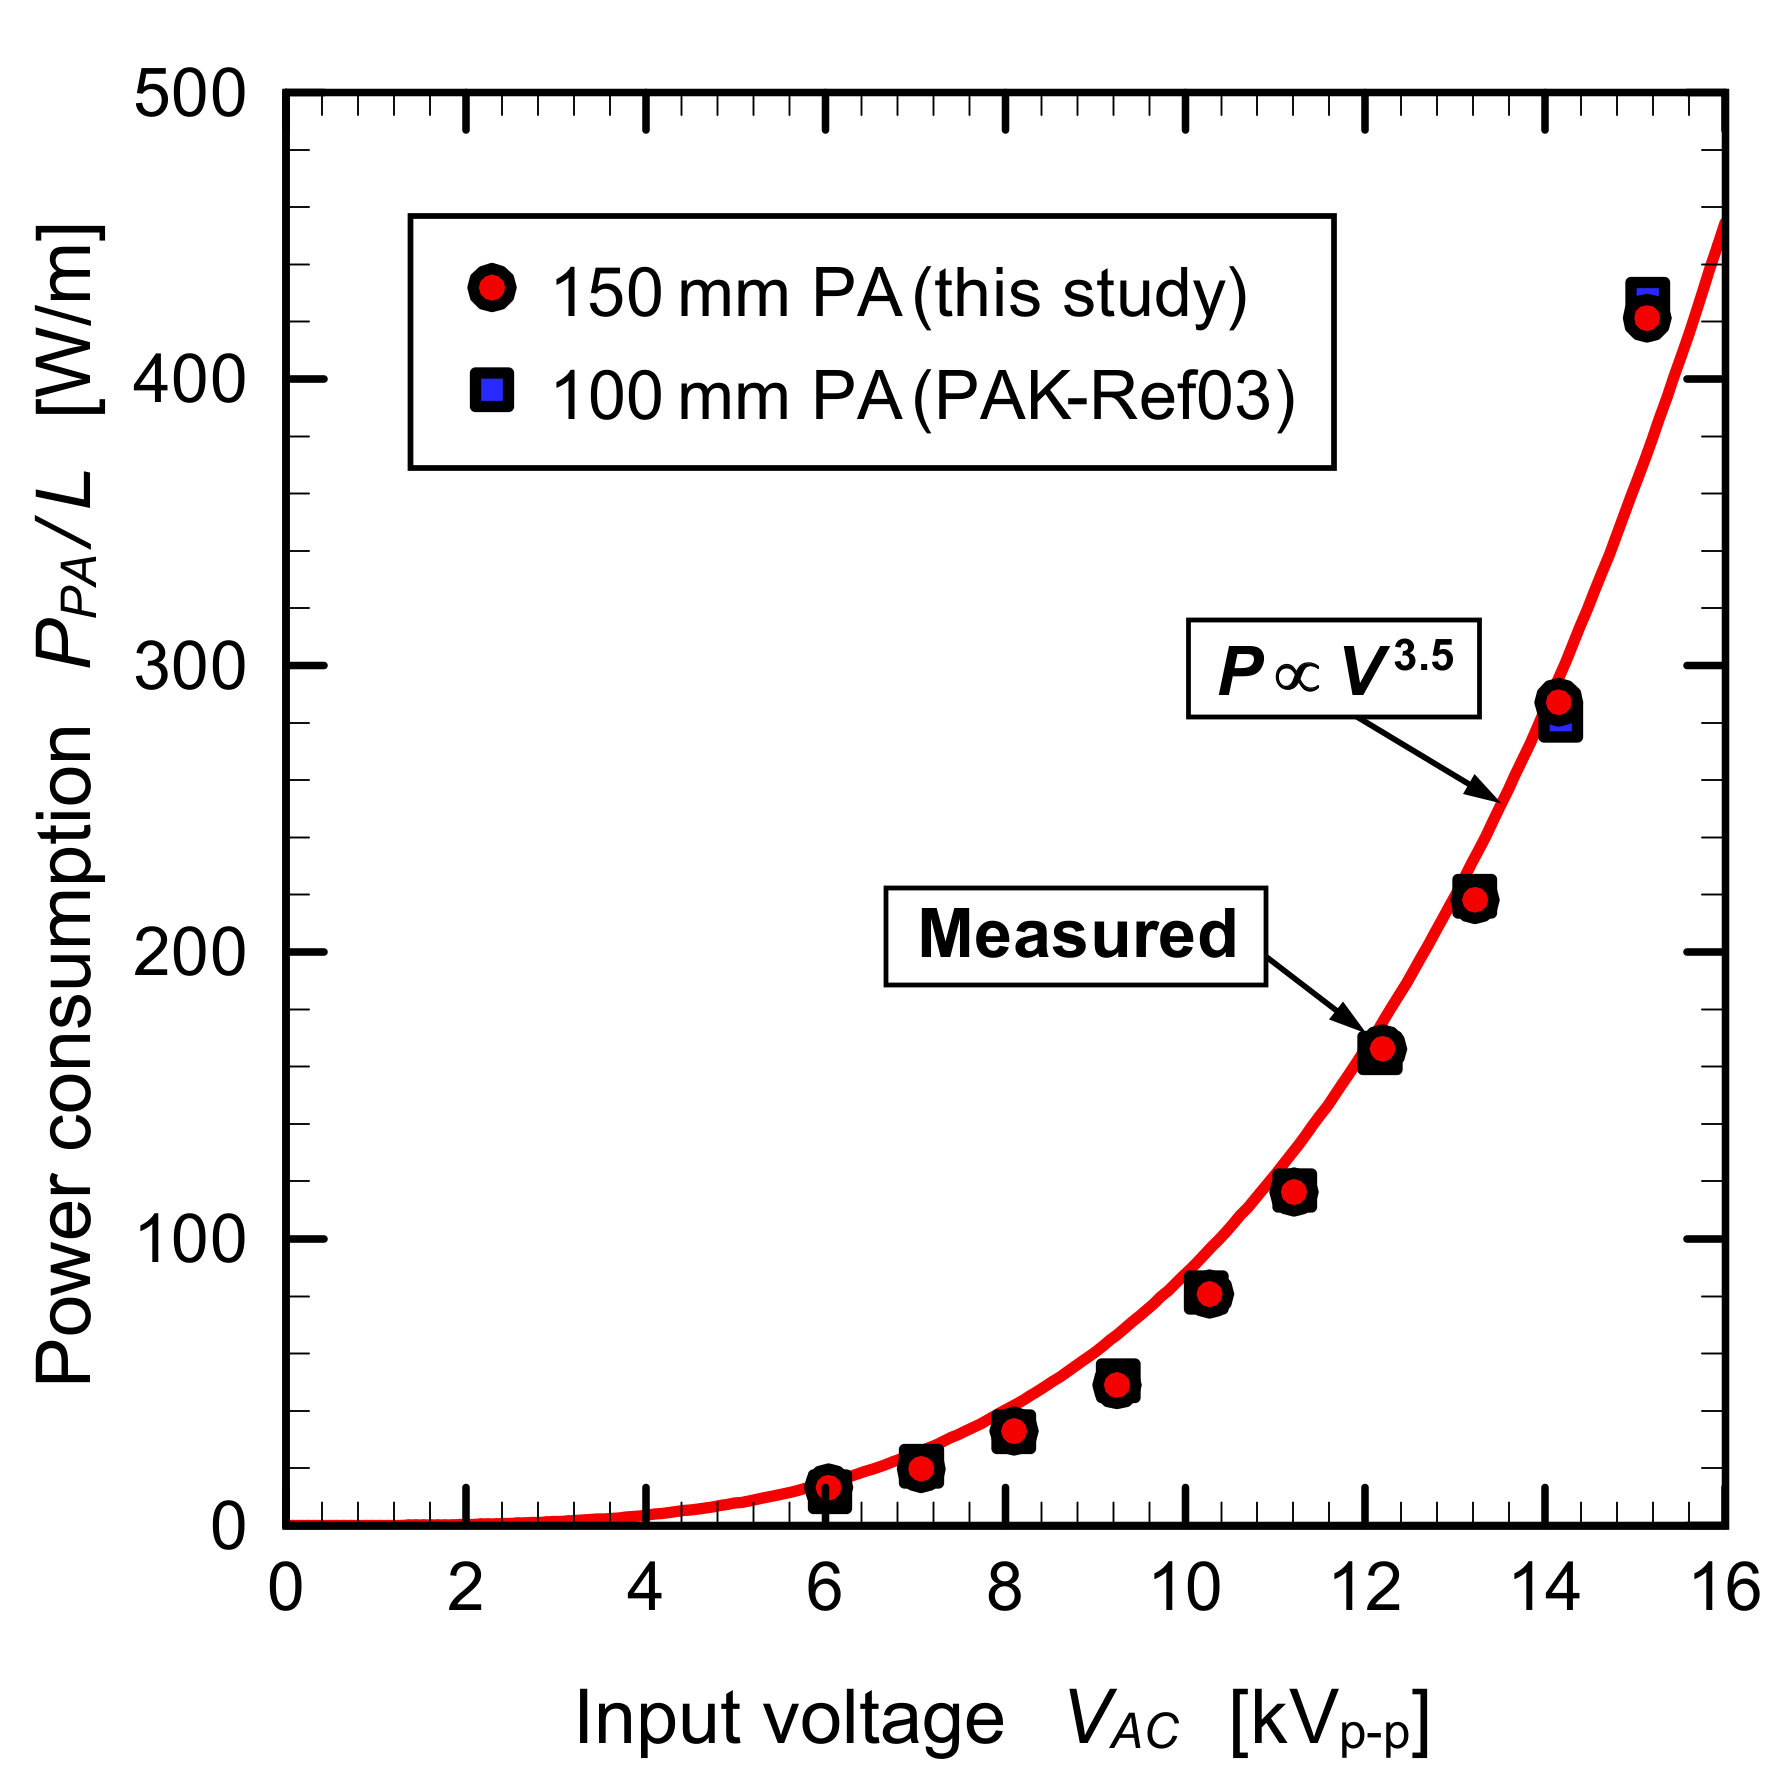
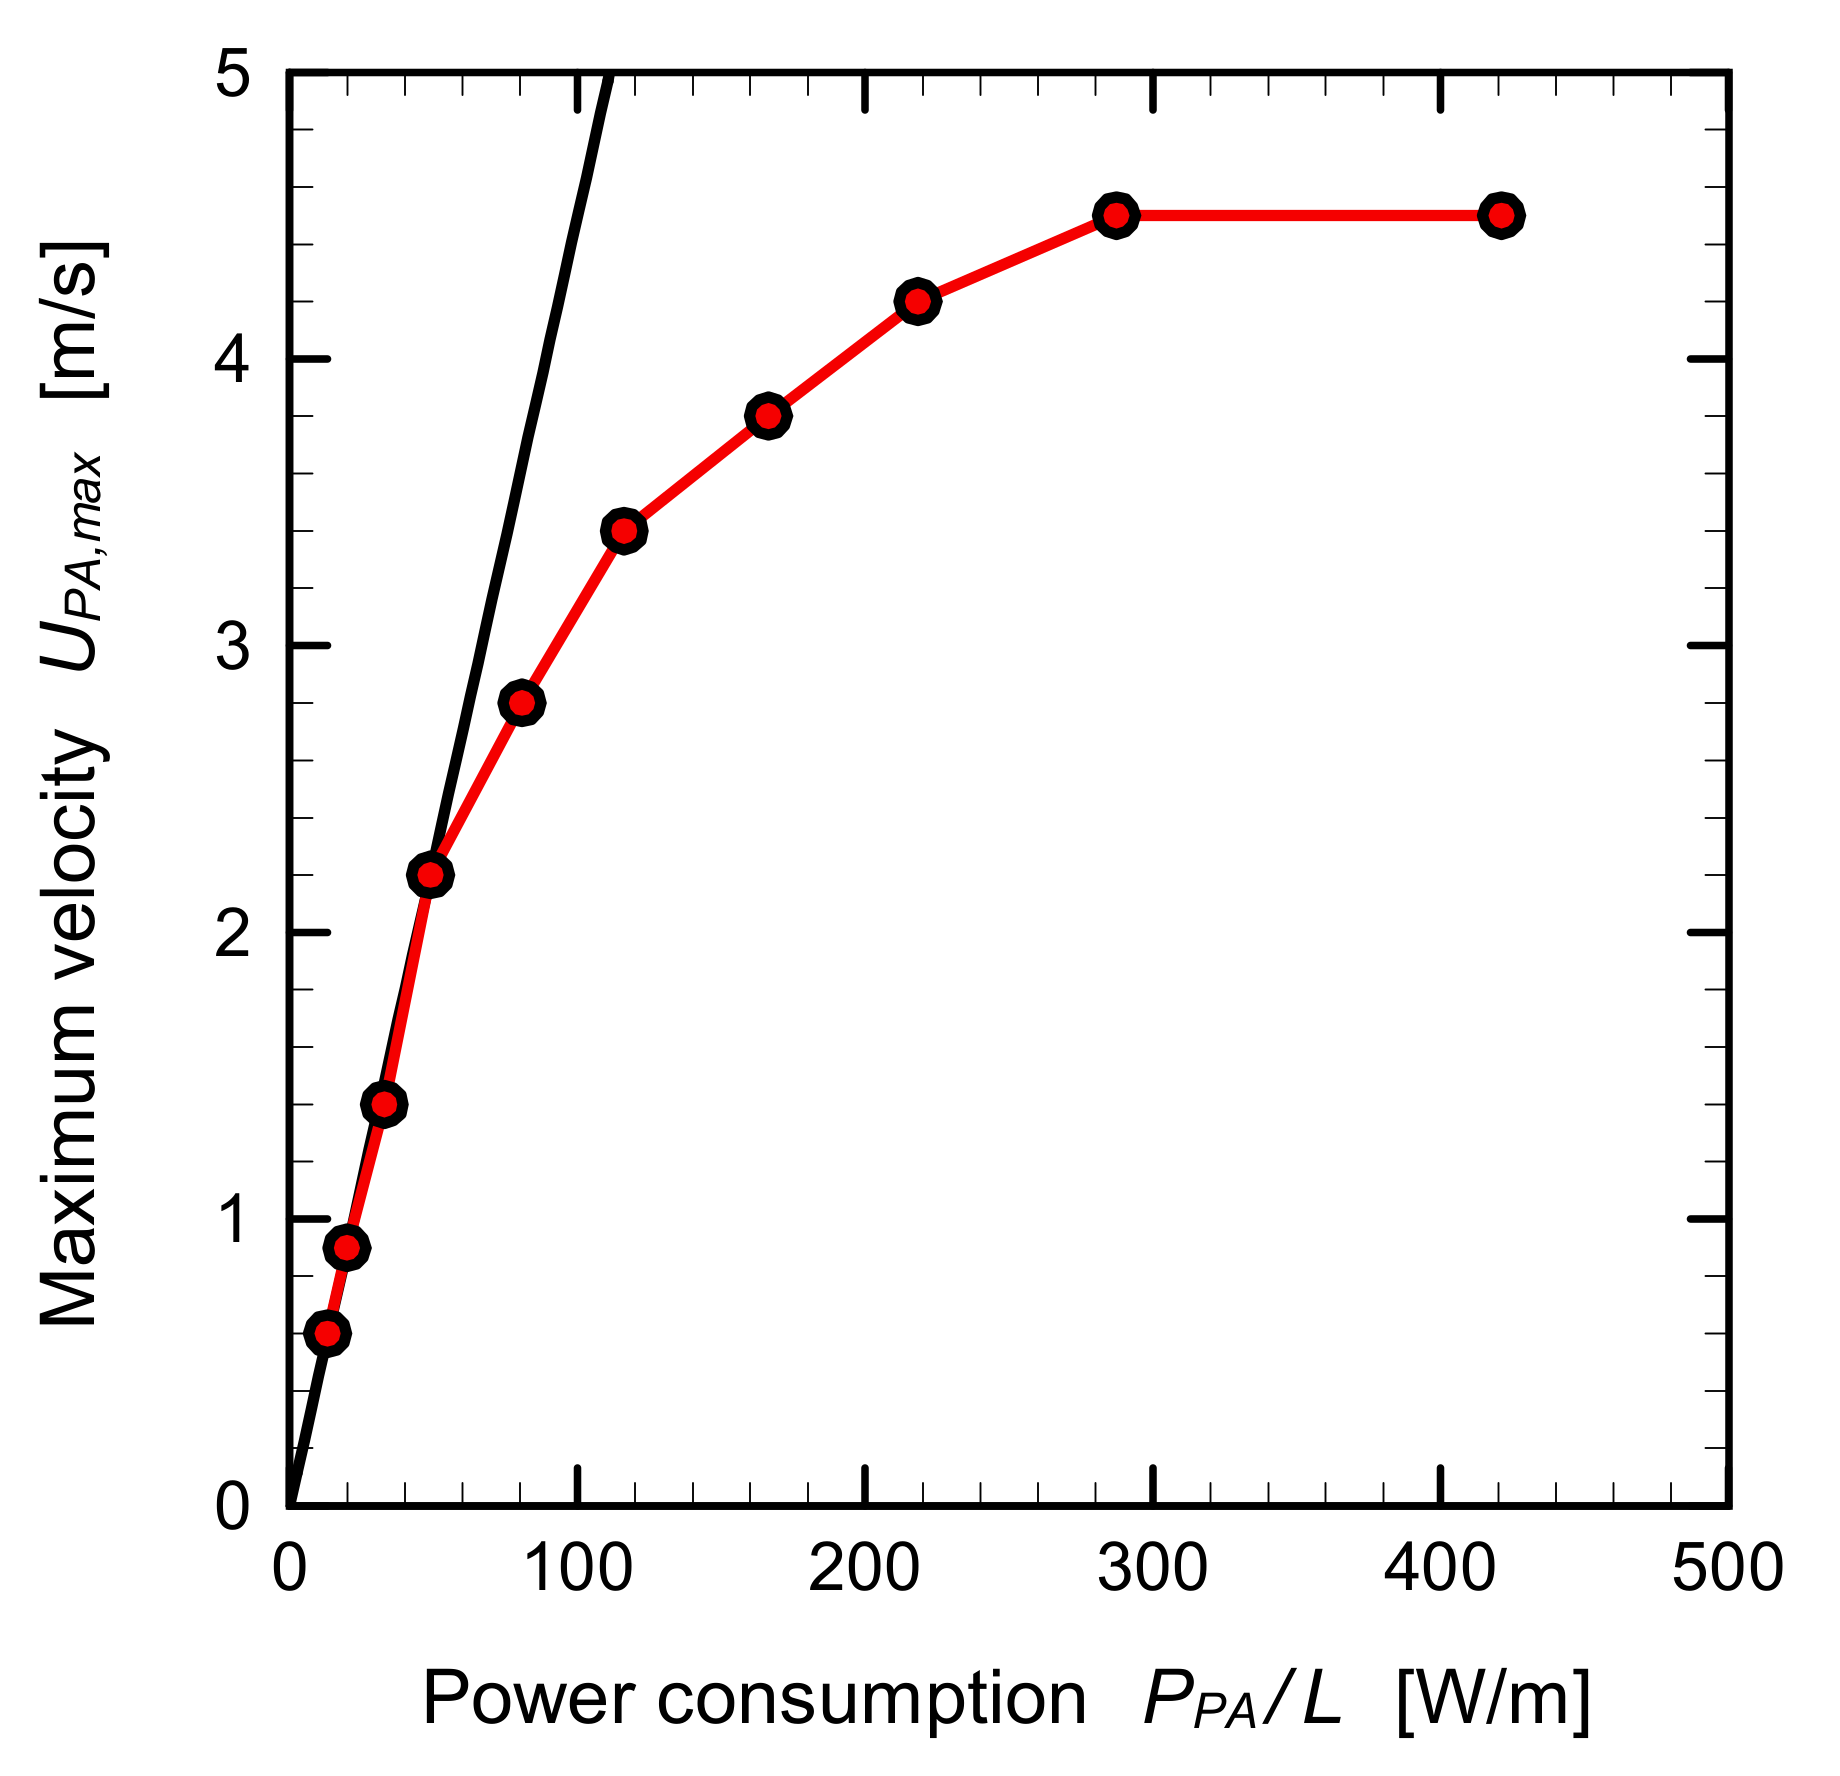
3. Characteristics of Plasma Actuator
Figure 5 shows the velocity distribution of the induced flow by the plasma actuator in quiescent flow at different input voltages. The velocity vectors were superimposed upon the velocity contours in these Figure 5b–k. The values of the maximum velocity for various input voltages are also indicated in the figures. The plasma generates a wall tangential jet, which brings a local acceleration of the fluid downstream in the z direction. It is confirmed that the velocity magnitudes of the tangential jet tend to increase as the input voltage increases from 6 kVp-p to15 kVp-p.
Figure 5.
Absolute velocity distributions of induced flow by plasma actuator.
Figure 6 shows the vertical distributions of the velocity at the streamwise position of Z = 8.5 mm (red dashed lines in Figure 5). The peak and width of the velocity increases with the increased input voltage.
Figure 6.
Vertical distributions of absolute velocity at streamwise position of Z = 8.5 mm.
Figure 7 shows the maximum absolute velocity induced by the plasma actuator at various input voltages in Figure 5. The maximum velocity increases in almost direct proportion to the input voltage. However, at a high input voltage, over 12 kVp-p, the maximum velocity shows a low increase rate.
Figure 7.
Maximum absolute velocity induced by plasma actuator at various input voltages.
Figure 8 shows the power consumption of the plasma actuator for various input voltages. The power consumption was measured by the voltage-charge (V-Q) Lissajous method [49,50], and was normalized by the spanwise width of the plasma actuator (0.15 m). The power consumption of the plasma actuator with the spanwise width of 150 mm used in this study (red symbols) increased drastically, as the input voltage increased. The maximum power consumption at the maximum input voltage of 15 kVp-p is approximately 420 W/m. The measured power consumption data fit the typical curve of the 3.5 power of the input voltage, which was reported by Murphy et al. [51] and Hanson et al. [52]. The power consumption plots (blue symbols) of the standard plasma actuator with a spanwise width of 100 mm, named PAK-Ref03, is shown in the figure as a reference. The plasma actuator, PAK-Ref03, is provided by AIST in Japan as an activity of the Technical Section on Plasma Actuators, which was held in the Fluid Engineering Division (FED) of the Japan Society of Mechanical Engineers (JSME) [53]. The data of both the 150 mm and 100 mm spanwise width plasma actuators have a similar trend.
Figure 8.
Power consumption of plasma actuator.
Figure 9 shows the relationship between the power consumption and the maximum velocity of the plasma actuator. The maximum velocity increases linearly when the power consumption is under 50 W/m; however, its increasing rate decreases as the power consumption exceeds 50 W/m.
Figure 9.
Relationship between power consumption and maximum velocity.
4. Results and Discussion
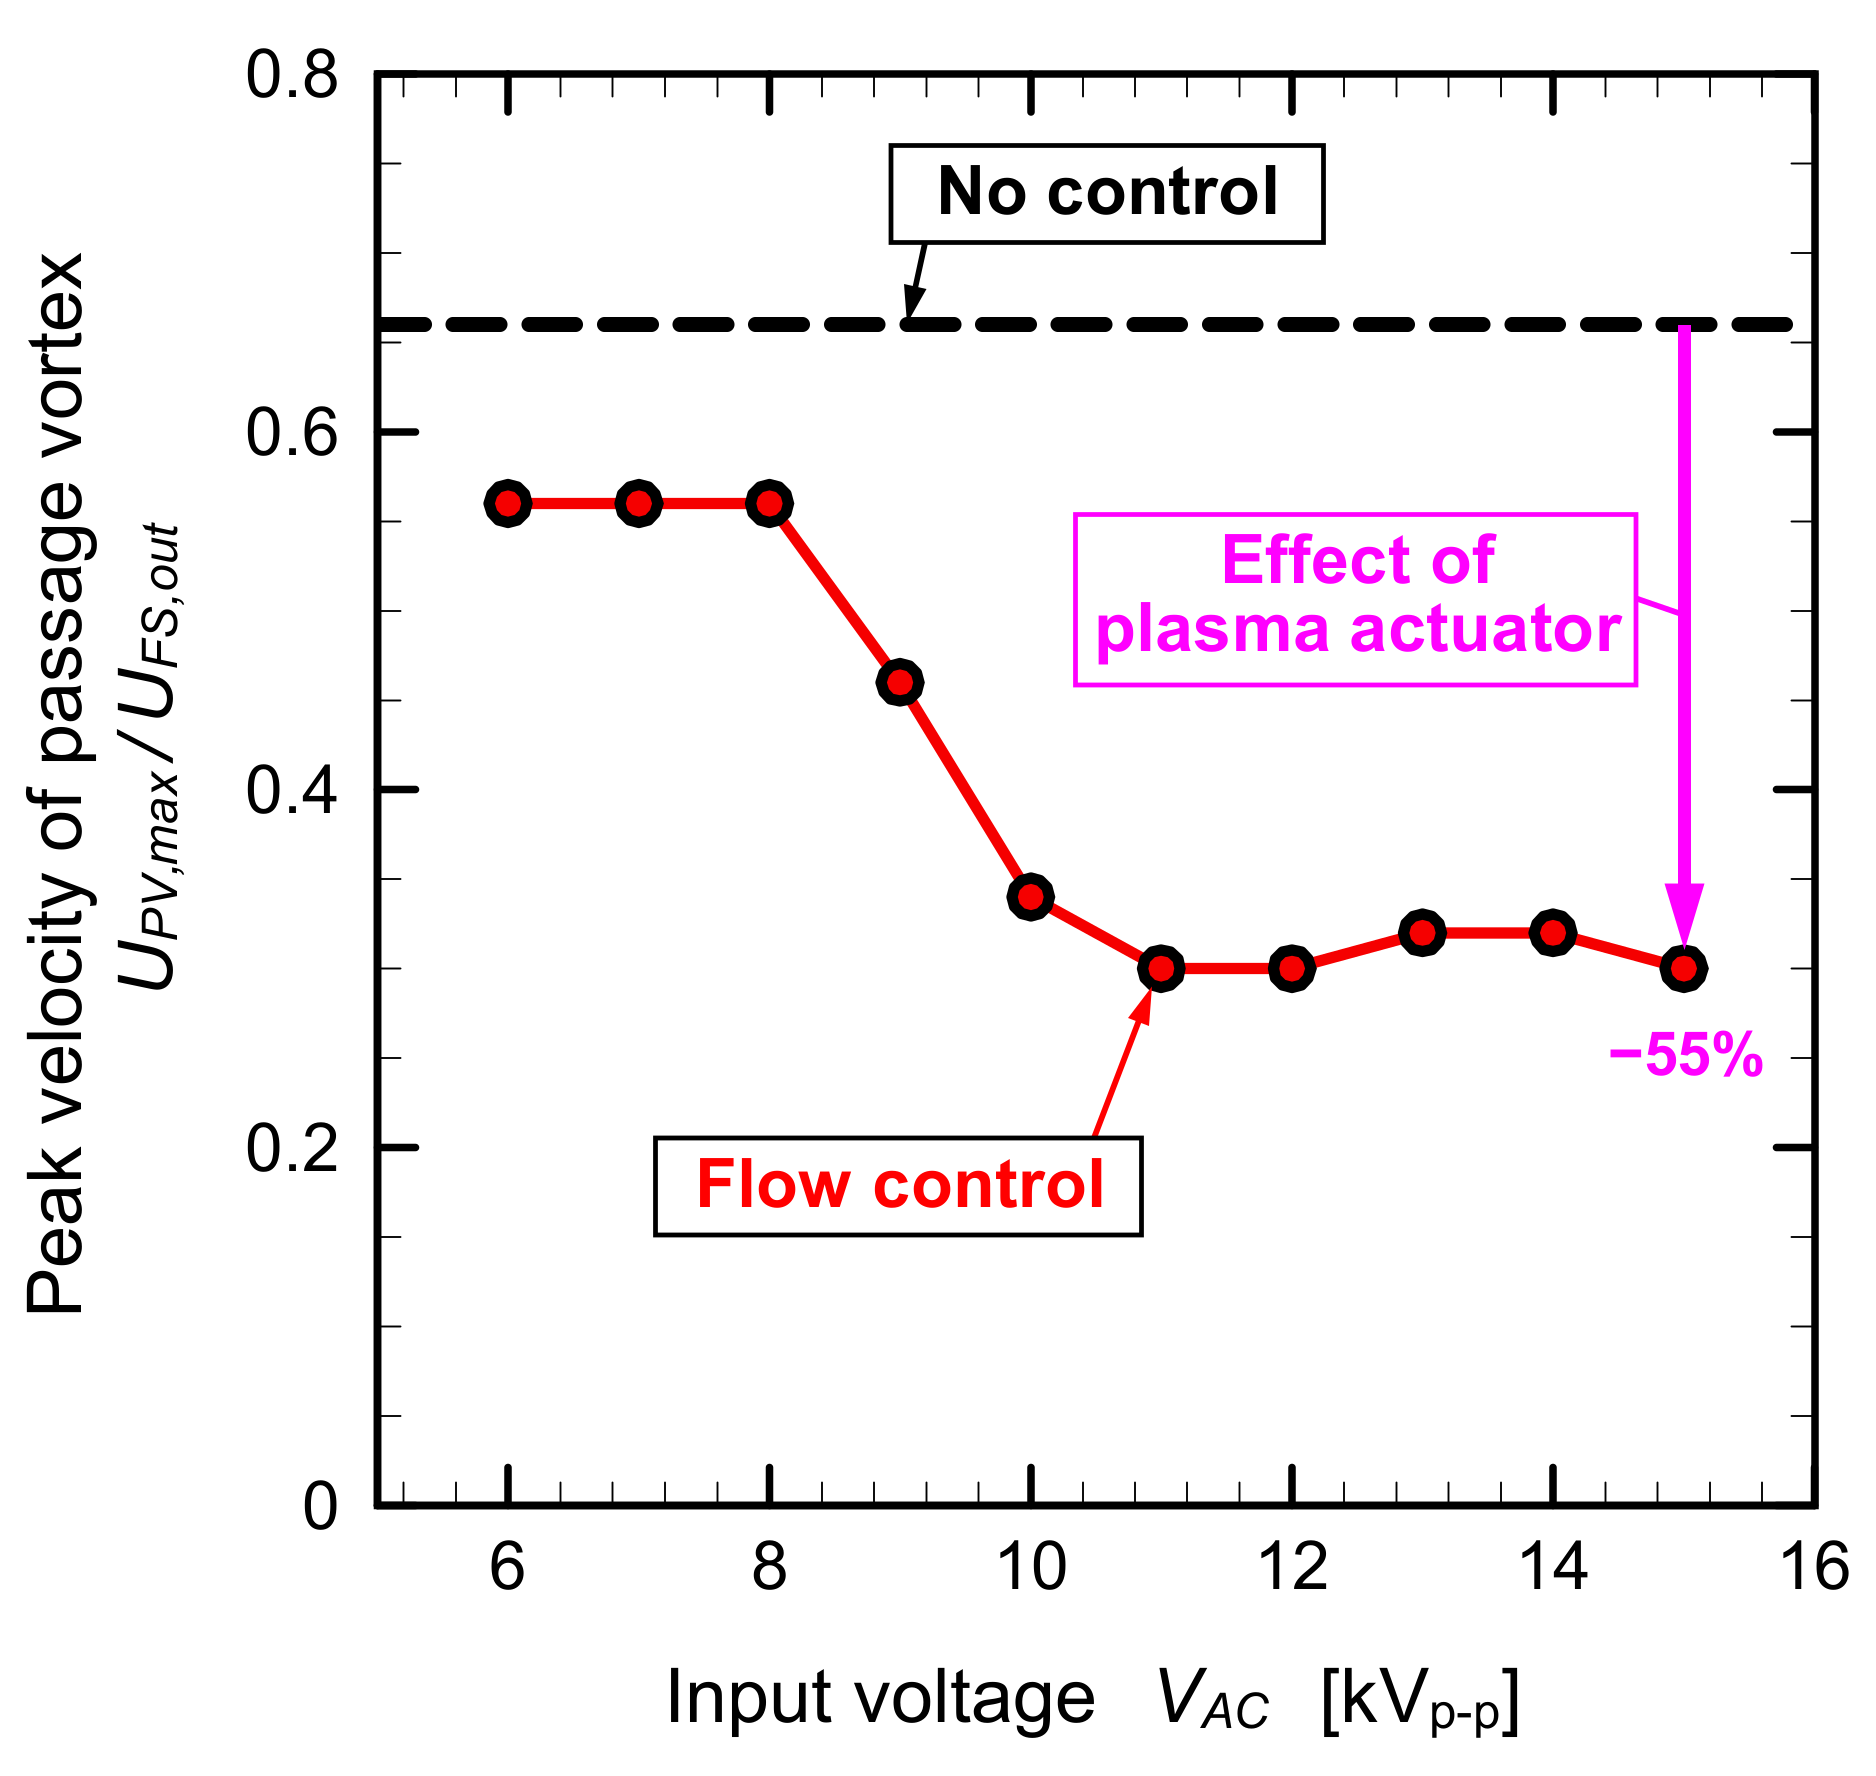
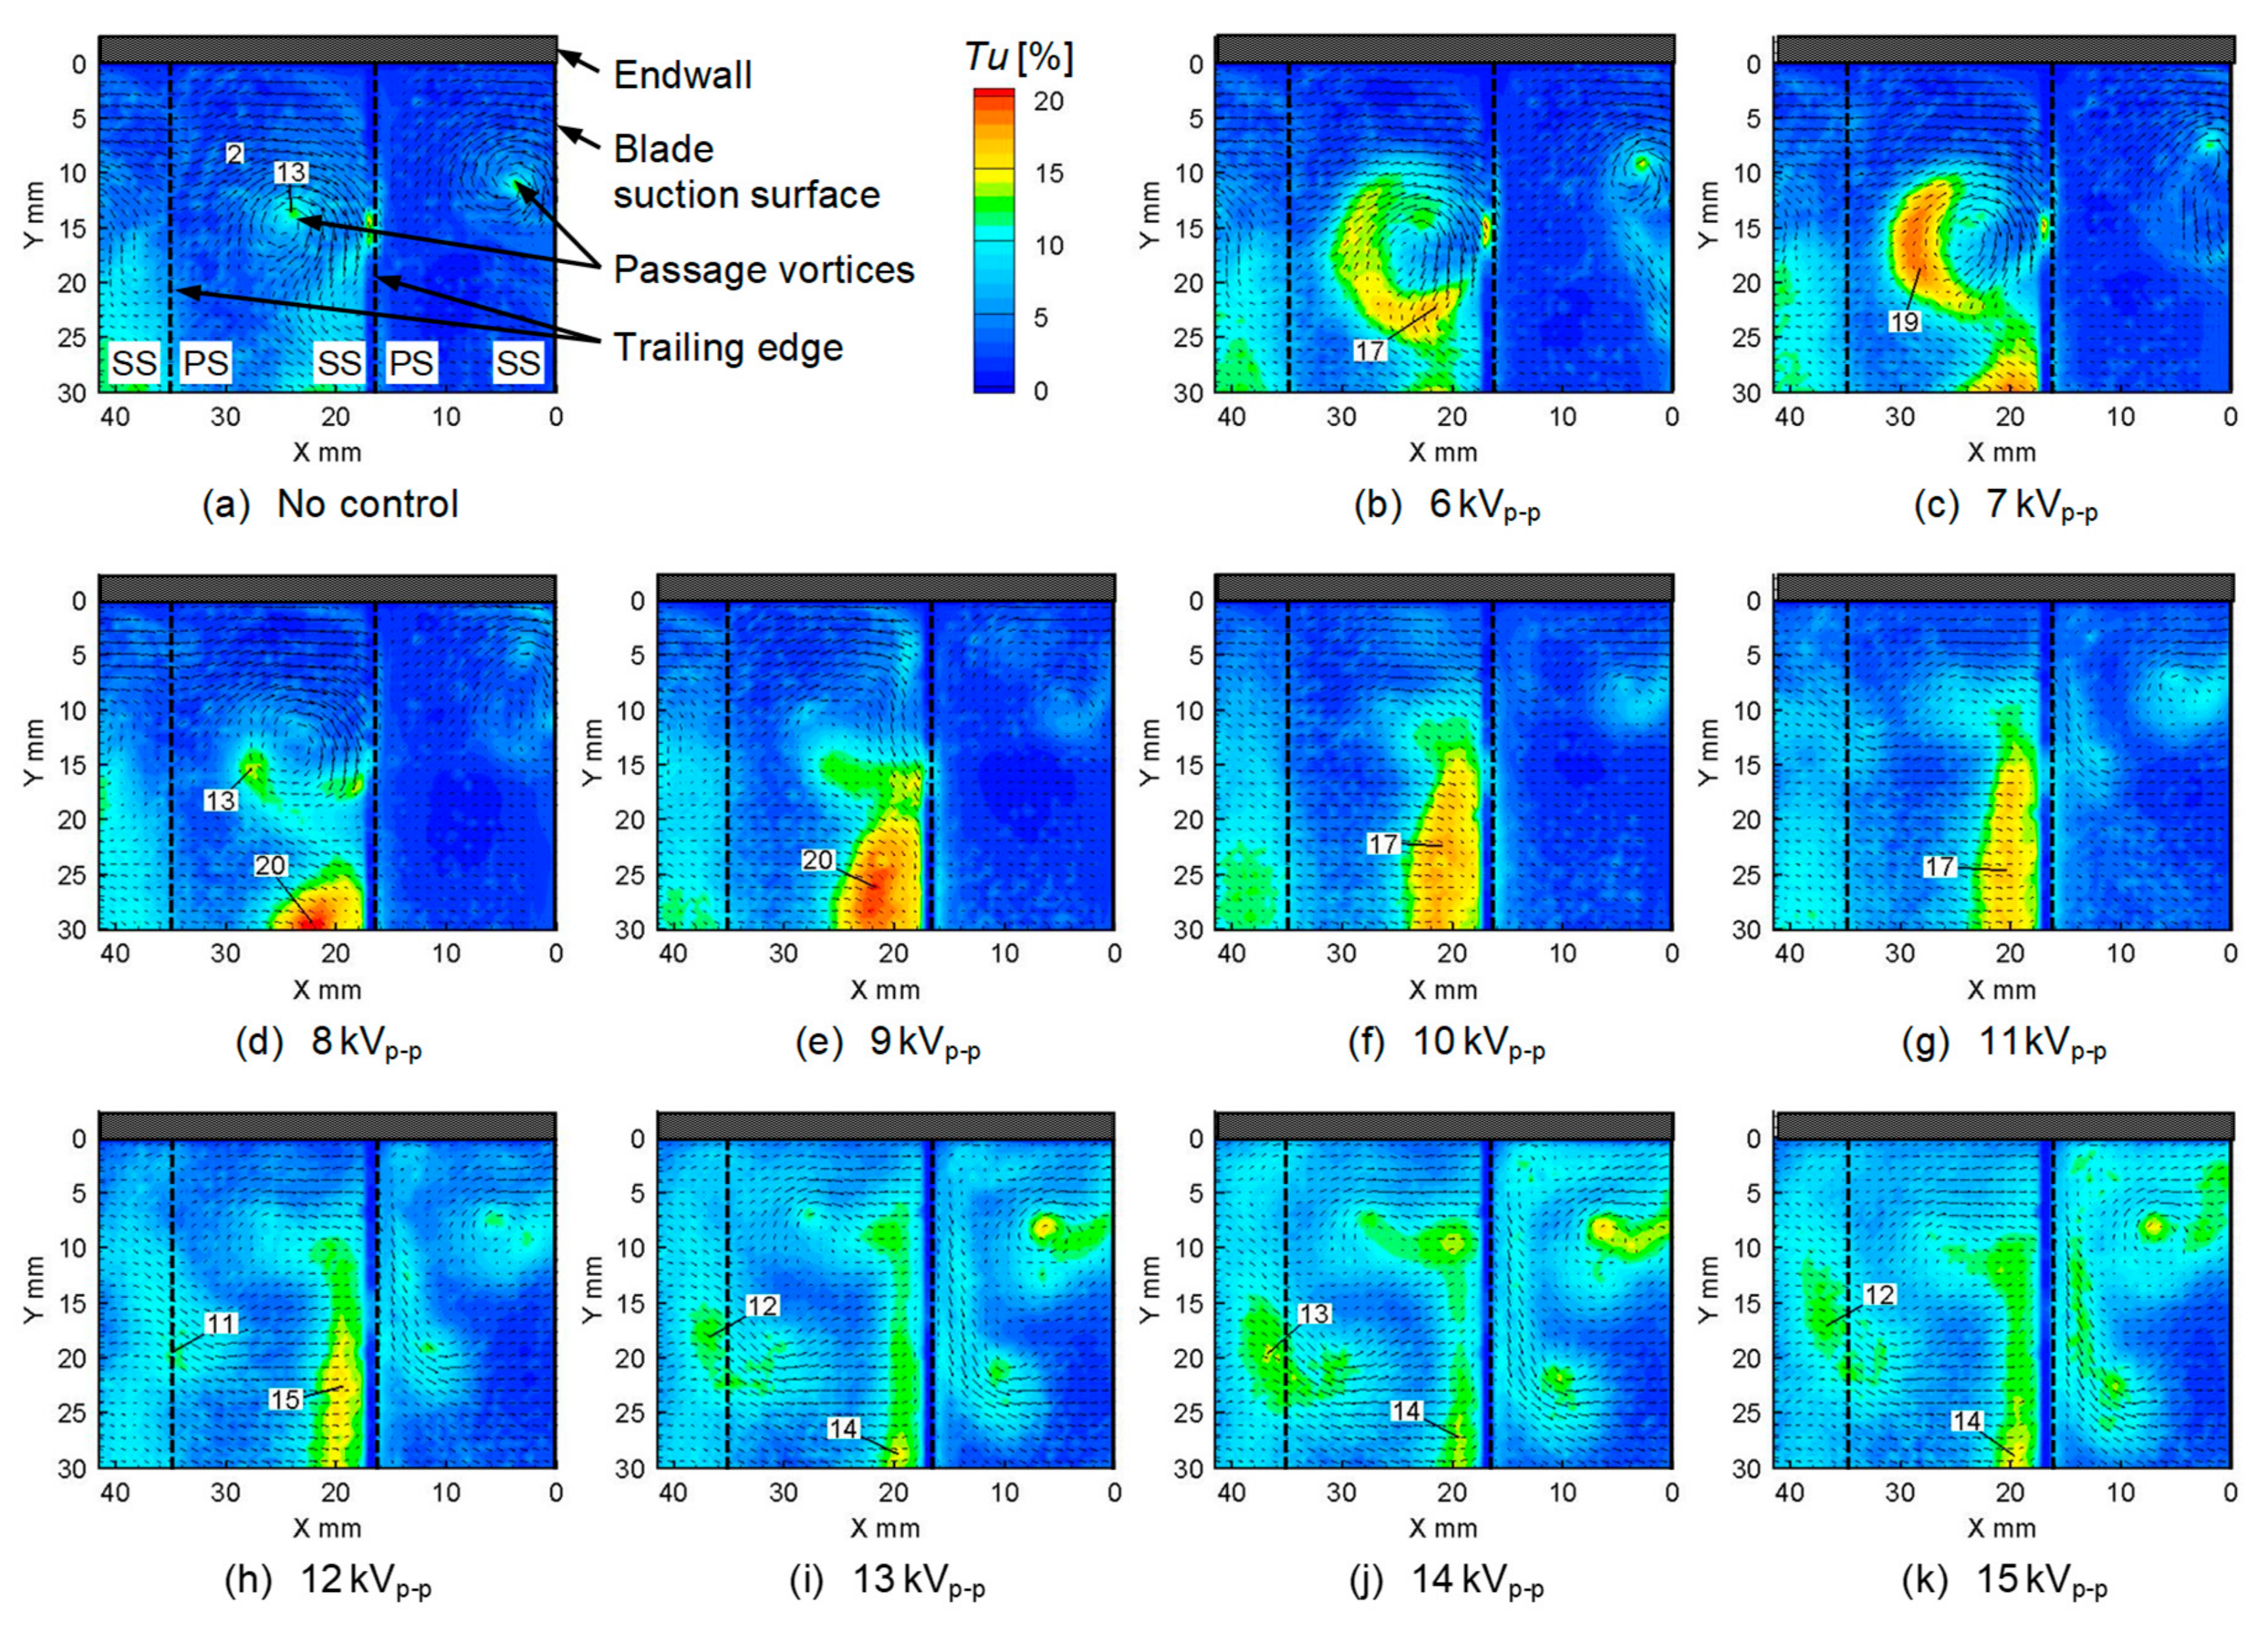
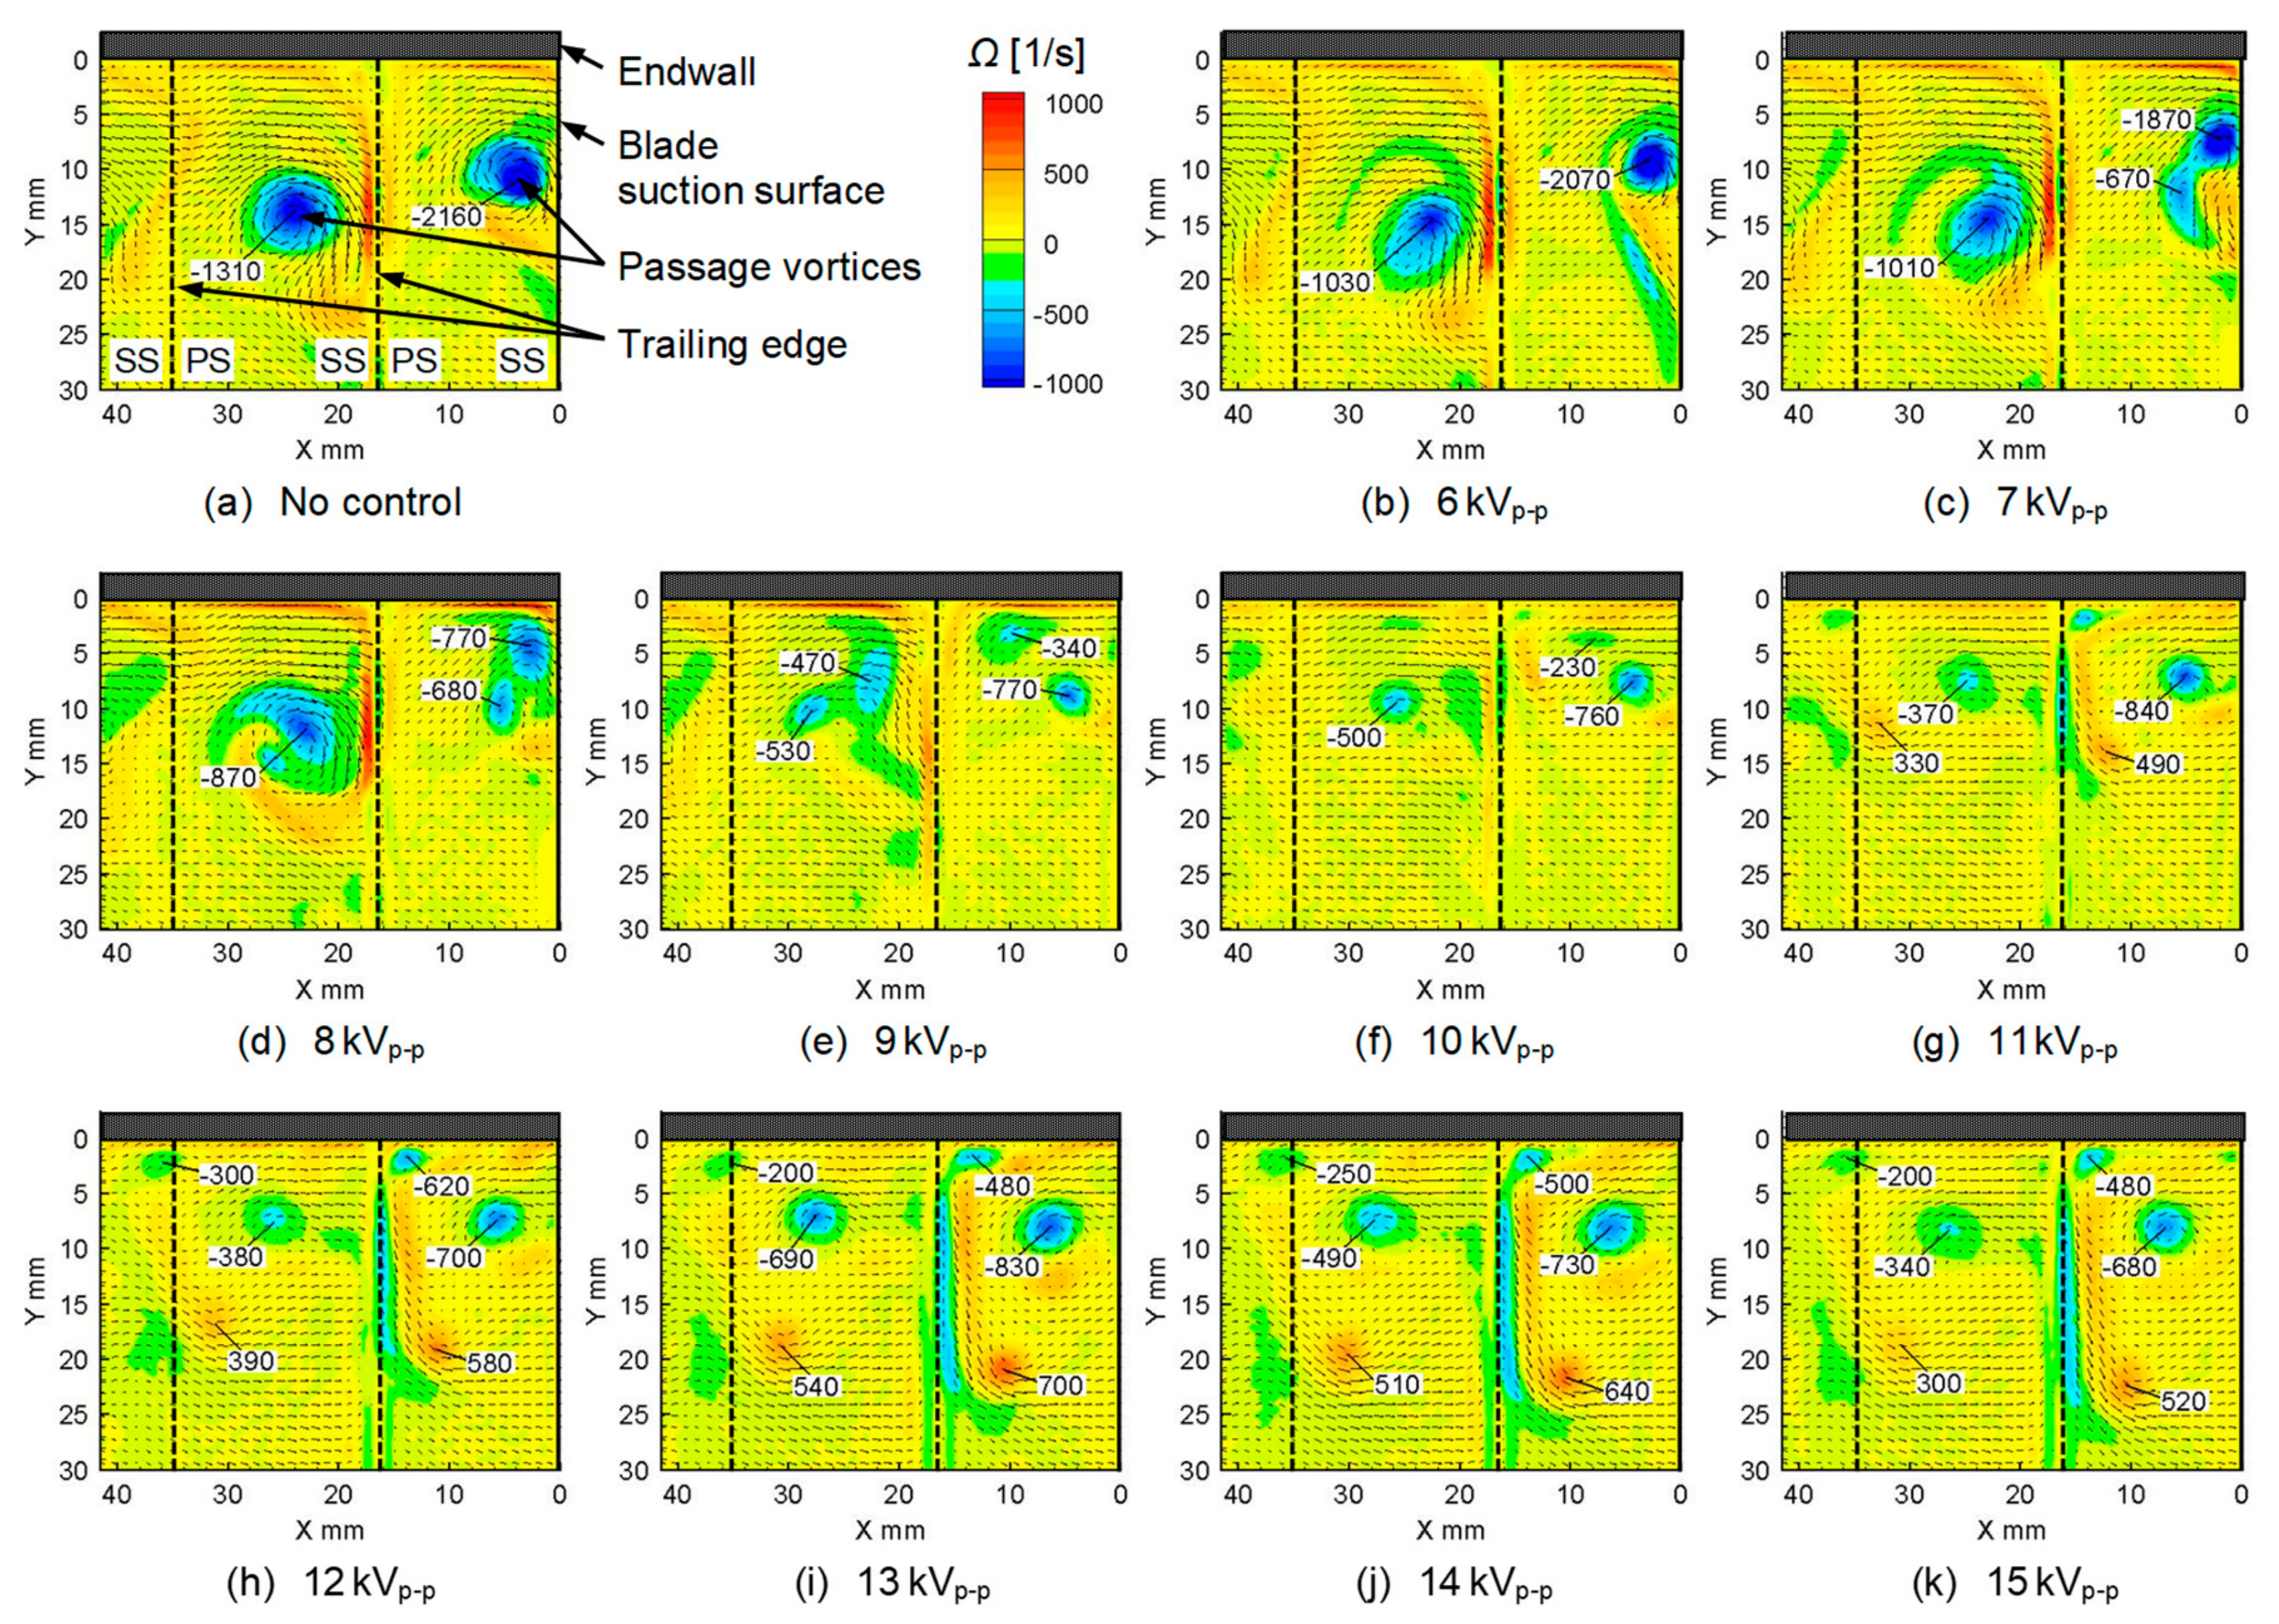
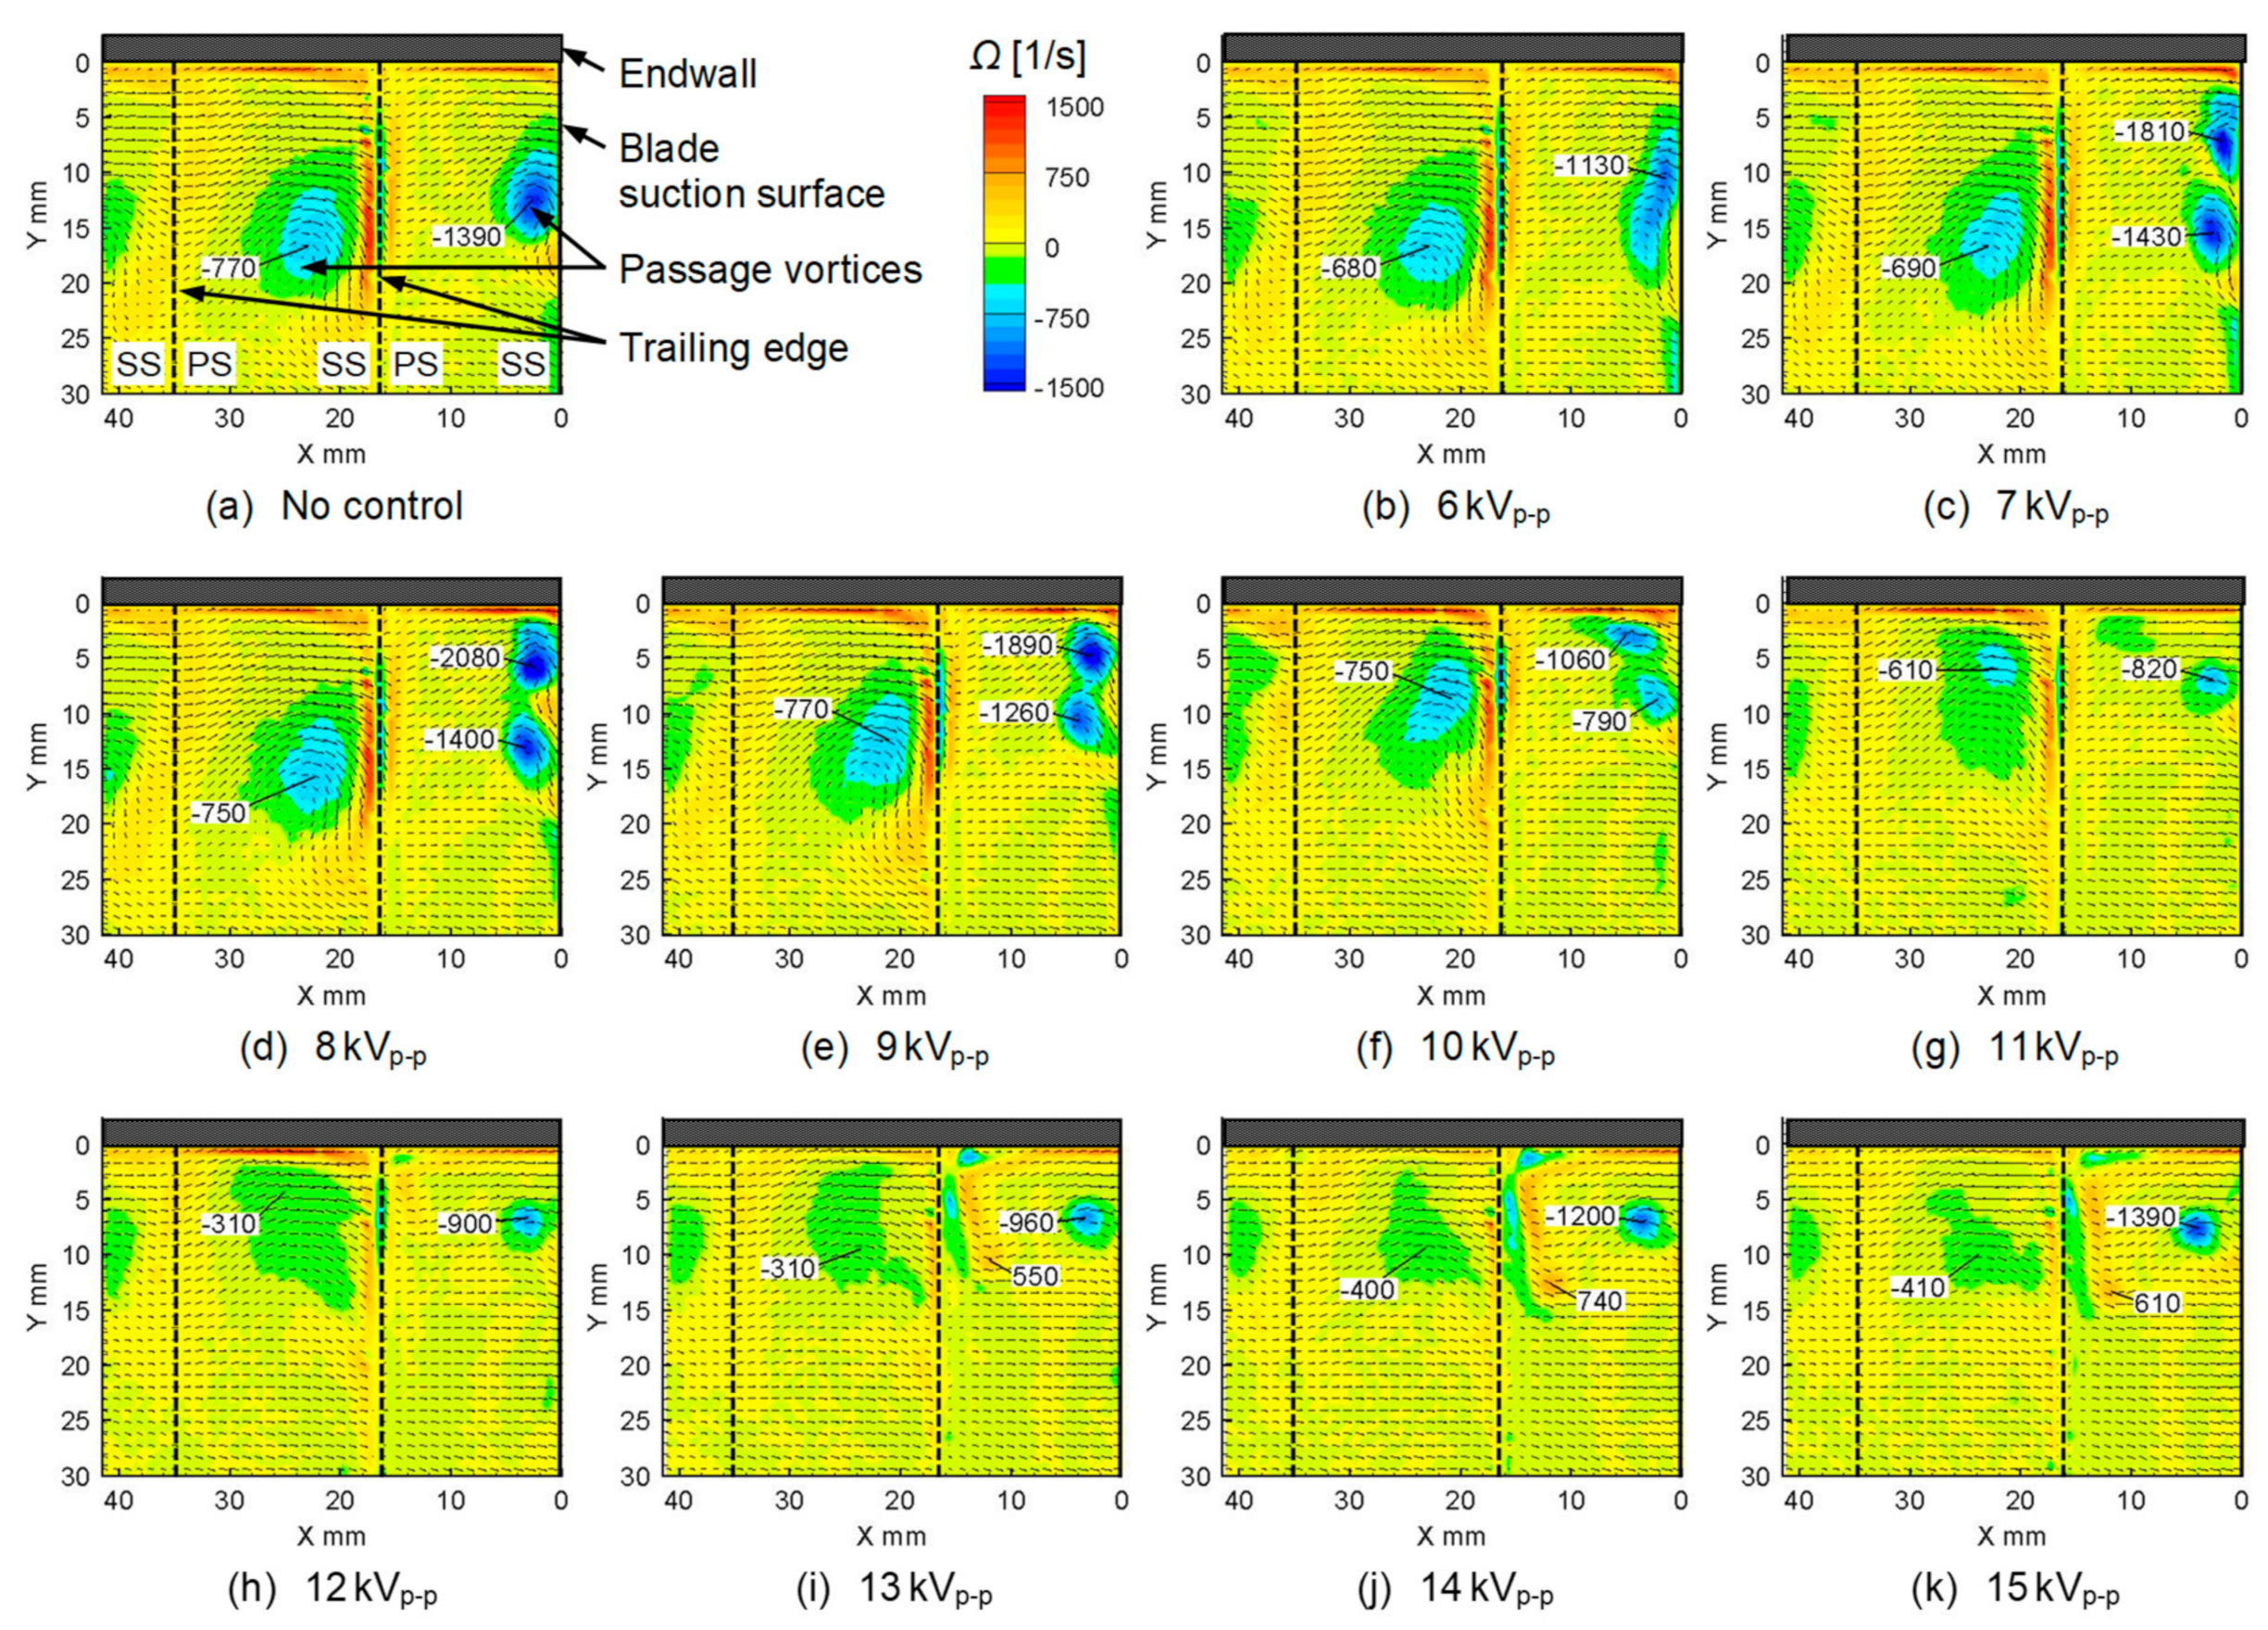
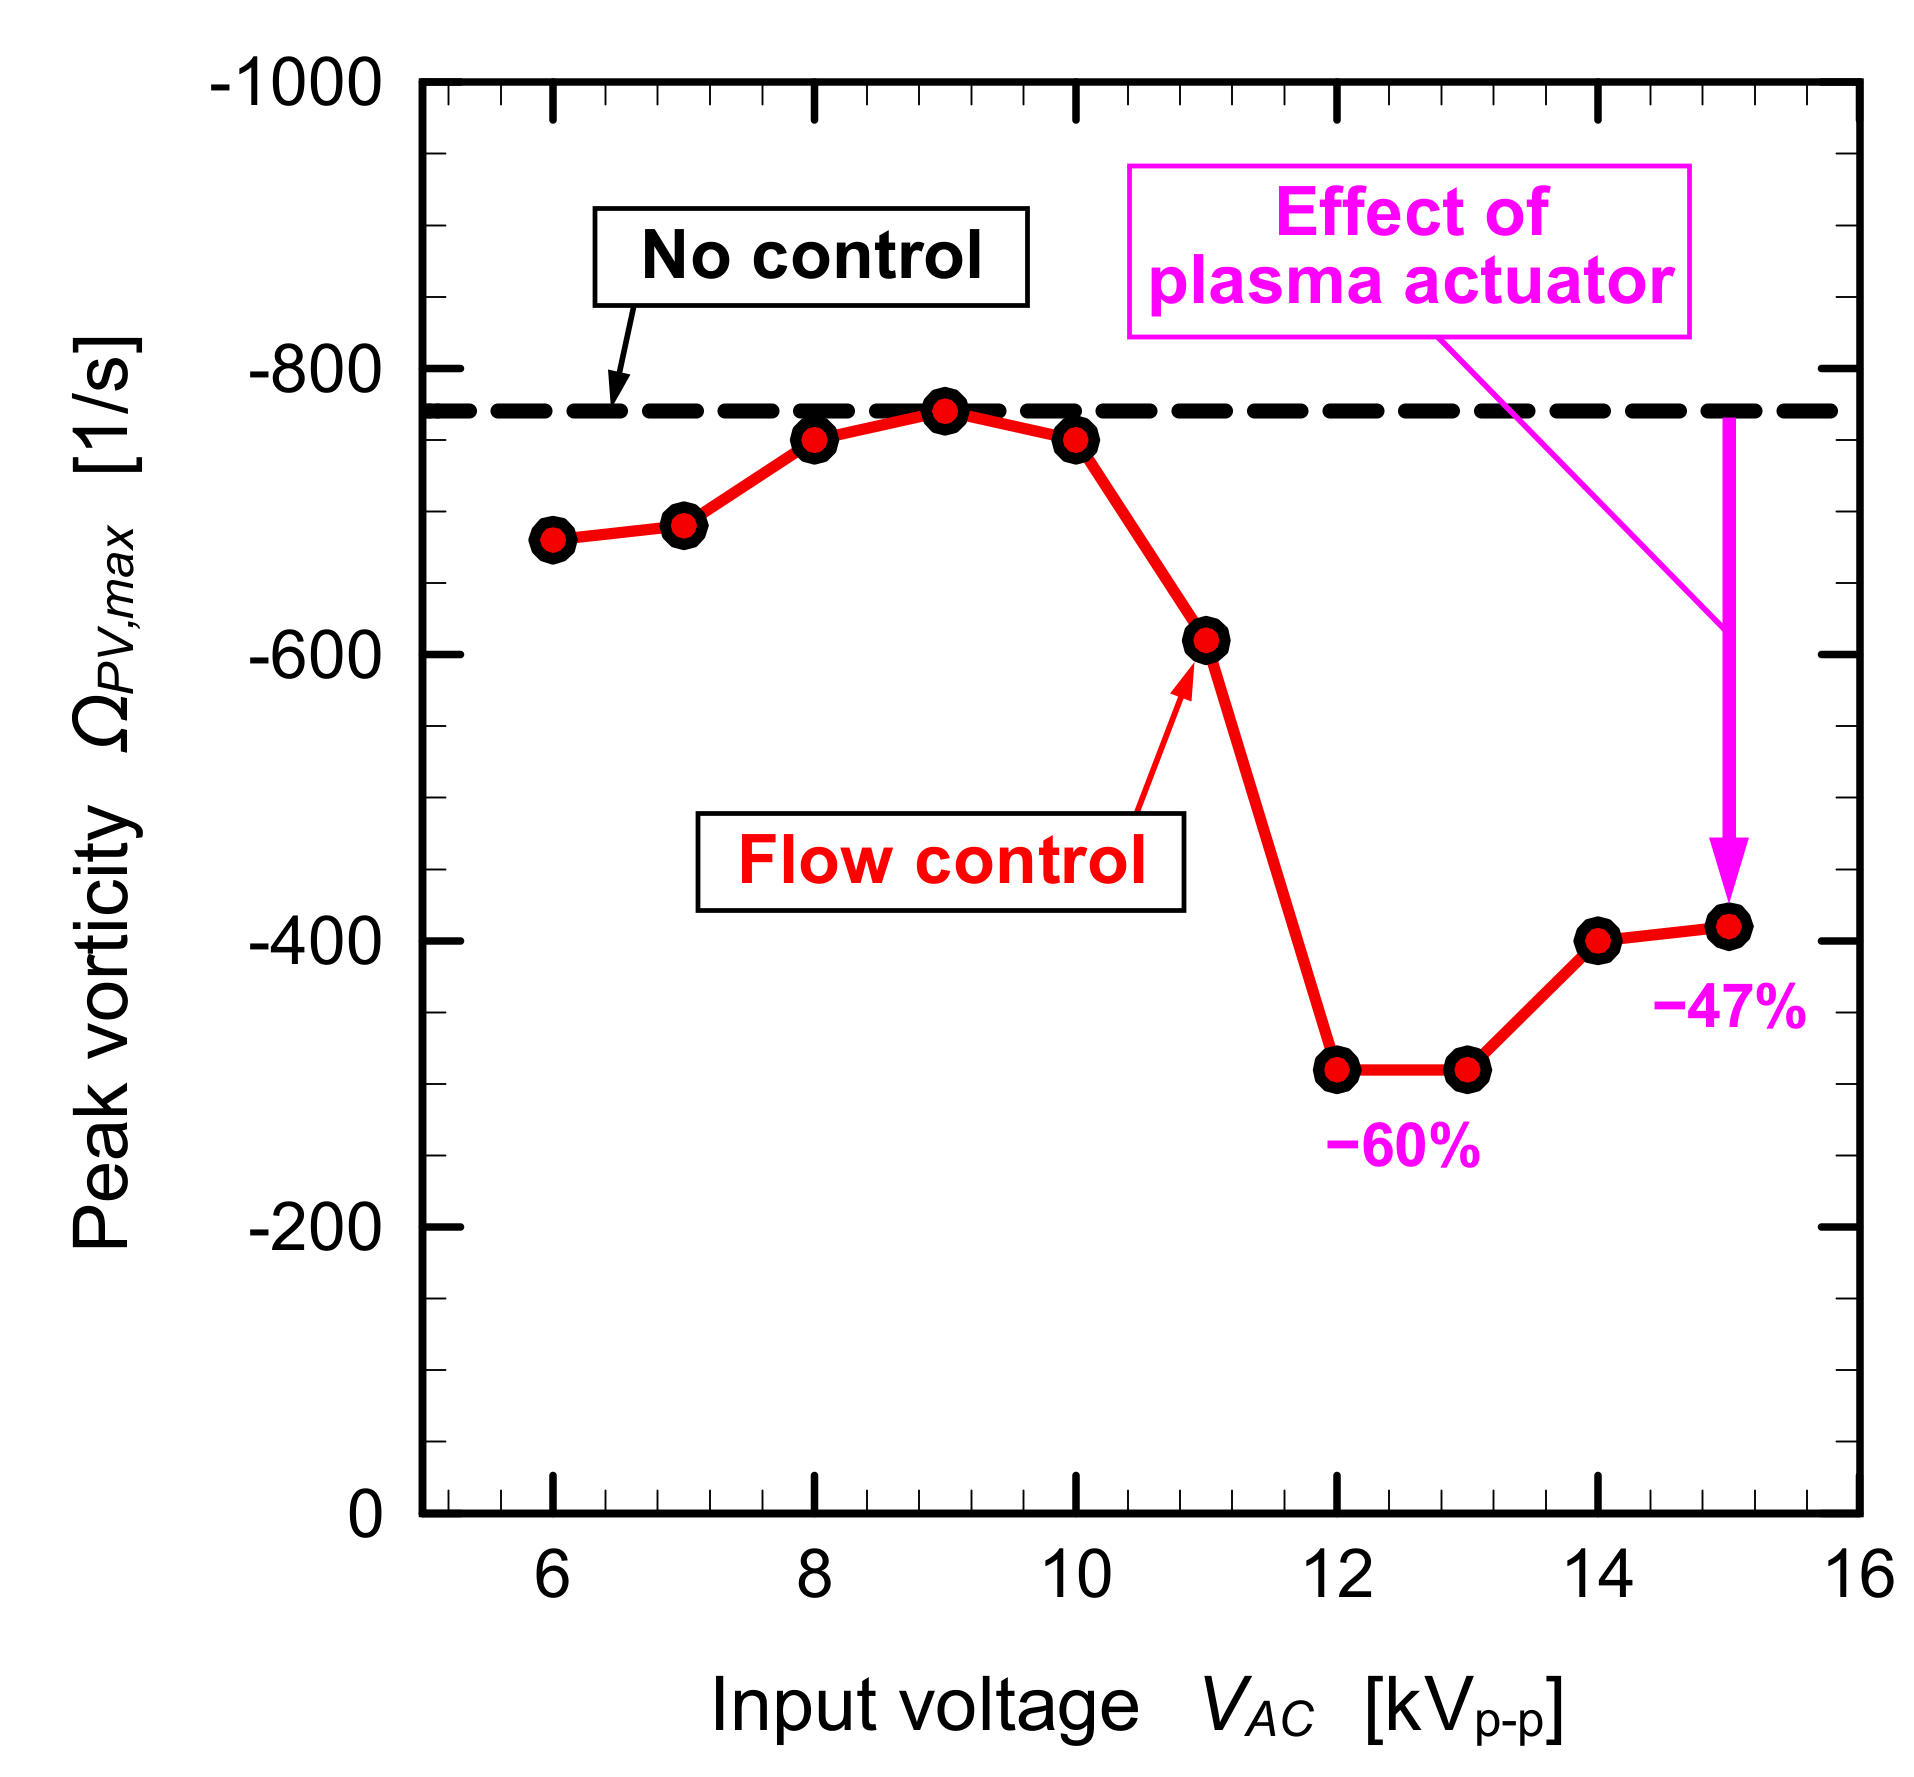
4.1. Measurements at Outlet Freestream Velocity of 2.4 m/s, Reout = 1.0 × 10⁴
Figure 10 shows the PIV measurement location at the outlet of the linear turbine cascade. The PIV domain is 42 mm × 30 mm (green area), which corresponds to the blade pitch of 2.3 and the blade span of 40%.
Figure 10.
Particle image velocimetry (PIV) measurement location.
Figure 11 shows the velocity distributions at the outlet of the linear turbine cascade at various input voltages at UFS,out = 2.4 m/s. As the velocity measurement by PIV is two-dimensional, the velocity component normal to the measurement plane (freestream direction) cannot be obtained; therefore, the velocity distributions in this figure show the velocity magnitude of the secondary flows. The velocity vectors were superimposed upon the velocity contours in these figures. In the condition of no control in Figure 11a, high velocity regions with strong secondary flow vectors, owing to the passage vortices, exist near the endwall and blade suction side (SS) after the trailing edge. The maximum velocity within the passage vortex in the center passage is 0.66. In the flow control conditions at the input voltage of VAC = 6 kVp-p, Figure 11b, the high velocity regions and secondary flow vectors of passage vortices are reduced and moved toward the blade suction surface side, by the active control of the plasma actuator. In Figure 11c–e, the high velocity regions with secondary flow vectors decrease gradually, as the input voltage increases from 7 kVp-p to 9 kVp-p. At the input voltage of 10 kVp-p, Figure 11f, the high velocity regions and secondary flow vectors are considerably reduced, indicating that the passage vortex becomes almost negligible. At the input voltage of 10 kVp-p, the ratio of the maximum velocity induced by the plasma actuator, UPA,max = 2.8 m/s, to the freestream velocity at the blade outlet, UFS,out = 2.4 m/s, is UPA,max/UFS,out = 1.17 (close to 1). At the input voltage of 11 kVp-p, Figure 11g, the value of the maximum velocity in the center passage becomes a minimum of 0.3, however, newly induced downward flows (the peak velocity is 0.28) are observed at the blade pressure side (PS) after the trailing edge, which is caused by excessive induced flow by the plasma actuator. As the input voltage increases from 12 kVp-p to 15 kVp-p, Figure 11h–k, the downward flows near the pressure side mid-passages increase in size and strength.
Figure 11.
Velocity distributions at the outlet of the linear turbine cascade at various input voltages (UFS,out = 2.4 m/s).
Figure 12 shows peak velocity values of the passage vortex from the center passage in Figure 1. The peak value in the no control condition is 0.66 (the black dashed line). The peak value in the flow control conditions (the red solid line) is gradually reduced as the input voltage increases from 6 kVp-p to 11 kVp-p (0.30), followed by remaining almost constant at the input voltage from 11 kVp-p to 15 kVp-p. The ratio of the peak velocity reduction is 55%, going from 0.66 to 0.30.
Figure 12.
Peak velocity of passage vortex in center passage (UFS,out = 2.4 m/s).
Figure 13 shows the turbulence intensity distributions at the outlet of the linear turbine cascade at various input voltages, where UFS,out = 2.4 m/s. In Figure 13a, the no control condition, the maximum value of the turbulence intensity is 13% at the center of the passage vortex. Meanwhile, the minimum turbulence intensity in the outer area of the passage vortex is as low as 2%. The results indicate that the passage vortex is stable. In Figure 13b, in the condition of flow control at the input voltage of VAC = 6 kVp-p, the outer area of the passage vortex has a high turbulence intensity region, which means that the passage vortex becomes unstable due to the induced flow by the plasma actuator. In Figure 13c, at the input voltage of 7 kVp-p, the peak value of the high turbulence intensity in the passage vortex becomes 19%, and another high turbulence intensity region is observed at the mid-passage (Y = 30 mm) of the blade suction side after the trailing edge, where the peak turbulence intensity value is 18%. The high turbulence intensity region is generated by the instability of the boundary layer on the blade suction side due to the disappearance of the passage vortex. As the input voltage increases from 8 kVp-p to 10 kVp-p, in Figure 13d–f, the area of high turbulence intensity of the passage vortex decreases; however, another area of high turbulence intensity near the blade suction side is increased and strengthened (the peak value is 20%). At the higher input voltages, ranging from 11 kVp-p to 15 kVp-p, in Figure 13g–k, a new high turbulence intensity area is gradually spread in the downward flow near the blade pressure surface, with the maximum value of turbulence intensity of 13%.
Figure 13.
Turbulence intensity distributions at the outlet of the linear turbine cascade at various input voltages (UFS,out = 2.4 m/s).
Figure 14 shows the vorticity distributions at the outlet of the linear turbine cascade at the various input voltages, at UFS,out = 2.4 m/s. In the no control condition in Figure 14a, negative vorticity (clockwise rotation) regions are generated due to the passage vortices. The peak value of the vorticity at the center of the passage vortex in the center passage is −1200 [1/s]. In the flow control conditions, at input voltages ranging from 6 kVp-p to 10 kVp-p, in Figure 14b–f, the peak vorticity of the passage vortex is gradually reduced to −500 [1/s] at VAC = 10 kVp-p. At the input voltages of 11 kVp-p, in Figure 14g, a new positive vorticity region area (the peak value of 330 [1/s]) is generated in the downward flow near the blade pressure surface. At the higher input voltages ranging from 12 kVp-p to 15 kVp-p, in Figure 14h–k, the positive vorticity region is gradually spread to the midspan direction.
Figure 14.
Vorticity distributions at the outlet of the linear turbine cascade at various input voltages (UFS,out = 2.4 m/s).
Figure 15 shows the values of the peak vorticity of the passage vortex in the center passage from Figure 14. The peak value in the no control condition is −1310 [1/s] (the black dashed line). The peak value with flow control conditions (the red solid line) is gradually reduced as the input voltage increases from 6 kVp-p to 9 kVp-p (−530 [1/s]), then it remains almost constant at the input voltage ranging from 11 kVp-p to 15 kVp-p. The ratio of the minimum value of the peak vorticity is −340 [1/s] at VAC = 15 kVp-p, which is a 74% reduction in comparison to the no control condition.
Figure 15.
Peak vorticity of passage vortex in center passage (UFS,out = 2.4 m/s).
4.2. Measurements at Outlet Freestream Velocity of 4.7 m/s, Reout = 1.9 × 10⁴
Figure 16 shows the velocity distributions at the outlet of the linear turbine cascade at various input voltages, at an increased freestream velocity of UFS,out = 4.7 m/s. In the no control condition in Figure 16a, high velocity regions with strong secondary flow vectors, due to the passage vortices, exist near the endwall and blade suction side (SS) after the trailing edge. The maximum normalized velocity in the center passage is 0.38, which is smaller than that at UFS,out = 2.4 m/s (0.66). The reduction of the maximum normalized velocity is due to the reduction in strength of the passage vortex, or viscous effect, associated with the increased Reynolds number related to the increase in the freestream velocity. In the flow control conditions, at the input voltage of 6 kVp-p in Figure 16b, the high velocity regions and secondary flow vectors of passage vortices are slightly reduced by the plasma actuator. In Figure 16c, at VAC = 7 kVp-p, the high velocity regions in the right-side passage near the blade suction surface are divided into two peak areas. In Figure 16d,e, at VAC = 8 kVp-p and 9 kVp-p, the high velocity regions in the center passage move toward the endwall, and the high velocity regions in the right-side passage are divided into three areas. As the input voltage increases from 10 kVp-p to 15 kVp-p, in Figure 16f–k, the maximum velocity is gradually reduced from 0.42 at 10 kVp-p to 0.30 at 14 kVp-p. At the input voltage of 15 kVp-p, the ratio of the maximum velocity induced by the plasma actuator, UPA,max = 4.5 m/s, to the freestream velocity at the blade outlet, UFS,out = 4.7 m/s, is UPA,max/UFS,out = 0.96 (close to 1).
Figure 16.
Velocity distributions at the outlet of the linear turbine cascade at various input voltages (UFS,out = 4.7 m/s).
Figure 17 shows the values of the peak velocity of the passage vortex in the center passage from Figure 16. The value of the peak velocity in the no control condition is 0.38 (the black dashed line). By the flow control using the plasma actuator, the peak velocity is slightly increased from 0.36 at VAC = 6 kVp-p to 0.42 at VAC = 10 kVp-p, then the peak is gradually decreased to 0.30 at VAC = 15 kVp-p (21% reduction).
Figure 17.
Peak velocity of passage vortex in center passage (UFS,out = 4.7 m/s).
Figure 18 shows the turbulence intensity distributions at the outlet of the linear turbine cascade at various input voltages, at UFS,out = 4.7 m/s. In Figure 18a, the no control condition, the maximum value of the turbulence intensity in the passage vortex is 16%. The result indicates that the passage vortex is more unstable than at a lower freestream velocity, UFS,out = 2.4 m/s. As the input voltage increases from 6 kVp-p to 9 kVp-p, in Figure 18b–e, although the maximum value of the high turbulence intensity region in the center passage is constant (16%), the high turbulence intensity region is slightly reduced. At the input voltages of 10 kVp-p and 11 kVp-p, in Figure 18f,g, the size and magnitude of the high turbulence intensity region are gradually reduced. Meanwhile, a new high turbulence intensity region (the peak value of 15%) is observed near the mid-span (Y = 30 mm) of the blade suction side. At the higher input voltages, ranging from 12 kVp-p to 15 kVp-p, in Figure 18h–k, the high turbulence intensity region of the passage vortex is weakened and the new high turbulence intensity region along the blade suction surface is widely spread, with the maximum value of 14% for the turbulence intensity.
Figure 18.
Turbulence intensity distributions at the outlet of the linear turbine cascade at various input voltages (UFS,out = 4.7 m/s).
Figure 19 shows the vorticity distributions at the outlet of the linear turbine cascade at various input voltages, at UFS,out = 4.7 m/s. In the no control condition, in Figure 19a, negative vorticity (clockwise rotation) regions are generated due to the passage vortices. The peak value of the vorticity at the center of the passage vortex in the center passage is −770 [1/s], which means that the magnitude of the passage vortex at UFS,out = 4.7 m/s is smaller than that at UFS,out = 2.4 m/s (−1310 [1/s]). The decrease in the vorticity magnitude indicates the reduction in strength of the passage vortex, associated with the increased Reynolds number. In the flow control conditions, at input voltages ranging from 6 kVp-p to 11 kVp-p, in Figure 19b–g, the peak of the vorticity of the passage vortex in the center passage is almost constant (−750 [1/s]); however, the position of the passage vortex moves closer to the endwall as the input voltages increases. At the higher input voltages, ranging from 12 kVp-p to 15 kVp-p, in Figure 19h–k, the peak value of the vorticity of the passage vortex is suddenly changed to −310 [1/s].
Figure 19.
Vorticity distributions at the outlet of the linear turbine cascade at various input voltages (UFS,out = 4.7 m/s).
Figure 20 shows the values of the peak vorticity of the passage vortex in the center passage from Figure 19. The peak value in the no control condition is −750 [1/s] (the black dashed line). The peak value with flow control conditions (the red solid line) is almost constant at the input voltages ranging from 6 kVp-p to 10 kVp-p (ranging from −680 [1/s] to −770 [1/s]). The peak vorticity is rapidly reduced at the input voltage of 11 kVp-p and 12 kVp-p. The ratio of the minimum value of the peak vorticity is −310 [1/s] at VAC = 12 kVp-p and 13 kVp-p, which is corresponding to a 60% reduction, as compared to the no control condition.
Figure 20.
Peak vorticity of passage vortex in center passage (UFS,out = 4.7 m/s).
4.3. Measurements at Higher Outlet Freestream Velocity from 9.4 m/s to 25.2 m/s, Reout = 3.7 × 10⁴–9.9 × 10⁴
Figure 21 shows the velocity distributions at the outlet of the linear turbine cascade at various input voltages with an increased freestream velocity ranging from UFS,out = 9.4 m/s to 25.2 m/s. The range of the corresponding Reynolds number is between Reout = 3.7 × 10⁴ and Reout = 9.9 × 10⁴. The velocity distributions in the no control condition are shown in the upper side, Figure 21a,c,e,g. The velocity distributions in the flow control condition at the input voltage of VAC = 15 kVp-p are shown in the lower side, Figure 21b,d,f,h.
Figure 21.
Velocity distributions at the outlet of the linear turbine cascade at various freestream velocities.
Figure 21a,b show the results at the freestream velocity of UFS,out = 9.4 m/s. Although the peak velocity of the passage vortex in the center passage near the endwall is the same value, 0.34, for both, no control and flow control at VAC = 15 kVp-p, the size of the high velocity region is reduced and moves closer to the endwall in the flow control condition, at VAC = 15 kVp-p.
Figure 21c,d show the results at the freestream velocity of UFS,out = 14.6 m/s. The peak velocity in the center passage near the endwall is slightly increased from 0.36 (no control) to 0.38 (VAC = 15 kVp-p). The size of the high velocity region is reduced and moves closer to the endwall in the VAC = 15 kVp-p condition.
Figure 21e,f show the results at the freestream velocity of UFS,out = 20.9 m/s. The peak velocity is same value, 0.36, for the no control and VAC = 15 kVp-p conditions, and the size of the high velocity region is slightly reduced in the VAC = 15 kVp-p condition.
Figure 21g,h show the results at the freestream velocity of UFS,out = 25.2 m/s. The peak velocity in the center passage near the endwall is slightly increased from 0.36 (no control) to 0.38 (VAC = 15 kVp-p). The size of the high velocity region is marginally reduced in the VAC = 15 kVp-p condition.
Figure 22 shows the values of the peak velocity of the passage vortex in the center passage at the freestream velocity from UFS,out = 2.4 m/s to 25.2 m/s in Figure 11, Figure 16, and Figure 21. The peak values in the no control condition are shown by the black square symbols. The peak values in the flow control condition at the input voltage of VAC = 15 kVp-p are shown by the red circle symbols. At the lower freestream velocity conditions, UFS,out = 2.4 m/s and UFS,out = 4.7 m/s, the peak velocity is reduced by flow control from the plasma actuator, whereas at higher freestream velocity conditions greater than UFS,out = 9.4 m/s, the peak values have no significant difference and remain almost constant (0.34–0.38).
Figure 22.
Peak velocity of passage vortex in center passage at various freestream velocities.
Figure 23 shows the turbulence intensity distributions at the outlet of the linear turbine cascade at various input voltages at an increased freestream velocity ranging from UFS,out = 9.4 m/s (Reout = 3.7 × 10⁴) to 25.2 m/s (Reout = 9.9 × 10⁴). The turbulence intensity distributions in the no control condition are shown in Figure 23a,c,e,g. The turbulence intensity distributions in the flow control condition at the input voltage of VAC = 15 kVp-p are shown in Figure 23b,d,f,h. At all freestream velocities, the high turbulence intensity region spreads on the suction side of the trailing edge. The peak value of the high turbulence intensity is mostly 12%. The high turbulence intensity region is slightly reduced and moves closer to the endwall in the flow control condition at VAC = 15 kVp-p.
Figure 23.
Turbulence intensity distributions at the outlet of the linear turbine cascade at various freestream velocities.
Figure 24 shows the vorticity distributions at the outlet of the linear turbine cascade at various input voltages at an increased freestream velocity ranging from UFS,out = 9.4 m/s (Reout = 3.7 × 10⁴) to 25.2 m/s (Reout = 9.9 × 10⁴). The vorticity distributions in the no control condition are shown in Figure 24a,c,e,g. The vorticity distributions in the flow control condition at the input voltage of VAC = 15 kVp-p are shown in Figure 24b,d,f,h.
Figure 24.
Vorticity distributions at the outlet of the linear turbine cascade at various freestream velocities.
Figure 24a,b show the results at the freestream velocity of UFS,out = 9.4 m/s. The peak vorticity of the passage vortex in the center passage in the no control condition is −1140 [1/s], while that in the flow control at the VAC = 15 kVp-p condition is changed to −760 [1/s]. The size of the high vorticity region is reduced and moves closer to the endwall in the flow control condition at VAC = 15 kVp-p.
Figure 24c,d show the results at the freestream velocity of UFS,out = 14.6 m/s. The peak vorticity in the center passage near the endwall changes from −1850 [1/s] at the no control condition, to −1500 [1/s], at the flow control condition of VAC = 15 kVp-p. The high velocity region is slightly reduced and moves closer to the endwall in the VAC = 15 kVp-p condition.
Figure 24e,f show the results at the freestream velocity of UFS,out = 20.9 m/s. The peak vorticity in the center passage near the endwall changes from −2860 [1/s], at the no control condition, to −2510 [1/s], at the flow control condition of VAC = 15 kVp-p. The size of the high velocity region is also decreased by the plasma actuator operation.
Figure 24g,h show the results at the freestream velocity of UFS,out = 25.2 m/s. The peak vorticity in the center passage near the endwall changes from −4520 [1/s], at the no control condition, and to −3740 [1/s], at the flow control condition of VAC = 15 kVp-p.
Figure 25 summarizes the values of the peak vorticity of the passage vortex in the center passage at the freestream velocity, ranging from UFS,out = 2.4 m/s to 25.2 m/s in Figure 12, Figure 17 and Figure 22. The peak values in the no control condition are shown by the black square symbols. The peak values in the flow control condition at the input voltage of VAC = 15 kVp-p are shown by the red circle symbols. At all freestream velocity conditions, the magnitude of the peak vorticity is reduced. Even at the highest freestream velocity condition of UFS,out = 25.4 m/s, the peak vorticity changes about 17% by the plasma actuator operation at VAC = 15 kVp-p (UPA,max/UFS,out = 0.18).
Figure 25.
Peak vorticity of passage vortex in center passage at various freestream velocities.
The peak vorticity in the center passage at various freestream velocities in Figure 25 indicates that the plasma actuator is more effective for a lower outlet freestream velocity. The peak vorticity of the passage vortex at UFS,out = 2.4 m/s decreases by 74% due to the plasma actuator operation, while the reduction ratio gradually decreased as the outlet freestream velocity increased. A similar tendency, that is, an increased freestream velocity effect, was observed in the experimental and numerical studies regarding the active flow control of the separated flow on the blade suction surface of a low pressure turbine by a DBD plasma actuator [33,34]. In these studies, the flow separation completely disappeared at the lower freestream velocity of 1.5 m/s, while the flow separation was slightly reduced at the higher freestream velocity of 3.0 m/s. In general, the plasma actuator is less effective as the freestream velocity is increased. This occurs because the ratio of the wall jet velocity induced by the plasma actuator into the freestream velocity decreases when the freestream velocity (and Reynolds number) is increased [34]. Therefore, this result requires an improvement of the DBD plasma actuator system, including an increased input voltage excitation, as well as changes of the plasma actuator shape and setting location, for the active flow control of the passage vortex in higher freestream velocity conditions of actual industrial turbines.
5. Conclusions
Active flow control using a DBD plasma actuator was experimentally investigated as a potential technique for passage vortex reduction in a linear turbine cascade. The plasma actuator was installed on the endwall at 10 mm upstream from the leading edge of the turbine cascade. In order to drive the plasma actuator, a sinusoidal excitation with an input peak-to-peak voltage varying from VAC = 6 kVp-p to 15 kVp-p under the fixed frequency of 10 kHz was applied. The plasma actuator induced tangential jets with the maximum velocity ranging from UPA,max = 0.6 m/s to 4.5 m/s. The freestream velocity at the outlet of the turbine cascade was set to range from UFS,out = 2.4 m/s to 25.2 m/s, which corresponded to the Reynolds number based on the blade chord length and outlet freestream velocity, ranging from Reout = 1.0 × 10⁴ to 9.9 × 10⁴. PIV was used to measure the two-dimensional velocity, turbulence intensity, and vorticity fields at the outlet of the turbine cascade.
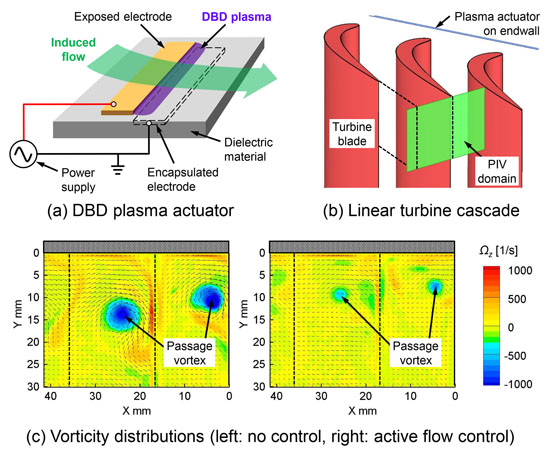
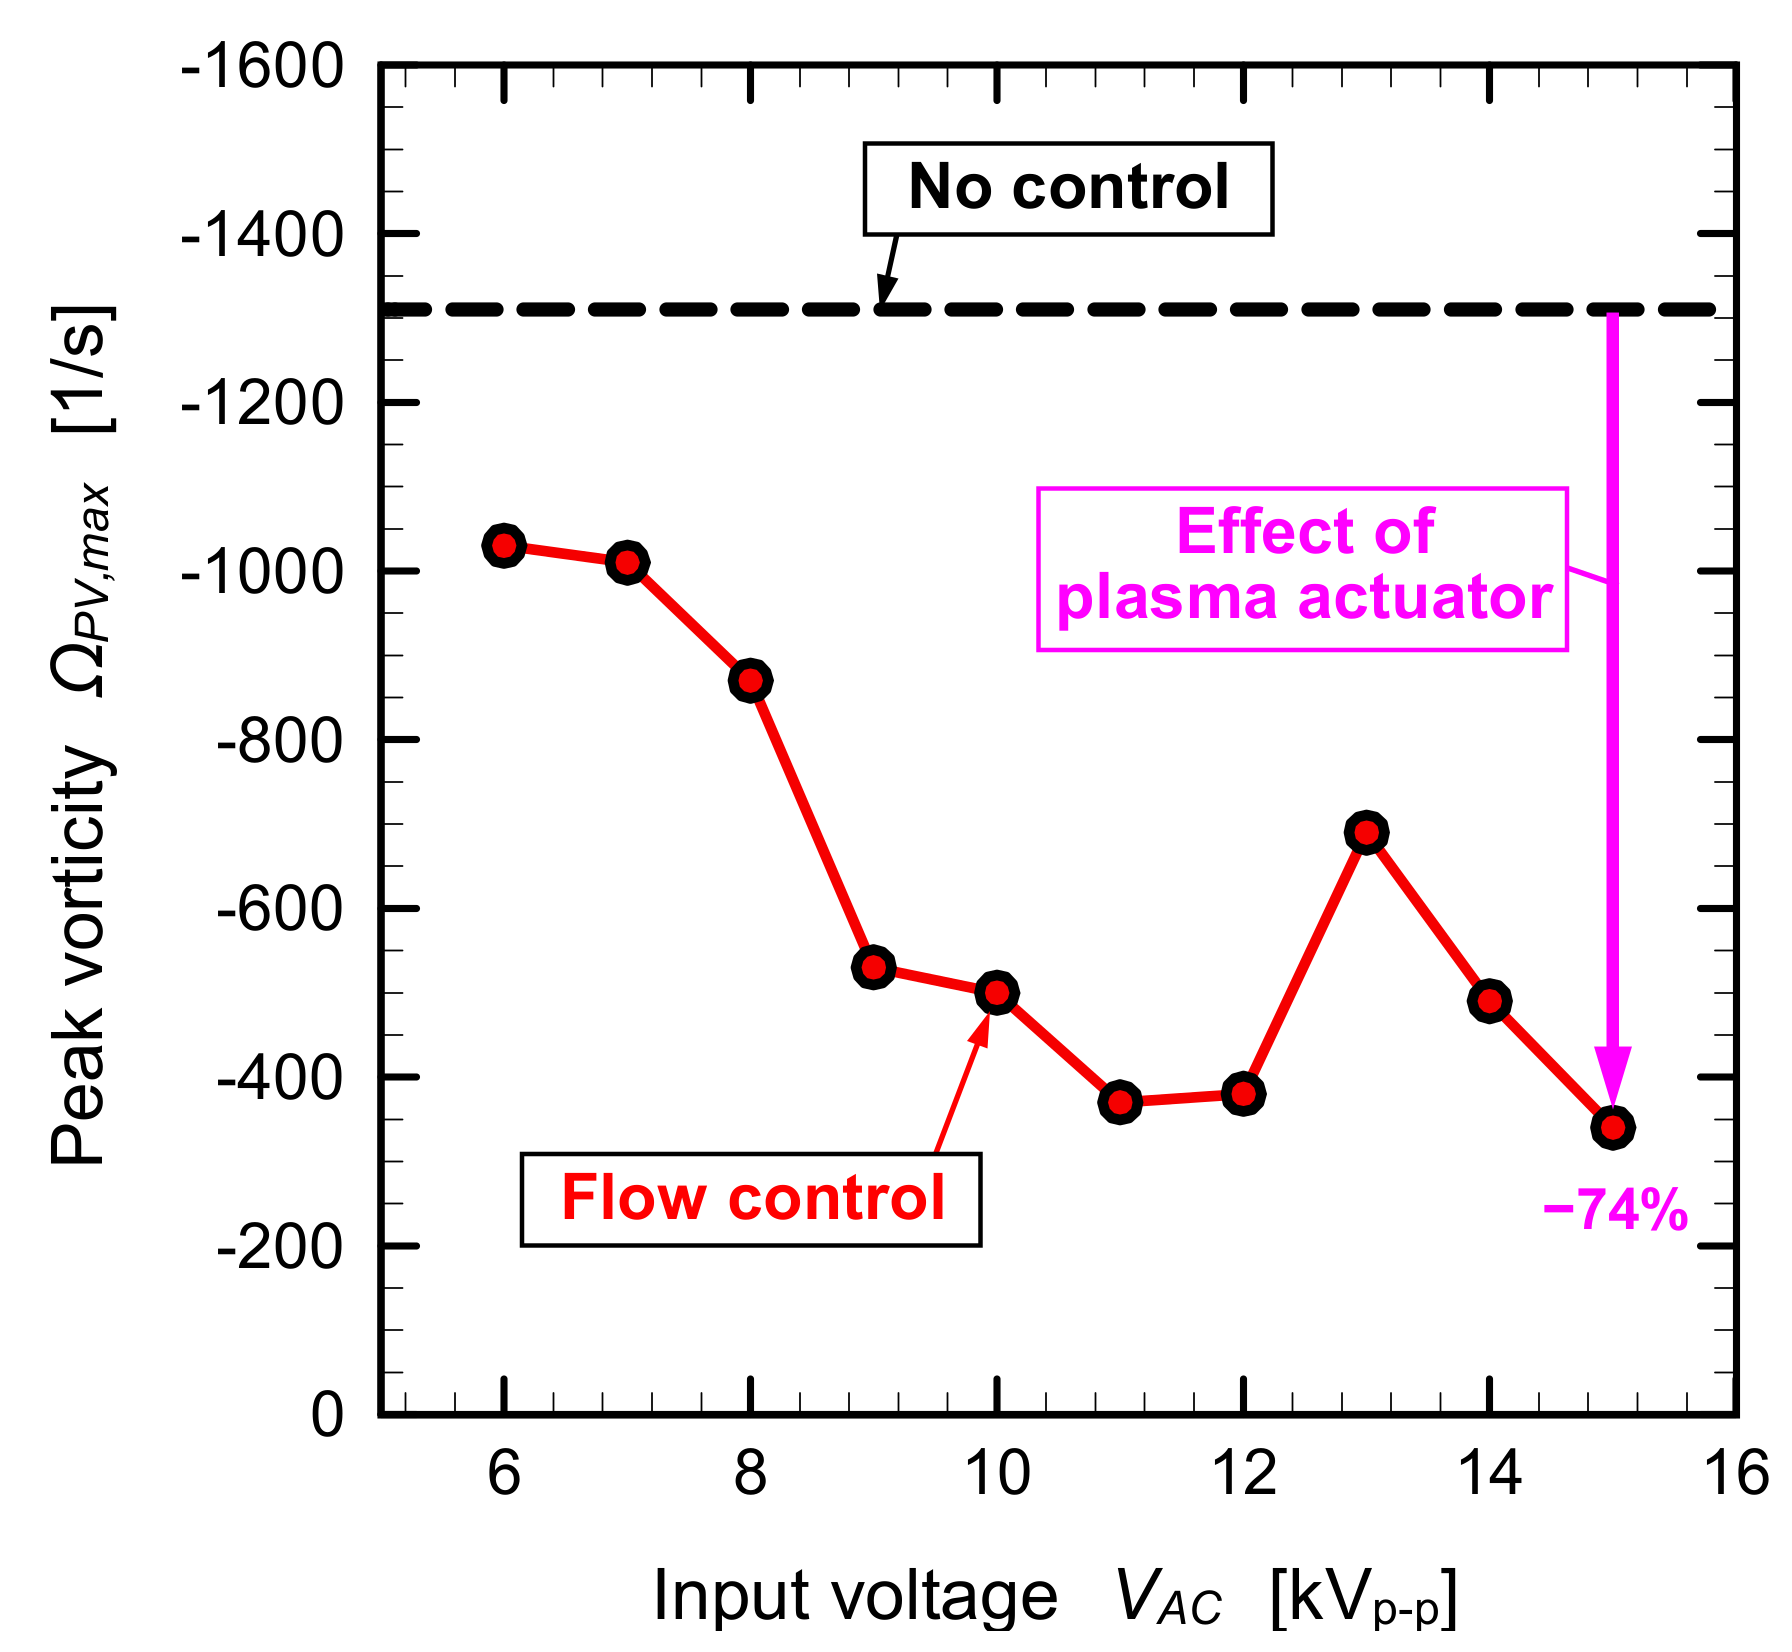
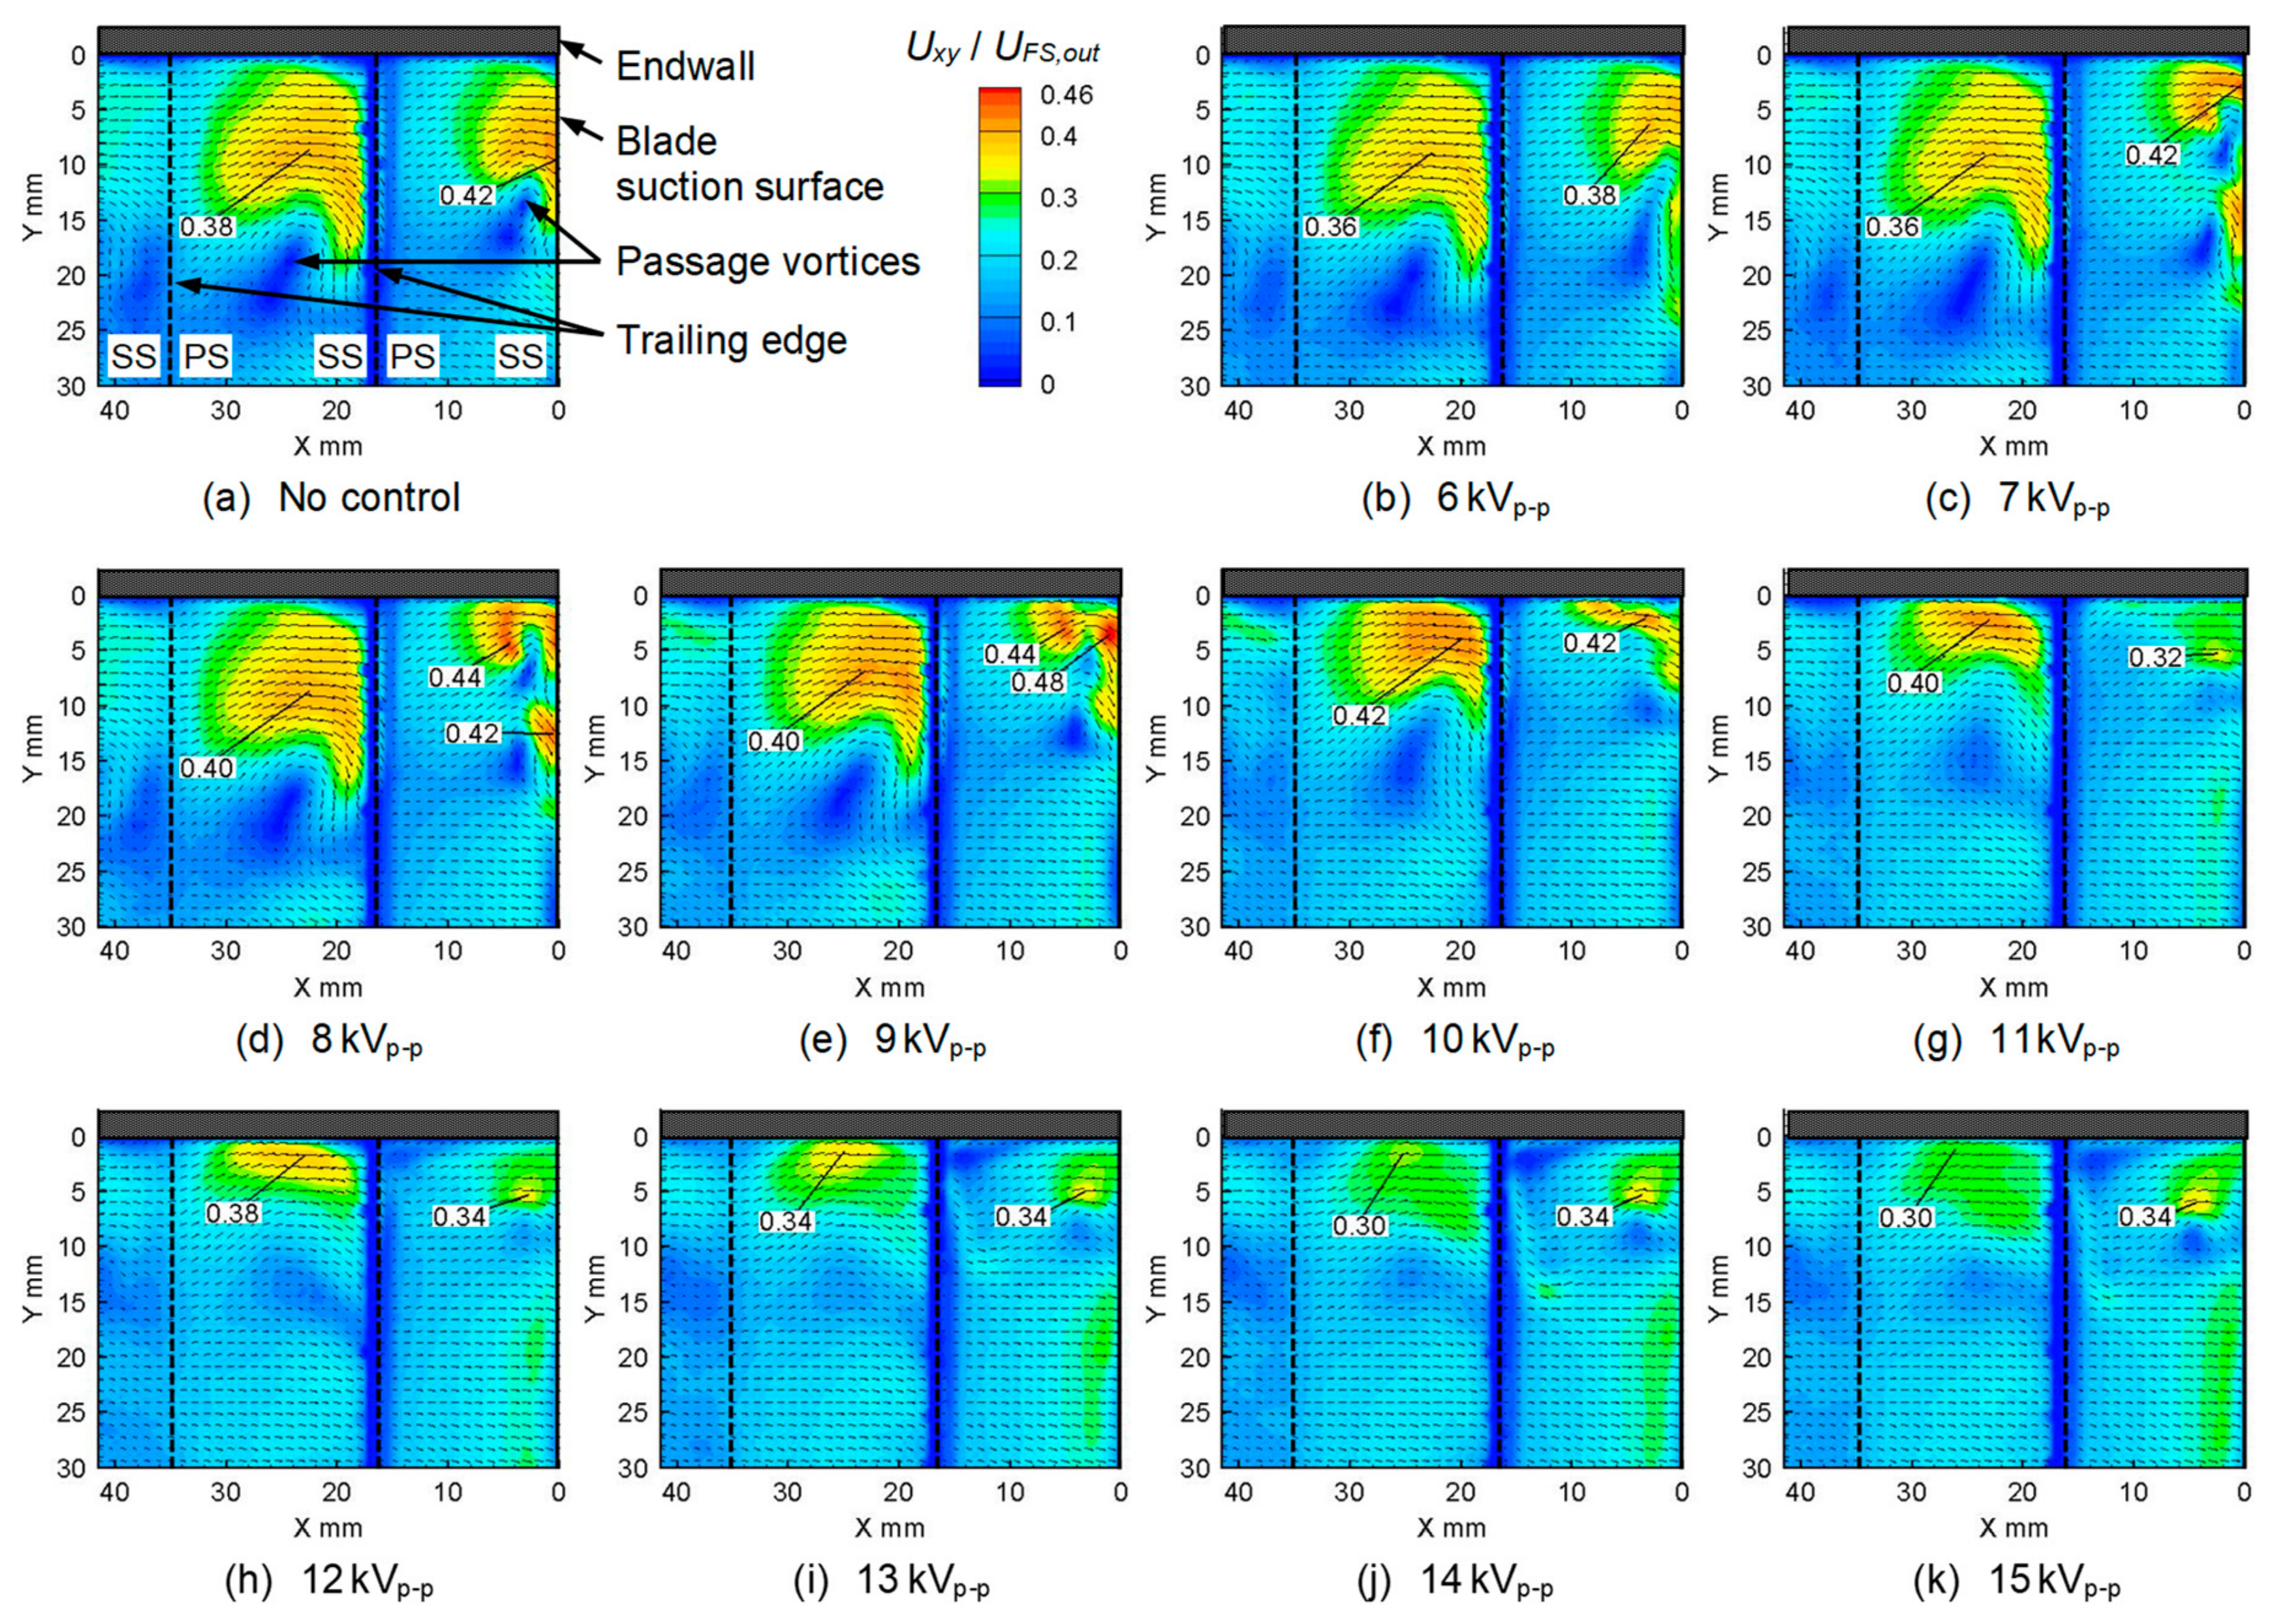
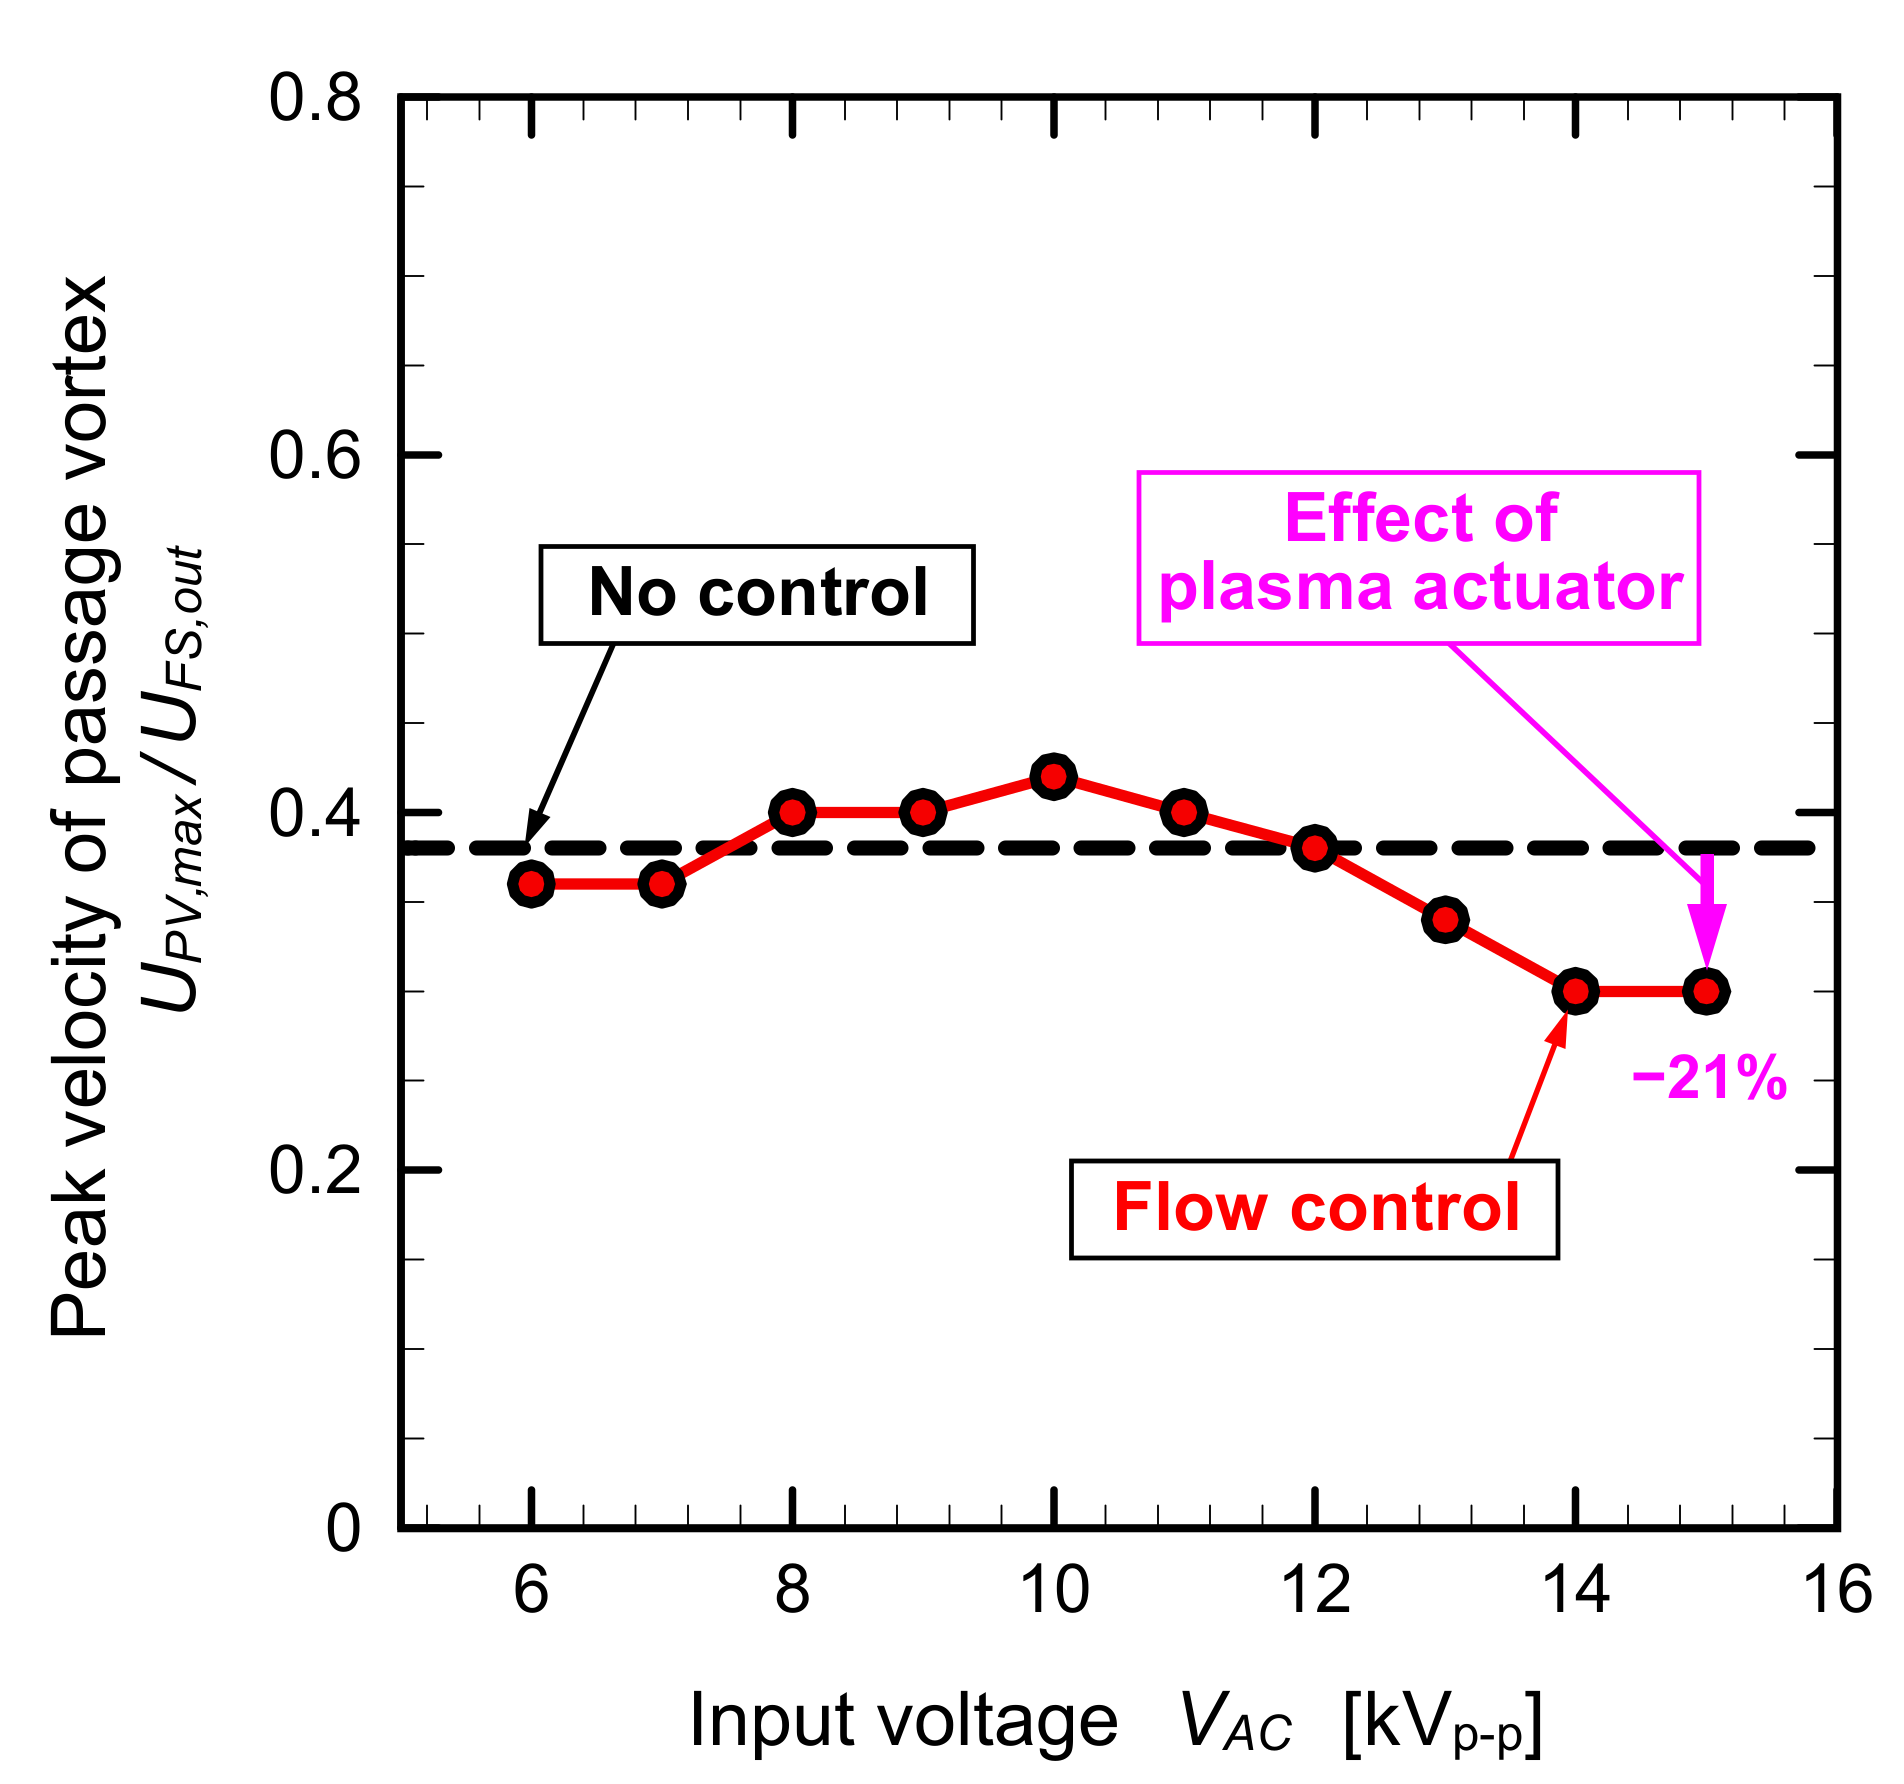
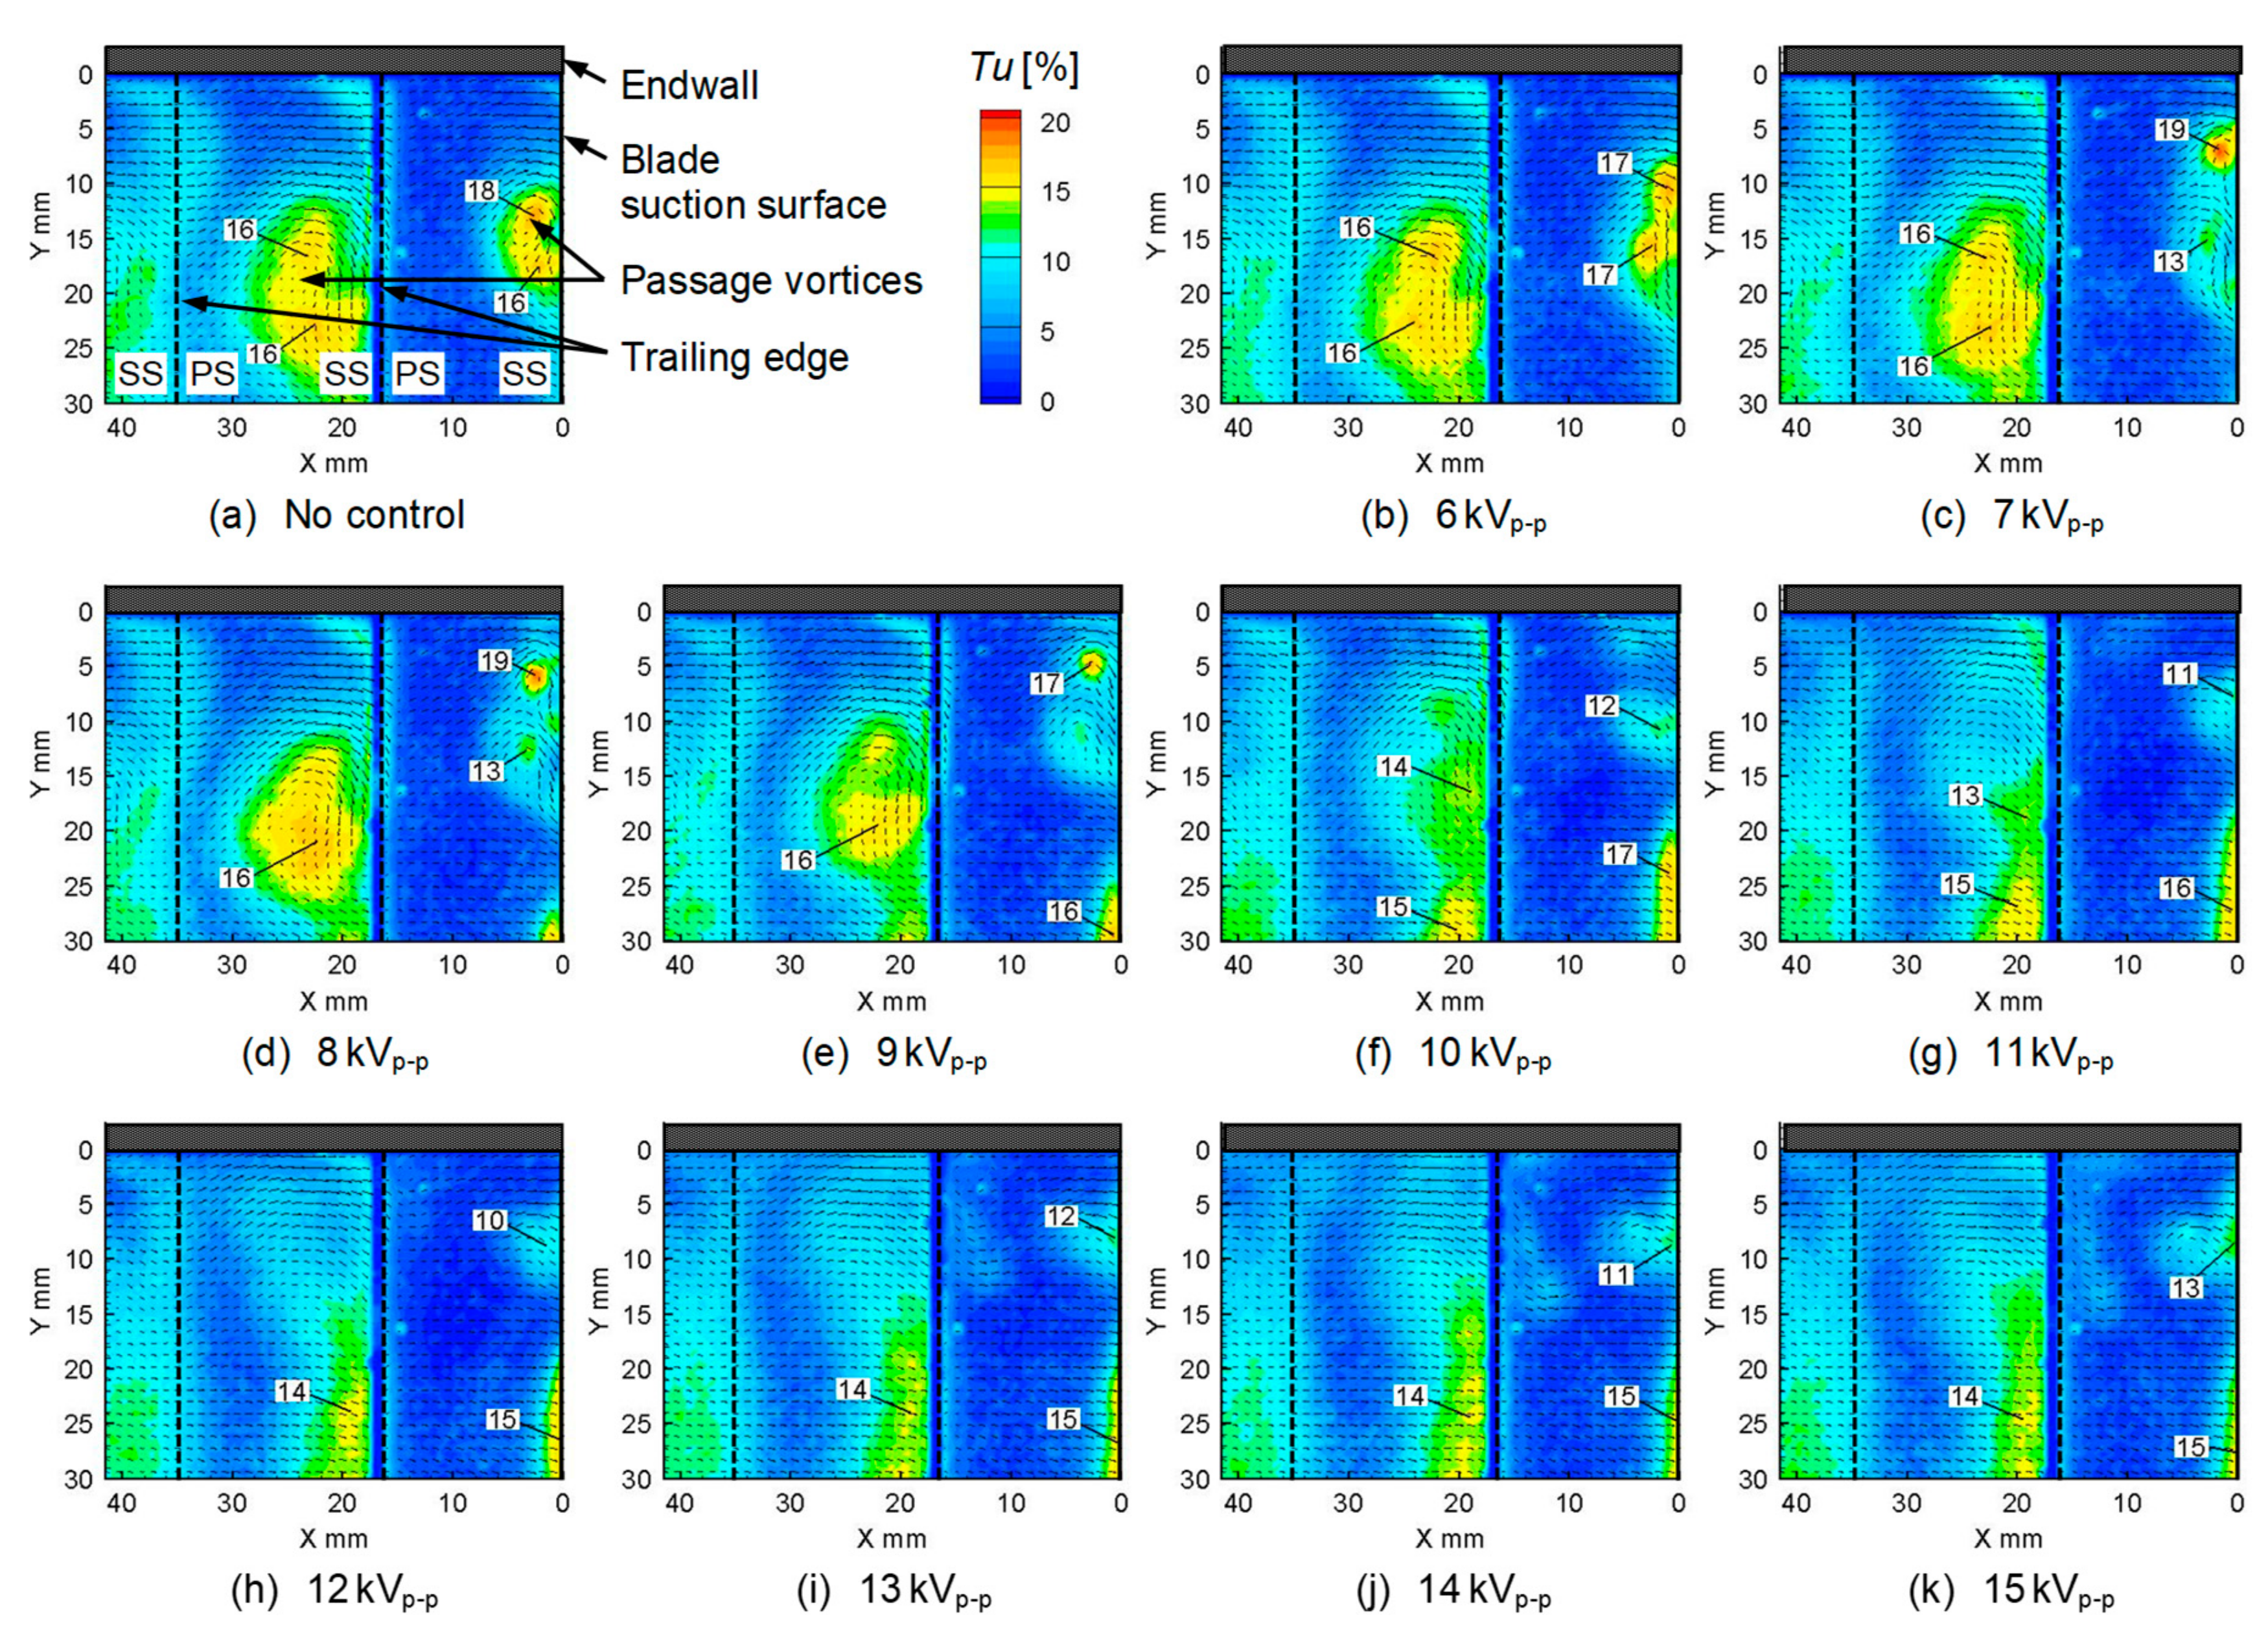
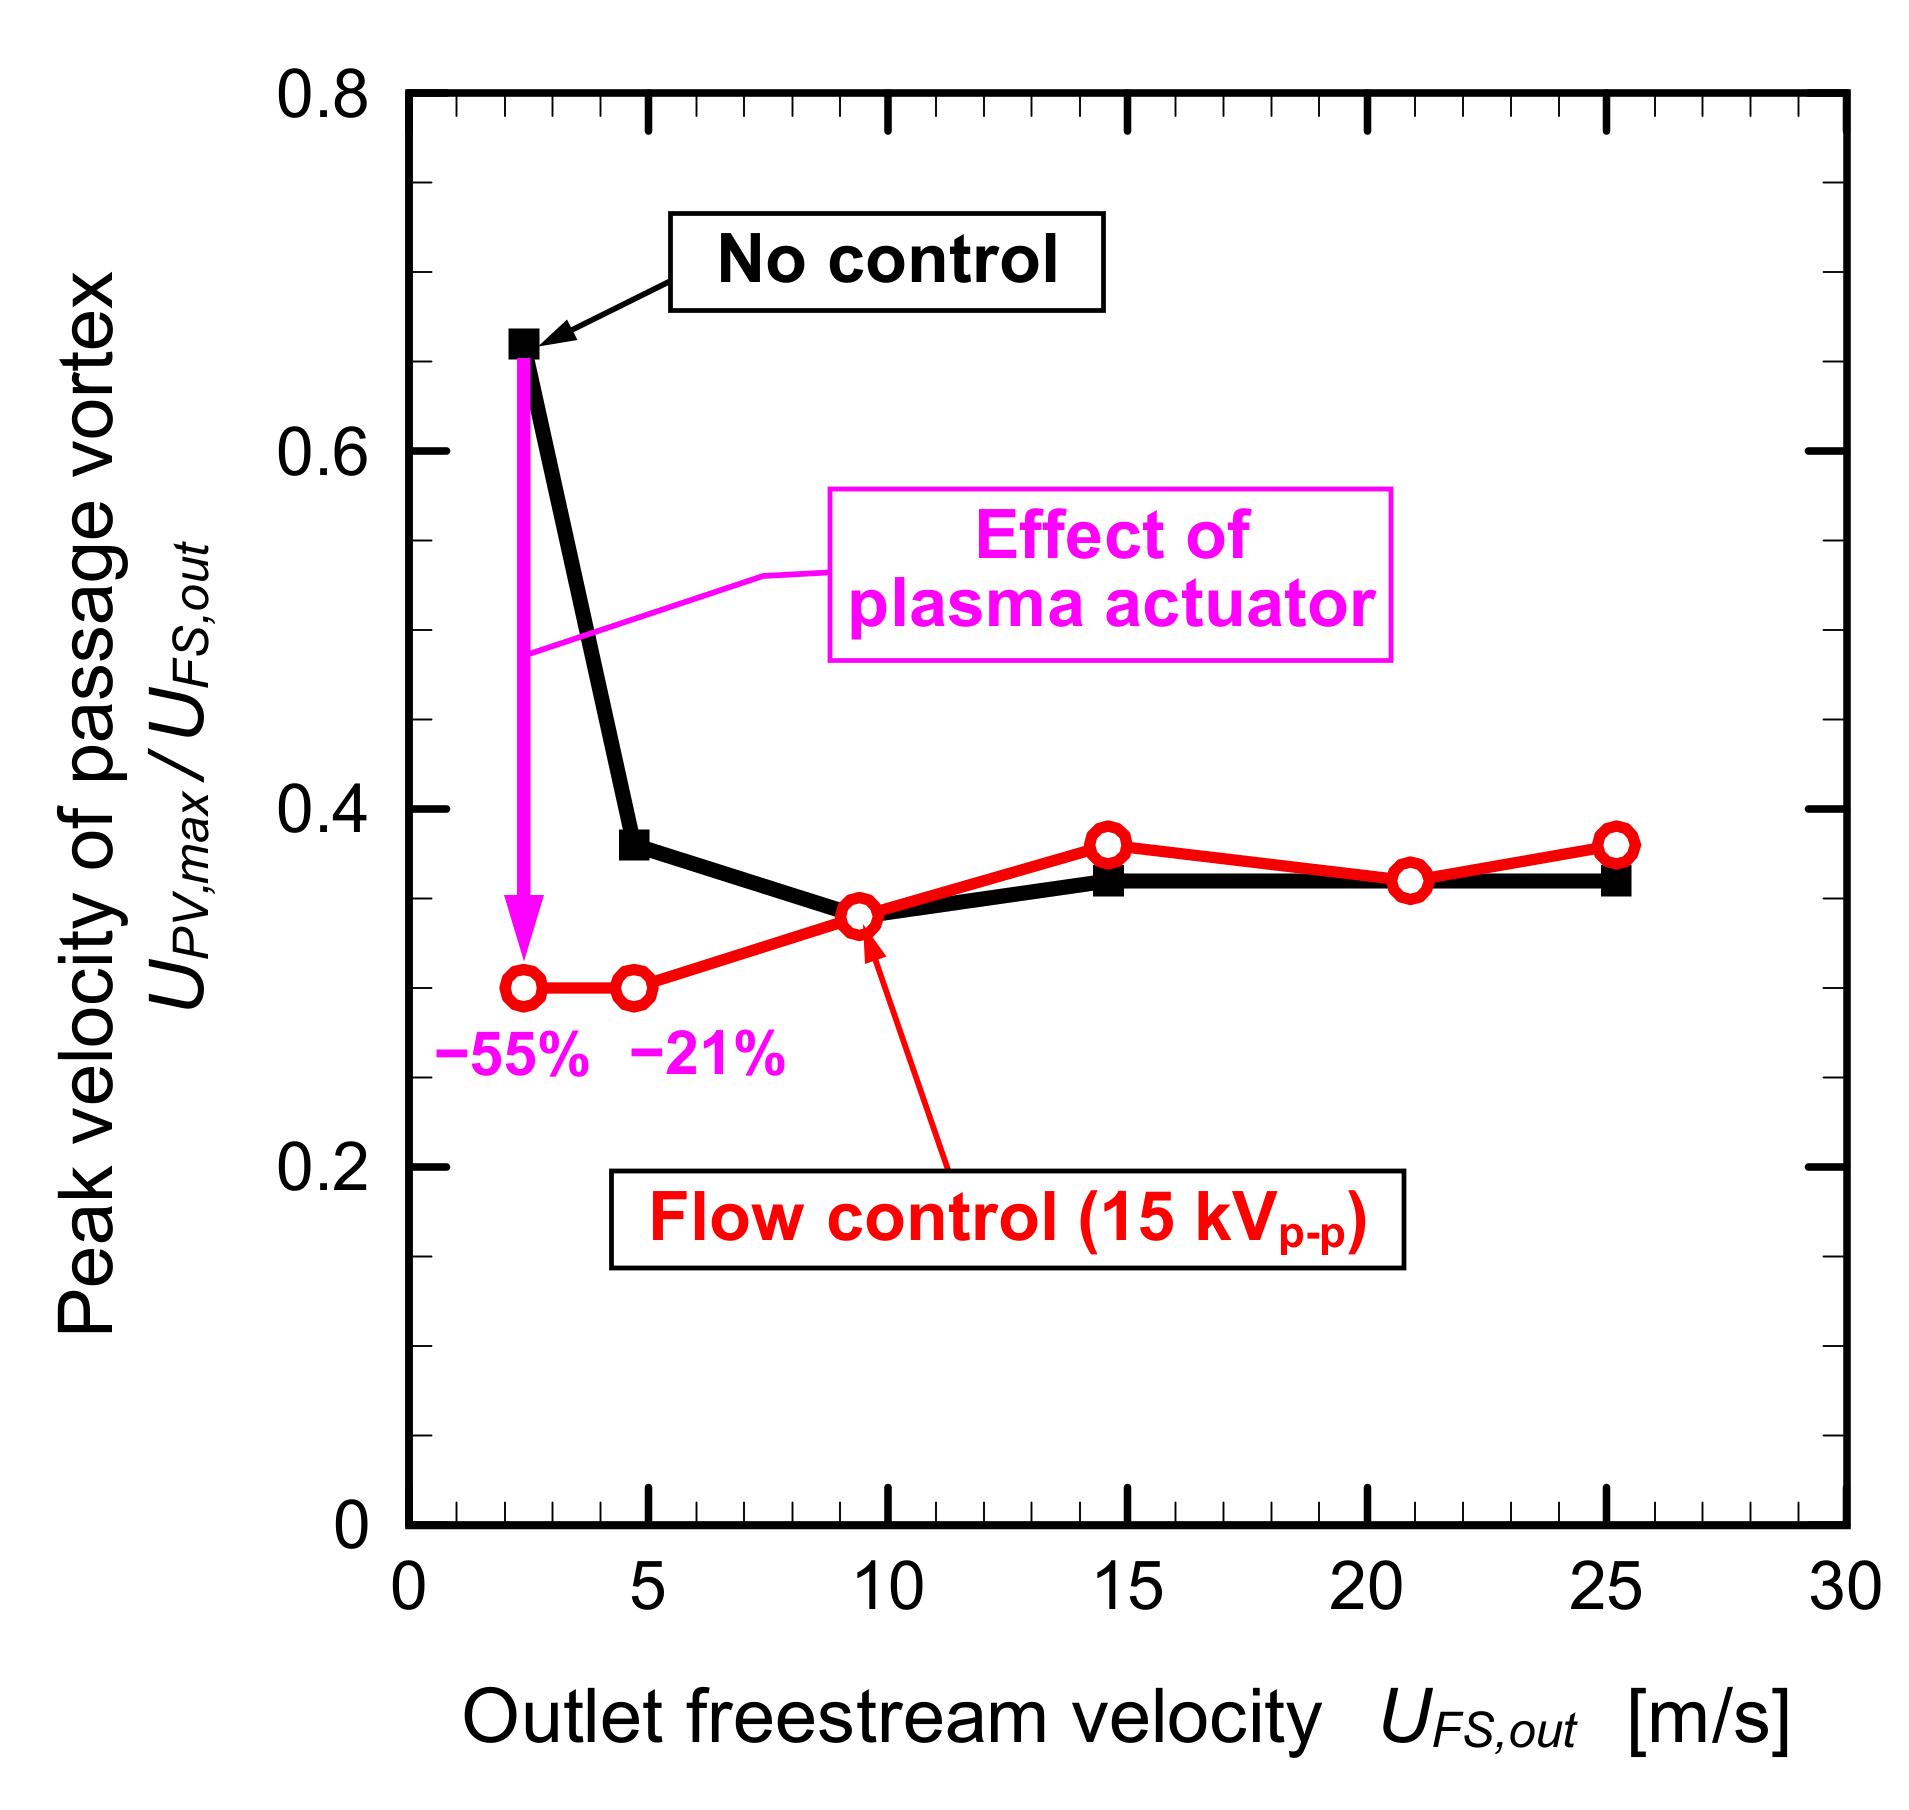
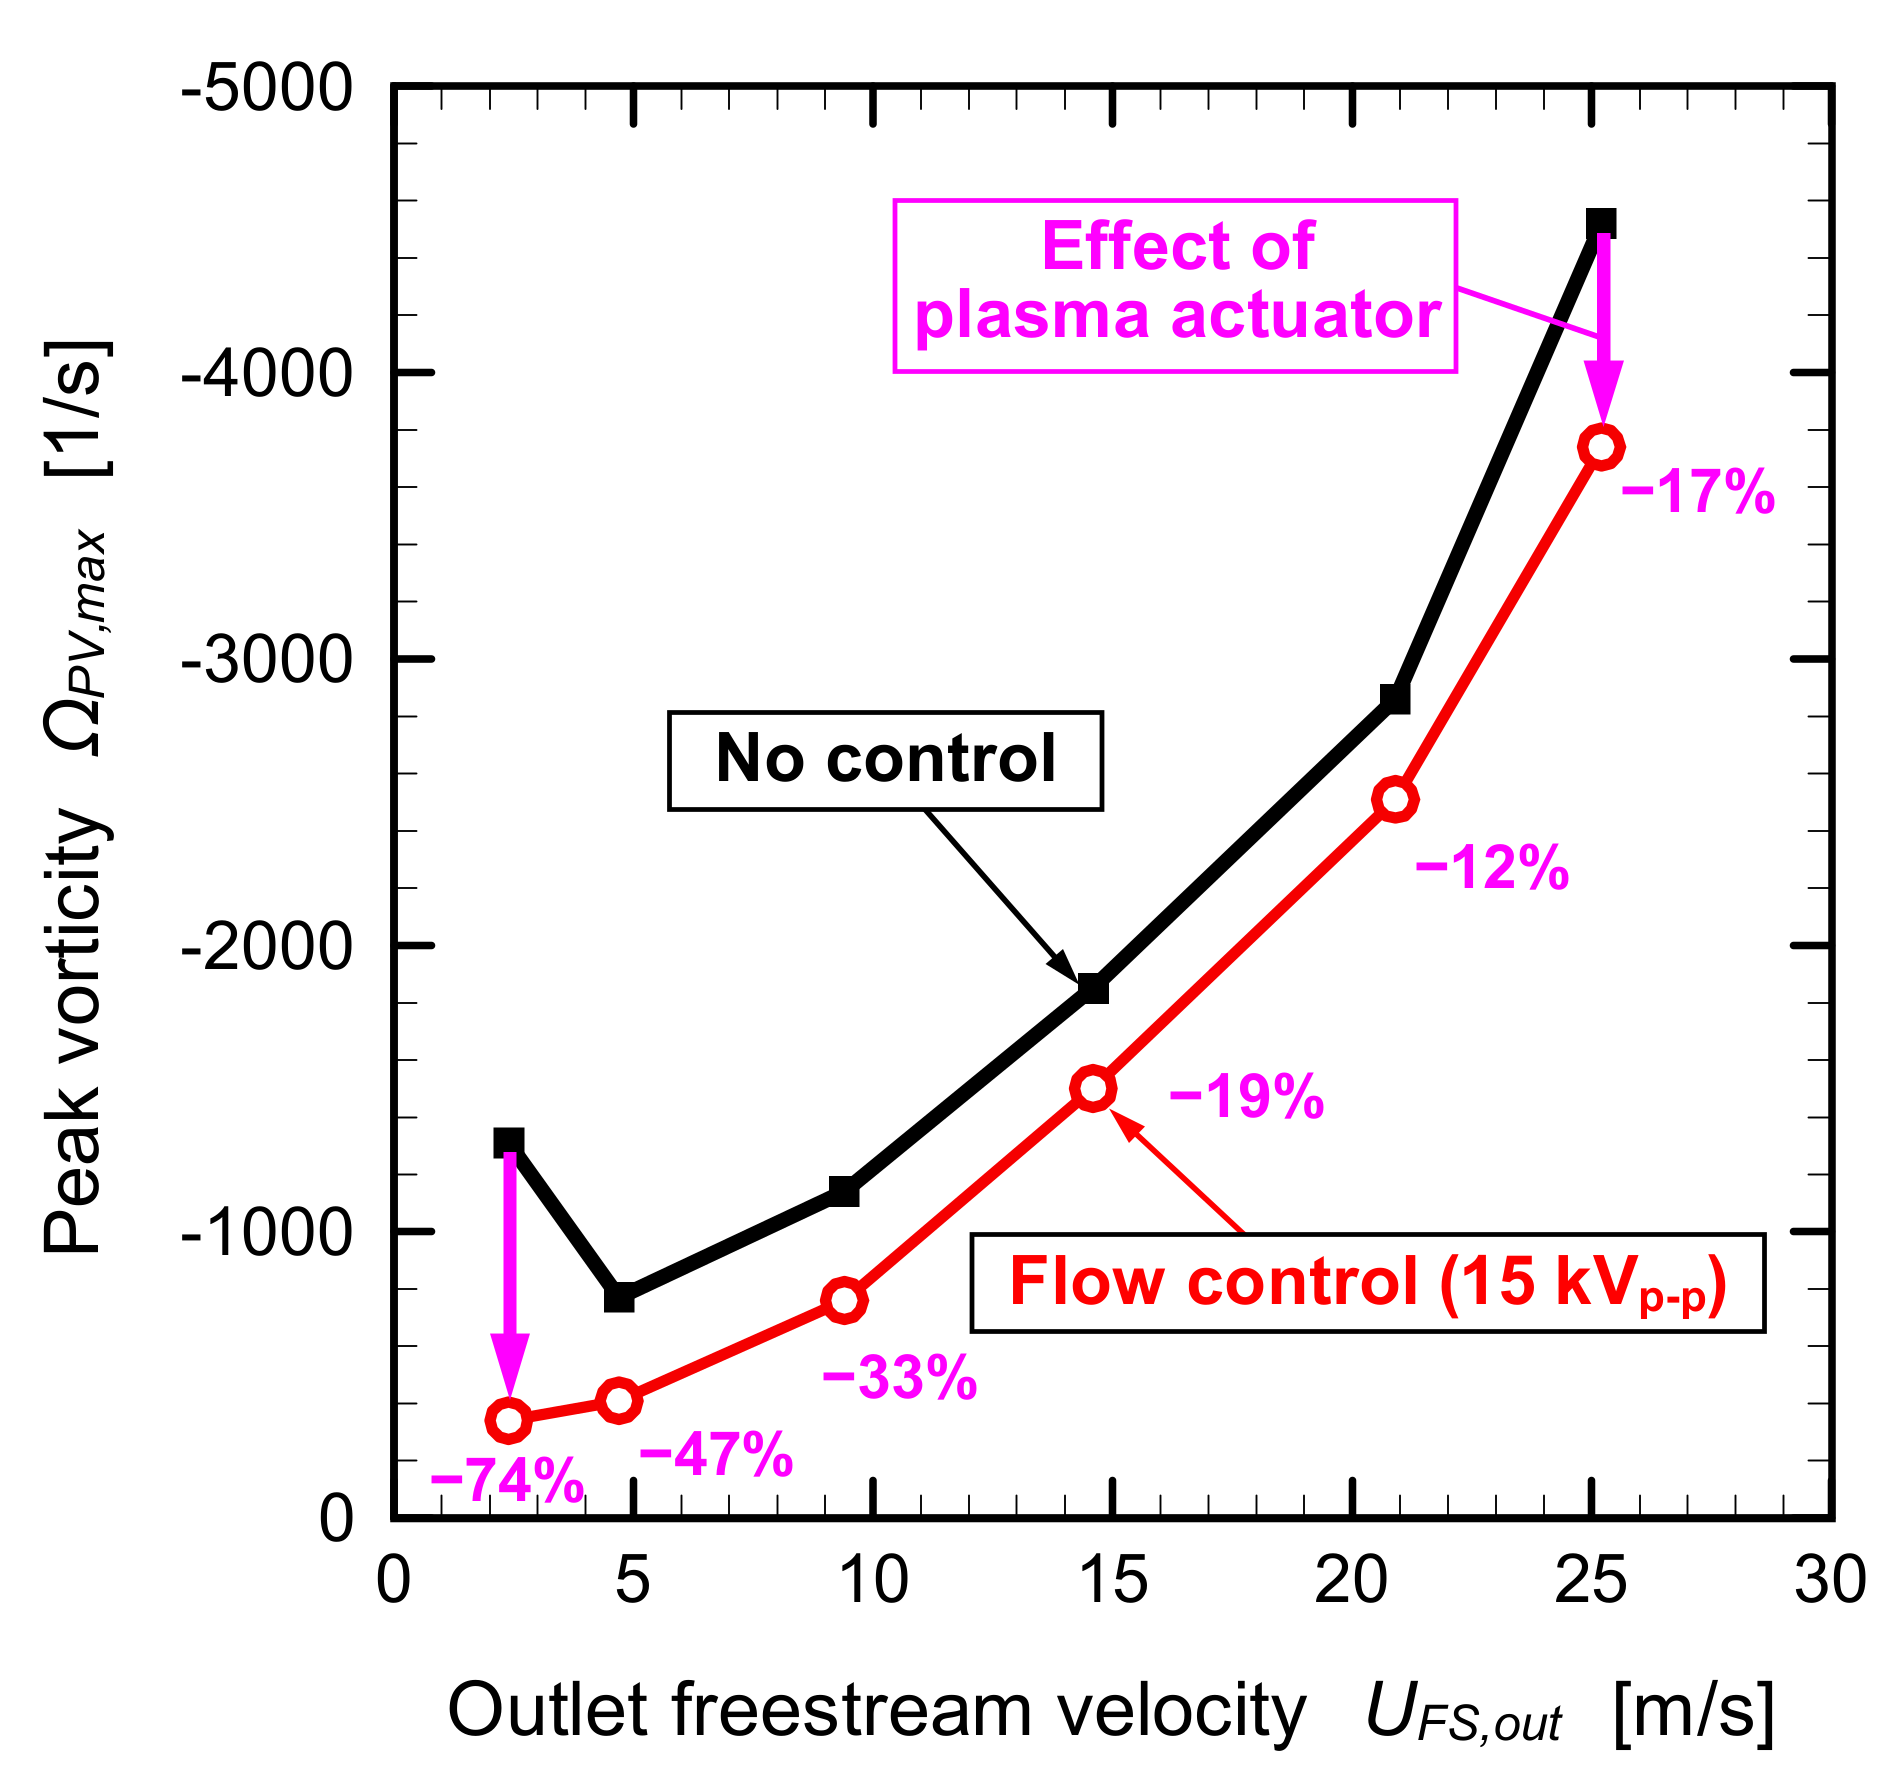
- At the lowest freestream velocity condition of UFS,out = 2.4 m/s, the passage vortex was completely eliminated by the plasma actuator operation at VAC = 10 kVp-p (UPA,max/UFS,out = 1.17). The maximum reductions of the peak values of the velocity and vorticity of the passage vortex by the plasma actuator were 55% and 74%, respectively.
- At the freestream velocity condition of UFS,out = 4.7 m/s, the passage vortex was reduced by the plasma actuator operation at VAC = 15 kVp-p (UPA,max/UFS,out = 0.96). The maximum reductions of the peak values of the velocity and vorticity of the passage vortex by the plasma actuator were 21% and 47%, respectively.
- The effects of jet induced by the plasma actuator weakened as the freestream velocity increased.
- At the highest freestream velocity condition of UFS,out = 25.2 m/s, the peak value of the vorticity was reduced about 17% by the plasma actuator operation at VAC = 15 kVp-p (UPA,max/UFS,out = 0.18).
Author Contributions
Conceptualization, T.M. and T.S.; Data curation, T.M. and T.S.; Formal analysis, T.M.; Investigation, T.M. and T.S.; Methodology, T.M.; Project administration, T.M. and T.S.; Resources, T.S.; Software, T.M. and T.S.; Supervision, T.M.; Validation, T.M. and T.S.; Visualization, T.M. and T.S.; Writing—original draft, T.M.; Writing—review and editing, T.S. All authors have read and agreed to the published version of the manuscript.
Funding
This research received no external funding.
Conflicts of Interest
The authors declare no conflict of interest.
References
- Lakshminarayana, B. Fluid Dynamics and Heat Transfer of Turbomachinery; John Wiley & Sons, Inc.: New York, NY, USA, 1996; p. 324. [Google Scholar] [CrossRef]
- Sharma, O.P.; Butler, T.L. Predictions of Endwall Losses and Secondary Flows in Axial Flow Turbine Cascades. J. Turbomach. 1987, 109, 229–236. [Google Scholar] [CrossRef]
- Coull, J.; Clark, C.; Vazquez, R. The sensitivity of turbine cascade endwall loss to inlet boundary layer thickness. J. Glob. Power Propuls. Soc. 2019, 3, 540–554. [Google Scholar] [CrossRef]
- Langston, L.S. Crossflows in a Turbine Cascade Passage. J. Eng. Power 1980, 102, 866–874. [Google Scholar] [CrossRef]
- Sieverding, C.H. Recent Progress in the Understanding of Basic Aspects of Secondary Flows in Turbine Blade Passages. J. Eng. Gas Turbines Power 1985, 107, 248–257. [Google Scholar] [CrossRef]
- Wang, H.P.; Olson, S.J.; Goldstein, R.J.; Eckert, E.R.G. Flow Visualization in a Linear Turbine Cascade of High Performance Turbine Blades. J. Turbomach. 1997, 119, 1–8. [Google Scholar] [CrossRef]
- Coull, J.D. Endwall Loss in Turbine Cascades. J. Turbomach. 2017, 139. [Google Scholar] [CrossRef]
- Bons, J.P.; Sondergaard, R.; Rivir, R.B. Turbine Separation Control Using Pulsed Vortex Generator Jets. J. Turbomach. 2001, 123, 198–206. [Google Scholar] [CrossRef]
- Hodson, H.P.; Dominy, R.G. The Off-Design Performance of a Low-Pressure Turbine Cascade. J. Turbomach. 1987, 109, 201–209. [Google Scholar] [CrossRef]
- Ainley, D.G.; Mathieson, G.C.R. A Method of Performance Estimation for Axial-Flow Turbines; British Aeronautical Research Council: London, UK, 1951. [Google Scholar]
- Matsunuma, T.; Abé, H.; Tsutsui, Y. Influence of Turbulence Intensity on Annular Turbine Stator Aerodynamics at Low Reynolds Numbers. In Proceedings of the ASME 1999 International Gas Turbine and Aeroengine Congress and Exhibition, Indianapolis, IN, USA, 7–10 June 1999. [Google Scholar]
- Aramendia, I.; Fernandez-Gamiz, U.; Ramos-Hernanz, J.A.; Sancho, J.; Lopez-Guede, J.M.; Zulueta, E. Flow Control Devices for Wind Turbines. Lect. Notes Energy 2017, 37, 629–655. [Google Scholar]
- Schmid, J.; Schulz, A.; Bauer, H.-J. Influence of a Non-Axisymmetric Endwall on the Flow Field in a Turbine Passage: High-Resolution LDV. In Proceedings of the ASME Turbo Expo 2018: Turbomachinery Technical Conference and Exposition, Oslo, Norway, 11–15 June 2018. [Google Scholar] [CrossRef]
- Sangston, K.; Little, J.; Lyall, M.E.; Sondergaard, R. End Wall Loss Reduction of High Lift Low Pressure Turbine Airfoils Using Profile Contouring—Part 2: Validation. J. Turbomach. 2014, 136. [Google Scholar] [CrossRef]
- Chung, J.T.; Simon, T.W.; Buddhavarapu, J. Three-Dimensional Flow Near the Blade/Endwall Junction of a Gas Turbine: Application of a Boundary Layer Fence. In Proceedings of the ASME 1991 International Gas Turbine and Aeroengine Congress and Exposition, Orlando, FL, USA, 3–6 June 1991. [Google Scholar]
- Wei, Z.; Cui, Y.; New, T.H. An experimental study on flow separation control of hydrofoils with leading-edge tubercles at low Reynolds number. Ocean Eng. 2015, 108, 336–349. [Google Scholar] [CrossRef]
- Shyam, V.; Ameri, A.; Poinsatte, P.; Thurman, D.; Wróblewski, A.; Snyder, C. Application of Pinniped Vibrissae to Aeropropulsion. In Proceedings of the ASME Turbo Expo 2015: Turbine Technical Conference and Exposition, Montreal, QC, Canada, 15–19 June 2015. [Google Scholar]
- Bloxham, M.J.; Bons, J.P. A Global Approach to Turbomachinery Flow Control: Passage Vortex Control. J. Turbomach. 2014, 136. [Google Scholar] [CrossRef]
- Benton, S.I.; Bons, J.P.; Sondergaard, R. Secondary Flow Loss Reduction Through Blowing for a High-Lift Front-Loaded Low Pressure Turbine Cascade. J. Turbomach. 2013, 135. [Google Scholar] [CrossRef]
- Benton, S.I.; Bernardini, C.; Bons, J.P.; Sondergaard, R. Parametric Optimization of Unsteady End Wall Blowing on a Highly Loaded Low-Pressure Turbine. J. Turbomach. 2014, 136. [Google Scholar] [CrossRef]
- Bons, J.; Benton, S.; Bernardini, C.; Bloxham, M. Active Flow Control for Low-Pressure Turbines. AIAA J. 2018, 56, 2687–2698. [Google Scholar] [CrossRef]
- Roth, J.R.; Sherman, D.M.; Wilkinson, S.P. Boundary Layer Flow Control with a One Atmosphere Uniform Grow Discharge. AIAA Pap. 1998. [Google Scholar] [CrossRef]
- Corke, T.C.; Post, M.L.; Orlov, D.M. SDBD plasma enhanced aerodynamics: Concepts, optimization and applications. Prog. Aerosp. Sci. 2007, 43, 193–217. [Google Scholar] [CrossRef]
- Corke, T.C.; Enloe, C.L.; Wilkinson, S.P. Dielectric Barrier Discharge Plasma Actuators for Flow Control. Annu. Rev. Fluid Mech. 2010, 42, 505–529. [Google Scholar] [CrossRef]
- Wang, J.-J.; Choi, K.-S.; Feng, L.-H.; Jukes, T.N.; Whalley, R.D. Recent developments in DBD plasma flow control. Prog. Aerosp. Sci. 2013, 62, 52–78. [Google Scholar] [CrossRef]
- Shyy, W.; Jayaraman, B.; Andersson, A. Modeling of glow discharge-induced fluid dynamics. J. Appl. Phys. 2002, 92, 6434–6443. [Google Scholar] [CrossRef]
- Suzen, Y.; Huang, G.; Jacob, J.; Ashpis, D. Numerical Simulations of Plasma Based Flow Control Applications. In Proceedings of the 35th AIAA Fluid Dynamics Conference and Exhibit, Toronto, ON, Canada, 6–9 June 2005. [Google Scholar]
- Fujii, K. High-performance computing-based exploration of flow control with micro devices. Philos. Trans. R. Soc. A Math. Phys. Eng. Sci. 2014, 372. [Google Scholar] [CrossRef] [PubMed]
- Babou, Y.; Martin, E.N.; Peña, P.F. Simple Body Force Model for Dielectric Barrier Discharge Plasma Actuator. In Proceedings of the 7th European Conference for Aeronautics and Aerospace Sciences (EUCASS), Milan, Italy, 3–6 July 2017; EUCASS AISBL: Rhode-Saint-Genèse, Belgium. [Google Scholar] [CrossRef]
- Huang, J.; Corke, T.C.; Thomas, F.O. Plasma Actuators for Separation Control of Low-Pressure Turbine Blades. AIAA J. 2006, 44, 51–57. [Google Scholar] [CrossRef]
- Huang, J.; Corke, T.C.; Thomas, F.O. Unsteady Plasma Actuators for Separation Control of Low-Pressure Turbine Blades. AIAA J. 2006, 44, 1477–1487. [Google Scholar] [CrossRef]
- Rizzetta, D.; Visbal, M. Numerical Investigation of Plasma-Based Flow Control for a Transitional Highly-Loaded Low-Pressure Turbine. AIAA J. 2007. [Google Scholar] [CrossRef]
- Pescini, E.; Marra, F.; De Giorgi, M.G.; Francioso, L.; Ficarella, A. Investigation of the boundary layer characteristics for assessing the DBD plasma actuator control of the separated flow at low Reynolds numbers. Exp. Therm. Fluid Sci. 2017, 81, 482–498. [Google Scholar] [CrossRef]
- Martinez, D.S.; Pescini, E.; Marra, F.; De Giorgi, M.G.; Ficarella, A. Analysis of the Performance of Plasma Actuators Under Low-Pressure Turbine Conditions Based on Experiments and URANS Simulations. In Proceedings of the ASME Turbo Expo 2017: Turbomachinery Technical Conference and Exposition, Charlotte, NC, USA, 26–30 June 2017. [Google Scholar]
- Van Ness, D.; Corke, T.; Morris, S. Turbine Tip Clearance Flow Control Using Plasma Actuators. In Proceedings of the 44th AIAA Aerospace Sciences Meeting and Exhibit, Reno, NV, USA, 9–12 January 2006. [Google Scholar]
- Van Ness, D.; Corke, T.; Morris, S. Stereo PIV of a Turbine Tip Clearance Flow with Plasma Actuation. In Proceedings of the 45th AIAA Aerospace Sciences Meeting and Exhibit, Reno, NV, USA, 8–11 January 2007. [Google Scholar]
- Van Ness, D.K.; Corke, T.C.; Morris, S.C. Tip Clearance Flow Visualization of a Turbine Blade Cascade with Active and Passive Flow Control. In Proceedings of the ASME Turbo Expo 2008: Power for Land, Sea and Air, Berlin, Germany, 9–13 June 2008; pp. 1217–1229. [Google Scholar]
- Stephens, J.E.; Corke, T.; Morris, S. Blade-Mounted Single Dielectric Barrier Discharge Plasma Actuators in Turbine Cascade. J. Propuls. Power 2011, 27, 692–698. [Google Scholar] [CrossRef]
- Matsunuma, T.; Segawa, T. Active Tip Clearance Flow Control for an Axial-Flow Turbine Rotor Using Ring-Type Plasma Actuators. In Proceedings of the ASME Turbo Expo 2014: Turbine Technical Conference and Exposition, Düsseldorf, Germany, 16–20 June 2014. [Google Scholar]
- Matsunuma, T.; Segawa, T. Tip Leakage Flow Reduction of a Linear Turbine Cascade Using String-Type DBD Plasma Actuators. In Proceedings of the ASME Turbo Expo 2018: Turbomachinery Technical Conference and Exposition, Oslo, Norway, 11–15 June 2018. [Google Scholar]
- Yu, J.; Bao, W.; Chen, F.; Song, Y.; Wang, C. Optimization and Evaluation of Multiple DBD Plasma Actuators Applied in the Tip Leakage Control for Turbine Cascade. In Proceedings of the ASME Turbo Expo 2019: Turbomachinery Technical Conference and Exposition, Phoenix, AZ, USA, 17–21 June 2019. [Google Scholar]
- Yu, J.; Yu, J.; Chen, F.; Wang, C. Numerical study of tip leakage flow control in turbine cascades using the DBD plasma model improved by the parameter identification method. Aerosp. Sci. Technol. 2019, 84, 856–864. [Google Scholar] [CrossRef]
- De Giorgi, M.G.; Traficante, S.; De Luca, C.; Bello, D.; Ficarella, A. Active Flow Control Techniques on a Stator Compressor Cascade: A Comparison Between Synthetic Jet and Plasma Actuators. In Proceedings of the ASME Turbo Expo 2012: Turbine Technical Conference and Exposition, Copenhagen, Denmark, 11–15 June 2012. [Google Scholar]
- Matsunuma, T. Effects of Reynolds Number and Freestream Turbulence on Turbine Tip Clearance Flow. J. Turbomach. 2006, 128, 166–177. [Google Scholar] [CrossRef]
- Matsunuma, T. Unsteady Flow Field of an Axial-Flow Turbine Rotor at a Low Reynolds Number. J. Turbomach. 2007, 129, 360–371. [Google Scholar] [CrossRef]
- Montis, M.; Niehuis, R.; Fiala, A. Aerodynamic Measurements on a Low Pressure Turbine Cascade With Different Levels of Distributed Roughness. In Proceedings of the ASME 2011 Turbo Expo: Turbine Technical Conference and Exposition, Vancouver, BC, Canada, 6–10 June 2011. [Google Scholar]
- Bons, J.P. A Review of Surface Roughness Effects in Gas Turbines. J. Turbomach. 2010, 132. [Google Scholar] [CrossRef]
- Vázquez, R.; Torre, D.; Partida, F.; Armañanzas, L.; Antoranz, A. Influence of Surface Roughness on the Profile and End-Wall Losses in Low Pressure Turbines. In Proceedings of the ASME 2011 Turbo Expo: Turbine Technical Conference and Exposition, Vancouver, BC, Canada, 6–10 June 2011. [Google Scholar]
- Kriegseis, J.; Möller, B.; Grundmann, S.; Tropea, C. Capacitance and power consumption quantification of dielectric barrier discharge (DBD) plasma actuators. J. Electrost. 2011, 69, 302–312. [Google Scholar] [CrossRef]
- Ashpis, D.E.; Laun, M.C.; Griebeler, E.L. Progress toward accurate measurements of power consumptions of DBD plasma actuators. AIAA Pap. 2011. [Google Scholar] [CrossRef]
- Murphy, J.P.; Kriegseis, J.; Lavoie, P. Scaling of maximum velocity, body force, and power consumption of dielectric barrier discharge plasma actuators via particle image velocimetry. J. Appl. Phys. 2013, 113. [Google Scholar] [CrossRef]
- Hanson, R.E.; Houser, N.M.; Lavoie, P. Dielectric material degradation monitoring of dielectric barrier discharge plasma actuators. J. Appl. Phys. 2014, 115. [Google Scholar] [CrossRef]
- Technical Section on Plasma Actuators—Activities in the Past 5 Years and Future Prospects. Available online: http://www.jsme-fed.org/newsletters-e/2019_2/no3.html (accessed on 23 December 2019).
© 2020 by the authors. Licensee MDPI, Basel, Switzerland. This article is an open access article distributed under the terms and conditions of the Creative Commons Attribution (CC BY) license (http://creativecommons.org/licenses/by/4.0/).