Article

On Developing Techniques for Sharing Satellite Spectrum with Indoor Small Cells in 5G †

Radio and Spectrum Laboratory, KDDI Research, Inc. 2-1-15 Ohara, Fujimino-shi, Saitama 356-8502, Japan
This paper is an extended version of a paper presented at the 2019 Joint Conference on Satellite Communications (JC SAT 2019), JR Hakata City, Fukuoka, Japan, 10–11 October 2019 and published as a technical report without peer review in IEICE Technical Report SAT2019-61(2019-10), pp. 103–108.
Energies 2020, 13(3), 748; https://doi.org/10.3390/en13030748
Submission received: 18 December 2019 / Revised: 5 February 2020 / Accepted: 6 February 2020 / Published: 8 February 2020

Abstract

:
In this paper, we present two spectrum sharing techniques for a multisystem, incorporating an integrated satellite-mobile system and an autonomous terrestrial-mobile system (iSMS/aTMS), namely orthogonal spectrum sharing (OSS) and non-orthogonal spectrum sharing (nOSS) techniques. aTMS consists of numerous small cells deployed in several buildings, and iSMS consists of a satellite station integrated with complementary ground component (CGC) stations deployed within buildings. By exploiting the high external wall penetration loss of a building, the iSMS spectrum is shared with small cells per building in OSS, and small cells per 3-dimensional (3D) cluster per building in nOSS. An interference management scheme, to avoid interference in apartments with collocated CGC stations and small cells, was developed and an optimal number of almost blank subframes (ABSs) per ABS pattern period (APP) was defined. System-level capacity, spectral efficiency, and energy efficiency performance metrics were derived. Furthermore, we present an algorithm for both OSS and nOSS techniques. With extensive simulation and numerical analysis, it is shown that the proposed nOSS significantly outperforms OSS in terms of spectral efficiency and energy efficiency, and both techniques can meet the expected spectral efficiency and energy efficiency requirements for the fifth-generation (5G) mobile networks.

1. Introduction

1.1. Background

Spectrum sharing is considered as one of the most effective techniques to address the enormous capacity and high data rate demands of next-generation mobile networks due to the unavailability of sufficient licensed spectrums for a mobile network operator (MNO). Spectrum sharing can be performed either between homogeneous systems or heterogeneous systems. For heterogeneous systems, spectrum sharing between space-satellite systems (SPSs) and terrestrial-mobile systems (TMSs) is considered as a crucial and viable option, particularly for the future fifth-generation (5G) mobile system. With this consideration, many countries such as Japan have allocated 5G spectra to four mobile network operators including 3.7 GHz, 4.5 GHz, and 28 GHz [1]. However, the 3.4 GHz to 4.2 GHz spectrum has already been allocated to the fixed-satellite service (FSS) system in the downlink [2], resulting in sharing the 5G cellular in the 3.7 GHz band with the FSS.
In general, two major types of spectrum sharing between SPSs and TMSs are well recognized, namely integrated satellite-mobile systems (iSMSs) and hybrid satellite-mobile systems (hSMSs). In iSMSs, the terrestrial component, termed as the complementary ground component (CGC) in Europe and ancillary terrestrial component (ATC) in North America, is complementary and works as part of the system in the same frequency as that of the satellite component. In hSMSs, satellite and terrestrial components are interconnected even though they operate independently from one another. Since almost 80% of data is generated in indoor environments [3,4], small cells are considered as effective candidates to serve indoor users due to their small coverage. Hence, by exploiting the high external wall penetration loss of a building [5], particularly in urban areas, the same satellite spectrum can be shared with in-building small cells of a mobile system. It has to be noted that by enforcing a certain maximum received interference level at the indoor user equipment (UE), the same satellite spectrum can be exploited further for reuse in small cell base stations (SBSs) more than once within a building. Hence, along with serving a high indoor data traffic demand with the shared satellite spectrums, both the system-level spectral efficiency and energy efficiency of a mobile system can be improved, which necessitate developing techniques to share the spectrum of a satellite system with the in-building small cells of a mobile system.

1.2. Related Work and Problem Statement

In the existing literature, numerous research contributions can be found on both iSMSs [6,7] and hSMSs [8,9,10,11,12], focusing primarily on interference issues. However, instead of being standalone systems as aforementioned, a hybrid space-satellite and terrestrial-mobile system may also consist of an iSMS and an autonomous terrestrial-mobile system (aTMS). For example, in [13], to demonstrate a number of communication modes, the authors proposed and described the overall system features for a hybrid space-satellite and terrestrial-mobile system. CGCs working as repeaters are considered standalone or collocating with the terrestrial cell sites to provide coverage in areas where the satellite signal strength is poor. Whereas the satellite covers areas outside the coverage of CGC stations and terrestrial cell-sites, and terrestrial cell sites cover areas of the coverage of satellite and CGC regions. Furthermore, in [14], it was proposed that traditional land mobile radio (LMR) systems can be deployed with an iSMS to use its resources. LMR systems are provided with the iSMS handset to facilitate advanced features and to provide coverage and capacity in case of an emergency. Likewise, aTMS may also collocate with an iSMS, forming a hybrid iSMS and aTMS system to share the spectrum of iSMS with aTMS.
Recall that since most data in TMSs are generated in indoor environments, indoor small cells of an aTMS can help share it with the spectrum of iSMS. In line with this, the Federal Communications Commission (FCC) proposed to make available 100 megahertz of spectrum for sharing between satellites and small cells in the 3.5 GHz band [15]. Additionally, a study item for provisioning non-terrestrial networks including iSMSs and standalone satellite systems for 5G mobile networks has been initiated recently by the Third Generation Partnership Project (3GPP) standardization bodies [16].
However, research on spectrum sharing between satellites and small cells in indoor environments are not so apparent. A few works (e.g., [17,18,19,20,21]) in this direction have been carried out. In [17], the authors investigated sharing both indoor and outdoor small cells with an FSS at 3.5 GHz and analyzed the co-channel interference between small cells and the FSS. The authors in [18] studied the performance improvement in spectral and energy efficiencies by offloading satellite UEs whenever a satellite UE was within the coverage of any small cell, so that the satellite spectrum can be shared with 3-dimensional (3D) in-building small cells. In [19], the authors proposed a number of in-building small cell Base Station (BS) architectures by exploiting the number of transceivers as well as operating spectrums including the space-satellite spectrum, to share with small cells deployed within a building subject to satisfy a co-channel interference management technique. Authors in [20] evaluated the interference between the Long-Term Evolution (LTE) Hotspot indoors and the Earth station of the FSS in the 3.4–3.6 GHz band. Likewise, the authors in [21] studied the deployment and efficient sharing of satellite spectrum in the C-band with indoor small cells as well as device-to-device communications.
However, other than the traditional hybrid and integrated satellite and terrestrial mobile systems, developing spectrum sharing techniques for a hybrid iSMS and aTMS to reuse the satellite spectrum to small cells in 3D buildings is not obvious in the literature. Recently, in [22], we addressed this issue (i.e., developing spectrum sharing techniques for a hybrid iSMS and aTMS) where we considered that CGC stations and SBSs were collocated in an apartment of a building for the purpose of simplification. However, in practice, CGC stations are deployed under the control of a satellite service provider, whereas SBSs are deployed either by the customer or by the operator of an aTMS [23,24]. Hence, it is not a necessary condition that CGC stations and SBSs within a building need to be collocated to one another. In fact, in realistic scenarios, the distribution of the placement of CGC stations and the placement of SBSs within a building is independent. Furthermore, in [22], we considered sharing the satellite spectrum with small cells per building by allocating resources to small cells in the frequency-domain (FD) orthogonally in any transmission time interval (TTI) to avoid co-channel interference. However, under a certain constraint of co-channel interference, the same frequency can be reused with small cells deployed apart from one another by a minimum distance corresponding to satisfying the co-channel interference constraint resulting in a further improvement in spectral efficiency [25]. Since the spectrum is reused more than once to small cells per building, spectrum sharing within a building is no longer orthogonal.

1.3. Contribution and Limitation

In this paper, we present a hybrid iSMS and aTMS by extending our previous work in [22] and by limiting the focus on assessing the performance of the only aTMSs due to sharing the satellite spectrum of iSMS with in-building small cells of the aTMS. More specifically, the main technological challenges that we aim to solve in this paper as extensions of [22] are the aforementioned issues of [22] as described in the previous section by generalizing the assumptions of the collocation of SBSs and CGC stations per apartment as well as non-orthogonal sharing of the satellite spectrum with small cells per building. In particular, the major contributions of the paper are as follows.
  • We present two spectrum sharing techniques, namely orthogonal spectrum sharing (OSS) and non-orthogonal spectrum sharing (nOSS) techniques, for a hybrid iSMS and aTMS by extending our previous work in [22]. As an extension, first, the assumptions in [22] for the collocation of all CGC stations and SBSs per apartment in each building were relaxed, resulting in the deployment of small cell base stations (BSs) and CGC stations in a building following two independent and random processes so that small cell BSs (SBSs) and CGC stations can be deployed in four ways within an apartment, assuming that the occurrence of each deployment option is equally likely. Second, in addition to an OSS in [22], we present an nOSS technique that considers non-orthogonal sharing of the satellite spectrum with SBSs per 3D cluster of SBSs per building.
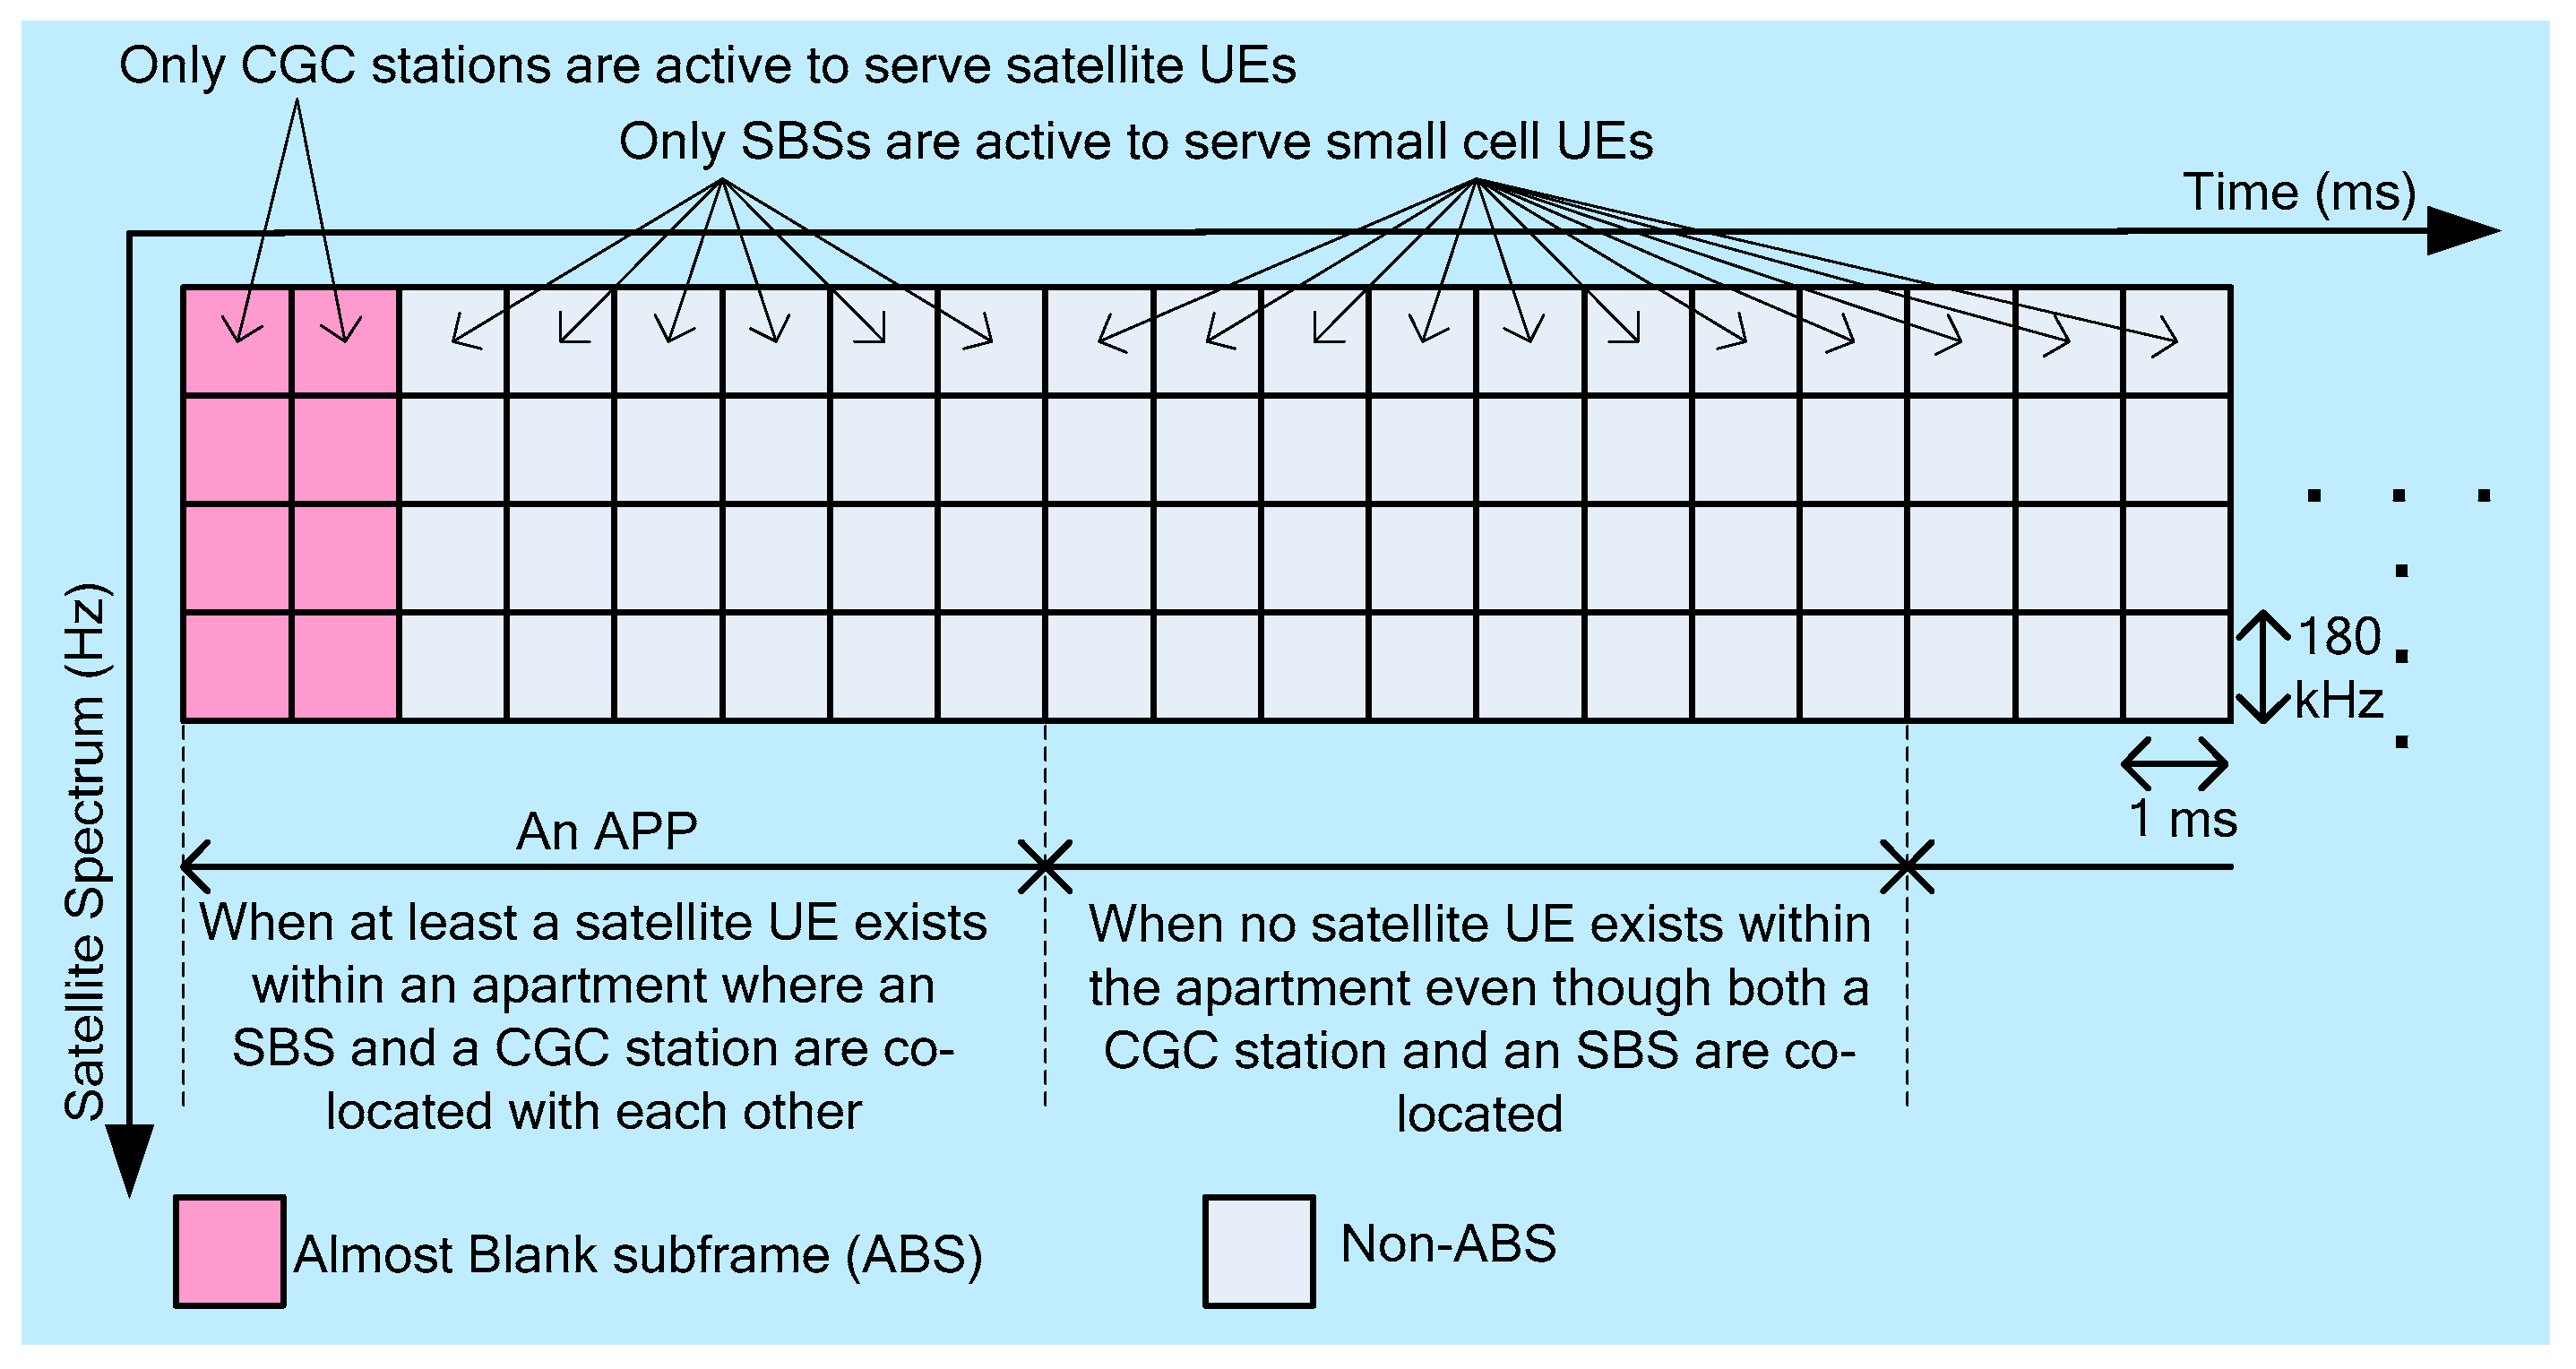
  • We develop an interference management strategy to address co-channel interference as well as deduce an optimal number of almost blank subframes (ABSs) per ABS pattern period (APP) to ensure a fair allocation of time resources to SBSs and CGC stations, in apartments with collocated CGC stations and small cells.
  • We then derive system-level capacity, spectral efficiency, and energy efficiency performance metrics and present an algorithm for OSS and nOSS techniques.
  • Finally, we carry out extensive simulation and numerical analysis to evaluate the relative outperformance of one to another for nOSS and OSS techniques and show that both techniques can meet the expected spectral efficiency and energy efficiency requirements for 5G mobile networks.
We limited evaluating the performance of the proposed techniques to the following.
  • The performance evaluation was limited to only aTMS (i.e., the evaluation for the iSMS was considered beyond the scope of the paper).
  • Since in general, user-plane traffic is considerably higher than that of control-plane traffic, for simplicity, we assumed that the impact of control-plane traffic due to the coordination among different components of the iSMS/aTMS for sharing the satellite spectrum of iSMS with in-building SBSs of aTMS was negligible. In other words, we limited the scope of this paper to evaluating only the user-plane traffic capacity of aTMS when sharing the spectrum of the iSMS with indoor SBSs. The evaluation of the required control-plane traffic capacity and hence the corresponding required bandwidth needs a detailed analysis of a number of factors, which was beyond the scope of the paper.
  • Satellite spectrum sharing was considered only for the in-building SBSs. Hence, the co-channel interference was considered only within buildings.
  • The satellite spectrum band of 3.5 GHz for the iSMS was considered for sharing with SBSs of the aTMS following [15], and keeping the satellite frequency close to that of the aTMS (i.e., 2 GHz) so that the transceivers’ frequency responses of SBSs did not deviate too high.
  • The significance of the performance results of the proposed techniques was verified by comparing them with that expected for the 5G mobile networks in terms of spectral efficiency and energy efficiency.
  • The performance results for the variation in the density of in-building SBSs (i.e., the number of buildings) per macrocell of the aTMS are shown, and the variation in other parameters was beyond the scope of the paper.

1.4. Organization

The rest of this paper is organized as follows. In Section 2, the system model is detailed. In Section 3, the clustering of nodes in nOSS is discussed and the performance metrics in terms of capacity, spectral efficiency, and energy efficiency are derived. In Section 4, the algorithm of the proposed spectrum sharing technique is presented and an optimal number of ABSs is deduced. Default parameters and assumptions are discussed in Section 5 and the performance Result and comparison of the proposed techniques are carried out in Section 6. The paper is concluded in Section 7.

2. System Model

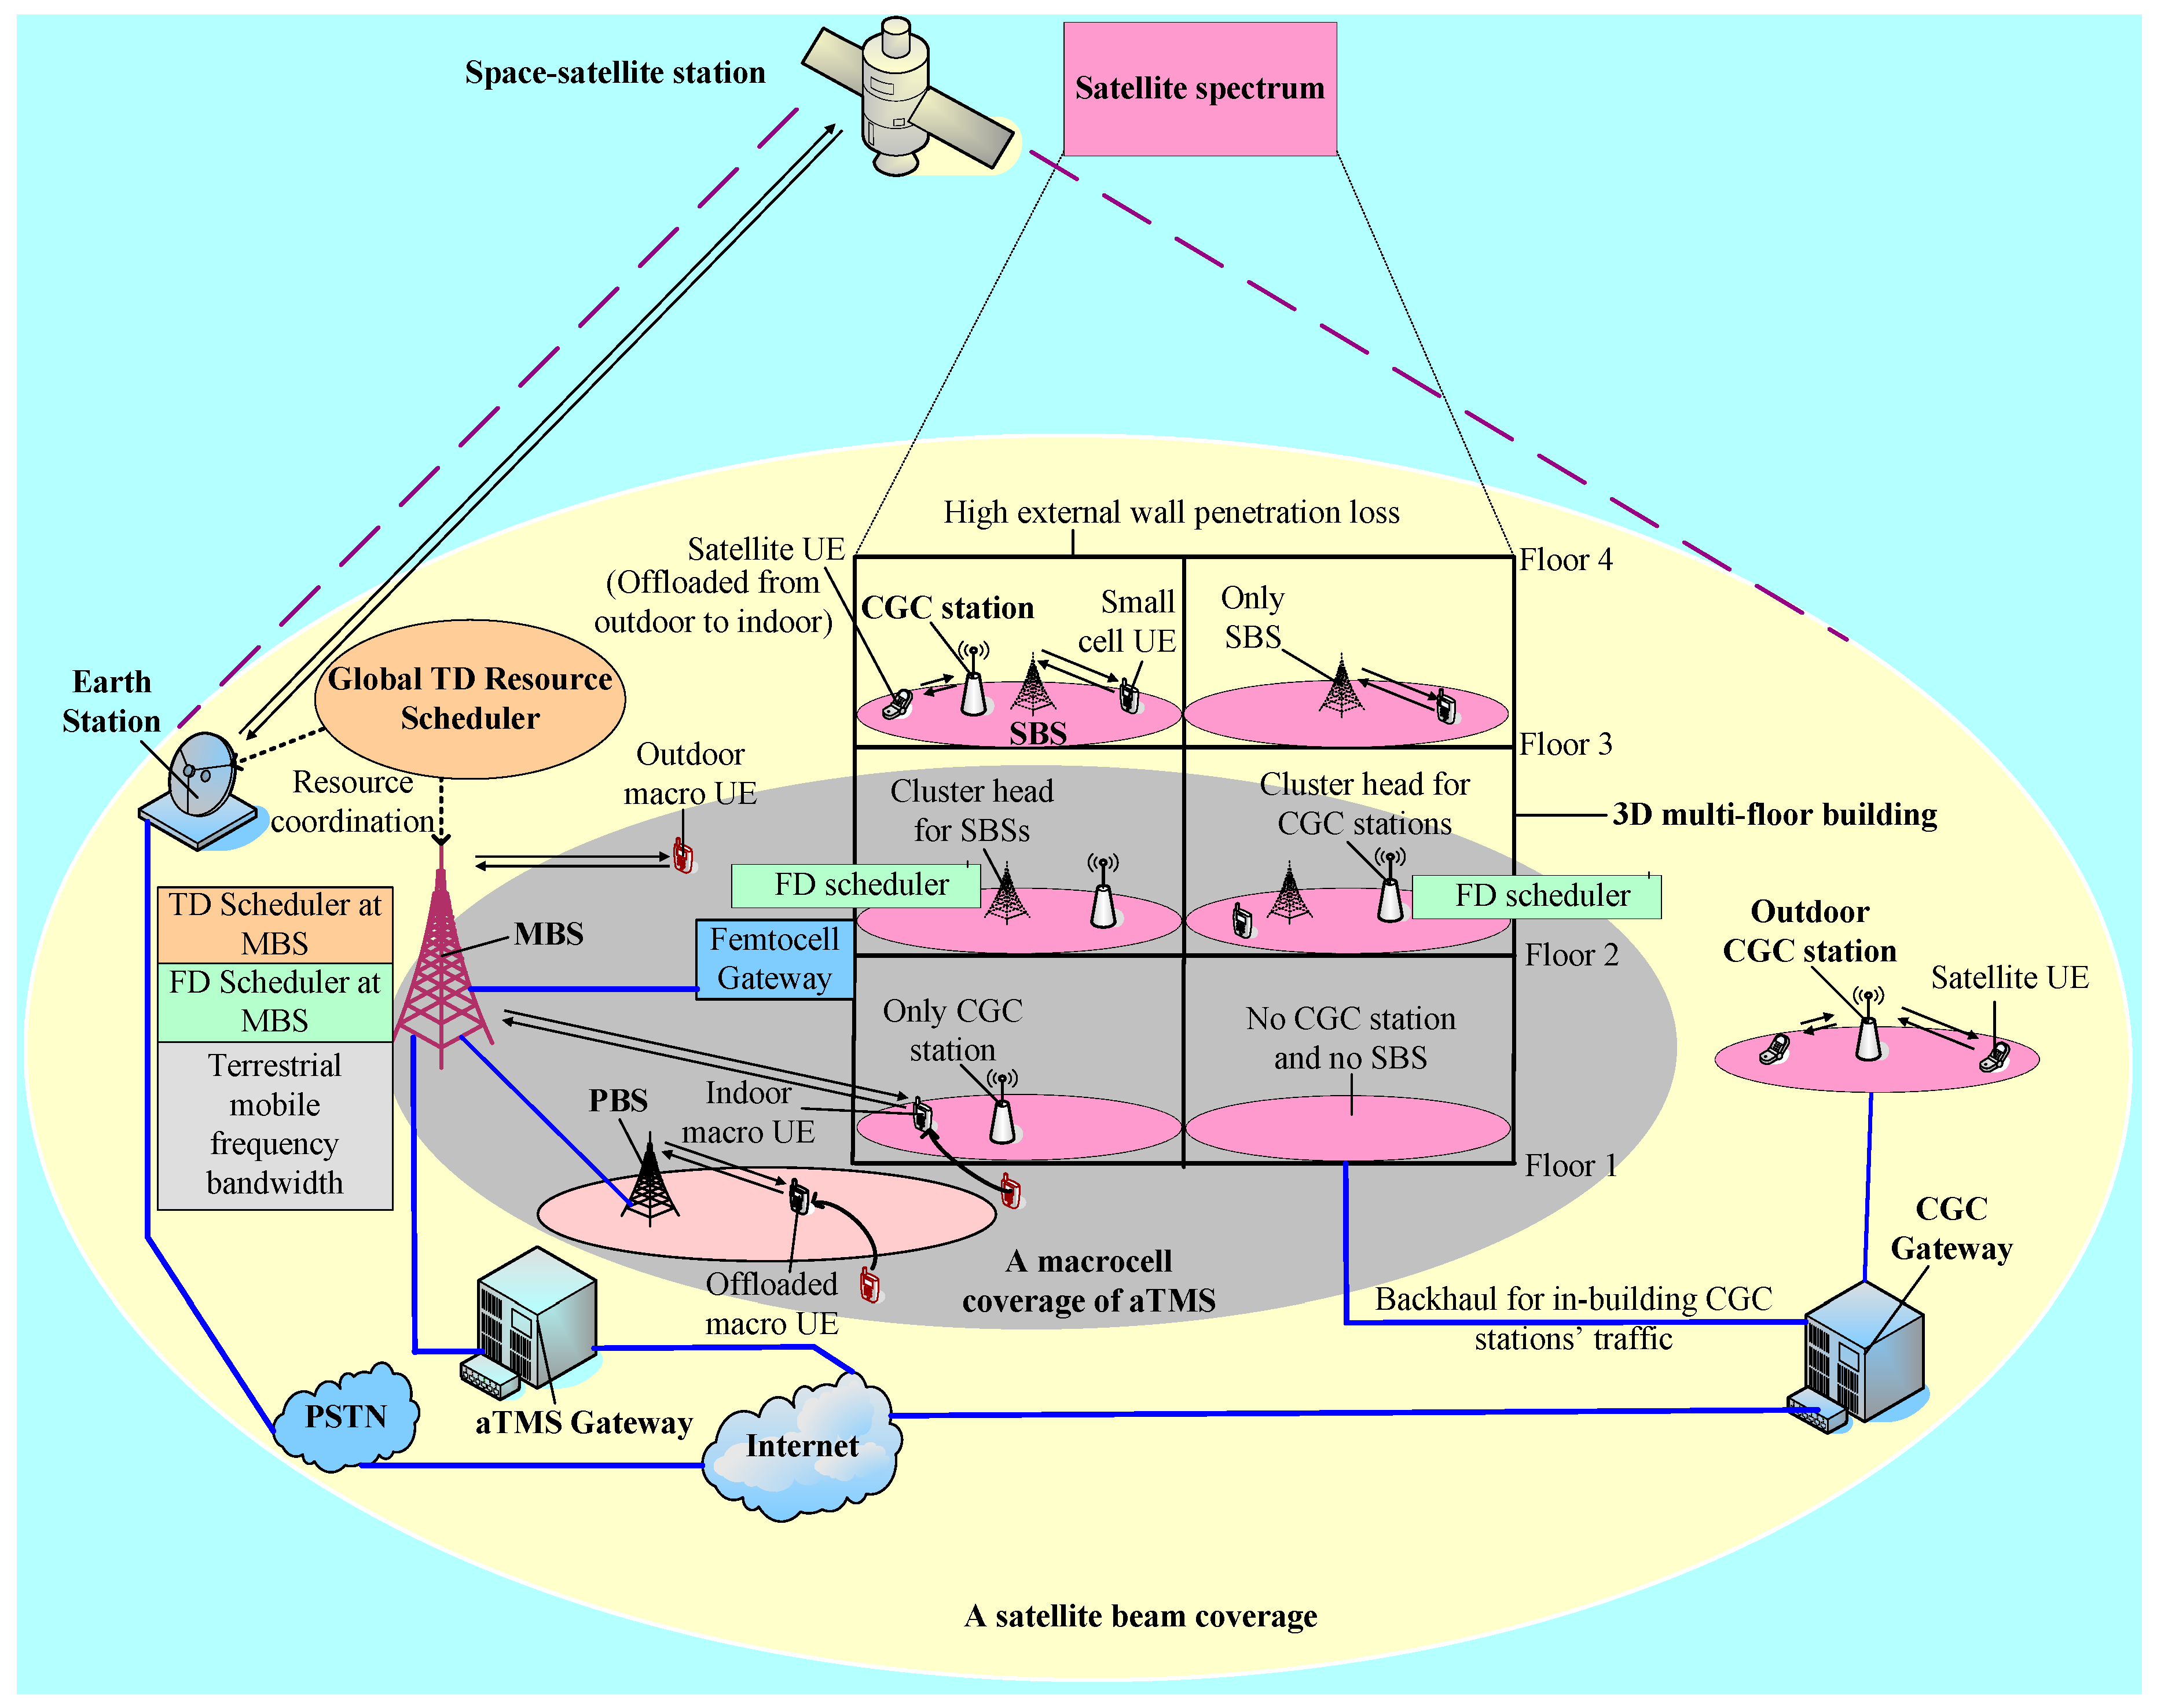
2.1. System Architecture

In Figure 1, the system architecture of the proposed hybrid integrated satellite-mobile system and an autonomous terrestrial-mobile system (iSMS/aTMS) was shown, which consists of an iSMS and aTMS. The iSMS consists of a satellite station integrated with CGC stations and serves satellite UEs in both outdoor and indoor environments. However, the aTMS incorporates a set of small cells, namely femtocells, which are deployed within a set of multi-storage buildings. All buildings were assumed to be located within the macrocell coverage of the aTMS. Both SBSs and CGC stations were assumed to deploy randomly within each building and operate at the same satellite spectrum. Note that only one building is shown in Figure 1 for simplicity.
For aTMS, we assume that a certain percentage of macro UEs were located within buildings, whereas a group of outdoor macro UEs is offloaded by picocells. Macro UEs can operate only at the spectrum of aTMS by the macrocell. Each building consisted of a set of floors and each floor consisted of a set of regular square-grid apartments. Furthermore, it was assumed that the transmission power of both an SBS and a CGC station was the same so that both had the same area of coverage, which was equal to the area of an apartment. Consider that an agreement between an aTMS operator and an iSMS provider exists so that all small cell UEs of aTMS can operate exclusively at the same satellite spectrum.
Moreover, as shown in Figure 1, a global time-domain (TD) resource scheduler (RS) was considered to assign spectrum resources to both CGC stations and SBSs. When moving from the outdoor into a building, a satellite UE informs either the satellite station or an outdoor CGC station, depending on which one of them is serving it using the physical cell identity (ID) of the indoor CGC station that will serve the satellite UE within the building. To avoid co-channel interference, the RS informs the corresponding frequency-domain scheduler of the indoor CGC station to stop scheduling data signals during the ABSs of all collocated SBSs, corresponding to the indoor CGC station within the same building.
Since an iSMS uses a common network and resource management system and a common core network, any specific handover procedure [13] can be defined for satellite UEs to minimize or to avoid the impact of speed of satellite on the UEs’ handover. Hence, the satellite system can be either a geostationary Earth orbit (GEO) or a low Earth orbit (LEO). Furthermore, the operating frequency of the satellite system is either the L-band or the S-band due to the suitable propagation characteristics in these bands.

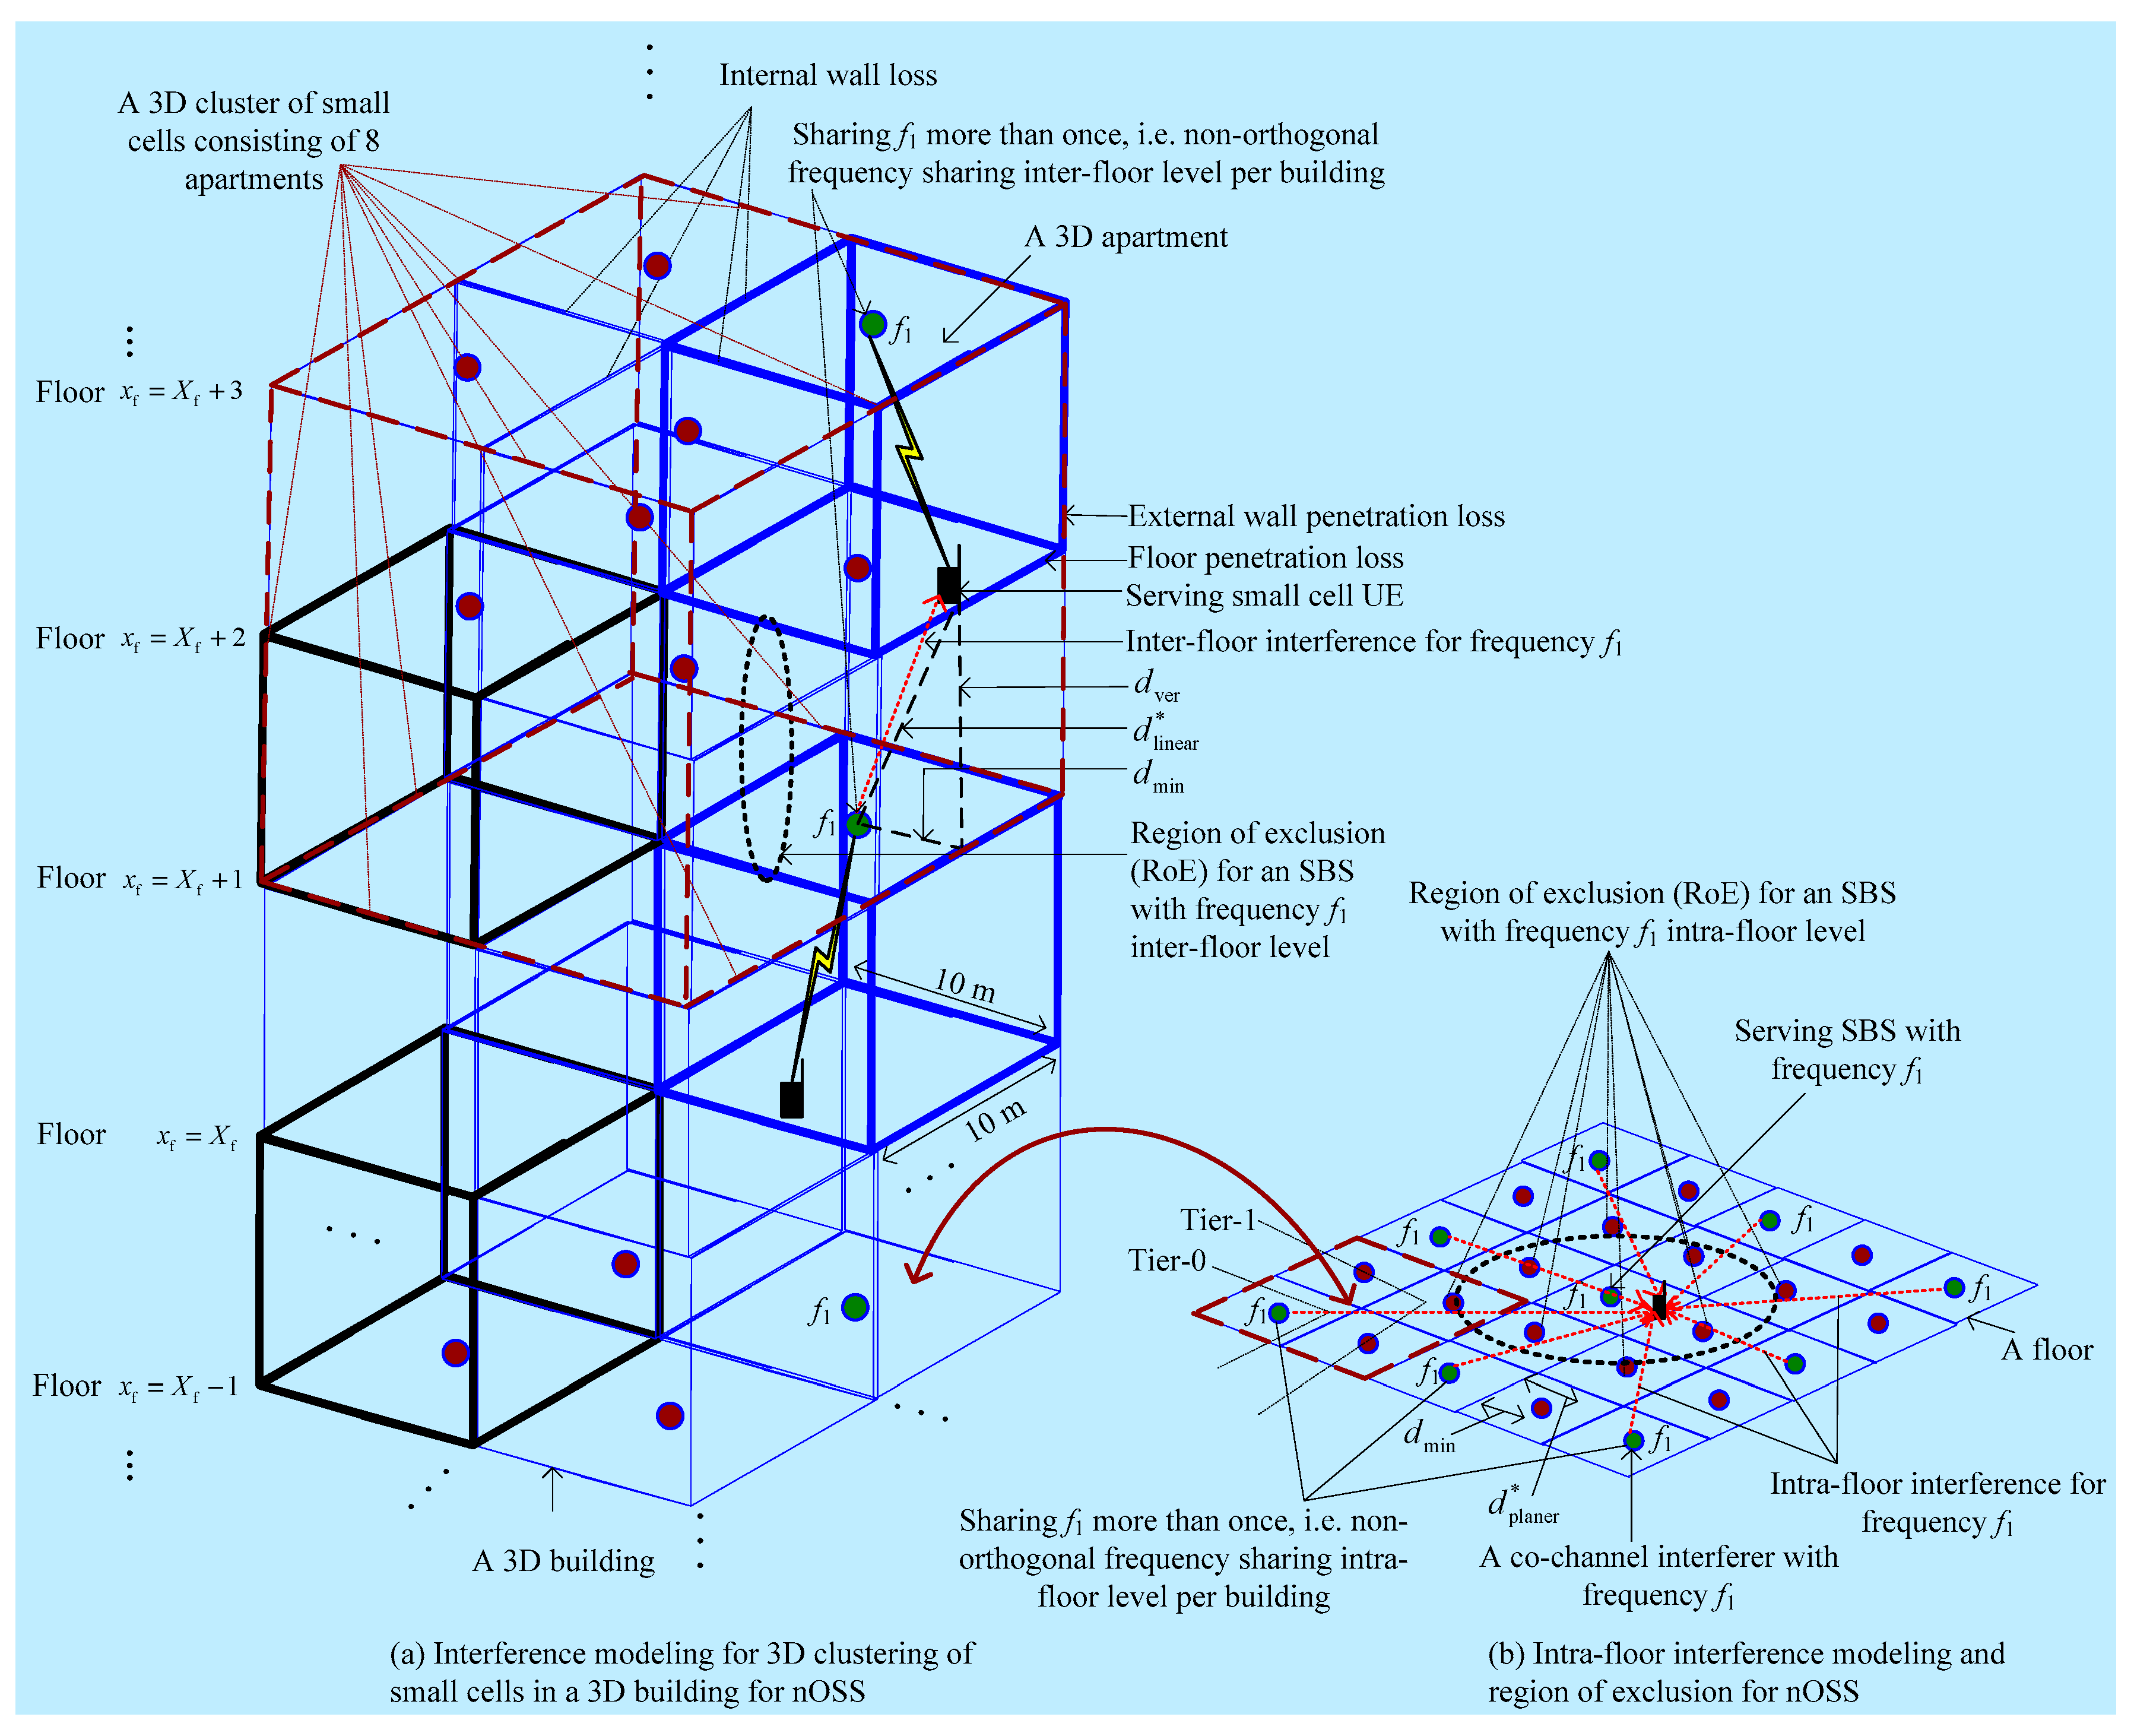
2.2. Modeling Placement of Complementary Ground Component (CGC) Stations and Small Cell Base Stations (SBSs)

We assumed that the deployments of SBSs and CGC stations in a building followed two independent and random processes. Let S denote the sample space representing the total number of apartments per building. Let S SBS and S CGC denote the set of SBSs and CGC stations deployed per building, respectively. Since in an apartment at most one SBS and one CGC station may exist, SBSs and CGC stations can be deployed in four ways within an apartment, assuming that the occurrence of each deployment option is equally likely. In other words, there are four possible events constituting the whole sample space for the deployment of SBSs and CGC stations in an apartment. Each event may occur more than once, representing a subset of the total number of apartments per building (i.e., the whole sample space) as follows, and are shown in Figure 2.
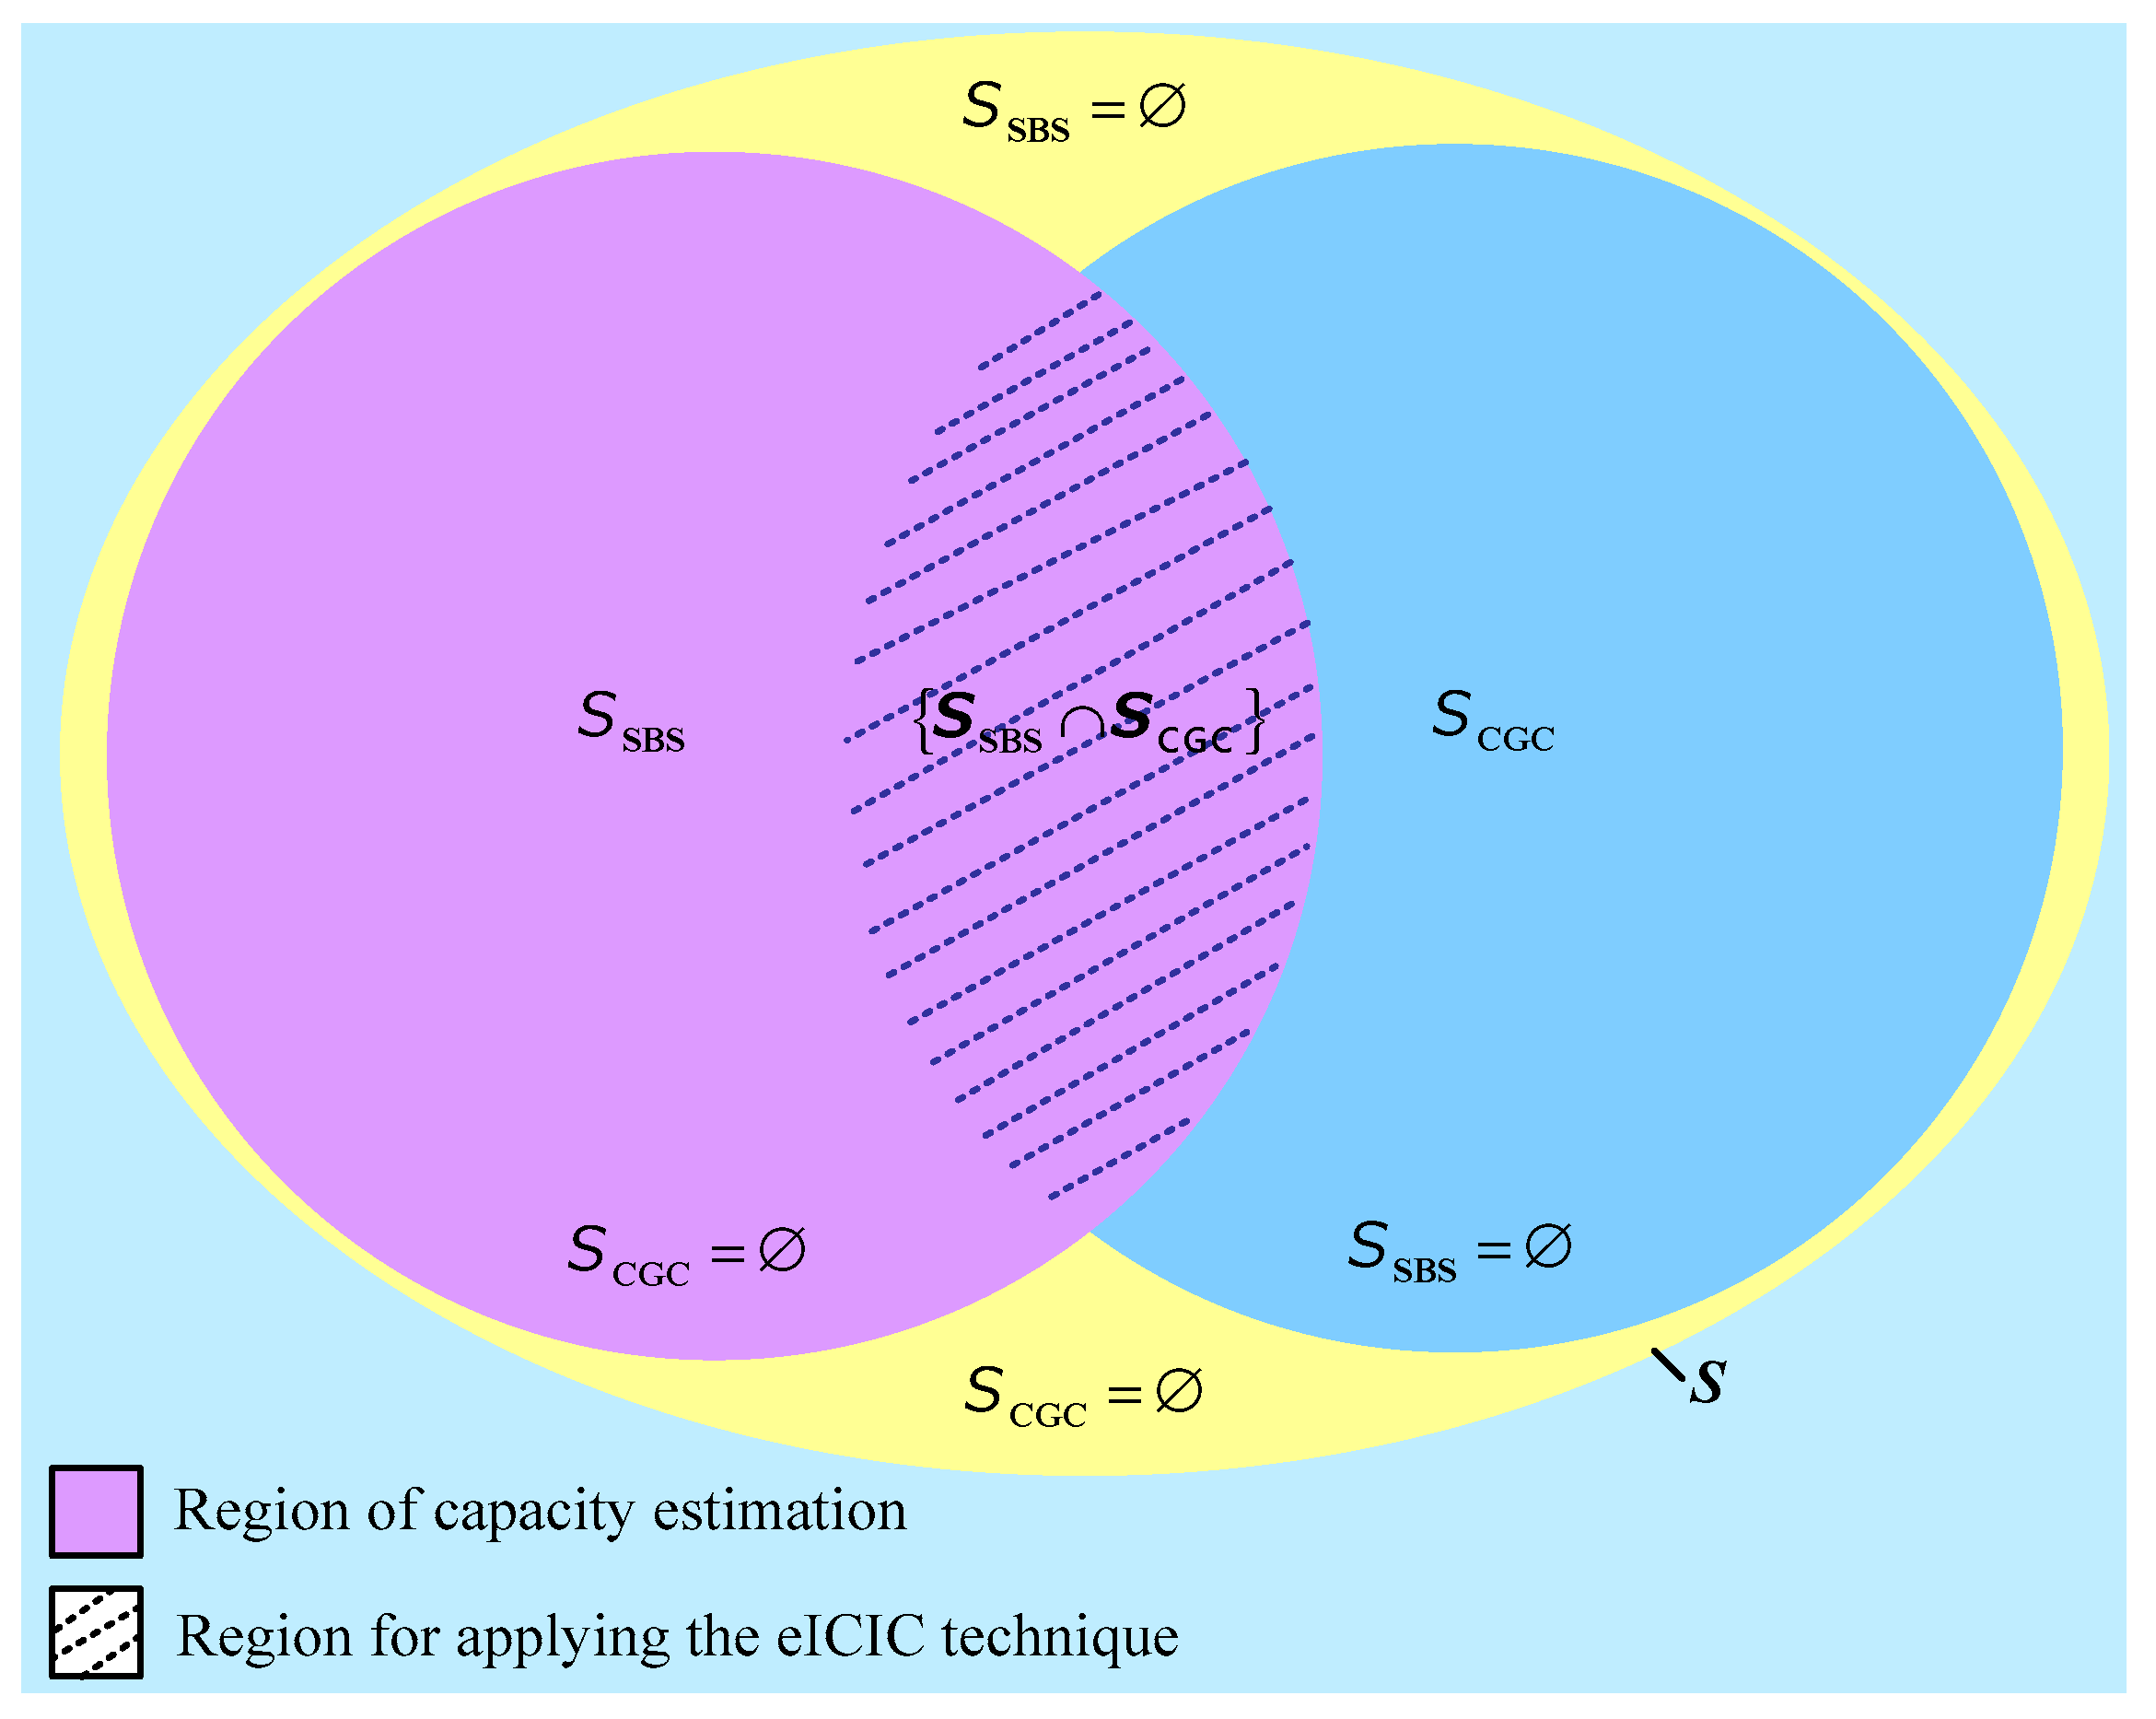
  • A subset of apartments deployed with neither a SBS nor a CGC station (i.e., { S SBS = , S CGC = } );
  • A subset of apartments deployed with only a SBS (i.e., { S SBS , S CGC = } );
  • A subset of apartments deployed with only a CGC station (i.e., { S SBS = , S CGC } ); and
  • A subset of apartments deployed with both a SBS and a CGC station (i.e., { S SBS , S CGC } ).
All these above subsets constitute the whole sample space S . Since we limited our focus to estimating only the capacity of aTMS, the deployment options 2 and 4 (i.e., the subset of apartments corresponding to { S SBS , S CGC = } and { S SBS , S CGC } ) in the sample space for the deployment are necessary to consider.
Note that if we assume that the deployment of either a SBS or a CGC station in an apartment map is the real value 1 and no deployment of either of them maps to 0. Hence, following all the possible deployment options of a SBS and a CGC station in an apartment, the sample space can be represented as S = {00, 10, 01, 11}, where each occurs with an equal probability of ¼.
Remark 1.
There are two possible equally likely deployment outcomes for both a SBS and a CGC station so that each outcome occurs with a probability of ½. Hence, an event concerning the outcome of a SBS and a CGC station occurs with the joint probability of (½ × ½) = ¼.

2.3. Spectrum Sharing and Interference Management

In this paper, we proposed sharing the whole spectrum of iSMS with in-building small cells of aTMS per building. Within each building, CGC stations serve satellite UEs, whereas SBSs serve small cell UEs. Since both CGC stations and SBSs within a building operate at the same satellite spectrum, co-channel interference can be generated when both CGC stations and SBSs serve their respective UEs at the same time. According to [26], a total of eight co-channel interference links may exist in a hybrid iSMS/aTMS. However, the long-distance between terrestrial components and a satellite station as well as the high external wall penetration loss of a building cause the interference strength between a satellite station and either a CGC station, a SBS, or a small cell UE to be insignificant. Hence, due to this reason, we can consider managing co-channel interference only among terrestrial components.
Note that for deployment option 2, due to the absence of a CGC station, no ABS based enhanced intercell interference coordination (eICIC) is needed to be applied. However, for deployment option 4, the ABS based eICIC technique is considered by applying it to avoid co-channel interference between a SBS and a CGC station in an apartment (Figure 3). We assumed similar deployment statistics for all buildings over the coverage of a macrocell.
For deployment option 4, we considered that the satellite spectrum could be shared by the collocated SBSs with the CGC stations by the following method based on the ABS based eICIC technique: If a SBS is collocated with a CGC station in an apartment in a building, and at least one satellite UE is present in the same apartment so that the satellite UE is within the common coverage of the SBS and the CGC station, a SBS can operate only during non-ABSs, whereas a CGC station can operate only during ABSs. Otherwise, the SBS, even though it is collocated with a CGC station, can operate in all TTIs at the satellite spectrum, as shown in Figure 3.

3. Mathematical Analysis

3.1. Estimation for a Single Building

3.1.1. Macrocell User Equipment (UE) Capacity

Let M aTMS denote the number of resource blocks (RBs) in aTMS spectrum bandwidth where an RB is equal to 180 kHz. Using (A3) in Appendix A, the aggregate capacity of aTMS for M aTMS RBs and Q TTIs is given by
σ aTMS = t = 1 Q i = 1 M aTMS σ t , i ( ρ t , i )
where σ and ρ are responses over M aTMS RBs of all macro UEs in t T. The average system-level spectral efficiency of aTMS in bps/Hz is given by
σ aTMS SE = σ aTMS / ( M aTMS × Q )
Let SF, SW, SP, and SM denote the number of small cells per building, the number of CGC stations per building, the number of picocells per macrocell, and the number of macrocells, respectively. Additionally, let P FC , SPS , P PC , and P MC denote the transmit power of a small cell, a picocell, and a microcell, respectively. Energy efficiency is defined as the amount of energy required to transmit a bit. Hence, the average energy efficiency of aTMS in joules/bit is given by
σ aTMS EE = ( ( S P × P PC ) + ( S M × P MC ) ) / ( σ aTMS / Q )

3.1.2. When Both SBSs and CGC Stations Are Collocated

Let M SPS denote the number of RBs in the satellite spectrum. Assume that each SBS can serve the maximum of U F , max UEs so that u { 1 , 2 , , U F , max } . Hence, by employing the ABS based eICIC technique to address co-channel interference between a SBS and a CGC station, the aggregate capacity of the small cell UEs for any SBS (i.e., σ s : s { 1 , 2 , , S F } , in t non - ABS T \ T ABS is given by
σ s , sb = t = t non - ABS T \ T ABS   i = 1 M SPS u = 1 U F , max σ t , i , u ( ρ t , i , u )
where σ and ρ are responses over M SPS RBs of u { 1 , 2 , , U F , max } UEs for any SBS. If each SBS serves the maximum of one UE (i.e., U FU , max = 1 ), then Equation (4) is given by
σ s , sb , 1 = t = t non - ABS T \ T ABS   i = 1 M SPS σ t , i ( ρ t , i ) .
If each SBS has exactly one small cell UE, and all SBSs are serving simultaneously in, t non - ABS T \ T ABS the aggregate capacity per 3D building is then given by
σ cl , sc SBS , CGC = s = 1 S F σ s , sb , 1

3.1.3. When Only a SBS is Deployed per Apartment

If only a SBS exists within an apartment, the satellite spectrum can be shared with the SBS without employing the ABS based eICIC technique due to the nonexistence of a CGC station in the apartment. Hence, the aggregate capacity of the small cell UEs for any SBS (i.e., σ s : s { 1 , 2 , , S F } ), when only a SBS exists per apartment in t T is given by
σ s , sb = t T i = 1 M SPS u = 1 U F , max σ t , i , u ( ρ t , i , u )
where σ and ρ are responses over M SPS RBs of u { 1 , 2 , , U F , max } UEs for any SBS. If each SBS serves the maximum of one UE (i.e., U FU , max = 1 ), then Equation (4) is given by
σ s , sb , 1 = t T i = 1 M SPS σ t , i ( ρ t , i )
If each SBS has exactly one small cell UE, and all SBSs are serving simultaneously, the aggregate capacity per 3D building is then given by
σ cl , sc SBS   only = s = 1 S F σ s , sb , 1

3.1.4. Overall System-Level Performances

Now, the overall system-level performances due to all SBSs per building, regardless of collocating with CGC stations, are given as follows. The overall capacity of small cells per building due to sharing the whole satellite spectrum orthogonally with all SBSs is given by
σ cl , sc , orth all   SBSs   = σ cl , sc SBS ,   CGC + σ cl , sc SBS   only
Therefore, the overall system-level capacity of aTMS due to sharing the satellite spectrum orthogonally with all SBSs per building is given by
σ aTMS , orth sys , all   SBSs = σ aTMS + σ cl , sc , orth all   SBSs
Remark 2.
The capacity achieved due to sharing the satellite spectrum can be interpreted as the additional capacity obtained due to reusing the satellite spectrum to in-building SBSs of aTMS. This is because of the fact that the satellite spectrum is proprietary, which is licensed by the iSMS provider, not by the aTMS operator. Hence, the effective aTMS’s spectrum, even after sharing the satellite spectrum, is only its licensed spectrum [22]. This explanation is equally applicable for orthogonal as well as non-orthogonal allocations of the satellite spectrum to in-building small cells.
Now, the overall spectral efficiency of aTMS due to orthogonal allocation of the satellite spectrum to all SBSs per building in bps/Hz is given by
σ aTMS , orth SE , all   SBSs = σ aTMS , orth sys , all   SBSs / ( M aTMS × Q )
Let T non - ABS sb ,   SPS denote the set of non-ABSs when both SBSs and CGC stations are collocated. Then, using Remark 1, the average system-level energy efficiency of aTMS per building due to all SBSs in joules/bit (J/b) is given by
σ aTMS , orth EE , all   SBSs = ( ( S F × ( 1 / 4 ) × ( | T non - ABS sb ,   SPS | / | T | ) × P FC , SPS ) + ( S F ( 1 / 4 ) × P FC , SPS ) + ( S P × P PC ) + ( S M × P MC ) ) / ( σ aTMS , orth sys , all   SBSs / Q )
Now, using (A7) in Appendix B, for the non-orthogonal allocation of the satellite spectrum with small cells per building, the system capacity improves by ξ reuse since the same satellite spectrum is reused to the same number of small cells per building by ξ reuse times. Hence, the overall system-level capacity, spectral efficiency, and energy efficiency of small cells of aTMS due to sharing the whole satellite spectrum non-orthogonally with all SBSs per building are given by Equations (14)–(16), respectively,
σ aTMS , non - orth sys , all   SBSs   = σ aTMS + ( ξ reuse × ( σ cl , sc SBS ,   CGC + σ cl , sc SBS   only ) )
σ aTMS , non - orth SE , all   SBSs = σ aTMS , non - orth sys , all   SBSs / ( M aTMS × Q )
σ aTMS , non - orth EE , all   SBSs = ( ( S F × ( 1 / 4 ) × ( | T non - ABS sb ,   SPS | / | T | ) × P FC , SPS ) + ( S F ( 1 / 4 ) × P FC , SPS ) + ( S P × P PC ) + ( S M × P MC ) ) / ( σ aTMS , non - orth sys , all   SBSs / Q )
From Equations (15) and (16), it can be found that data transmitted per Hz increases, whereas the energy required per bit transmission decreases by the factor ξ reuse when employing non-orthogonal allocation principle as compared to that when employing orthogonal allocation principle for sharing the satellite spectrum with the same number of small cells in a building.

3.2. Estimation for Multiple Buildings

Now, assume that L ≥ 1 (i.e., multiple buildings of small cells and CGC stations exist per macrocell of aTMS). Due to a small coverage of either a CGC station or a SBS, consider that the indoor propagation characteristics and the UEs’ distances from their respective SBSs or CGC stations in each building do not deviate significantly from one another. Hence, by linear approximation, the average aggregate capacities of aTMS for L buildings due to orthogonal allocation of the satellite spectrum is roughly given by
σ aTMS , orth , L sys , all   SBSs = σ aTMS + ( L × σ cl , sc , orth all   SBSs )
Now, the spectral efficiency for L buildings is given by
σ aTMS , orth , L SE , all   SBSs = σ aTMS , orth , L sys , all   SBSs / ( M aTMS × Q )
Additionally, the energy efficiency for L buildings is given by
σ aTMS , orth , L EE , all   SBSs = ( ( L × S F × ( 1 / 4 ) × ( | T non - ABS sb ,   SPS | / | T | ) × P FC , SPS ) + ( L × S F × ( 1 / 4 ) × P FC , SPS ) + ( S P × P PC ) + ( S M × P MC ) ) / ( σ aTMS , orth , L sys , all   SBSs / Q )
Likewise, the overall system-level capacity, spectral efficiency, and energy efficiency of small cells of aTMS due to sharing the satellite spectrum non-orthogonally with all SBSs for L buildings are given respectively by Equations (20)–(22),
σ aTMS , non - orth , L sys , all   SBSs   = σ aTMS + ( L × ( ξ reuse × ( σ cl , sc SBS ,   CGC + σ cl , sc SBS   only ) ) )
σ aTMS , non - orth , L SE , all   SBSs = σ aTMS , non - orth , L sys , all   SBSs / ( M aTMS × Q )
σ aTMS , non - orth , L EE , all   SBSs = ( ( L × S F × ( 1 / 4 ) × ( | T non - ABS sb ,   SPS | / | T | ) × P FC , SPS ) + ( L × S F × ( 1 / 4 ) × P FC , SPS ) + ( S P × P PC ) + ( S M × P MC ) ) / ( σ aTMS , non - orth , L sys , all   SBSs / Q )

4. Proposed Spectrum Sharing Algorithm and Optimal Number of ABSs

4.1. Proposed Spectrum Sharing Algorithm

The proposed spectrum sharing techniques are applicable for any type of satellite system including GEO and LEO. However, in general, each type of satellite system has both pros and cons, for example, a GEO satellite takes advantage of its large coverage but suffers from its long signal propagation delay [27]. Likewise, an LEO satellite takes advantage of its short signal propagation delay but suffers from its small coverage on the Earth. Hence, choosing a suitable satellite system depends solely on the requirements of the satellite system service provider. Moreover, the type of satellite (e.g., GEO and LEO) has an impact on the satellite channel link budgets so that the overall capacity of the iSMS can be affected. However, in this paper, we limited evaluating the performance to terrestrial-mobile systems only, not space-satellite systems, when sharing the satellite spectrum with terrestrial in-building small cells. Hence, the proposed spectrum sharing techniques can be useful, regardless of the type of satellite system, given that a mutual agreement exists to share the spectrum of the satellite service provider with indoor SBSs of a terrestrial-mobile system operator.
Algorithm 1 describes the logical operation of the iSMS/aTMS to address the proposed spectrum sharing techniques and interference management as described above. As shown in Algorithm 1, the satellite spectrum allocated to small cells per building is directly affected by ABSs per ABS pattern period (APP), in other words, a lower number of ABSs per APP helps increase the throughput of small cell UEs whereas decreasing the throughput of the satellite UEs. Hence, we considered finding an optimum number of ABSs to ensure fairness in the spectrum allocations in what follows.

4.2. Estimation of an Optimal Number of Almost Blank Subframes (ABSs)

The arrival rates of the UEs of SBSs and CGC stations are not the same, and typically, the average number of satellite UEs is relatively lower than that of SBS UEs over a certain duration of time. Under such a scenario, static allocation of satellite spectrum resources to CGC stations and SBSs suffers from unfairness in resource allocation. We considered overcoming this effect by allocating the satellite spectrum to the UEs of CGC stations and SBSs in proportion to the ratio of the average rate of arrivals of UEs of one node to another over a certain time period as the condition for optimality. Given that for apartments deployed with only SBSs, the SBSs can be made active over the whole duration of time, the concept of an optimal number of TTIs allocated to SBSs, in this case, does not need to be addressed. However, for apartments where both a CGC station and a SBS are collocated, we intend to explore the above concept for an optimal condition in order to find an optimal number of TTIs allocated to SBSs per building.
Algorithm 1 Proposed orthogonal and non-orthogonal spectrum sharing techniques
01: Input: MSPS, MaTMS, TAPP, t { 1 , 2 , 3 , , T } , L { 1 , 2 , 3 , , L max }
                 m SPS M SPS = { 1 , 2 , 3 , , M SPS } , m aTMS M aTMS = { 1 , 2 , 3 , , M aTMS }
02: For t { 1 , 2 , 3 , , T }
03:        For m aTMS M aTMS = { 1 , 2 , 3 , , M aTMS }
04:                Find σ aTMS using Equation (1) for all outdoor macro UEs
05:        End
06: End
07: For L { 1 , 2 , 3 , , L max }
08:    For t { 1 , 2 , 3 , , T }
09:      For m SPS M SPS = { 1 , 2 , 3 , , M SPS }
10:        Find the following subsets of apartments for the building L:
11:         { S SBS , S CGC } { S SBS = , S CGC = }
12:         { S SBS , S CGC } { S SBS , S CGC = }
13:         { S SBS , S CGC } { S SBS = , S CGC }
14:         { S SBS , S CGC } { S SBS , S CGC }
15:        Estimate ξ reuse = S F / Δ 3 D   cluster for the building L
16:          For { S SBS , S CGC } { S SBS , S CGC = } % non-collocated
17:           t   m SPS M SPS s SBS S SBS
18:          End
19:          For { S SBS , S CGC } { S SBS , S CGC } % collocated
20:                If t =   = T nABS T nABS
21:                     m SPS M SPS s SBS S SBS
22:                Elseif t =   = T ABS T ABS
23:                     m SPS M SPS s CGC S CGC
24:                End
25:            End
26:      End
27:    End
28: Find system-level capacity, spectral efficiency, and energy efficiency
      for the orthogonal allocation of the satellite spectrum with small cells
      for the building L using Equations (17)–(19)
29: Find system-level capacity, spectral efficiency, and energy efficiency
      for the non-orthogonal allocation of the satellite spectrum with small
      cells for the building L using Equations (20)–(22)
30: End
31: Estimate and Output: Plot system-level capacity, spectral efficiency,
            and energy efficiency for both orthogonal and non-orthogonal
            spectrum allocations to small cells for all L { 1 , 2 , 3 , , L max } .
Note that in nOSS, an optimal number of TTIs is estimated for the average number of SBSs and CGC stations per 3D cluster of these nodes, instead of per building, as in the case of OSS. According to [28,29], sessions or call arrivals can be modeled as a Poisson process. Let λ SC and λ SU denote the average rate of arrivals of UEs to the CGC stations and SBSs over a certain duration of time T so that the solution of an optimal number of TTIs allocated to SBSs can be found by solving the following problem, subject to the above concept as the condition for optimality. We considered that the UEs of SBSs operate during non-ABSs per APP, whereas the UEs of CGC stations operate during ABSs, so that in favor of the SBSs (i.e., aTMS), the problem can be formulated as follows.
min T ABS subject   to : ( a )   λ SC / λ SU = T nABS / T APP ( b )   { S SBS , S CGC } { S SBS , S CGC } ( c )   T APP ( T ABS + T nABS = T APP : T ABS = Ν 0 T nABS = Ν 0 ) ( d )   P T , SBS = P T , CGC P T , SBS max
An optimal value in favor of small cell UEs is given by
T nABS = λ SC / ( λ SU + λ SC ) × T APP .
Proof. 
Using constraint (23) (a) and (23) (c), and allowing a favor to the UEs of SBSs (i.e., aTMS), the optimal value of TnABS can be given by
  λ SC / λ SU = T nABS / T ABS λ SC / λ SU = ( T APP T ABS ) / T ABS ( λ SC / λ SU ) × T ABS = T APP T ABS
( λ SC / λ SU + 1 ) × T ABS = T APP T ABS = 1 / ( λ SC / λ SU + 1 ) × T APP T ABS = λ SU / ( λ SC + λ SU ) × T APP T APP T nABS = λ SU / ( λ SC + λ SU ) × T APP T nABS = ( 1 λ SU / ( λ SC + λ SU ) ) × T APP T nABS = ( λ SC / ( λ SC + λ SU ) ) × T APP
Then, T ABS = ( 1 T nABS ) × T APP . □
In other words, the number of TTIs allocated to SBSs in those apartments where they are collocated with CGC stations per building or per 3D cluster is directly proportional to the ratio of the average rate of arrival of the UEs to SBSs to the sum of the average rates of arrival of UEs to both the SBSs and CGC stations.

5. Parameters, Assumptions, and Preliminary Estimations

5.1. Default Parameters and Assumptions

Following [22], Table 1 shows the default parameters and assumptions considered for the performance evaluation of both orthogonal and non-orthogonal spectrum sharing techniques. Since we limited evaluating the performance of aTMS only in a hybrid iSMS/aTMS, no channel link models for the satellite system (i.e., iSMS) are given explicitly in Table 1. However, we explicitly modeled the terrestrial channel models depending on the type of BSs (e.g., macrocell BS, picocell BS, or SBS) and the environmental profiles (e.g., indoor or outdoor). The performance evaluation and analysis carried out are completely independent of the satellite channel models and hence are not affected by the satellite channel models.
Furthermore, we considered an ideal scenario for the mobility of satellite spot-beams so that there was no impact of the type of satellite spot-beam cells (e.g., geostationary for a GEO satellite or non-geostationary for an LEO satellite) on the capacity of aTMS. Furthermore, as given in Table 1, we considered two component carriers (i.e., channel bandwidths) each with 20 MHz, resulting in a 40 MHz system bandwidth for the performance evaluation of fourth-generation (4G) LTE systems. Likewise, since the FCC proposed to deploy SBSs in the 3.5 GHz satellite band (i.e., 3550 MHz–3650 MHz frequency band used for the satellite system globally [17]), we also assumed that the satellite system operates at 3.5 GHz (i.e., S-band) with a total system bandwidth of 40 GHz. Furthermore, the performance results were generated by a simulator built using the computational tool MATLAB R2012b.

5.2. Defining Cluster Size for nOSS

To define a 3D cluster size in a building, using Table 1 and employing (A4) and (A5) in Appendix B, we can find that d planer 12   m and d linear 7.07   m or equivalently d ver 5   m (Figure A1). Allowing these minimum distances between co-channel SBSs requires SBSs on both the intra-floor and inter-floor levels to stay apart from one another by at least 1-tier, resulting in each 3D cluster (Figure A1) consisting of eight apartments (i.e., four apartments per floor multiplied by two floors). Since we assumed that each building consisted of 32 apartments, there were four 3D clusters in total per building (i.e., ξ reuse = 4 ), so the same satellite spectrum can be reused four times per building.

5.3. Estimating the Number of Apartments Containing SBSs and the Amount of Satellite Spectrum

Recall that SBSs and CGC stations can be deployed in four ways within an apartment, as shown in Figure 2, and the probability of occurrence of a deployment option is equally likely with others so that the occurrence of a deployment option comprises of one-fourth of the total number of apartments per building. Hence, each of the four subsets of apartments corresponding to any deployment option consists of eight apartments per building. Since RBs of the satellite spectrum are allocated orthogonally to nodes per building in any TTI, and the occurrence of any deployment option is equally likely, for the fairness and simplicity in modeling, we assumed that the whole satellite spectrum was allocated equally to each subset of apartments so that the spectrum allocated to each subset of apartments was one-fourth of the total satellite spectrum (i.e., 10 MHz per subset of apartments for the satellite spectrum of 40 MHz). As mentioned earlier, out of the four subsets, only two subsets corresponded to include at least one SBS so only 50% of the total satellite spectrum can be utilized per building when considering an orthogonal allocation of spectrum resources.

6. Performance Result and Comparison

6.1. Performance Result

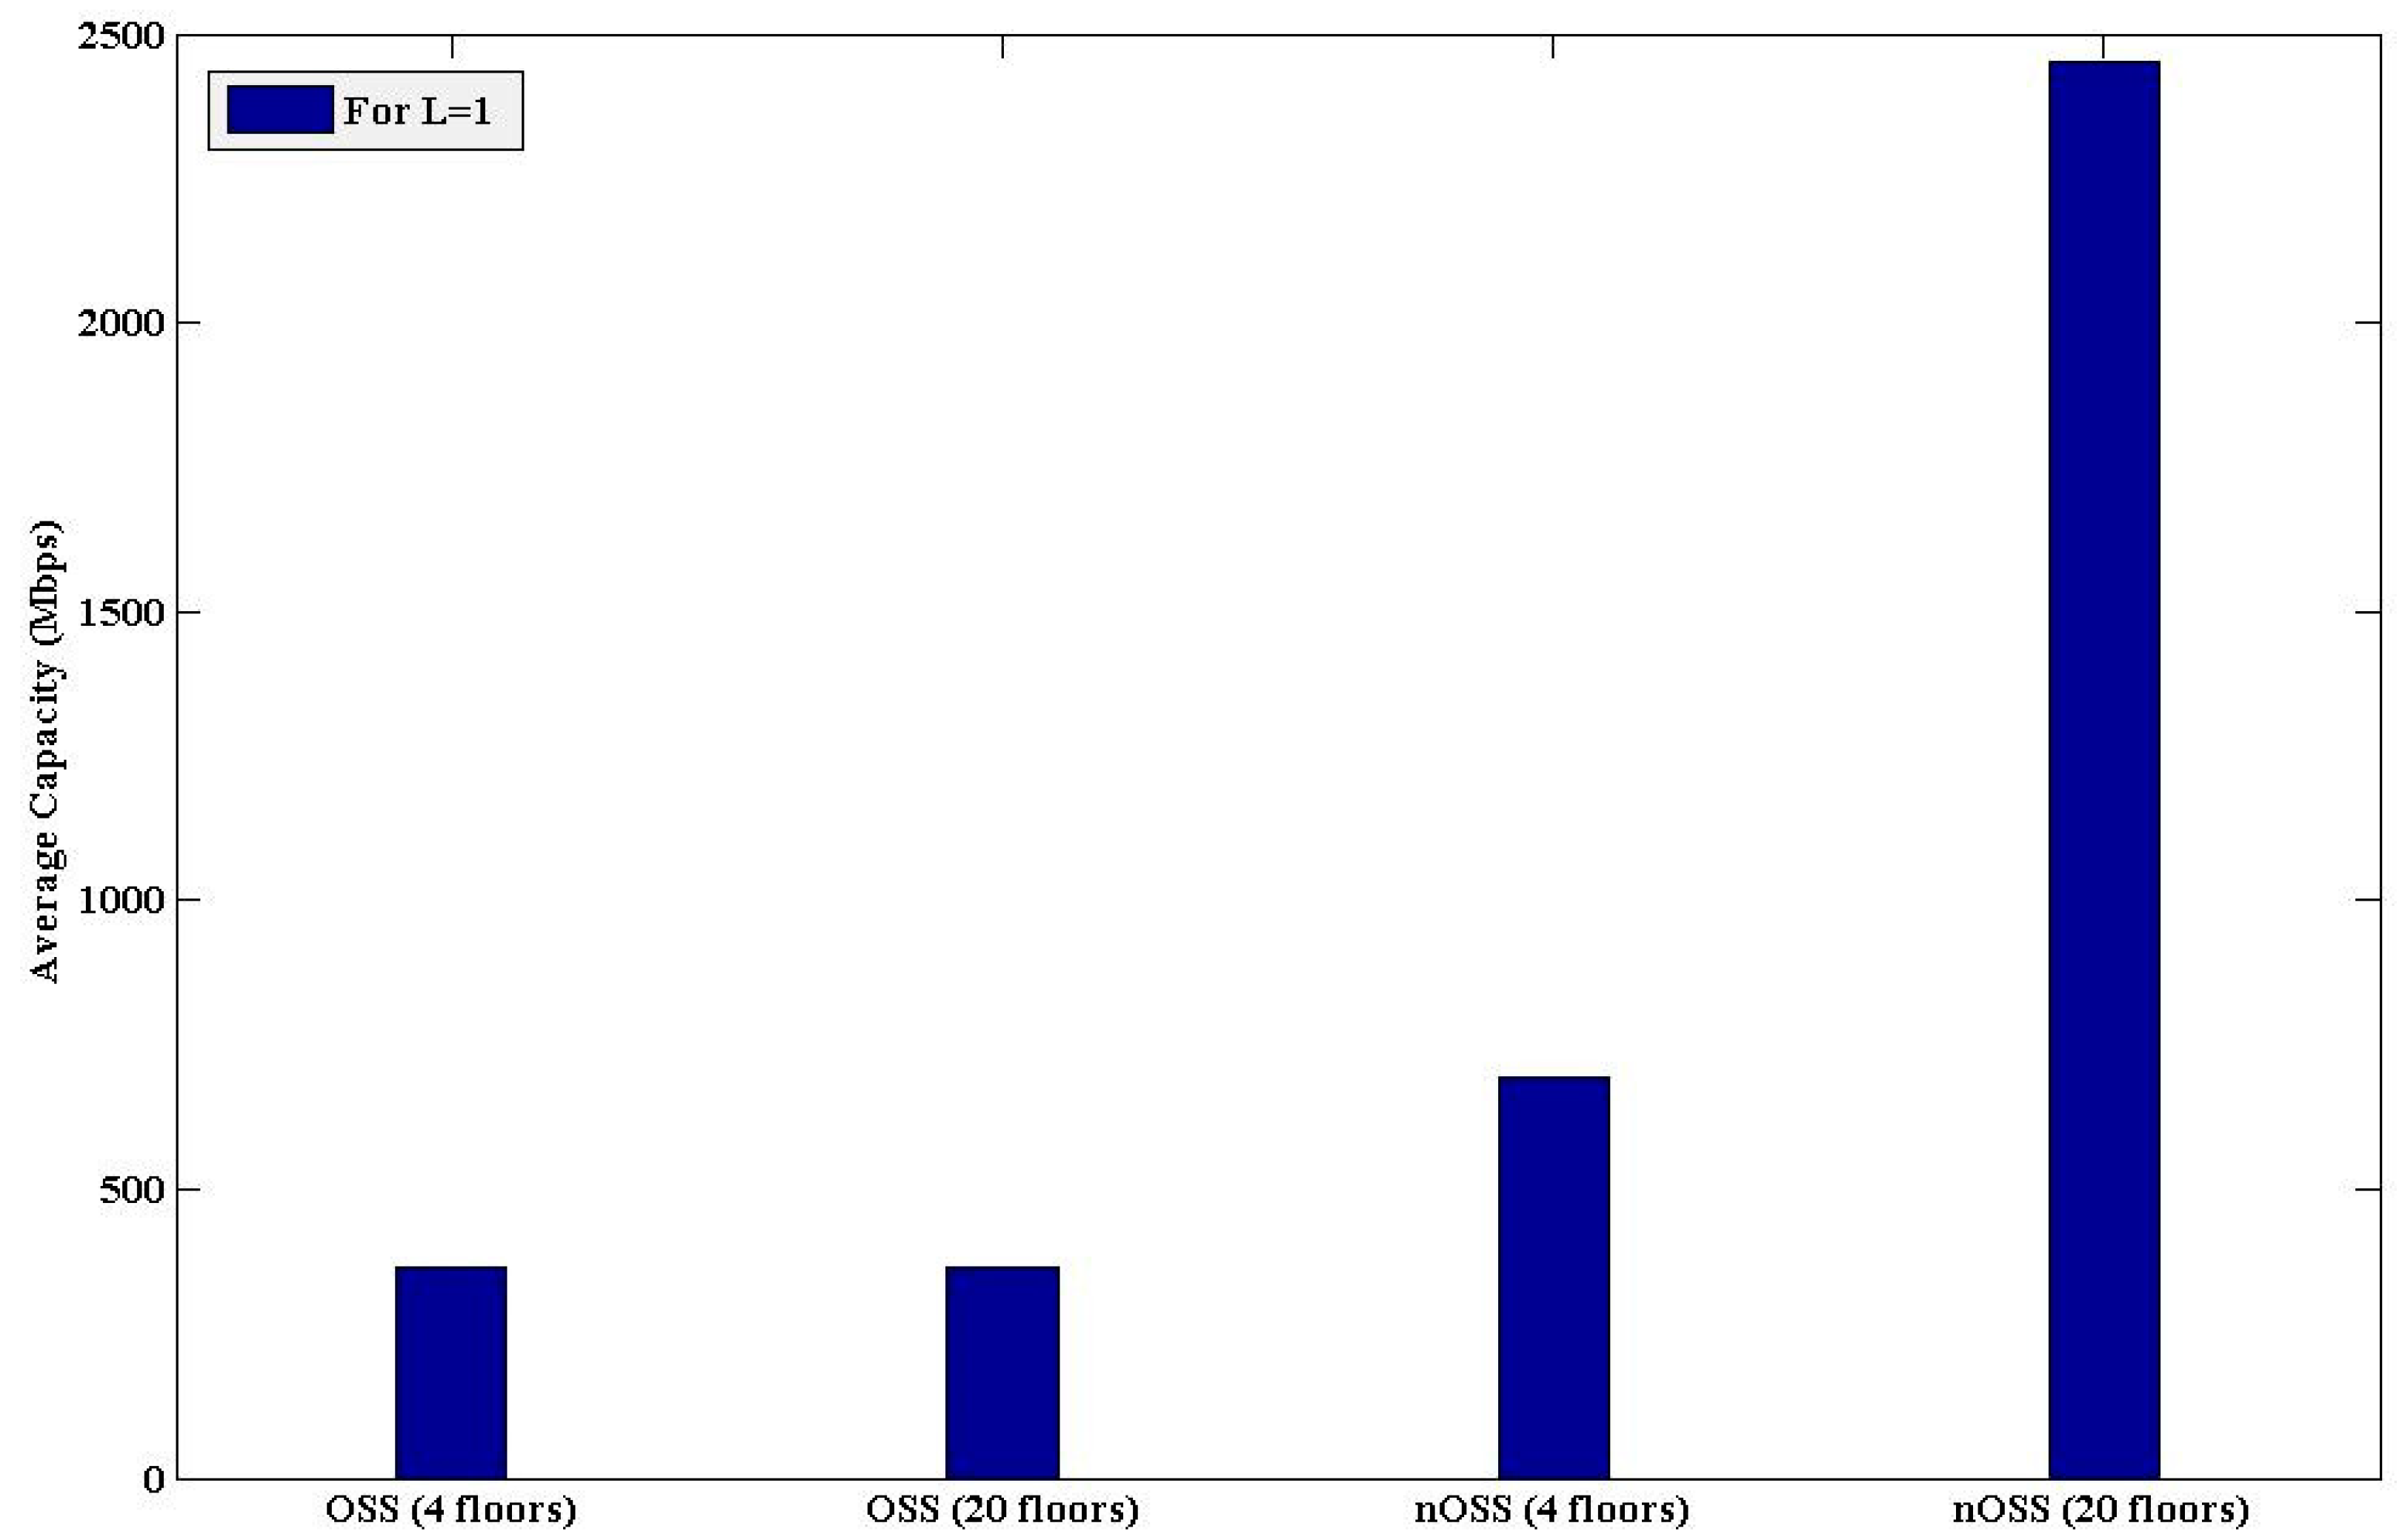
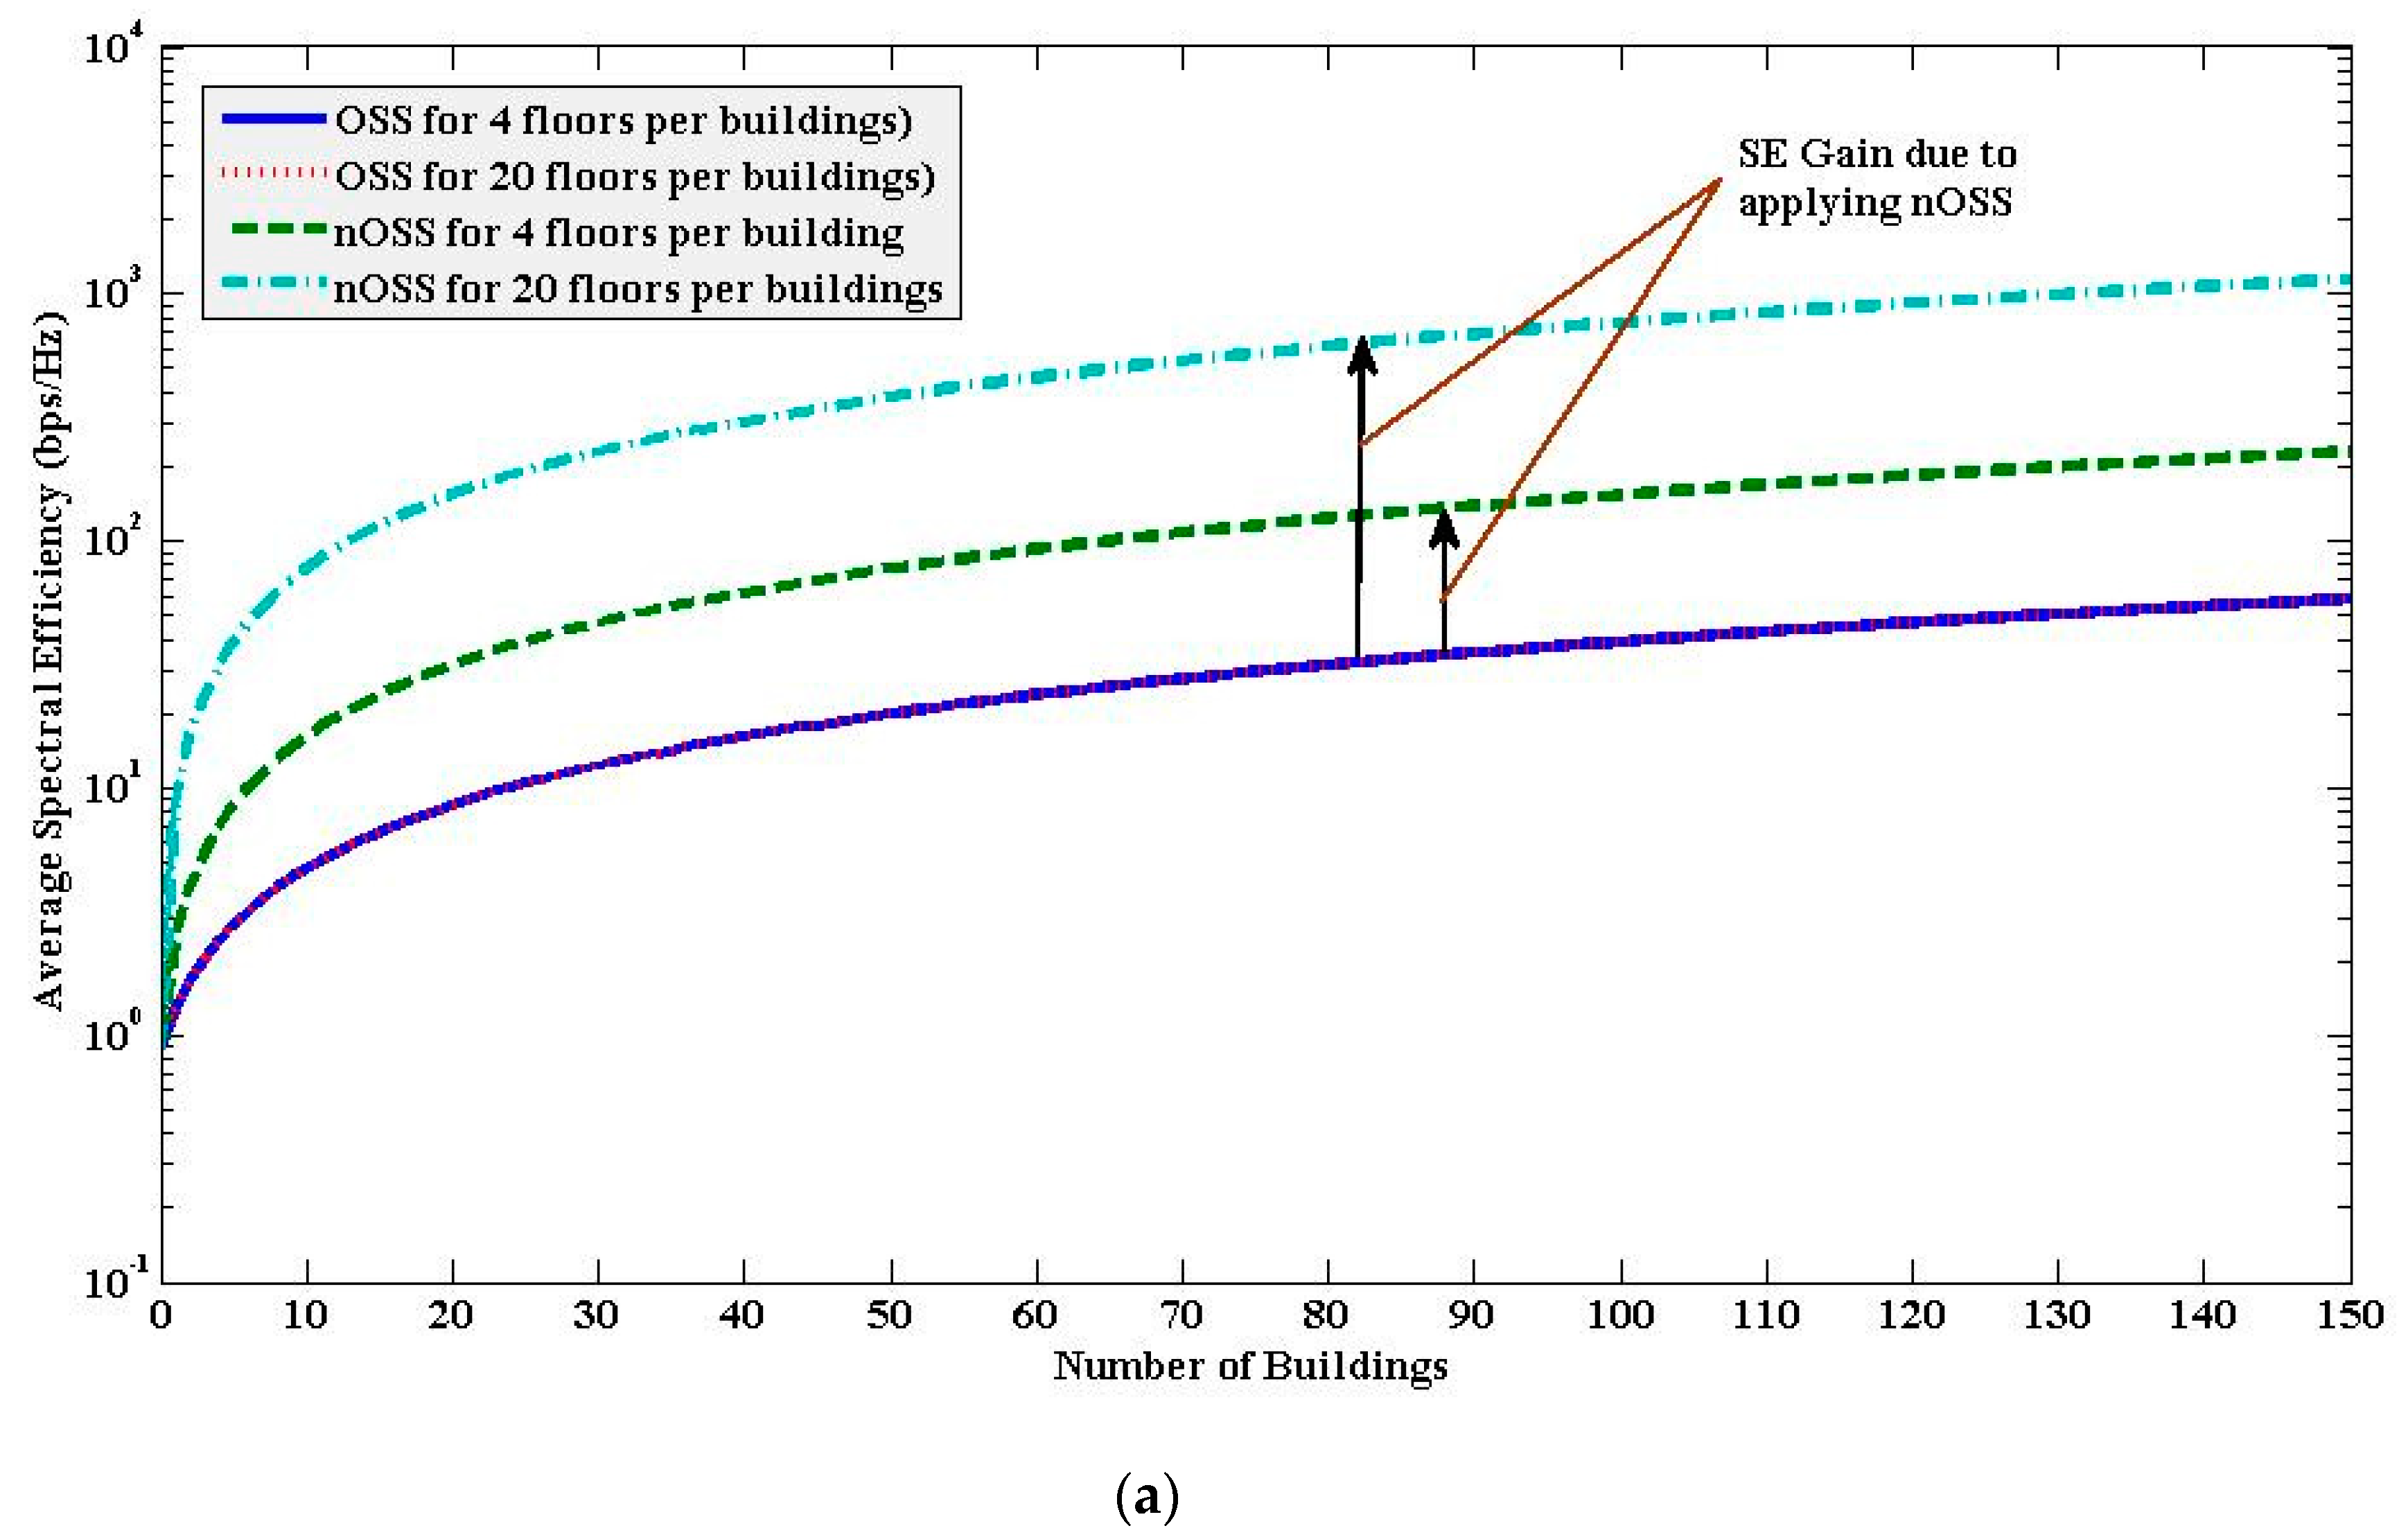
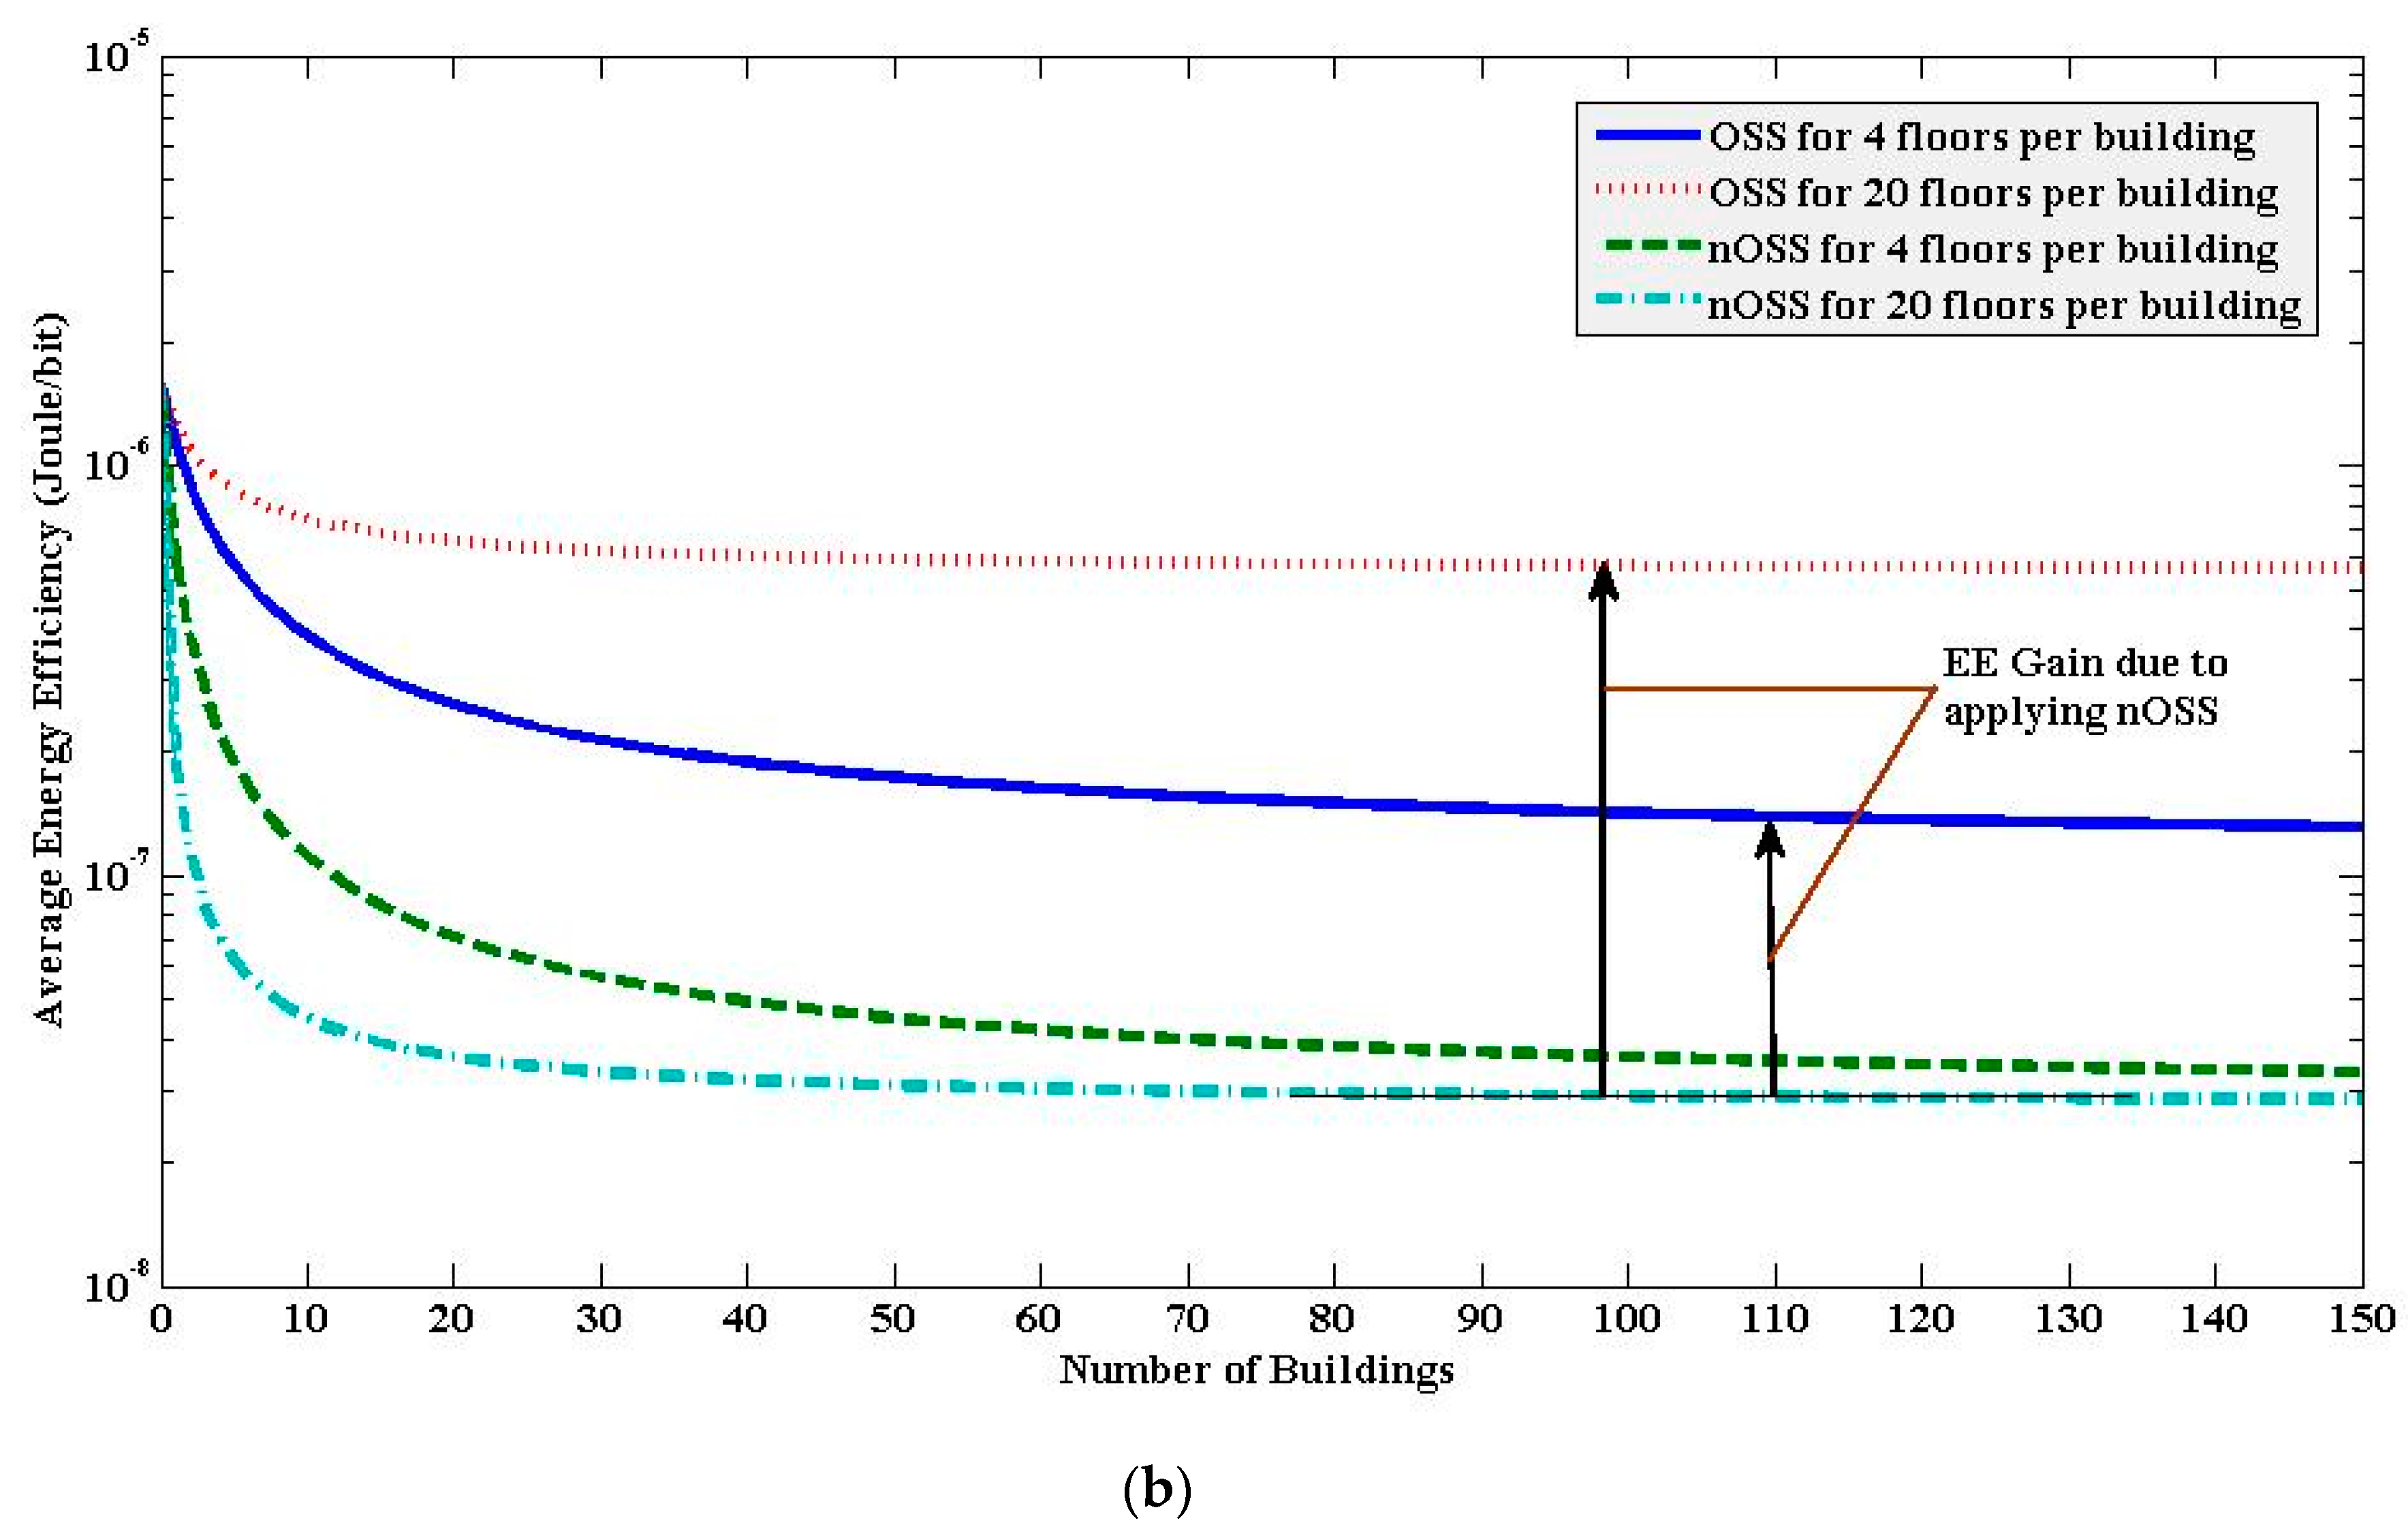
6.1.1. Capacity, Spectral Efficiency, and Energy Efficiency Performances

We considered two cases to evaluate the performances of OSS and nOSS. Case 1 considered four floors per building, whereas case 2 considered 20 floors per building, with a maximum of eight apartments per floor per building in each case. Recall that for d planer 12   m and d linear 7.07   m or equivalently d ver 5   m , each 3D cluster (Figure A1) consists of eight apartments with four apartments per floor. Since in case 1 we assumed that each building consisted of four floors (i.e., 32 apartments), there were in total four 3D clusters of SBSs per building (i.e., ξ reuse = 4 ). In case 2, we considered increasing the number of floors per building from four in case 1 to 20, which is typical in dense urban environments, so that the number of apartments per building becomes 160. Now, considering the same minimum distances between co-channel SBSs of d planer 12   m and d linear 7.07   m or equivalently d ver 5   m like case 1, the number of 3D clusters per building becomes ( 160 / 8 ) = 20 (i.e., ξ reuse = 20 ).
Figure 4 shows the capacity performance response of aTMS for both OSS and nOSS for case 1 and case 2 with SBSs for a single building (i.e., L = 1). From Figure 4, it can be found that the achievable capacities using nOSS in both cases considerably outperformed the corresponding capacities when using OSS. This is due to the fact that the same satellite spectrum can be reused four times in case 1 and 20 times in case 2 to the SBSs per building when using nOSS compared to when using OSS. Furthermore, from Figure 4, it can be found that due to reusing the same 40 MHz satellite spectrum for both case 1 and case 2, there was no change in capacity and hence spectral efficiency performances using OSS (Figure 5a). However, energy efficiency using OSS in case 2 decreased significantly as shown in Figure 5b when compared to that in case 1, due to a greater consumption of power by more SBSs in case 2 than that by the SBSs in case 1. A noticeable observation was that due to considering more realistic modeling (i.e., non-collocated deployment of SBSs and CGC stations in an apartment), OSS suffered from obtaining high spectral efficiency even though the same satellite spectrum was reused to SBSs deployed in multiple buildings (Figure 5a). This drawback can be overcome easily by adopting the nOSS with SBSs within the same building, as shown in Figure 5a.
From Figure 5, it can be found that, in general, nOSS outperformed OSS irrespective of the number of floors per building in terms of both spectral efficiency and energy efficiency. More specifically, due to extensive reuse of the same spectrum vertically to SBSs per building, both spectral efficiency and energy efficiency performances using nOSS for case 2 improved significantly when compared to the corresponding spectral efficiency and energy efficiency performances using OSS in case 1 and case 2 as well as using nOSS for case 1. Furthermore, even though energy efficiency improved negative exponentially for low values of L and became almost steady for high values of L, spectral efficiency improved proportionally as L increased due to having had a significant vertical spectrum reuse gain per building, resulting in a substantial gap between spectral efficiency gains due to nOSS and OSS (Figure 5a).
Note that the steadiness in energy efficiency performances using OSS and nOSS in both cases for higher values of L can be clarified by Equation (22) for energy efficiency where it can be found that the aggregate transmission power due to the macrocell BS and picocell BSs had a considerable impact on that of the SBSs due to the low transmission power of each SBS. However, as L increased considerably, the impact of aggregate transmission power as well as the aggregate capacity of the macrocell BS and picocell BSs became insignificant when compared to that of SBSs, resulting in canceling the presence of L in both the denominator and the numerator, leaving energy efficiency performance with L almost constant. On the contrary, Equations (20) and (21) imply that spectral efficiency varies proportionally with L. Hence, to make a trade-off between these efficiencies with reasonable performances, a value of SBS density in terms of L can be set up based on the operators’ requirements.

6.1.2. Impact of Co-Channel Interference on System Performances

We considered a set of arbitrary scenarios shown in Table 2 to show the impact of both intra-floor and inter-floor co-channel interference thresholds on achieving a certain target for capacity, spectral efficiency, and energy efficiency. The data for both intra-and inter-floor levels for four floors per building, as shown in Figure 5, were considered as the baseline. By increasing the number of floors per building to 20 without changing the number of apartments (i.e., SBSs, per floor), the size of each 3D cluster of SBSs per building was estimated.
Table 2 shows the size of 3D cluster sizes for a number of scenarios and the corresponding resource reuse times per building by varying the interference thresholds both intra- and inter-floor levels with respect to the baseline data. It can be found that relaxing (i.e., increasing either intra-floor or inter-floor or both) results in a corresponding decrease in 3D cluster size for the same number of apartments per building and increasing ξ reuse and vice versa. Due to greater reuse of the same spectrum vertically within a building to SBSs, an increase in ξ reuse per building decreased the required number of buildings L to deploy in real 2-dimensional (2D) space on Earth in order to achieve a certain target value of capacity, spectral efficiency, and energy efficiency for next-generation mobile communication systems. Note that both the intra-floor and inter-floor co-channel interference effects at UEs within a building can be managed by applying techniques such as transmission power control mechanisms to in-building SBSs.

6.2. Performance Comparison

We evaluated the spectral efficiency and energy efficiency performances of both the orthogonal and non-orthogonal spectrum sharing techniques with respect to that required for 5G mobile networks. It is expected that 5G mobile networks will be able to deliver an average spectral efficiency of 24–37 bps/Hz [32,33] and energy efficiency of 3 μ J / b [34,35]. Now using Figure 5, the values of L required to meet both spectral efficiency and energy efficiency requirements for 5G networks as aforementioned using OSS, nOSS with four floors per building, and nOSS with 20 floors per building are 94, 24, and 5, respectively. This implies that nOSS with more vertical reuse of spectrum (i.e., the higher upper limit of aggregate co-channel interference effect at a UE both intra-floor and inter-floor levels) requires less density of small cells than that required by OSS and nOSS with lower aggregate interference thresholds to meet both the spectral efficiency and energy efficiency demands for 5G networks. This in turn, results in reducing costs as well as complexity from the deployment, maintenance, and operation of in-building small cells.

7. Conclusions

In this paper, we presented two spectrum sharing techniques, namely orthogonal spectrum sharing (OSS) and non-orthogonal spectrum sharing (nOSS), for a multisystem consisting of an integrated satellite-mobile system and an autonomous terrestrial-mobile system (iSMS/aTMS). OSS shares the whole satellite spectrum of iSMS/aTMS with all small cells per building of aTMS, whereas nOSS shares the whole satellite spectrum with only small cells per 3D cluster per building where a 3D cluster consists of a set of small cells within a building located in both intra-floor and inter-floor levels subject to satisfying co-channel interference constraints in both intra-and inter-floor levels. A realistic dynamic deployment of CGC stations and SBSs per apartment in each building has been considered so that the existence of a SBS and a CGC station in any time in an apartment of a building follows two independent and random processes with an equally likely occurrence of each deployment option for SBSs and CGC stations. Additionally, we developed an interference management strategy to avoid co-channel interference and deduced an optimal number of ABSs per APP to ensure a fair allocation of time resources in apartments with collocated CGC stations and small cells. Furthermore, we derived system-level capacity, spectral efficiency, and energy efficiency performance metrics as well as developed an algorithm for both OSS and nOSS techniques.
With extensive system-level simulation and numerical results and analysis, it has been shown that, in general, aggregate capacity and spectral efficiency improve proportionally as the number of buildings of small cells L increases, whereas energy efficiency improves negative exponentially for low values of L and becomes almost steady for high values of L for both OSS and nOSS techniques. Since the same satellite spectrum can be reused more than once to SBSs per building using nOSS, compared to when using OSS, nOSS outperformed OSS in terms of capacity, spectral efficiency, and energy efficiency. Furthermore, by increasing the value of the aggregate co-channel interference threshold in the intra-floor and inter-floor levels, the required minimum distance between co-channel small cells can be reduced. This results in increasing the number of 3D clusters of small cells, which correspondingly increases the number of times the same satellite spectrum can be reused to the same number of small cells in a multistory building, and vice versa. Finally, it has been shown that, with a lower density of small cells by nOSS than that required by OSS, both OSS and nOSS can meet the expected spectral efficiency and energy efficiency requirements for 5G mobile networks.

Funding

This research received no external funding.

Acknowledgments

This paper was presented partly at the 2019 Joint Conference on Satellite Communications (JC SAT 2019), JR Hakata City, Fukuoka, Japan, 10–11 October 2019 [22]. This paper is a technical report without peer review, published by IEICE in the IEICE Technical Report SAT2019-61(2019-10), pp. 103–108, and hence, its polished and/or extended version may be published elsewhere [22].

Conflicts of Interest

The author declares no conflict of interest.

Appendix A. Link Throughput

Let T denote the simulation run time with the maximum time of Q, each lasting 1 ms, so that T = {1, 2, 3, …, Q} and hence | T | = Q . Let TABS denote the number of ABSs in every APP of eight subframes so that TABS = {t: t = 8v + z; v = 0, 1, 2,…, Q/8; z = 1,…, TABS} where TABS = 1, 2,…, 8 corresponds to ABS patterns φ = 1/8, 2/8, …, 8/8, respectively. The received signal-to-interference-plus-noise ratio for a UE at RB = i in TTI = t is given by
ρ t , i = ( P t , i / ( N t , i s + I t , i ) ) .   H t , i
where P t , i is the transmit power; N t , i s is the noise power; I t , i is the total interference signal power; and H t , i is the link loss for a link between a UE and a BS at RB = i in TTI = t.
H t , i can be expressed in dB as
H t , i ( dB ) = ( G t + G r ) ( L F + P L t , i ) + ( L S t , i + S S t , i )
where ( G t + G r ) and L F are total antenna gain and connector loss, respectively. L S t , i , S S t , i , and P L t , i denote shadowing effect, small scale Rayleigh or Rician fading, and path loss between a BS and a UE at RB = i in TTI = t, respectively.
Using Shannon’s capacity formula, a link throughput at RB = i in TTI = t in bps per Hz is given by [36,37]
σ t , i ( ρ t , i ) = { 0 ,   ρ t , i < 10   dB β log 2 ( 1 + 10 ( ρ t , i ( dB ) / 10 ) ) , 10   dB ρ t , i 22   dB 4.4 ,   ρ t , i > 22   dB }
where β is considered as the implementation loss factor.

Appendix B. Modeling In-Building 3D Clusters of Nodes for nOSS

For simplicity in modeling, we assumed that the deployment pattern of CGC stations followed the same as that of the SBSs and the transmit power of each CGC station and each SBS was the same power. Such assumptions help to set a minimum distance between co-channel CGCs and co-channel SBSs resulting in forming clusters (i.e., a group of nodes allocated with orthogonal RBs where a node can be either a CGC station or a SBS) of the same size for both CGC stations and SBSs. We assumed that there was at most one CGC station or one SBS per apartment as shown in Figure A1.
We considered adopting the model proposed by the authors in [25] to define a 3D cluster of nodes in a building under co-channel interference constraints. Note that as shown in Figure A1, each 3D cluster of nodes consist of nodes in the intra-floor level as well as inter-floor levels, so that the minimum distances between co-channel nodes in intra-floor level d planer and inter-floor d linear level can be given by [25]
d planer * d min   ( y max , planer / α thr , planer )   1 / 3
Figure A1. nOSS with small cells in a building for 3D clustering of SBSs: (a) 3D clustering within a building, (b) Intra-floor interference modeling.
Energies 13 00748 g0a1
d linear * d min   ( 10   ( α f ( d linear * ) / 10 )   ( y max , linear / α thr , linear ) )   1 / 3
where α thr , planer and α thr , linear denote co-channel interference thresholds set by the operator at a serving UE in intra-floor and inter-floor levels, respectively. d min = 5   m for the 10 × 10 m2 apartment. y max , planer = 8 is the maximum number of intra-floor co-channel nodes and y max ,   linear = 1 for the single-sided and y max ,   linear = 2 for the double-sided inter-floor co-channel nodes.
Hence, the number of nodes in the intra-floor level can be expressed as follows:
Δ planer = ε planer 2
where ε planer denotes the maximum number of tiers of nodes corresponding to d planer in Figure A1 and is given by
ε planer = ceil   ( d planer * + ( a / 2 ) / a )
where a = 10 m. Likewise, if ε linear represents the maximum number of tiers of nodes at the inter-floor level and is given by
ε linear = ceil   ( d linear * / d ver )
where d ver denotes the vertical distance between adjacent floors. Now, the size of a 3D cluster of nodes can be expressed as follows:
Δ 3 D   cluster = ε linear × Δ planer
Interested readers are encouraged to refer to [25] for a more detailed description of modeling 3D clusters. Assume that SF and SC denote respectively the maximum number of small cells, (i.e., femtocells) and CGC stations per building so that s { 1 , 2 , , S F } and c { 1 , 2 , , S C } for SFSC. Let ξ reuse denote the spectrum reuse factor per building of small cells so that using (A6), it can be expressed as follows.
ξ reuse = S F / Δ 3 D   cluster
The above expression implies the fact that the same satellite spectrum can be shared with small cells per building with the nOSS technique ξ reuse times than that performed by the OSS technique.

References

  1. Japan Assigns 5G Spectrum to Four Operators 5G Observatory. Available online: https://5gobservatory.eu/japan-assigns-5g-spectrum-to-four-operators/ (accessed on 27 January 2020).
  2. MIC the Radio Use Website. Available online: https://www.tele.soumu.go.jp/resource/e/search/myuse/use0303/10000m.pdf (accessed on 27 January 2020).
  3. Gohar, M. From 4G to 5G. In Opportunities in 5G Networks: A Research and Development Perspective, 1st ed.; Hu, F., Ed.; CRC Press: Boca Raton, FL, USA, 2016; pp. 33–34. [Google Scholar]
  4. Report: 80% of All Mobile Data is Consumed by Just 10% of Users. Available online: https://gigaom.com/2015/02/04/report-80-of-all-mobile-data-is-consumed-by-just-10-of-users/ (accessed on 27 January 2020).
  5. Saha, R.K. Nationwide Spectrum Sharing of Mobile Network Operators with Indoor Small Cells. In Proceedings of the 2019 IEEE International Symposium on Dynamic Spectrum Access Networks (DySPAN), Newark, NJ, USA, 11–14 November 2019; pp. 1–2. [Google Scholar]
  6. Deslandes, V.; Tronc, J.; Beylot, A.-L. Analysis of Interference Issues in Integrated Satellite and Terrestrial Mobile Systems. In Proceedings of the 5th Advanced Satellite Multimedia Systems Conference, Cagliari, Italy, 13–15 September 2010; pp. 256–261. [Google Scholar]
  7. Park, U.; Kim, H.W.; Oh, D.S.; Chang, D.L. Performance Analysis of Dynamic Resource Allocation for Interference Mitigation in Integrated Satellite and Terrestrial Systems. In Proceedings of the 9th International Conference on Next Generation Mobile Applications, Services and Technologies, Cambridge, UK, 9–11 September 2015; pp. 217–221. [Google Scholar]
  8. Scenarios and Performance of an Integrated MSS System Operating in Frequency Bands Below 3 GHz; CH-1211 Genève 20 Suisse, Report ITU-R M.2398-0; International Telecommunication Union—Radio communication sector (ITU-R): Geneva, Switzerland, 2016.
  9. Hybrid Satellite-Terrestrial System. Available online: http://tec.gov.in/pdf/Studypaper/Hybrid%20Satellite_Terrestrial%20Systems_Study Paper_Final.pdf (accessed on 2 October 2018).
  10. Feng, W.; Ge, N.; Lu, J. Coordinated Satellite-Terrestrial Networks: A Robust Spectrum Sharing Perspective. In Proceedings of the 26th Wireless Optical Communication Conference (WOCC), Newark, NJ, USA, 7–8 April 2017; pp. 1–5. [Google Scholar]
  11. Monte, P.A. Resource Allocation to Terrestrial and Satellite Services. U.S. Patent 8 594 682 B2, 21 Febuary 2012. [Google Scholar]
  12. Mayfield, A. Commercial System Employing Reuse of Satellite Spectrum for Terrestrial Communication. U.S. Patent 6 735 437 B2, 11 May 2004. [Google Scholar]
  13. Satellite Earth Stations and Systems (SES). Advanced Satellite Based Scenarios and Architectures for Beyond 3G Systems; TR 102 662, ver. 1.1.1; European Telecommunications Standards Institute (ETSI): Sophia Antipolis Valbonne, France, 2010. [Google Scholar]
  14. Use and Examples of Mobile-Satellite Service Systems for Relief Operation in The Event of Natural Disasters and Similar Emergencies; CH-1211 Genève 20 Suisse, Report ITU-R M.2149-1; International Telecommunication Union—Radio communication sector (ITU-R): Geneva, Switzerland, 2011.
  15. In Proceedings of the Federal Communications Commission (FCC), 445 12th Street, SW, Washington, DC, USA, 12 December 2012. Available online: https://www.fcc.gov/document/fcc-proposes-innovative-small-cell-use-35-ghz-band (accessed on 29 October 2018).
  16. Study on New (NR) to Support Non Terrestrial Networks (Release 15); document 3GPP TR 38.811; 3rd Generation partnership Project (3GPP): Sophia Antipolis Valbonne, France, 2018.
  17. Khawar, A.; Ahmad, I.; Sulyman, A.I. Spectrum Sharing Between Small Cells and Satellites: Opportunities and Challenges. In Proceedings of the IEEE ICCW, London, UK, 8–12 June 2015; pp. 1600–1605. [Google Scholar]
  18. Saha, R.K. Spectrum Sharing in Satellite-Mobile Multisystem Using 3D In-Building Small Cells for High Spectral and Energy Efficiencies in 5G and Beyond Era. IEEE Access 2019, 7, 43846–43868. [Google Scholar] [CrossRef]
  19. Saha, R.K. A Tactic for Architectural Exploitation of Indoor Small Cells for Dynamic Spectrum Sharing in 5G. IEEE Access 2020, 8, 15056–15071. [Google Scholar] [CrossRef]
  20. Sun, Q.; Nan, S. Coexistence Studies Between LTE-Hotspot Indoor and Earth Station of Fixed Satellite Service in the Band 3400–3600MHz. In Proceedings of the 2012 IEEE 11th International Conference on Signal Processing, Beijing, China, 21–25 October 2012; pp. 2275–2278. [Google Scholar]
  21. Höyhtyä, M. Sharing FSS Satellite C Band with Secondary Small Cells and D2D Communications. In Proceedings of the 2015 IEEE International Conference on Communication Workshop (ICCW), London, UK, 8–12 June 2015; pp. 1606–1611. [Google Scholar]
  22. Saha, R.K. A Technique for Licensed Spectrum Sharing Between Space-Satellite and Terrestrial-Mobile Heterogeneous Multisystem. In Proceedings of the 2019 Joint Conference on Satellite Communications (JC SAT 2019), JR Hakata City, Fukuoka, Japan, 10–11 October 2019; pp. 103–108. [Google Scholar]
  23. Chandrasekhar, V.; Andrews, J.G.; Gatherer, A. Femtocell Networks: A Survey. IEEE Commun. Mag. Sep. 2008, 46, 59–67. [Google Scholar] [CrossRef] [Green Version]
  24. Wong, M. Femtocells-Secure Communication and Networking; River Publishers: Aalborg, Denmark, 2013; pp. 77–78. [Google Scholar]
  25. Saha, R.K.; Aswakul, A. A Tractable Analytical Model for Interference Characterization and Minimum Distance Enforcement to Reuse Resources in Three-Dimensional In-Building Dense Small Cell Networks. Int. J. Commun. Syst. 2017, 30, e3240. [Google Scholar] [CrossRef]
  26. Sharma, S.K.; Chatzinotas, S.; Ottersten, B. Satellite Cognitive Communications: Interference Modeling and Techniques Selection. In Proceedings of the ASMS/SPSC, Baiona, Spain, 5–7 September 2012; pp. 111–118. [Google Scholar]
  27. Guidotti, A.; Vanelli-Coralli, A.; Conti, M.; Andrenacci, S.; Chatzinotas, S.; Maturo, N.; Awoseyila, A.; Ugolini, A.; Foggi, T.; Gaudio, L.; et al. Architectures and Key Technical Challenges for 5G Systems Incorporating Satellites. IEEE Trans. Veh. Technol. 2019, 68, 2624–2639. [Google Scholar] [CrossRef] [Green Version]
  28. Chimeh, J.D.; Hakkak, M.; Alavian, S.A. Internet Traffic and Capacity Evaluation in UMTS Downlink. In Proceedings of the Future Generation Communication and Networking (FGCN), Jeju-Island, Korea, 6–8 December 2007; pp. 547–552. [Google Scholar]
  29. European Telecommunications Standards Institute (ETSI); Universal mobile telecommunications system (UMTS). Selection Procedures for the Choice of Radio Transmission Technologies of the UMTS; TR 101 112, UMTS 30.03, ver. 3.2.0.; European Telecommunications Standards Institute (ETSI): Sophia Antipolis Valbonne, France, 1998–2004. [Google Scholar]
  30. E-UTRA. Radio Frequency (RF) System Scenarios; Document 3GPP TR 36.942, V.1.2.0; 3rd Generation Partnership Project (3GPP): Sophia Antipolis Valbonne, France, 2007. [Google Scholar]
  31. Simulation Assumptions and Parameters for FDD HeNB RF Requirements; Document TSG RAN WG4 (Radio) Meeting #51, R4-092042; 3rd Generation Partnership Project (3GPP): Sophia Antipolis Valbonne, France, 2009.
  32. Wang, C.-X.; Haider, F.; Gao, X.; Xiaohu, Y.; Yang, Y.; Yuan, D.; Aggoune, H.M.; Haas, H.; Fletcher, S.; Hepsaydir, E. Cellular Architecture and Key Technologies for 5G Wireless Communication Networks. IEEE Commun. Mag. 2014, 52, 122–130. [Google Scholar] [CrossRef] [Green Version]
  33. Yuan, G.; Zhang, X.; Wang, W.; Yang, Y. Carrier Aggregation for LTE-Advanced Mobile Communication Systems. IEEE Commun. Mag. 2010, 48, 88–93. [Google Scholar] [CrossRef]
  34. Auer, G.; Giannini, V.; Desset, C.; Gódor, I.; Skillermark, P.; Olsson, M.; Imran, M.A.; Sabella, D.; Gonzalez, M.J.; Blume, O. How Much Energy is Needed to Run a Wireless Network? Green Radio Communication Networks; Cambridge University Press: Cambridge, UK, 2012; p. 20. [Google Scholar]
  35. Saha, R.K. Realization of Licensed/Unlicensed Spectrum Sharing Using eICIC in Indoor Small Cells for High Spectral and Energy Efficiencies of 5G Networks. Energies 2019, 12, 2828. [Google Scholar] [CrossRef] [Green Version]
  36. Saha, R.K.; Aswakul, A. A Novel Frequency Reuse Technique for In-Building Small Cells in Dense Heterogeneous Networks. IEEJ Trans. Electr. Electron. Eng. 2018, 13, 98–111. [Google Scholar] [CrossRef]
  37. Saha, R.K.; Aswakul, A. Incentive and Architecture of Multi-Band Enabled Small Cell and UE for Up-/Down-Link and Control-/User-Plane Splitting for 5G Mobile Networks. Freq. J. RF Eng. Telecomm. 2017, 71, 95–118. [Google Scholar] [CrossRef]
Figure 1. The system architecture of the proposed hybrid integrated satellite-mobile system and an autonomous terrestrial-mobile system (iSMS/aTMS) [22].
Energies 13 00748 g001
Figure 2. Sample space for the deployment of SBSs and CGC stations in an apartment.
Energies 13 00748 g002
Figure 3. Interference management based on the ABS based eICIC technique for collocated SBSs with CGC stations in the same building [22].
Energies 13 00748 g003
Figure 4. Capacity responses of OSS and nOSS of aTMS for L = 1.
Energies 13 00748 g004
Figure 5. Spectral efficiency and energy efficiency responses of OSS and nOSS of aTMS for the variation of L. (a) Average spectral efficiency versus L; (b) Average energy efficiency versus L.
Energies 13 00748 g005aEnergies 13 00748 g005b
Table 1. Default parameters and assumptions.
Parameters and AssumptionsValue
E-UTRA simulation case 13GPP case 3
Satellite type and operating frequency bandGEO or LEO, S-band
Effect of the mobility of satellite spot-beam cells on the satellite UE handover between the satellite and a CGC stationNone
Cellular layout 2 and Inter-site distance (ISD) 1,2Hexagonal grid, dense urban, 3 sectors per macrocell site and 1732 m
Carrier frequency 2 and transmit direction2 GHz (mobile system), 3.5 GHz (satellite system), and downlink
System bandwidth40 MHz (for both mobile and satellite systems)
Operating spectrum band (satellite)CGC stations, in-building SBSs
Operating spectrum band (aTMS)Macrocell BS, picocell BSs
Considered system for performance evaluationTMSs only
Number of cells per building1 macrocell, 2 picocells, 16 CGC stations (maximum), and 16 SBSs (maximum)
External wall penetration loss 1 (Low)20 dB
Total BS transmit power 1 (dBm)46 for microcell 1, 37 for picocell 1, 20 for CGC station or SBS1
Co-channel fading model 1Frequency selective Rayleigh for macrocell and picocell and Rician for SBS and CGC station
Path lossMacrocell BS and a UE 1Indoor macro UEPL(dB) = 15.3 + 37.6log10R, R is in m
Outdoor macro UEPL(dB) = 15.3 + 37.6log10R + Low, R is in m
Picocell BS and a UE1PL(dB) = 140.7 + 36.7log10R, R is in km
SBS/CGC and a UE 1,2PL(dB) = 127 + 30log10(R/1000), R is in m
Lognormal shadowing standard deviation (dB)8 for Macrocell BS 2, 10 for Picocell BS 1, 10 for CGC station and 10 for SBS 2
Antenna configurationSingle-input single-output for all terrestrial mobile BSs and UEs
Antenna pattern (horizontal)Directional (1200) for macrocell 1 and omnidirectional for picocell 1, CGC stations and SBS1
Antenna gain plus connector loss (dBi); UE antenna gain 214 for Macrocell BS 2, 5 for Picocell BS 1, 5 for CGC station and SBS 1; 0 dBi
UE noise Figure 2 and UE speed 19 dB, 3 km/h
Total number of macro UEs; Maximum number of satellite UEs served simultaneously by a CGC station30; 1
Maximum number of small cell UEs served simultaneously by a SBS1
Picocell coverage and macro UEs offloaded to all picocells 1; Indoor macro UEs 140 m (radius), 2/15; 35%
3D multi-story building
(regular square-grid)
Number of buildingsL
Floors per building4
Apartments per floor8
Number of the apartment per building32
Apartment area(10 × 10) m2
Number of apartments withCollocated CGC stations and SBSs8
Only SBSs8
Only CGC stations8
Neither CGC stations nor SBSs8
Scheduler and traffic model 2Proportional Fair and full buffer
Type of SBSsClosed subscriber group
Channel state informationIdeal
λ SU and λ SC 2/8, 8/8
TTI 1 and scheduler time constant (tc), and TAPP1 ms, 100 ms, and 8 ms
Parameters and assumptions for nOSS technique y max , planer = 8 ; y max , linear = 2 , d min = 5 m , α thr , planer = 0.578 , α thr , linear = 0.044 , d ver = 3 m
Taken from 1 [30] and 2 [31].
Table 2. Co-channel interference effect on 3D clustering and resource reuse times.
Scenario α thr , planer α thr , linear d planer *
(m)
d linear *
(m)
d ver
(m)
ε planar Δ planer ε linear Δ 3 D   cluster S F ξ reuse
10.5780.044127.0752428324
20.050.0327.147.8164162321605
30.050.04427.147.0754162321605
40.5780.03127.816242816020
50.5780.1124.243241416040

