1. Introduction
For many years, the regime of the German electricity sector was characterized by oligopolistic and monopolistic structures. For a long time, Germany’s power sector was more or less dominated by the country’s four biggest power companies: E.ON, RWE, EnBW, and Vattenfall, referred to collectively as Germany’s “Big 4”. Founded after the liberalization of the German electricity market in 1998, these four companies had a market share of more than 80%; figures for 2005 show that the two largest companies (RWE AG and E.ON AG) had a market share of 54% (see
Table 1) [
1].
These four companies, the result of several mergers since the liberalization of the electricity market, had a long history and a traditional generation portfolio based mainly on fossil fuels and nuclear energy. Furthermore, two of the companies (RWE and Vattenfall) relied heavily on lignite, the most CO
2-intensive fossil fuel. In a nutshell, the business models of Germany’s Big 4 were traditionally based on non-renewables. On account of their power plant portfolio and in the face of climate change concerns, the approach taken by the Big 4 to even out their carbon account relied heavily on nuclear energy and on improving the efficiency rate of existing power plants, combined with a limited investment in renewable energies. Furthermore, they advocated carbon capture and storage (CCS) via EURELECTRIC, the association representing the interests of the electricity industry in Europe [
2]. These strategic decisions turned out to be insufficient. The notion of business models for the energy industry dates back to the mid-20th century [
3], but has grown significantly in importance since the liberalization of the energy industry [
4].
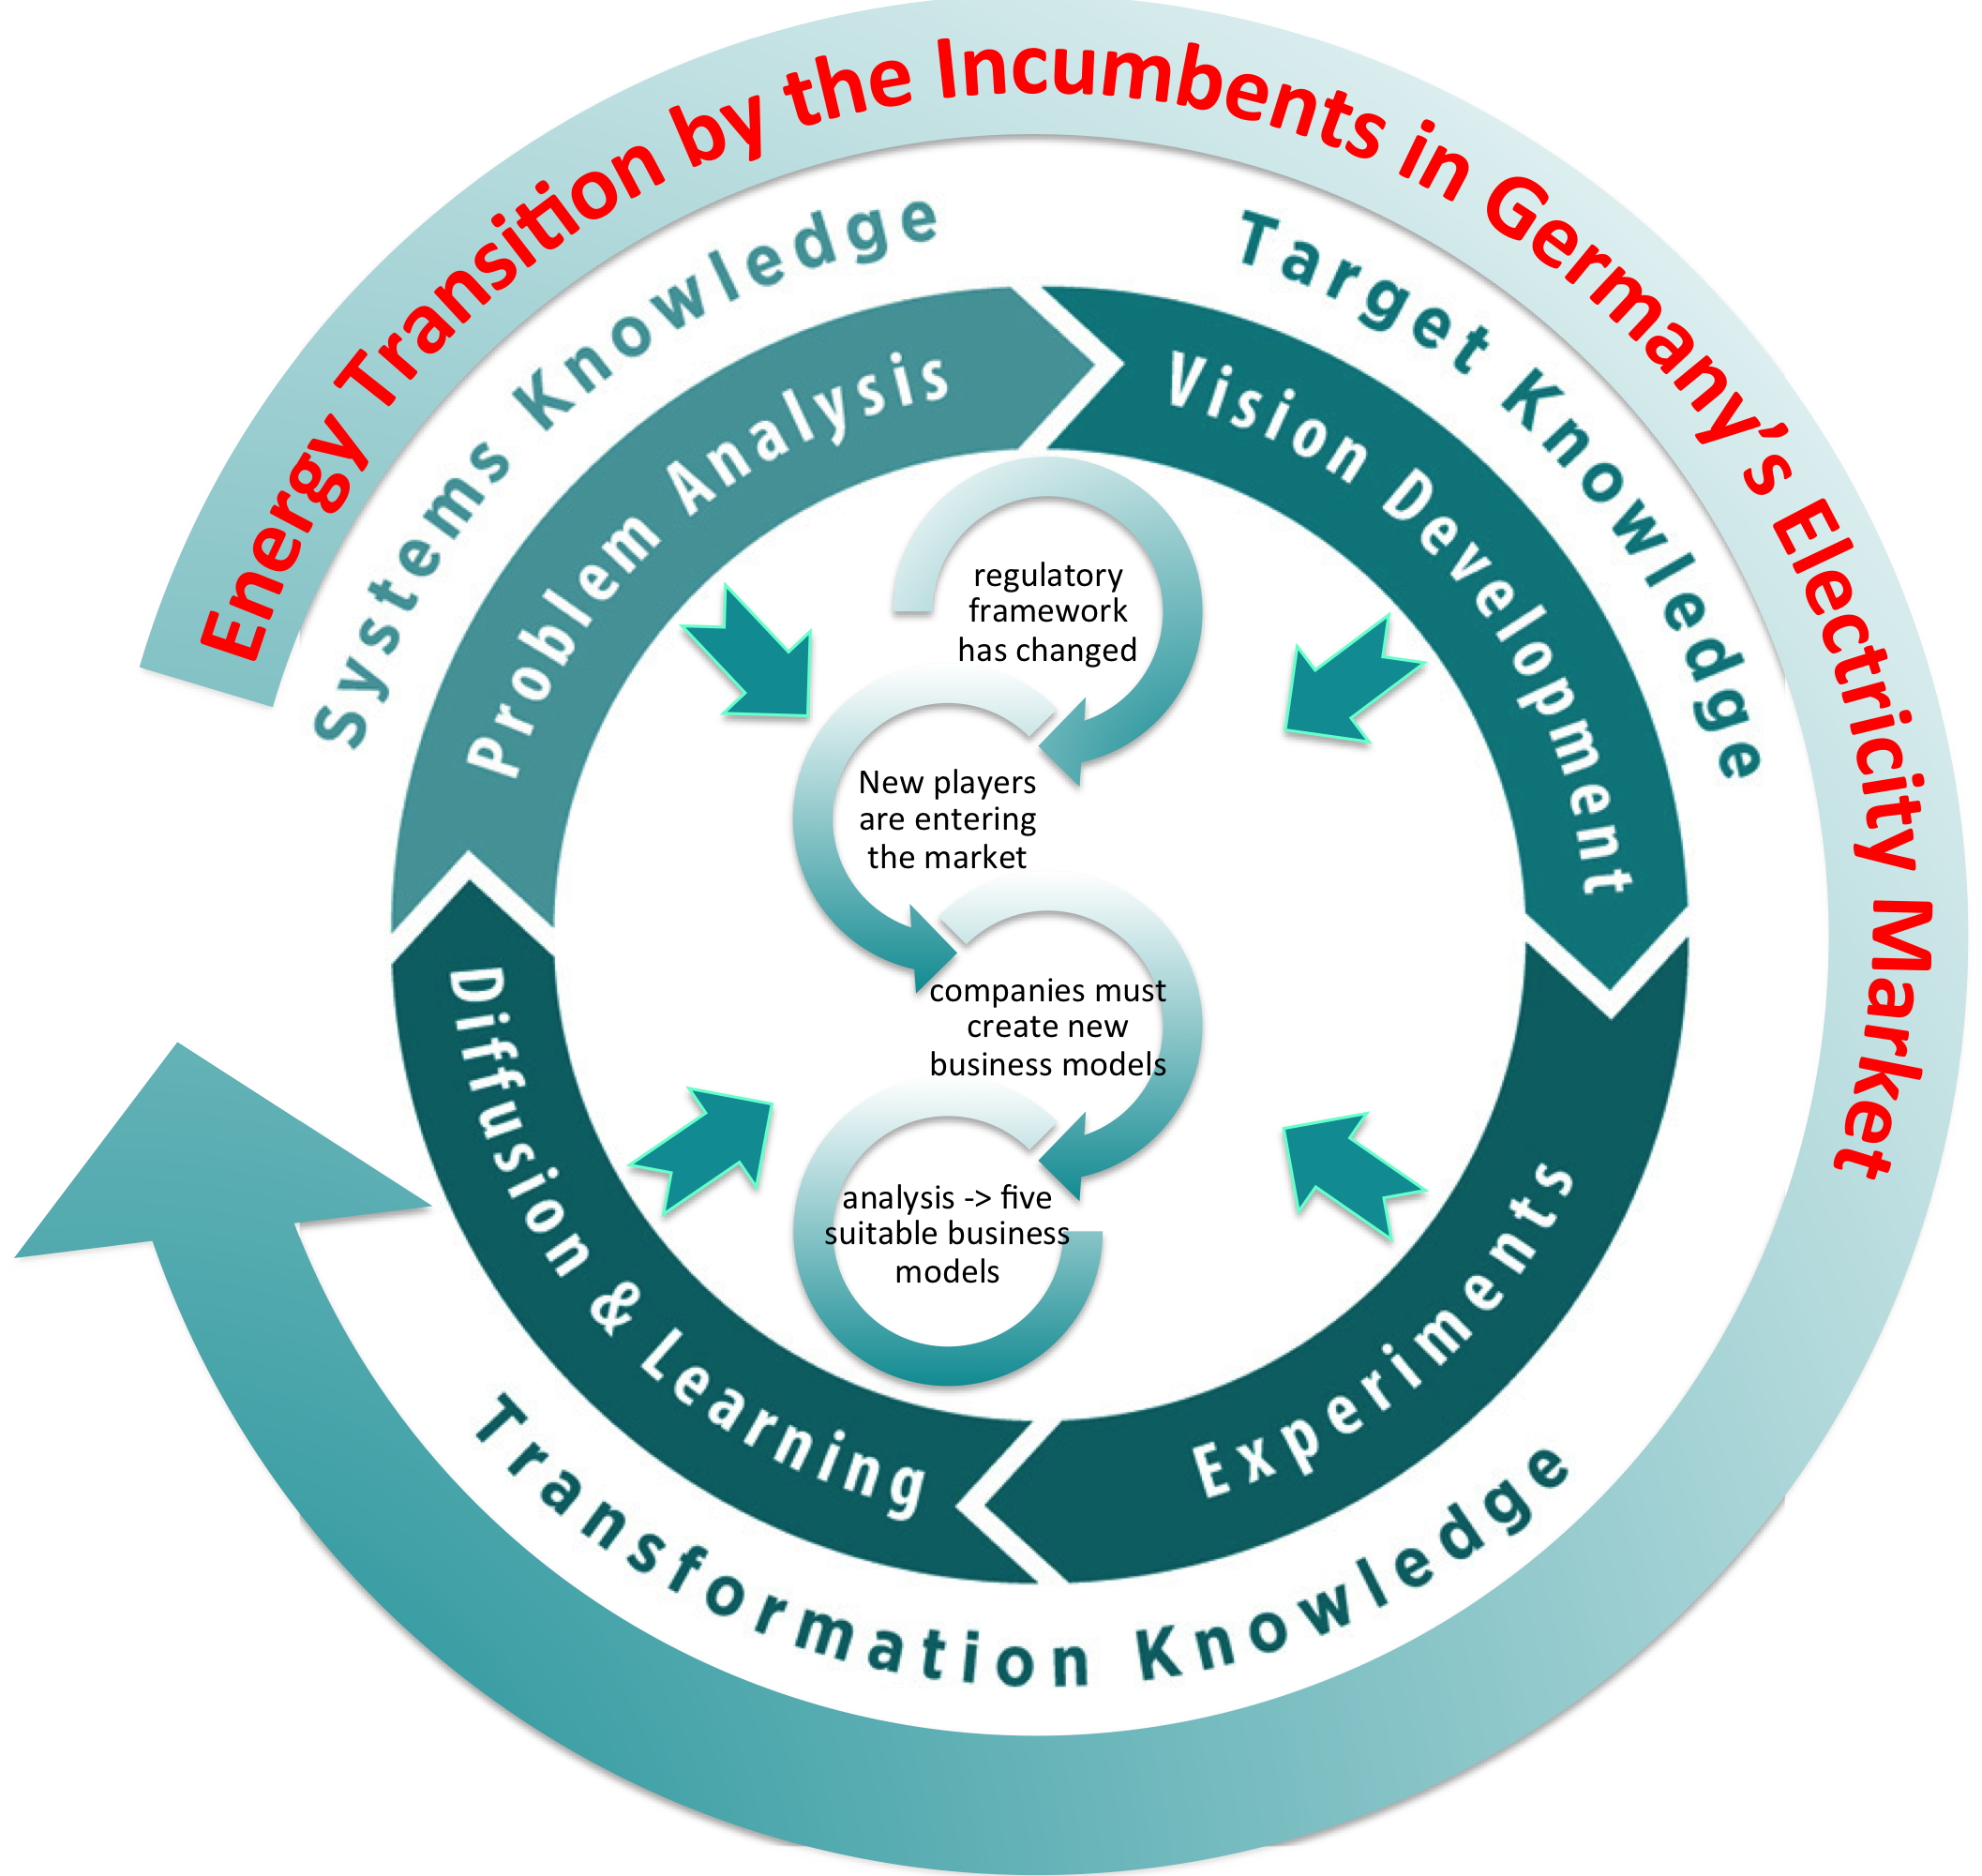
Soon after 2005, a gradual and then more rapid downward trend set in: as of 2016, the market shares of the Big 4’s electricity generation declined towards 50%. In addition, not only the contribution from conventional generation to earnings before interest, taxes, depreciation, and amortization (EBITDA) (see
Table 2), but also the share prices of the companies fell substantially (see
Figure 1).
How does a conventional business model differ from an innovative business model? Doleski (2016) divides the transformation of the energy industry into four historical stages that illustrate the epochal process of change in the energy industry from monopolistic utilities to digital energy service companies. In the first stage, extensive electrification was established under monopoly conditions with the implementation of transmission and local distribution grids. This phase lasted more or less over a hundred years, from the discovery of the electrodynamic principle and the beginning of electrification in the 19th century to the liberalization of the market in 1998. Competition set in after liberalization. This second stage, which according to Doleski, lasted until 2012 [
5], focused on price competition.
These first two stages form the core of a conventional business model. At the heart of the strategy is the ability to generate electricity at low cost by exploiting economies of scale in large power plants in a bid to possess a competitive price advantage.
Doleski suggests two additional stages post-2012. This third stage, characterized by a stronger service orientation, changes utility companies into a service companies with a clear focus on customer needs. The fourth stage, post-2015, involves this service orientation being mainly underpinned by digital solutions [
5]. In our understanding, these two stages are the core of an innovative business model. It is apparent that large incumbents have an advantage over their smaller competitors, especially in conventional business areas where size and financial capacity are the key factors [
6]. In contrast, customer knowledge and customer proximity are advantages in innovative business fields. Decentralized structures then become more advantageous than centralized structures.
Against this background of the growing importance of services, E.ON announced a strategic organizational step in 2015. E.ON’s fossil fuel and nuclear generation was to be carried out by a new company called Uniper, while the original E.ON was to concentrate on renewables, electricity distribution networks, and customer service. In April 2016, RWE took a similar step, and founded an affiliate “Innogy SE” to focus on renewable energies. Just two years later, however, these strategic organizational decisions were reversed: RWE and E.ON decided to continue as a future electricity company without grids and consumers (RWE) and a power distributor without power plants (E.ON). With the approval of the Federal Cartel Office, RWE and E.ON are currently intending to divide business fields among themselves [
7]. This is as an indication of the disruptive processes prevailing in the energy industry [
8,
9]. This management decision shows that the energy transition is subject to significant change dynamics.
One of the conclusions drawn from this is that the process of transforming the energy system has a significant impact on the structure of the energy industry in Germany. Transformation of the energy supply to 100% renewable energy sources and much better energy efficiency will bring about a considerable structural change in business. At the same time, the expansion of renewable energies in Germany also leads to the need to think in terms of the European electricity grid. The technical possibilities for exporting electricity to Germany’s neighboring countries are limited [
10]. Energy services that simultaneously contribute to grid stability are therefore a particularly great challenge in the context of the energy transition. The processes of decentralization, digitalization, decarbonization, and democratization associated with transforming the energy system not only have a considerable impact on the actor constellation and the socio-technical systems of the energy sector, they also change the core of established energy companies and their self-image. It is becoming increasingly apparent that conventional business models that have enjoyed great economic and social success for many decades are no longer sustainable. New business models are needed to take advantage of the economic opportunities offered by the energy transition. Developments such as the ongoing digitalization of the energy sector and the need to provide flexible power generation capacity opens up opportunities for novel and innovative business models [
3].
Against this background, Giehl et al. (2019) provided an excellent overview and classification of sustainable business models in the context of the energy transition. In their study “Full inclusion and classification of business models of the energy system transformation”, the authors systematically evaluated and analyzed a large number of business models [
8,
9], developing in the process a solid overview of energy-related business models for further analysis. A total of 242 business models were identified based on a collection of primary data concerning 134 companies from the energy industry. Literature analysis involved evaluating 166 thematically relevant publications, resulting in the identification of 396 theory-based business models. It would go beyond the scope of this paper to analyze all these business models. Instead, we undertake a detailed analysis of five exemplary business models from different sectors (transport, households/buildings, and industry) and all relevant areas (power generation, grid, and retail).
Doing business in the energy sector has generally become more difficult. It takes more than generating and selling kilowatt hours to implement a successful business strategy, as practiced by the energy industry in the last millennium in the absence of competition or service orientation. Following on from the monopoly market (utility strategy 1.0), the competitive market (utility strategy 2.0) and the service market (utility strategy 3.0), digital solutions are increasingly at the forefront of strategically important business models (utility strategy 4.0) [
3,
5]. Innovative business models in the power supply market are promising if they take into account the perspective of thinking along with the customer [
3]. In this context, services will also become much more important in the sector coupling market [
11], particularly the integration of e-mobility into the existing electricity infrastructure [
12]. Scientific studies have already been conducted on the strategic planning of sustainability at the local level in general [
13] and on the importance of municipal energy utilities in particular [
14]. Our analysis focuses on strategies for large energy companies—the incumbents—whose economic success is particularly important for many employees.
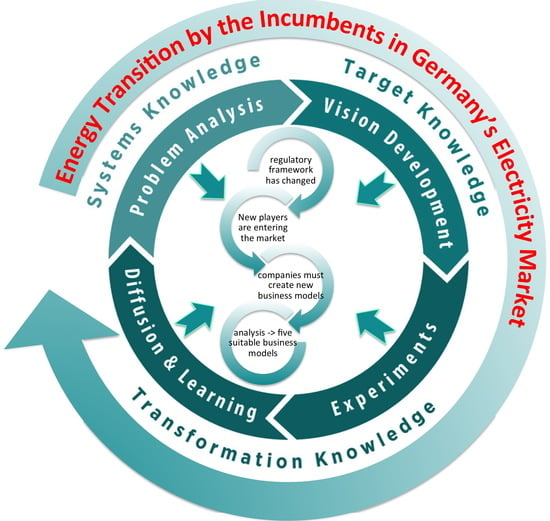
The aim of our paper is to enrich the discussion on the analysis of sustainable business models for the energy industry and to propose how to assess them. After an introduction and a presentation of the multi-method approach, this paper looks at the contextual circumstances or framework conditions that arose by the end of the last millennium in the rise and fall of the Big 4 [
15]. Using the multi-level perspective (MLP), the paper focuses on the key conditions or factors that, together, have overthrown the (conventional) business models of the Big 4 (
Section 3). This analysis is complemented by (multi-criteria) analysis of potential business models for electricity suppliers, which are not endangered by current framework conditions (
Section 4). The paper ends with concluding remarks and avenues for future research.
2. Methods
The multi-level perspective (MLP) is applied to categorize the latest developments in the German electricity sector [
16]. The MLP is a model that divides transformative developments into socio-technical landscapes, regimes, and niche innovations, and reveals the interdependent relationships between these levels. Niche actors anticipate future development trends and use windows of opportunities to act as “pioneer[s] of change” [
17]. The multi-level perspective, essentially fleshed out and theoretically elaborated by Frank Geels [
16], is a theory that emphasizes the inextricable interdependencies between technological, economic, political, and cultural processes of change.
So far, the model has mainly focused on transformations in large socio-technical systems. Geels himself focuses on a wide range of change processes, from the replacement of horse-drawn carriages by cars [
18] in the transport sector to the breakthrough of rock ‘n’ roll [
19] in music. Other authors have transferred this theory to other fields, such as urban development [
20], electric mobility [
21,
22], and comprehensive approaches to enshrine social sustainability in global production networks [
23].
The key assumptions behind these case studies are as follows:
Radical innovations first develop in niches that are still largely outside the general sphere of perception and supported by a small number of individual, collective, or corporate actors.
These niches are closely related to given socio-technical regimes.
The regime is characterized by consolidated actor constellations, rules, and conventions, as well as economic and technical structures.
Niche innovations sometimes lead to changes in the regime, which in turn influence developments in the niche.
The socio-technical regimes, in turn, are embedded in more permanent overarching framework conditions, which Geels (2002) calls the landscape.
The landscape includes all those dynamics that cannot be directly influenced by the actors involved. These are, for example, fundamental trends such as globalization, climate change, and digitalization.
We suggest that an analysis using the overview approach provided by the MLP may provide valuable insights to our understanding of how changes in the energy landscape have affected the German regime of electricity companies. However, as “an abstract analytical framework that identifies relations between general theoretical principles and mechanisms,” [
24] it cannot be used to study specific details of the processes and interactions that occur during the transition. Complementary theories are therefore needed to operationalize the MLP [
25]. MLP analysis is fed and substantiated by the results of a previous study on the rise and fall of electricity companies, which made use of triangulation (involving expert interviews, participatory observations at two official company events (annual general meetings), and interviews with representatives from the four companies).
Multi-criteria analysis (MCA) is another methodological approach applied in this paper. MCA is used to assess business models in
Section 4. MCA is a common approach that goes beyond traditional schemes with a limited focus (such as the economic focus of traditional cost-benefit analysis) [
26]. The United Nations Framework Convention on Climate Change (UNFCCC) defines MCA as “a type of decision analysis tool that is particularly applicable in cases where a single-criterion approach falls short” [
27].
For the purpose of this paper, five business models will be analyzed in detail. Five criteria were defined to assess the future viability of these five business models. The criteria, selected from the energy companies’ point of view, were defined as follows:
In accordance with climate targets and policy strategies.
Wide acceptance by clients/size of potential customer base.
Low costs for the energy company.
Fast implementation rate.
Highly competitive.
The criteria were then operationalized by drawing up a ranking list. For visualization purposes, arrows (↑↗→↘↓) are used to illustrate positive, neutral, and negative effects. The up arrow symbolizes that the business model fulfills the criterion; the down arrow means that the criterion is not met. An arrow to the right means a neutral evaluation. This may mean that the assessment is highly dependent on the design and implementation of the business model or that parts of the criterion are met and other parts are not. For example, in the case of the criterion “Low costs for the energy company”, an arrow pointing upwards means that the company incurs low costs to implement this business model. An arrow pointing downwards means that costs are high. An arrow to the right means that costs may vary depending on preconditions and implementation.
The assessment, based on literature analysis and status quo analysis, was then determined by the authors of this paper. Since it was not possible to comprehensively assess the criteria within the scope of this paper, the results merely represent a first, broad evaluation of the potentials of different business models.
3. Using the Multi-Level Perspective (MLP)
3.1. Central Results
The MLP enables us to identify factors that resulted in a transformation of the regime. Some of these central factors that tend to act at the “landscape level” are highlighted below, with a brief explanation of the role they play in the transformation of the regime.
Considering the “landscape” perspective of the MLP, the Renewable Energy Sources Act (German: Erneuerbare-Energien-Gesetz) implemented in 2000 had a significant influence on the further development of the energy system. The graph in
Figure 2 shows that electricity generation from renewable energy sources gradually increased following the introduction of the Renewable Energy Sources Act in 2000, whereas electricity generation by the Big 4—and hence their market shares—decreased. These trends show that renewable energies were successfully promoted, representing the beginning of the end of conventional energy sources.
The Big 4 encountered another problem. The EU Emissions Trading Scheme (ETS), implemented in 2005, is an important European instrument for mitigating climate change, and has become increasingly relevant for power generation. Since 2013, for instance, power plant operators have had to purchase 100% of their certificates, because it has been shown in the past that “they have been able to pass on the notional cost of allowances to customers even when they received them for free” [
29]. Substantial reforms have been undertaken in this area since the start of the third trading round of the ETS from 2013 to 2020, which also resulted in a higher certificate price of around €25 per ton of CO
2. The forthcoming reform of the European Emissions Trading Scheme could further reduce the profitability of emission-intensive power plants in the medium term [
30]. For example, the auction procedure is to become the dominant distribution mechanism. By 2027 at the latest, free allocations should have expired completely. It is evident that the profitability of conventional power plants based on fossil fuels will decline [
31].
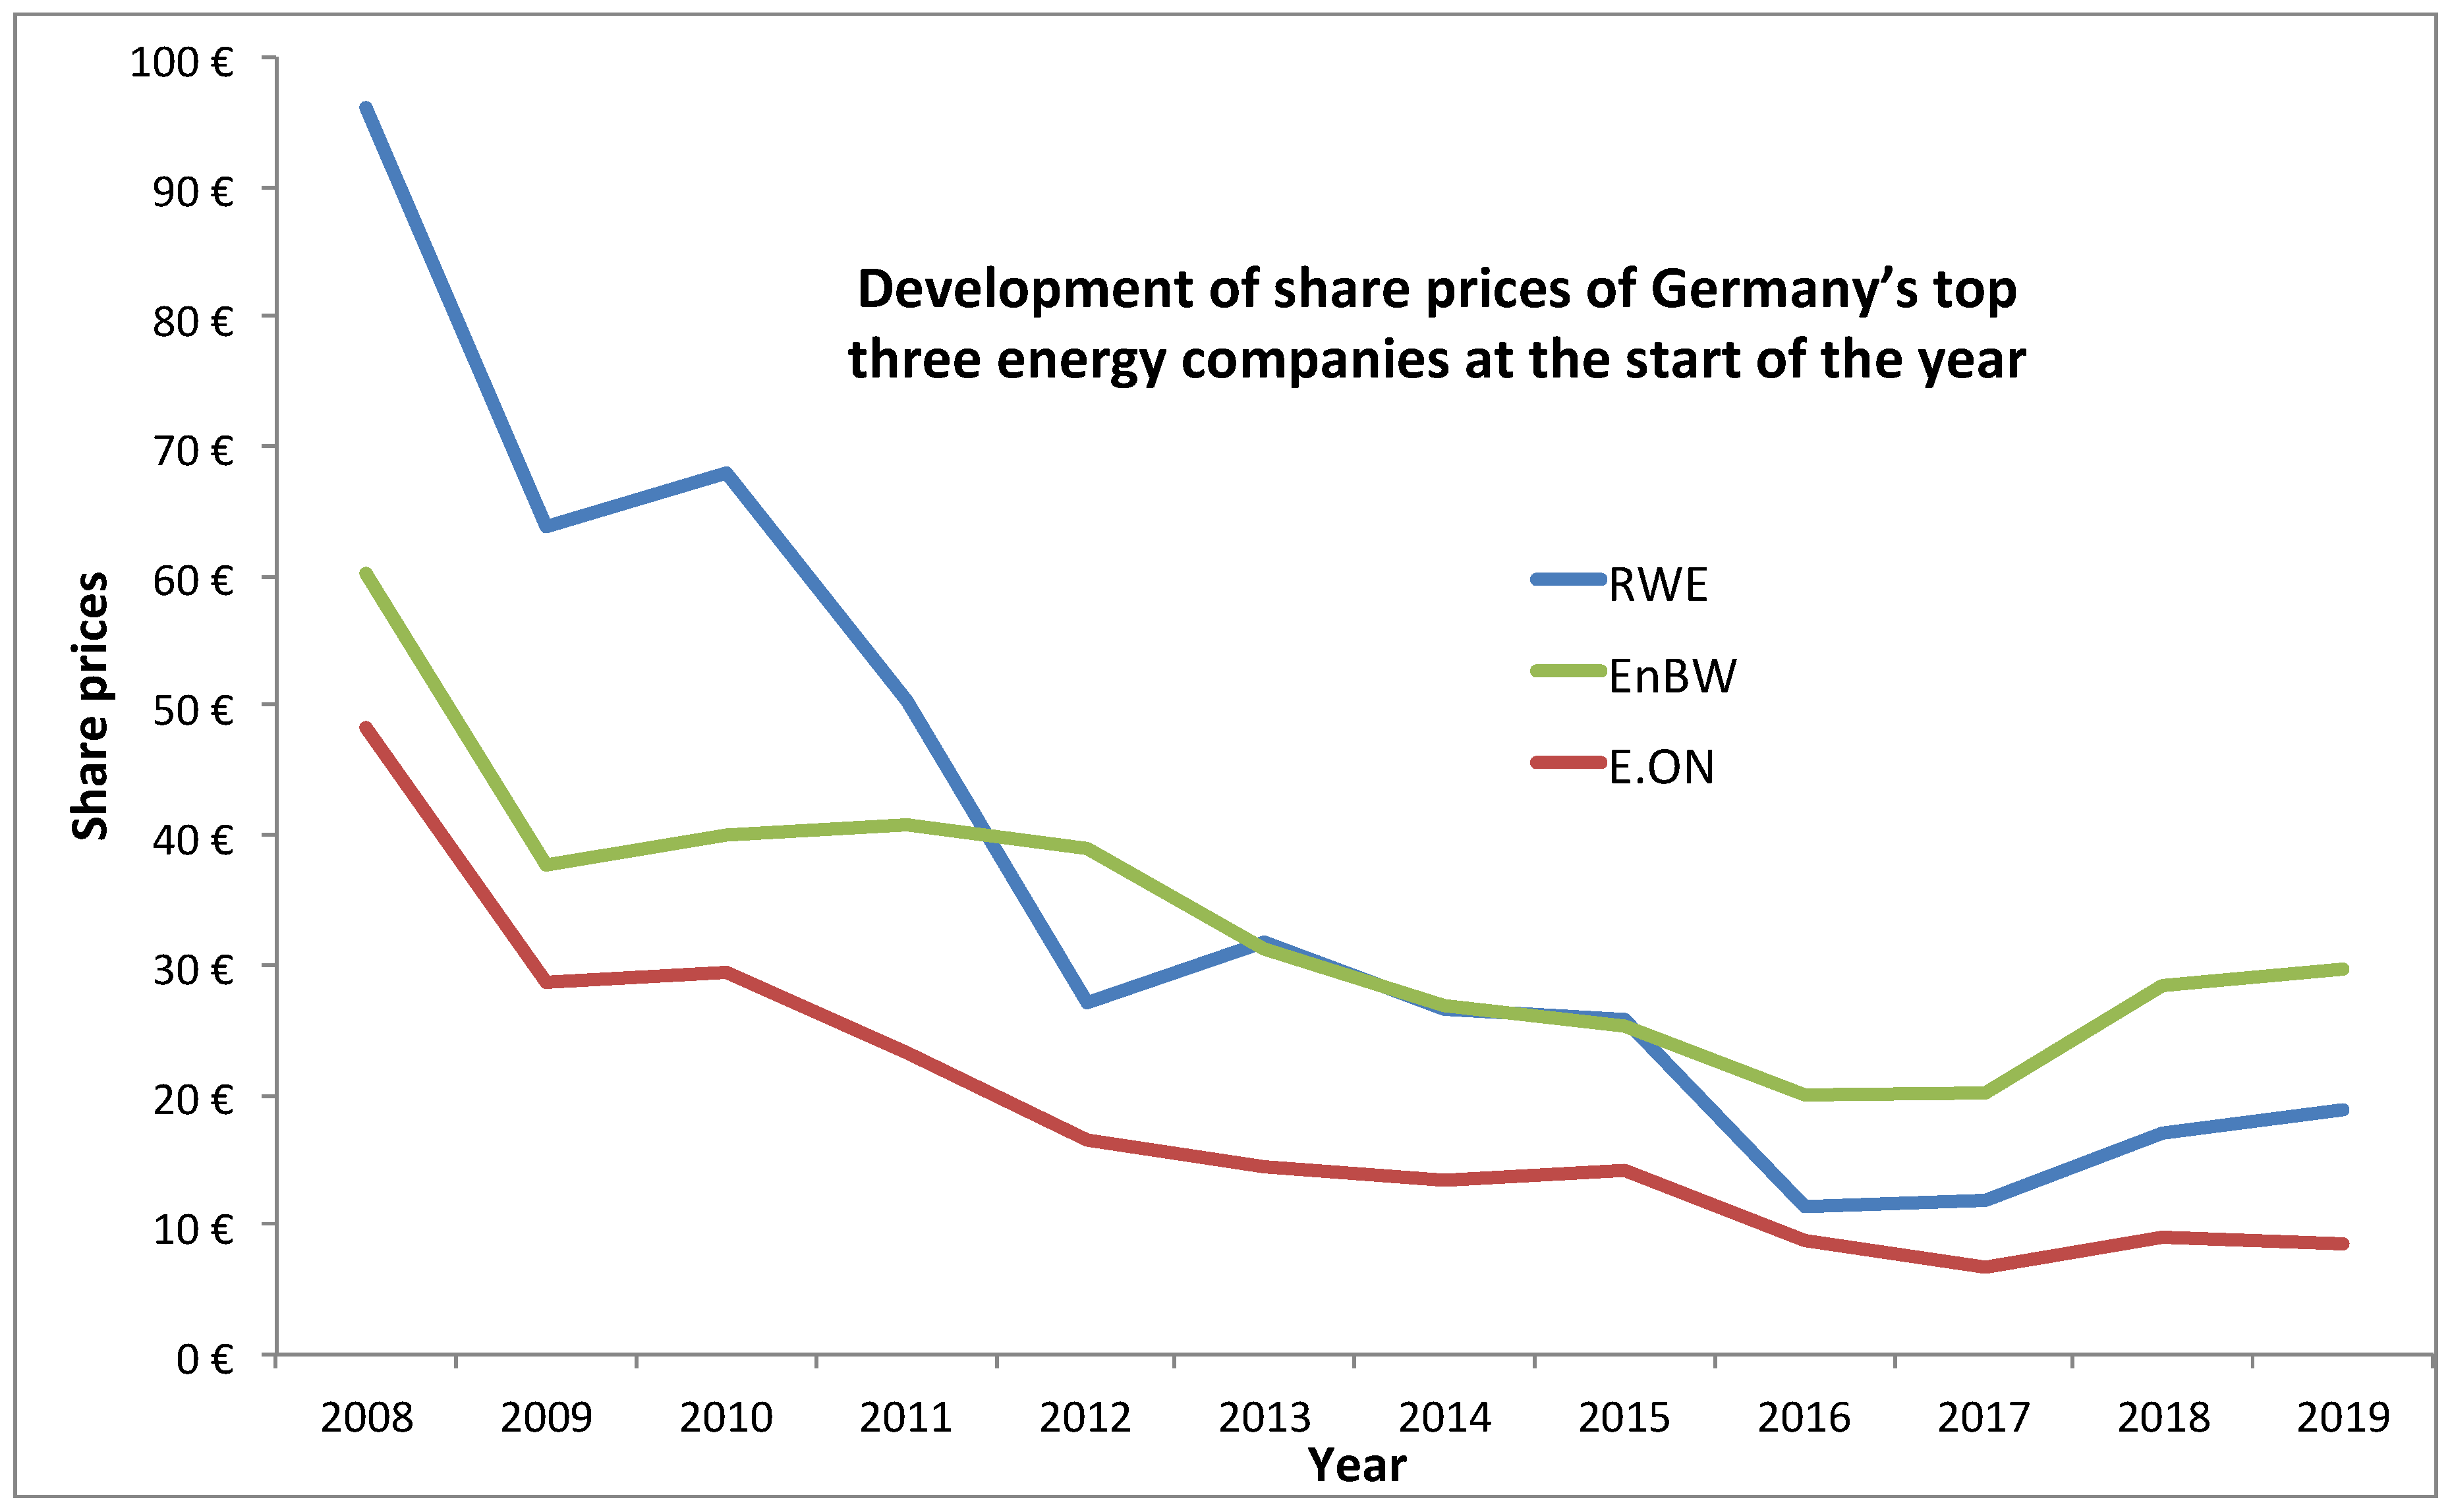
A more stringent implementation of the greenhouse gas (GHG) neutrality concept by the middle of the century depends on a 95% reduction in GHG emissions by 2050 and hence alignment with the upper margin of the target range specified by the Federal Government of Germany in its 2010 “Energy Concept” for GHG emission reductions.
Figure 3 shows that the 55% reduction trajectory for GHG emissions by 2030 and the 70% reduction by 2040 (the Federal Government’s interim targets) will not result in a 95% reduction in GHGs in 2050. To achieve this objective, the reduction target for 2030 would have to be closer to 58% or 59%. Given this background, there have been justified calls for an adjustment of interim targets.
It is essential to immediately begin a rapid reduction in CO
2 and other GHG emissions. This is why the Intergovernmental Panel on Climate Change (IPCC) recently estimated that halving CO
2 emissions by 2030 (relative to 2010 levels) and globally achieving net-zero CO
2 emissions by 2050 (as well as strong reductions in other greenhouse gases) would offer a 50% chance of staying below 1.5 °C warming [
32].
Given that industrialized countries produced more of and benefited more from emissions in the past, they have an ethical responsibility to achieve this transition more rapidly than the world as a whole. The EU and Germany have set themselves ambitious climate targets: annual GHG emissions are to fall by 80–95% by 2050 compared with 1990 levels. Interim targets have been set for 2020 and 2030. Targets must be seen in the light of the results of the climate conference in Paris. At the end of 2015, the global community agreed to the goal of a net-zero emissions global economy between 2050 and 2100. Large parts of the transport and heating sectors must be electrified (sector coupling) to achieve national climate targets. This is because electricity from renewable energies plays a decisive role in decarbonizing these areas. Battery technologies and water electrolysis have the potential to become key elements in coupling the electricity, transport, heating, and chemical sectors in a future sustainable energy system [
33].
Although it is foreseeable that electricity will play an increasing role in energy supply, there is no gold-rush mood among the large electricity companies. On the contrary, the mood in the companies and on the stock market shows that the incumbents must quickly correct their strategic mistakes from past decades to maintain their market position. Companies have problems at all stages of the value chain. A major problem exists in the area of power generation: large companies’ most important generation facilities are conventional power plants. However, the increasing temporary underutilization of conventional power plants when wind and solar plants operate at full capacity is causing the margins generated by conventional generation to collapse.
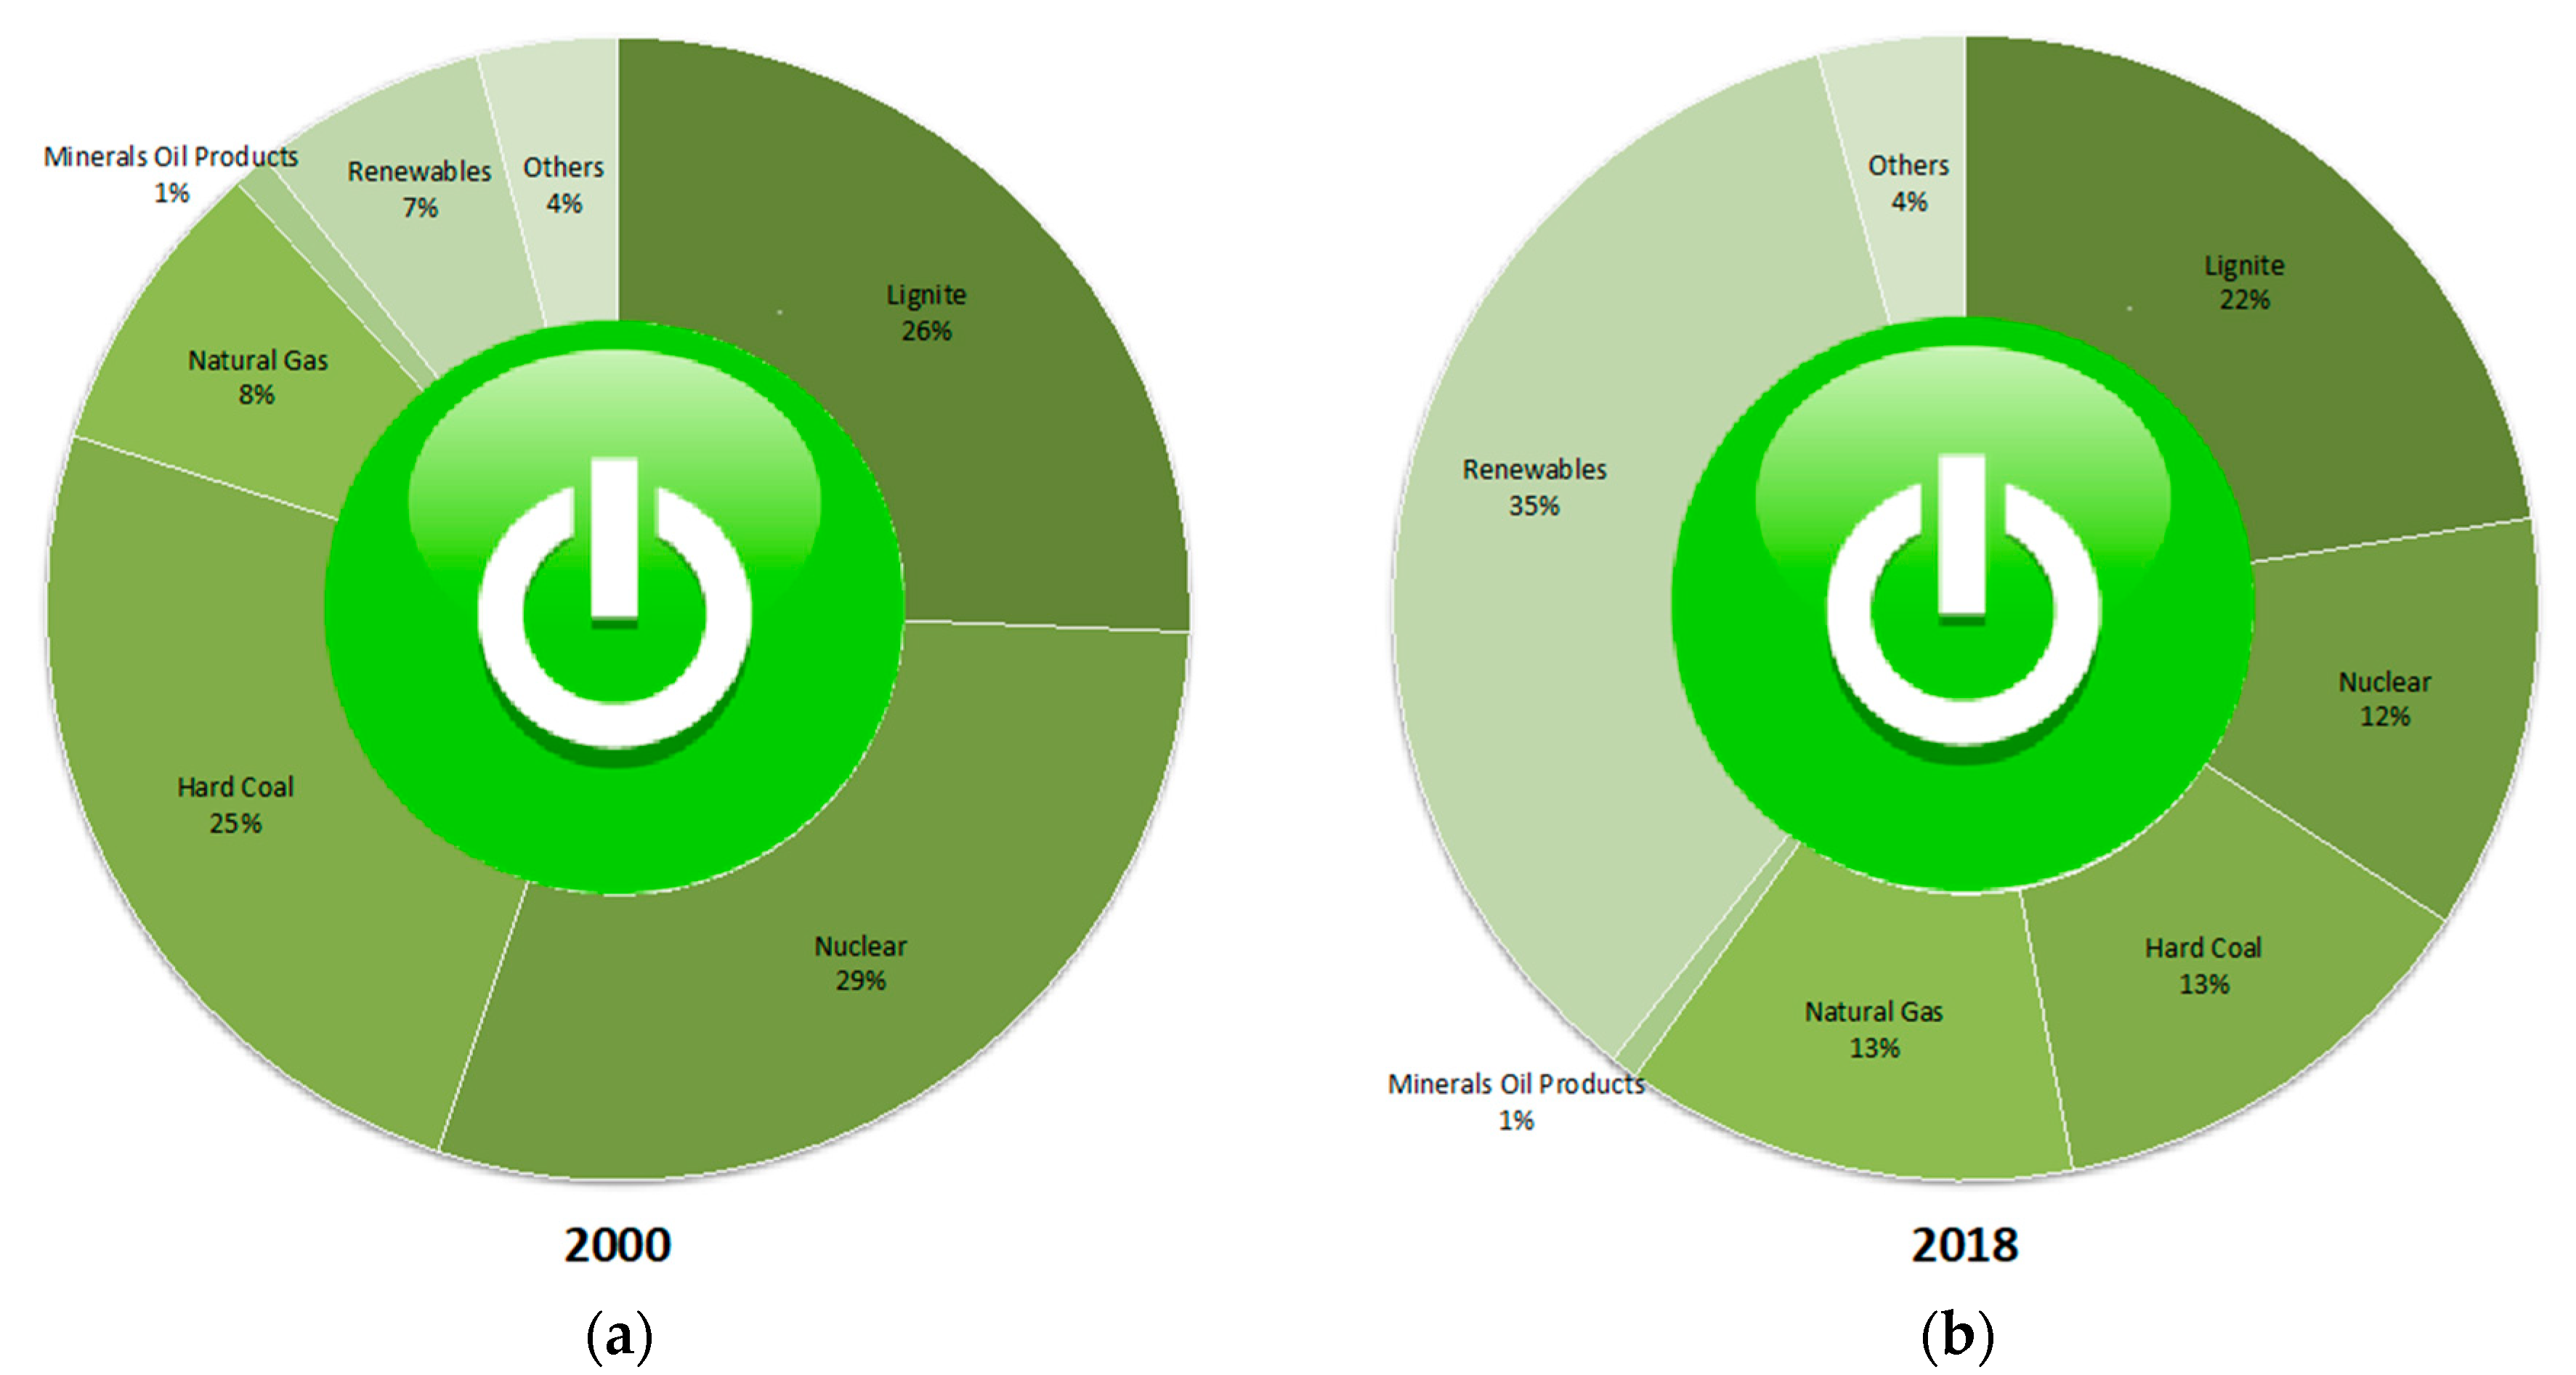
Figure 4 illustrates the enormous increase in importance of renewable energies in electricity generation.
Incidentally, as a technological option for incumbents to maintain their fossil fuel portfolio, CCS is rather unlikely to happen, at least in Germany [
34,
35].
Finally, the economic outlook for coal-fired power generation is bleak not only because of the forthcoming changes to the emissions trading system and the increasing share of renewable energies, but also because there is a broad political and social consensus on phasing out coal. The German Coal Commission appointed by the Federal Government includes 31 representatives from political decision-makers, the energy sector, lignite mining regions, industry, environmental associations, trade unions, the scientific community, and the government. The commission presented its final report in early 2019. It recommends phasing out coal-fired power generation by 2038. The energy companies therefore expect deep cuts. Even if the regions receive structural aid and the companies are awarded compensation, which is likely, an end to these conventional business models is foreseeable. This gives rise to the problem that few precautions have been taken as yet to develop business models of comparable importance that are in consensus on the energy transition.
3.2. Overview
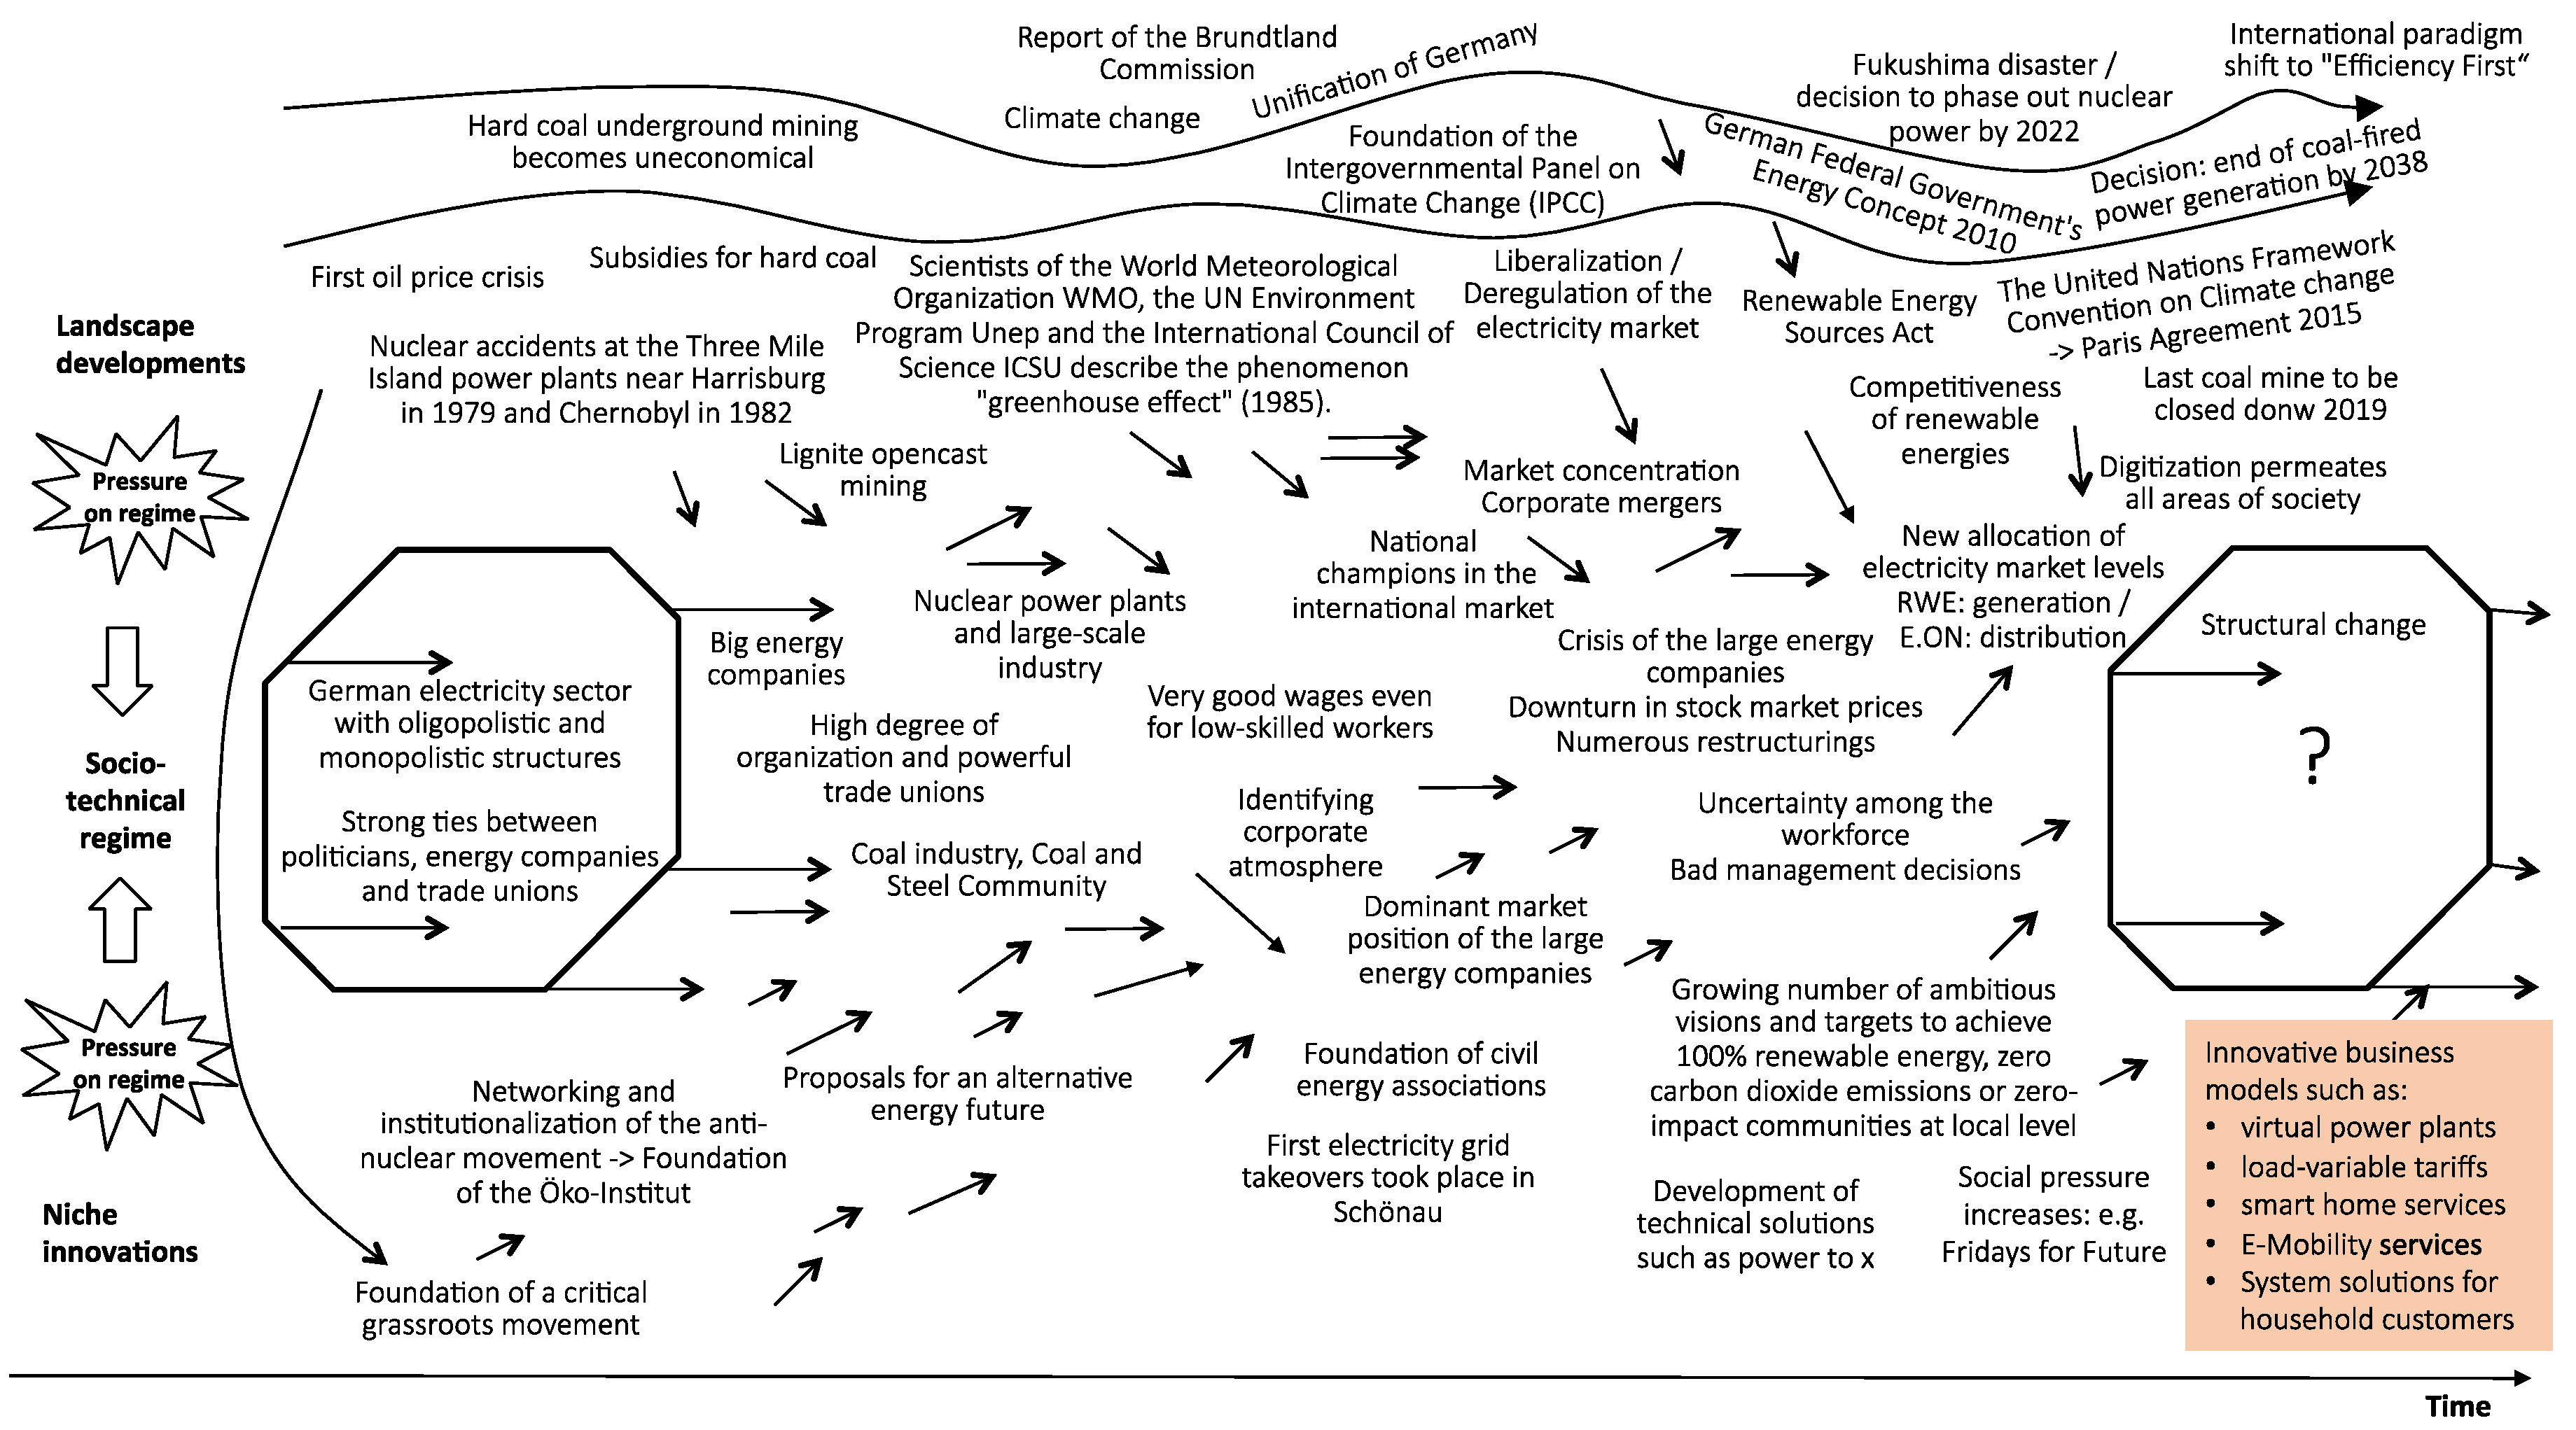
In the previous section, we identified various factors that had a significant influence on the “landscape” and have overthrown the Big 4’s conventional business models. In a nutshell, these were the introduction of the EEG in 2000, the ETS in 2005, and the Energy Concept in 2010 in combination with (international) debates on GHG emission reductions, an all-electric society, and the coal phase-out. While market liberalization facilitated the dominance of the Big 4, (international) debates on climate change, CO2, and the coal phase-out questioned the use of fossil fuels. Moreover, large parts of the German population had doubts about nuclear energy. These sentiments and the Fukushima accident jeopardized nuclear energy’s reputation. These landscape factors resulted in policy change and an all-electric society paradigm. These factors contributed to the expansion of renewables, which was not pushed by the Big 4, but by a large number of smaller actors. The following figure, based on the basic model of Geels’ Multi-Level Perspective (2002), presents an overview of the key influences, some of which have been discussed above.
The development described here gives rise to an important strategic question, which we want to pursue in the context of this paper: What potential business models can large companies adopt in the context of a consistent further development of the energy transition? In this context and in accordance with MLP terminology, niche innovations are crucial. Many of these niches already play or will play a decisive role in the future and influence the socio-technical regime. It is therefore important for the Big 4 to take a closer look at these niche products and examine them as potential future business models. Some of these innovative business models are shown in the orange box in
Figure 5, and will be further analyzed in the following section.
4. Outlook on Sustainable Business Models
The Big 4 cannot continue business as usual because of the German energy transition. They must rethink their conventional business models and create new, sustainable strategies to survive on the market and generate future profit. There are several opportunities for companies to discover new areas and to develop niche markets. Five of these niche innovations are mentioned in the table at the bottom right of
Figure 5.
For further analysis, these business models will be reviewed in detail. When selecting the business models, care was taken to capture a broad picture of business models and to map all sectors (transport, households/buildings, and industry). Analysis also included all relevant energy-related areas (power generation, grid, and retail).
The five selected business models and the sector they represent are listed in
Table 3. All five are then briefly presented, including status quo analysis. The perspectives of these business models for the Big 4 will then be assessed using multi-criteria analysis, as described above.
4.1. Rollout of Public Infrastructure for E-Mobility
In the field of infrastructure development for e-mobility, a study by PWC (2018) on energy providers found that German energy companies manufacture (12%), sell (68%), install, and maintain (88%) charging stations [
36]. By the end of 2018, more than 16,000 public charging points had been installed in Germany. A total of 76% of these stations for charging electric vehicles in Germany (and Austria) are operated by energy companies, approximately 25% of which by the RWE subsidiary Innogy.
Despite these activities, there are still too few charging points, and energy providers are hesitant to invest in this area. The lack of sufficient charging infrastructure is considered to be one of the key reasons why consumers decide against purchasing a battery electric vehicle (BEV).
One of the main reasons for investing even more in the expansion of electric mobility infrastructure are the targets and strategies of the Federal Government. Targets were set for expanding charging infrastructure (and BEVs), and financial incentives are available for the purchase of electric vehicles. Consequently, e-mobility will probably play a role in the future. In addition, the business model is highly compatible with government strategies, even though electric vehicles are not completely emission-free due to Germany’s electricity mix. More BEVs are likely to be purchased as the number of public (and private) charging stations grows, increasing customer interest. However, this will probably not occur in the short term. It must also be noted that other technology solutions (e.g., hydrogen) may contest the acceptance of BEVs.
Different factors are relevant to costs and the implementation rate of this business model, making it impossible to make a general statement about its viability. For instance, the energy companies’ experience in installing and operating charging stations plays an important role. In general, PWC (2018) shows that larger companies invest more in this field due to their (i) capacity to finance larger (infrastructure) investments, (ii) human resources, and (iii) ability to test and promote innovative projects [
36]. This is also the reason why larger energy companies are in the best position to facilitate e-mobility infrastructure. However, the emergence of Elli, a subsidiary of Volkswagen, shows that financially sound competitors from other sectors are also seeking to provide charging services for BEVs.
Initially, the maintenance of charging stations deviates substantially from conventional business models, while their operation resembles the original picture. Innogy does not regard the sale of electricity for electric vehicles as a profitable business segment overall. In the field of e-mobility, the company sees the business segment rather as a supplier of technology and an operator of charging points [
37]. In contrast, companies like Shell seem to be increasingly interested in the market. Charge-Point, a group operating 60,000 charging stations in the USA, is now also entering the European market. Based on this, an assessment of this business model was made, which is illustrated in
Table 4.
4.2. Supply of System Solutions
This business model comprises the provision of system solutions, particularly for the residential sector (buildings). One example of such a system solution is a photovoltaic system together with a storage device and energy management software. The advantage of such system solutions is that customers must no longer occupy themselves with the individual components, but can rely on individual products fitting perfectly together. The use of such an integrated service can be considered an advantage from the homeowner point of view because it substantially reduces transaction costs (e.g., in the search for information about solar PV and battery storage technologies, qualified and available craft businesses). A study by EY and EWI (2016) estimates the theoretical market potential for battery storage to be €500 million over the next five years [
38].
It may therefore be an option for energy companies to develop a business model that concentrates mainly on the sale of such system solutions. In the process, the energy provider would have to cooperate with a battery manufacturer, among others, and regional craft businesses would install the solar PV systems.
The energy company E.ON sells both solar systems and wall boxes via its website, i.e., private charging points that can be installed in the garage, for example. Regional sales structures are used, integrating regional and local partners. Innogy takes a similar approach, but also offers to install battery storage units.
While energy efficiency is not an issue, such a business model is in line with renewable energy (and battery storage) expansion requirements. Regarding acceptance by clients, customers have the advantage that they no longer need to search for single components. However, some customers may not welcome out-of-the-box solutions because they might want to use other (e.g., more advanced or cheaper) technology providers.
The business idea differs substantially from the original business model of energy companies because it facilitates energy self-reliance (reduction of external energy demand) and requires the development of new retail structures, bonding with other companies, and in-depth cooperation with craft businesses. Addressing potential customers is another issue that is considered as challenging.
From a cost and implementation rate point of view, therefore, this new business model may require substantial effort. Competitors include providers of similar integrated solutions including, e.g., Germany-based sonnen GmbH or the US company Tesla as well as providers of singular technologies (e.g., Panasonic). It is unclear whether energy providers will be able to compete with these innovative businesses. As a result of our analysis, the following
Table 5 summarises the assessment of this business model.
4.3. Dynamic Electricity Pricing for Companies
Dynamic electricity prices react to temporal fluctuations in electricity prices, which are passed on to customers. In this context, there is potential for industry to reduce energy costs and to shift production to periods when load shifting is needed from the electricity system perspective. In turn, this offers opportunities to better integrate renewables into the grid (that is, electricity supply could guide production). Some pilot projects already exist, such as the municipal utility “Wuppertaler Stadtwerke”, which participated in a research project for realizing an innovative electricity price structure for medium-sized industrial companies [
39]. Another pilot project, “Happy Power Hour II”, aims to develop a dynamic electricity tariff that passes on electricity price fluctuations to large industrial customers [
39]. The aim is to (i) directly reduce the procurement costs of electricity for industrial companies, (ii) stimulate systemic behavior, and (iii) indirectly avoid energy bottlenecks.
Although several pilot projects exist, industry in Germany usually purchases electricity based on long-term contracts with static electricity prices. At first sight, therefore, industry has no incentive to change production habits.
The assessment of the business model includes both positive and negative aspects. Given that load shifting, for which dynamic electricity pricing is necessary, allows the integration of increasing renewables, a new pricing regime is completely in line with government targets. Industry clients are interested because they want to cut electricity costs; at the same time, however, companies need to determine their load-shifting potential. There are, of course, also limits. From an electricity company’s point of view, the cost of adopting such a business model should be relatively low, but (hardware) investments must be made at both ends, the supply and the demand side. The implementation rate also depends on the interest of a critical mass of industry players.
Table 6 illustrates the assessment of the business model.
4.4. Digitalization—the Demand Side: Smart Home
According to the Smart Home Report 2019 [
40], utility companies are seen as potential market leaders for the smart home market. The potential for this business model is huge. According to the Statista Digital Market Outlooks, at least one smart home application is currently in use in 6.1 million German households. This figure is expected to rise to 13.5 million by 2023 [
40].
Smart home applications are gaining ground in both building technologies and household appliances/lighting [
41,
42]. The greatest potential in Germany lies in heating control. In addition, smart meters are essential when implementing a smart home [
43]. Intelligent smart home solutions can provide consumers with a visualization of their energy consumption, which can be continuously recorded and evaluated. Energy companies could benefit from this development by providing smart home technologies, hosting applications, developing useful mobile phone apps, and providing customer care and training.
Smart home technologies do not necessarily reduce energy consumption, but energy automatic control and visualization may contribute to the climate targets. Overall, the climate mitigation factor is assessed positively. However, devices that must be purchased additionally may also consume electricity.
As the market for smart home technologies grows, acceptance by clients will also increase, even considering data security concerns. Smart home applications are already offered by a number of energy companies. Almost all major energy companies currently offer a range of smart home applications. Only the scope and focus of the smart home devices vary from company to company. E.ON, for example, offers solutions in the areas of heating, security, and lighting. For applications, E.ON cooperates with well-known brands such as Bosch, nest, and Philips. E.ON also offers packages of different products. In contrast, Vattenfall additionally focuses on entertainment and lifestyle, and also cooperates with well-known brands. Products offered by Innogy do not differ significantly from those of the other energy companies. However, innogy relies on its own system. RWE has also been referring customers to innogy’s smart home segment since 2016. Besides large energy supply companies, other energy supply companies (such as EWE, Pfalzwerke AG) also offer smart home technologies for private households.
Due to their experience in the smart home market, the cost for energy companies should be low and the implementation rate fast. However, it must be noted that some energy companies have already abandoned their smart home business models because the online sales model, entailing relatively high initial investment, did not appeal to customers. In order to survive on the market and to compete against other providers, energy companies need to offer customers easy-to-understand information, compatible solutions, service packages, and competitive prices. One conceivable option would be subsidy models. In this case, the energy supplier would make advance payments to install the hardware in the household, and then monetize the customer relationship in the long term. Subscription models with regular payments, reducing customers’ initial investment, are another option. On the basis of our analysis, an assessment of this business model was made, which is illustrated in
Table 7.
4.5. Digitalization—the Supply Side: Virtual Power Plants
Virtual power plants aggregate decentralized energy resources, including both volatile (e.g., solar PV, wind) and flexible (e.g., biogas, CHP, hydro) producers. Some virtual power plants also aggregate energy consumers if they have load-shifting potential. Actors with storage capacities can also be aggregated. The headquarters of the virtual power plant coordinates production, consumption, and storage so that electricity supply and demand are relatively balanced [
44].
Virtual power plants enable the integration of renewable energies and storage into the electricity system, which is central for the energy transition. Clients on the demand side will accept the system as long as virtual power plants do not become cost drivers and do not have a negative impact on the overall electricity system. Clients on the supply side ought to be interested in being aggregated in order to lower the (transaction) cost of selling electricity on the market. Setting up a virtual power plant deviates from the original business model of operating conventional power plants. The cost and implementation rate of realizing this shift also depends on the type of actors involved in the virtual power plant (decentralized energy produces, end users, storage providers). For instance, the company Next Kraftwerke aggregates around 7000 units with a networked capacity of 6000 MW. The consultancy Frost and Sulivan expects the market for virtual power plants to rise by 14% annually by 2022 [
45], with smaller companies currently being the market leaders (e.g., Next Kraftwerke, Energy2Market, Statkraft, sonnen GmbH). Taking into account the different aspects, the assessment of this business model is as follows (see
Table 8).
4.6. Comparison of the Five Business Models
The five examples demonstrate different options for withdrawing from conventional business models and surviving on the market. The business models described are just a selection of the options available, and could be extended by a number of further models. The assessment shows that each business model has its advantages and disadvantages. Nevertheless, individual companies should examine and test the feasibility of each business model.
The aim of the evaluation was not to provide energy companies with a perfectly designed roadmap for the future, but to formulate options. The
Table 9 summarizes the assessment of all five business models.
The assessment demonstrates that all business models comply with climate targets and policy strategies, and may contribute to the transition of the energy system. Risks include the (initial) investment, which may be very high. Competitors on the market must also be analyzed before deciding whether it is possible to exploit the (gap in the) market.
5. Conclusions and Outlook
Speaking in MLP terminology, this article introduces changes in the electricity sector regime in Germany. Between 2009 and 2017, conventional electricity generation in Germany declined from 501 to 437 TWh, i.e., by 64 TWh. This decline primarily affects the incumbents of the German electricity sector. Their decline amounted to 92 TWh over the same period. Thus, the Big 4’s decline in earnings has resulted in margin effects (spreads) in the conventional sector. The shares of major German energy companies have fallen sharply in value, and economic fundamentals are deteriorating. In 2009, conventional generation in Germany was the core business of Germany’s Big 4 energy companies. Now, however, this sector is experiencing an economic crisis. In the meantime, the earnings contribution is considerably lower and will continue to decline as the energy transition progresses.
The MLP approach helped us to identify central influencing factors on the landscape level that facilitated the fall of the Big 4. While the prevailing (and socially acceptable) principles that electricity supply had to be primarily safe and favorably priced facilitated oligopolistic or monopolistic structures, the changing landscape started to turn those principles upside down. Even before the Fukushima disaster, other incidents could have cast doubts on this business model (e.g., the German anti-nuclear movement of the 1980s, the Renewable Energy Sources Act (feed-in tariff) of 2000, or the government’s Energy Concept 2010). Apparently, however, these signals were not strong enough or were too isolated to create sufficient demand for a change in the electricity sector regime. Now, however, change is necessary, together with new sustainable business strategies and profitable business models.
Five potential business models for electricity companies were therefore assessed in the second part of this paper. In MLP terminology, e-mobility infrastructure, home system solutions, dynamic electricity pricing, the smart home, and virtual power plants can be considered niche innovations. The assessment factored in five criteria; apart from climate policy compatibility, these were acceptance, cost, implementation rate, and competitiveness. All business models have their pros and cons. Some insights are worth mentioning: for instance, the example of the virtual power plant shows that start-ups can succeed in capturing relevant business ideas (e.g., Next Kraftwerke). However, while start-ups must always contest big companies, the e-mobility example shows that current changes in the electricity landscape also allow companies from other sectors (e.g., transport) to become strong competitors. Such new competitors need not be financially under-resourced, like most start-ups; they may have the investment capacity required to finance capital-intensive assets. Both the supply of system solutions and smart home technology suggest that electricity companies can benefit from their traditional activities, owing to their long-term relationships with electricity consumers. Innovative solutions could, for instance, be paid via a premium on electricity tariffs, so that customers need not pay the potentially high cost upfront.
The MLP can be considered a useful tool for structuring external influencing factors on business models over time. A comparative analysis of different types of incumbents could also help to identify cross-sectoral influencing factors that contest conventional business models of incumbents from different sectors (electricity, transport, industry, etc.). Other methods could provide additional insights, including, for instance, expert interviews with CEOs or company experts. These could contribute to MCA by finding out from experts how potential business models are assessed from a company perspective.


