Abstract
CO2-based trans-critical and supercritical cycles have received more and more attention for power generation in many applications such as solar and nuclear energy due to the desirable thermal stability and properties of CO2 and the high efficiency and compact size of the plant. In this study, two combined cycles driven by the flue gas exhausted from the LM2500+ gas turbine, CO2-TC+OTC (organic trans-critical cycle) and CO2-TC/OTC, which can achieve a good trade-off between thermal efficiency and utilization of the waste heat, are investigated. Parameters optimization is carried out by means of genetic algorithm to maximize the net power output of the combined cycle and the effects of the key parameters on the cycle performance are examined. Results show that the exergy efficiency of CO2-TC+OTC is about 2% higher than that of CO2-TC/OTC. In CO2-TC+OTC, the recuperation process of CO2 causes the largest exergy loss; in CO2-TC/OTC, the largest exergy loss occurs in the heat recovery vapor generator, followed by the intermediate heat exchanger due to the larger variation of the specific heat capacity of CO2 and organic fluid in the heat addition process.
1. Introduction
Recovering waste heat from the engines, gas turbines and industrial processes such as cement, glass and metallurgy and so forth, can effectively improve energy utilization efficiency, thus reducing fossil fuel consumption and CO2 emissions. In addition to the direct heat utilization of waste heat, such as preheating air and raw materials, building heating and so forth, power recovery is another practical option, especially for the medium-to-high temperature waste heat sources.
Organic Rankine cycle (ORC) and organic trans-critical cycle (OTC) prove to be the promising technologies for the heat to power conversion under the low-to-medium temperature heat sources [1], which is mainly attributed to the lower critical temperature and the dry or isentropic characteristics of the organic working fluids. However, the organic compounds will suffer thermal decomposition at relatively high temperature, which affects the performance of ORC and OTC under the medium-to-high heat source conditions. Thus, carbon dioxide (CO2) has attracted more and more attention due to its high thermal stability. Additionally, it is environmentally friendly, non-corrosive, non-toxic, non-flammable, easy to obtain and with the desirable heat and mass transfer properties.
As the critical temperature of CO2 is relatively low (30.98 °C), trans-critical cycle (TC) and supercritical cycle (SC) with CO2 as the working fluid are commonly considered for the waste heat recovery. The CO2-TC features that the pressure of the heat addition process is higher than the critical pressure of CO2, while the heat rejection pressure is lower than the critical pressure. Both the pressures of heat addition and heat rejection process of CO2-SC are above the critical pressure of CO2. Unlike the general Brayton cycle, the CO2 at the compressor inlet of CO2-SC is near the critical point, which is mainly to reduce the power consumption of the compression process since CO2 behaves more like an incompressible fluid in this region. A better temperature match between the flue gas and the supercritical CO2 can be achieved in the CO2-TC and CO2-SC, which enables the smaller exergy loss in the heat addition process of CO2 and higher utilization efficiency of the waste heat. In addition, the higher fluid density of supercritical CO2 and the lower volume ratio in the expansion process permits the efficient and compact turbomachinery design.
The critical pressure of CO2 is 7.38 MPa. Considering the conventional cooling water condition, the heat rejection pressure of CO2-TC is just slightly lower than the critical pressure [2]. Therefore, the pressure ratio of CO2-TC and CO2-SC is limited since the high pressure may threaten the safety of the system. The lower pressure ratio results in a lower temperature drop during the expansion process, which is detrimental to the thermal efficiency of the cycle. In this context, introducing a recuperator to recover the heat of turbine exhaust is an efficient solution to improve the cycle thermal efficiency. Echogen Power System LLC has developed the waste heat power system scalable from 250 kW to greater than 50 MW using the CO2-SC technology and they proved that the recuperative CO2-SC can provide the higher power output with the lower levelized cost of energy (LCOE) than the conventional steam Rankine cycle for the waste heat recovery of gas turbine [3].
In a recuperator, the cold side is the high pressure supercritical fluid and the hot side is the low-pressure vapor (for CO2-TC) or supercritical fluid (for CO2-SC). The specific heat capacity of the CO2 on both sides is quite different, especially in the low-temperature region (see Figure 1a), which leads to the lower recuperator effectiveness and larger exergy loss in the heat transfer process, as the T-Q diagram shows in Figure 1b. To compensate the drawback, the recompressed recuperative cycle is proposed, in which the recuperation process is occurred in two heat exchangers-high temperature recuperator and low temperature recuperator. The temperature match can be improved by adjusting the mass flow ratio of the cold and hot fluid in the low-temperature recuperator. Thus, the recompressed recuperative cycle shows the highest thermal efficiency among different cycle configurations based on CO2-SC [4].
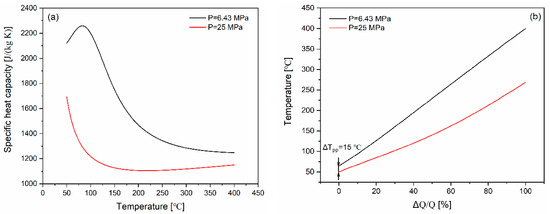
Figure 1.
The (a) specific heat capacity and (b) temperature match of the two sides in the recuperator of CO2-TC.
In some applications, the higher thermal efficiency is the design objective for the CO2-TC and CO2-SC, such as nuclear [5], coal-fired [6] and solar [7] power plants. However, when it comes to waste heat recovery, we pay more attention to maximizing the net power output of the system since the waste heat is generally discharged into the environment after releasing heat to the plant. The recuperation and recompression mentioned above can increase the heat absorption temperature of CO2, which will accordingly reduce the heat extraction from the waste heat source.
To achieve the deep utilization of the waste heat for CO2-TC and CO2-SC systems, integrating a bottom cycle X to absorb the residual heat of the heat source is an effective solution, forming the CO2-TC(SC)+X combined cycle. The proposed bottom cycles include CO2-SC [8], CO2-TC [9] and ORC [10]. Another solution to ensure the higher utilization efficiency of the waste heat is to use a bottom cycle Y to recover the heat of turbine exhaust CO2 instead of using the recuperator, forming the CO2-TC(SC)/Y combined cycle. Similarly, the bottom cycles can be CO2-TC [11], CO2-SC [12], ORC [13], OTC [14]. These researches have indicated that the two kinds of the combined cycle can achieve better thermodynamic performance than the stand-alone recuperated and recompressed CO2-TC and CO2-SC. It is worth mentioning that if the bottom cycle is the same as the top cycle, they can share some components, such as the cooler and compressor (for CO2-SC) or condenser and pump (for CO2-TC), so as to reduce the cost and space of the combined system. Correspondingly, the endothermic pressure and exothermic pressure of the top and bottom cycles must be kept equal respectively, which may lead to the insufficient optimization of the system performance.
Reference [15] gave a thorough literature review and detailed analysis of different layouts of CO2-SC. However, the research of a clear comparison between the above two kinds of the combined cycle is quite rare. In this study, CO2-TC is selected as the top cycle and OTC is selected as the bottom cycle owes to its better temperature match with the waste heat source, forming two combined cycles: CO2-TC+OTC, CO2-TC/OTC. The purpose of this study is to find out which of the two combined cycles shows better thermodynamic performance for waste heat recovery. The influence of some key parameters on the system performance is also examined. The parametric optimization is performed to maximize the net power output of the two combined cycles by using genetic algorithm based on the MATLAB platform and the control parameters in genetic algorithm (GA) have been described in our previous work [16]. Pentane and R134a are selected as the working fluid for OTC and the thermodynamic properties of the fluids are calculated by the Refprop NIST 9.0 [17]. The waste heat source to drive the combined cycles is from the LM2500+ gas turbine [18] and the initial temperature and mass flow rate of the exhaust gas are 533.8 °C and 89.5 kg/s.
2. System Descriptions
2.1. CO2-TC+OTC
According to the results of Reference [10], the thermodynamic and economic performance of the combined cycle CO2-SC+ORC with regenerative CO2-SC as the top cycle is superior to that with recompressed CO2-SC. Hence, a single recuperated layout of CO2-TC is considered in this study.
The schematic and T-s diagrams of the regenerative CO2-TC+OTC combined system are shown in Figure 2 and Figure 3. The exhaust gas releases heat to the CO2 and organic fluid in HRVG1 and HRVG2 (heat recovery vapor generator) successively. The generated high temperature CO2 and organic fluid expand in the turbine1 and turbine2 to do work (1H–2H, 1L–2L) respectively. The organic fluid exhausted from turbine2 flows into the condenser2 and releases heat to the cooling water (2L–4L). The saturated liquid leaving the condenser2 will be pressurized by the pump2 (4L–5L) and then enters the HRVG2 to absorb heat from the heat source (5L–1L). The exhaust CO2 from turbine1 enters the recuperator to preheat the low-temperature CO2 coming from the pump1 (2H–3H) and then liquefied by the cooling water in the condenser1 (3H–4H). The liquid CO2 exiting condenser1 is compressed by the pump1 (4H–5H) and heated in the recuperator (5H–6H) before flowing into the HRVG1 to absorb the waste heat (6H–1H).
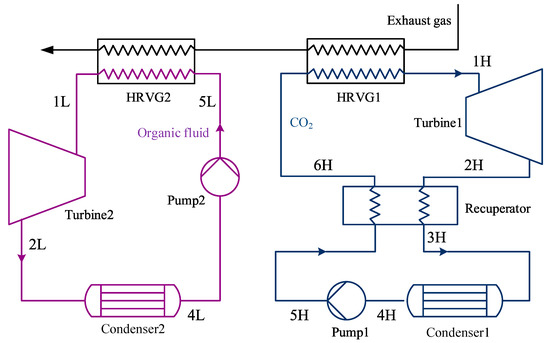
Figure 2.
Schematic diagram of CO2-TC+OTC combined system.
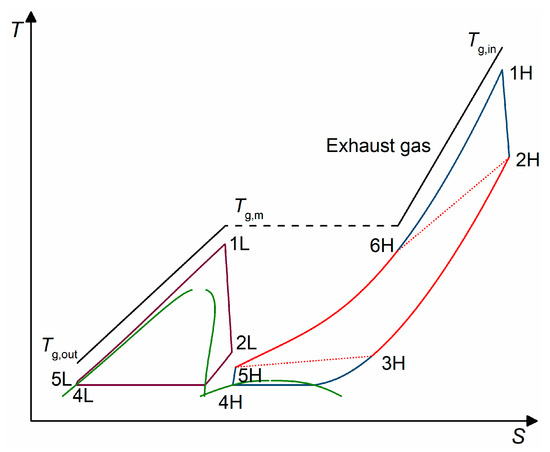
Figure 3.
T-s diagram of CO2-TC+OTC combined system.
2.2. CO2-TC/OTC
The schematic and T-s diagrams of the CO2-TC/OTC combined system are shown in Figure 4 and Figure 5. To extract as much heat as possible from the waste heat source, the recuperator is not included in the top CO2-TC, which means the CO2 stream at pump1 exit flows directly into the HRVG without preheating. The CO2 stream exhausted from turbine1 drives the bottom OTC system and the organic fluid is heated in the IHE (intermediate heat exchanger).
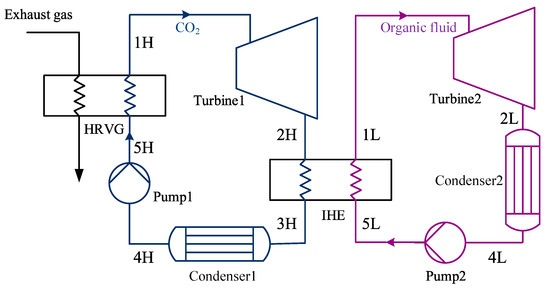
Figure 4.
Schematic diagram of CO2-TC/OTC combined system.
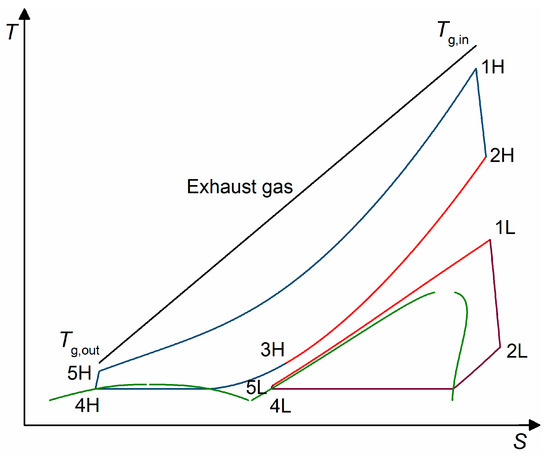
Figure 5.
T-s diagram of CO2-TC/OTC combined system.
3. Methodology
3.1. Thermodynamic Modeling
The following assumptions were made in establishing the thermodynamic models of the combined system. The working fluid was in a steady flow state in each component. The change in kinetic and potential energies of working fluid flowing in the system was negligible. The pressure drop and heat dissipation in the heat exchangers and pipes were also neglected.
Table 1 gives the energy and exergy balance equations in each component of the two combined cycles. Wherein, is the heat transferred in the process, kW; , and denote the mass flow rate, enthalpy and entropy of the fluid, kg/s, kJ/kg, kJ/(kgK); means the ambient temperature, K; refers to the power input or output of the process, kW; is the exergy loss of the process, kW. The equations in turbine1, condenser1, pump1, turbine2, condenser2, pump2 of CO2-TC/OTC are the same as that of the CO2-TC+OTC.

Table 1.
Thermodynamic models in each component of the two combined cycles.
The net power output of the combined cycle is given by:
The exergy efficiency of the combined cycle is defined as:
where and are the enthalpy and entropy of exhaust gas when it is cooled to the ambient temperature.
3.2. Turbine Efficiency Calculation
A three-stage axial turbine was considered for the CO2-TC and OTC systems. The turbine efficiency varies with the operating parameters and thermophysical properties of the working fluid. Reference [19] indicated that the turbine efficiency can be evaluated based on three independent variables including the size parameter SP, volume ratio Vr and the specific speed Ns. The calculation correlation for the maximum efficiency of a three-stage axial turbine under the optimum specific speed given in Reference [19] is shown as Equation (3) and the coefficients used in the correlation are listed in Table 2.
Table 2.
Coefficients used in the turbine efficiency calculation correlation [19].
3.3. Decision Variables and Specified Parameters
The decision variables in the optimization process of the combined cycle were the turbine inlet pressure and temperature for CO2-TC and OTC. The ranges of the variables are shown in Table 3. To ensure the safe and stable operation of the system, the maximum heat addition pressure of CO2 and organic fluid as set as 25 MPa. In order to avoid liquid erosion of the turbine blades, the expansion process was not allowed to go through the saturated zone for the OTC system. refers to the maximum temperature at which the organic fluid does not decompose and the values of for pentane and R134a are 280 °C [20] and 368 °C [21] respectively.
Table 3.
Decision variables and the lower and upper boundaries.
The specified parameters of the combined system are listed in Table 4. The composition and mass fraction of the exhaust gas were as follows: N2 = 76%, H2O = 11%, CO2 = 13%. The condensing temperature of both the CO2-TC and OTC was 25 °C. It should be noted that the pinch point temperature difference always occurs at the outlet of hot fluid in the recuperator (see Figure 1b); however, in the heat exchange process between the exhaust gas and CO2, the exhaust gas and organic fluid in HRVG, as well as between the CO2 and organic fluid in IHE, the position of the pinch point temperature difference varies with the temperature and pressure of the fluids. Therefore, in the optimization process, the outlet temperatures of the hot fluid that is, , and were instantaneously adjusted to ensure that the pinch point temperature difference in the heat exchange process was 15 °C.
Table 4.
Specified parameters of the combined system.
4. Results and Discussion
4.1. Performance Analysis of CO2-TC+OTC
The variations of the net power output of CO2-TC, OTC using R134a and combined cycle with the turbine inlet temperature of CO2 (T1H) are shown in Figure 6. The heat addition pressure of CO2 (P1H) remains at 20 MPa and the temperature of exhaust CO2 (T2H) increases with the increase of T1H. After the recuperation process, the HRVG inlet temperature of CO2 (T6H) will rise accordingly, which results in the increase of thermal efficiency and the decrease of heat absorption of CO2-TC. Hence, under the combined effect of the two trends, the net power output of CO2-TC increases first and then decreases.
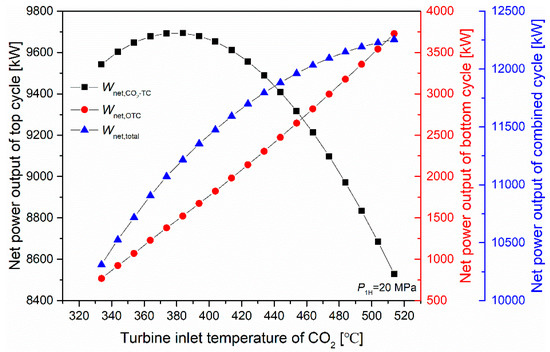
Figure 6.
Variations of net power output with turbine inlet temperature of CO2 for CO2-TC+OTC.
As the Tg,m increases, the thermal efficiency and net power output of OTC increase. It should be noted that the net power output of OTC shown in Figure 6 is the maximum power under the heat source condition whose initial temperature is Tg,m corresponding to different T1H. The effects of turbine inlet temperature and pressure of the organic working fluid on the thermal efficiency and net power output of OTC have been illustrated in our previous work [16].
The increment of the net power output of OTC is greater than the decrement of the net power output of CO2-TC. Thus, the maximum total net power output of the combined cycle is achieved when the T1H reaches its upper limit.
The variations of net power output with the turbine inlet pressure of CO2 (P1H) are shown in Figure 7. The T1H is kept at the upper limit of 518.8 °C. The thermal efficiency and heat addition of CO2-TC increase with the increase of P1H, which leads to an increase in the net power output of CO2-TC. The net power output of OTC decreases as the Tg,m decreases, while its decrement is lower than the increment of the net power output of CO2-TC. Thus, the optimum P1H to maximize the net power output of the combined cycle is 25 MPa.
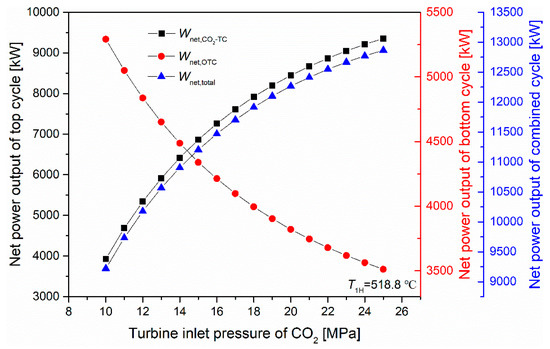
Figure 7.
Variations of net power output with turbine inlet pressure of CO2 for CO2-TC+OTC.
The decision variables of the combined cycle CO2-TC+OTC with R134a and pentane as the working fluid are optimized by using genetic algorithm. The variations of the net power output of the combined cycle with generation in the optimization process are shown in Figure 8. It can be seen that when the generation reaches about 50, the result tends to converge.
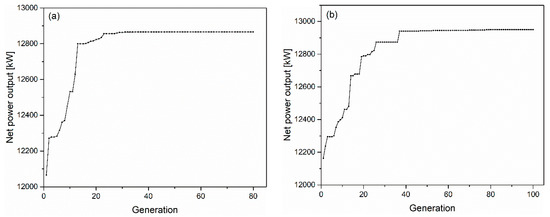
Figure 8.
Variation of objective function value with generation for CO2-TC+OTC (a) R134a, (b) Pentane.
The optimized variables and the maximum net power output of the combined cycle CO2-TC+OTC are listed in Table 5. As analyzed above, the optimal turbine inlet temperature and pressure of CO2 are their respective upper limits. The net power output of the bottom cycle OTC is approximately 40% of that of the top cycle CO2-TC and OTC using pentane achieves a slightly higher net power output than that using R134a. Figure 9 reveals the T-Q diagram of the exhaust gas and working fluid and it can be seen that the thermal matching better the heat source and working fluid is quite better for the CO2-TC+OTC combined cycle.
Table 5.
Optimized variables and cycle performance of two combined cycles.
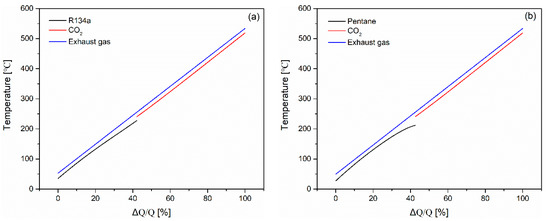
Figure 9.
T-Q diagram of exhaust gas and working fluid for CO2-TC+OTC (a) R134a, (b) Pentane.
4.2. Performance Analysis of CO2-TC/OTC
Figure 10 indicates the variations of the outlet temperature of the pump (T5H) and turbine (T2H) and thermal efficiency with the heat addition pressure of CO2 (P1H) for the top cycle CO2-TC. The higher P1H results in the higher T5H and the lower T2H. The former leads to the increase of exhaust gas outlet temperature, which means the reduction of heat release for the heat source, while the latter increases the cycle thermal efficiency. The detrimental effect of the heat absorption reduction on the net power output of the cycle is less than that of the beneficial effect of the thermal efficiency increase. Thus, the net power output of CO2-TC increases as the P1H increases, as shown in Figure 11. The maximum net power output of OTC with R134a as the working fluid will decrease with the decrease of T2H, yet its decrement is smaller than the net power output increment of CO2-TC. Hence, as illustrated in Figure 11, increasing the heat addition pressure of CO2 helps to increase the total net power output of the combined cycle CO2-TC/OTC.
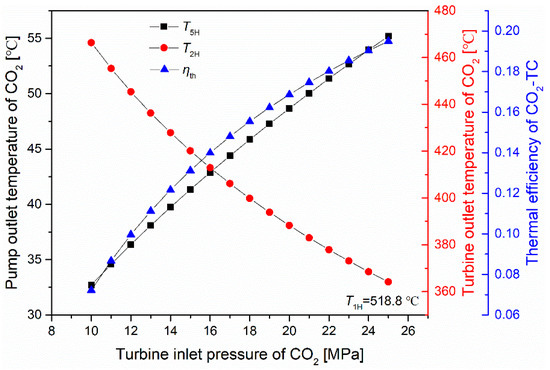
Figure 10.
Variations of pump and turbine outlet temperatures and thermal efficiency with turbine inlet pressure of CO2 for CO2-TC.
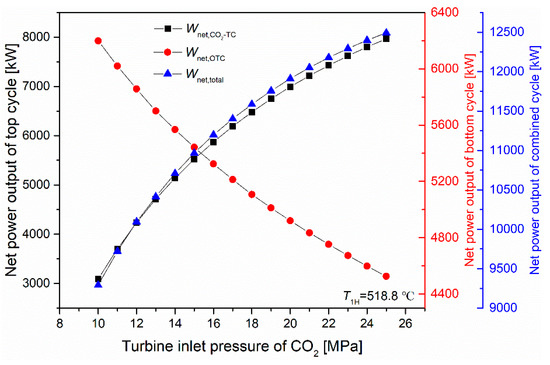
Figure 11.
Variations of net power output with turbine inlet pressure of CO2 for CO2-TC/OTC.
The influence of the turbine inlet temperature of CO2 (T1H) on the system net power output is shown in Figure 12. The average heat absorption temperature and heat rejection temperature of CO2-TC increase with the increase of T1H, thus there exists an optimal T1H to maximize the thermal efficiency and net power output of CO2-TC since the heat input of the cycle remains unchanged. Although the mass flow rate of CO2 decreases as T1H increases, the maximum net power output of OTC still increases with the increase of T2H. Finally, the maximum total net power output of the combined cycle CO2-TC/OTC is obtained as T1H reaches the upper limit.
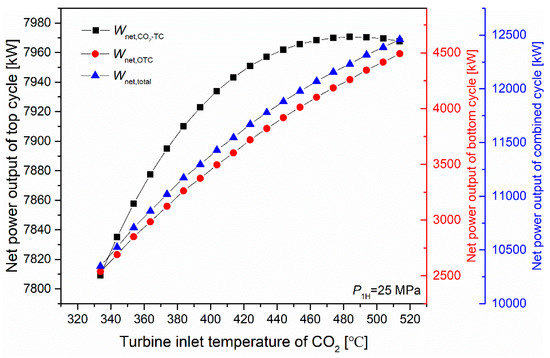
Figure 12.
Variations of net power output with turbine inlet temperature of CO2 for CO2-TC/OTC.
The optimized variables and the maximum net power output of combined cycle CO2-TC/OTC are listed in Table 5. Also, the optimal turbine inlet temperature and pressure of CO2 are their respective upper limits for CO2-TC/OTC. Figure 13 shows the comparison of the net power output of two combined cycles and it can be seen that the net power output of CO2-TC+OTC is slightly higher than that of CO2-TC/OTC. The net power output of OTC in CO2-TC/OTC is higher than that of the OTC in CO2-TC+OTC and the pentane still outperforms R134a since it can extract a little more heat from the exhausted CO2 with a lower thermal efficiency of the cycle, which have been revealed in the T-Q diagram of CO2 and organic fluid in the IHE shown in Figure 14.
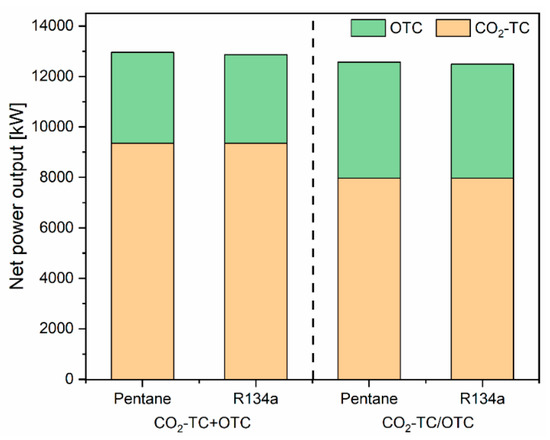
Figure 13.
Net power output comparison of the two combined cycles.
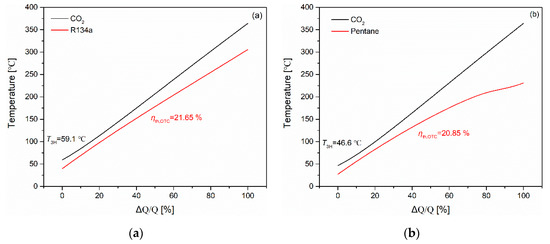
Figure 14.
T-Q diagram of CO2 and organic fluid (a) R134a, (b) Pentane in the intermediate heat exchanger (IHE) of CO2-TC/OTC.
4.3. Exergy Analysis of the Two Combined Cycles
The exergy analysis to evaluate the exergy loss in each component of the two combined cycles is shown in Table 6. The input exergy of the cycle is equal to the net power output plus the total dissipated exergy in each component. For CO2-TC+OTC, the sum of input exergy of top and bottom cycle and the exergy contained in the discharged gas is the total exergy of the heat source. For CO2-TC/OTC, the input exergy of OTC is from the exhausted CO2 and the heat source exergy is equal to the sum of the input exergy of the top cycle and the discharged gas exergy.
Table 6.
The exergy inputs, outputs and losses for the combined cycles.
The exergy efficiency of CO2-TC+OTC is about 2% higher than that of CO2-TC/OTC. The distribution of the exergy loss in each component for the two combined cycles using pentane is shown in Figure 15. In CO2-TC+OTC, the recuperation process causes the largest exergy loss, which is due to the large difference in specific heat capacity of the hot and cold fluids in the recuperator (see Figure 1). Recompression can effectively reduce the exergy loss in the recuperator and the Tg,m will increase accordingly, which may lead to an increase of exergy loss in the organic HRVG. In CO2-TC/OTC, the largest exergy loss occurs in HRVG, followed by IHE. The specific heat capacity of CO2 and organic fluid in the heat addition process changes markedly (see Figure 16), resulting in the poor thermal match between exhaust gas and CO2 in HRVG and between CO2 and organic fluid in IHE.
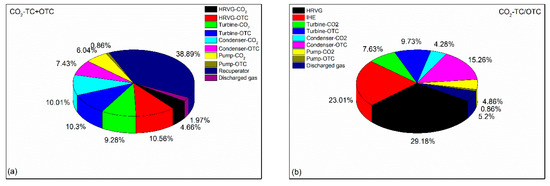
Figure 15.
Distribution of exergy loss in each component of the combined cycle (a) CO2-TC+OTC; (b) CO2-TC/OTC.
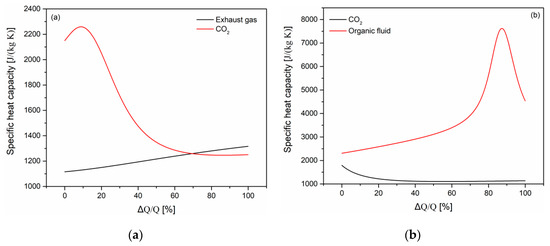
Figure 16.
Variation of specific heat capacity of fluids in (a) HRVG; (b) IHE for CO2-TC/OTC.
5. Conclusions
This study aims to compare the thermodynamic performance of two combined cycles that is, CO2-TC+OTC and CO2-TC/OTC, for waste heat recovery. Parameters optimization is performed by means of genetic algorithm to maximize the net power output of the cycle and exergy analysis is also examined to evaluate the exergy loss in each component. R134a and pentane are considered as the working fluid for the bottom OTC and the decision variables are turbine inlet temperature and pressure of CO2 and organic fluid in the top and bottom cycle respectively. The main conclusions are briefly summarized below:
- (1)
- As the turbine inlet temperature and pressure of CO2 increase, the total net power output of the combined cycle is increased, even though the net power output of the top or bottom cycle may decrease as a result.
- (2)
- The exergy efficiency of CO2-TC+OTC is about 2% higher than that of CO2-TC/OTC and pentane outperforms R134a in using as the working fluid for bottom OTC.
- (3)
- In CO2-TC+OTC, the recuperation process of CO2 causes the largest exergy loss due to the large difference in specific heat capacity of the hot and cold fluids in the recuperator. In CO2-TC/OTC, the largest exergy loss occurs in HRVG, followed by IHE, which is attributed to the poor temperature match in the heat exchanger caused by the larger variation of specific heat capacity of CO2 and organic fluid in the heat addition process.
Author Contributions
Conceptualization, H.W.; Data curation, L.R.; Formal analysis, L.R.; Funding acquisition, H.W.; Investigation, L.R.; Methodology, L.R.; Project administration, H.W.; Software, L.R.; Writing—original draft, L.R.; Writing—review & editing, H.W. All authors have read and agreed to the published version of the manuscript.
Funding
This research was funded by the National Natural Science Foundation of China (No. 51376134).
Conflicts of Interest
The authors declare no conflict of interest.
Nomenclature
| e | exergy (kJ/kg) |
| h | enthalpy (kJ/kg) |
| exergy loss (kW) | |
| mass flow rate (kg/s) | |
| P | pressure (kPa) |
| heat transfer rate (kW) | |
| s | entropy (kJ/(kgK)) |
| SP | size parameter (m) |
| T | temperature (°C) |
| Vr | volume ratio |
| power (kW) |
Greek Letters
| efficiency | |
| Δ | difference |
| Subscript | |
| crit | critical |
| g | gas |
| in | inlet |
| m | medium |
| out | outlet |
| pp | pinch point |
| th | thermal |
| turb | turbine |
| wf | working fluid |
Abbreviations
| HRVG | heat recovery vapor generator |
| LCOE | Levelized cost of energy |
| OTC | organic trans-critical cycle |
| TC | trans-critical cycle |
| SC | supercritical cycle |
References
- Chen, H.; Goswami, D.Y.; Stefanakos, E.K. A review of thermodynamic cycles and working fluids for the conversion of low-grade heat. Renew. Sustain. Energy Rev. 2010, 14, 3059–3067. [Google Scholar] [CrossRef]
- Pan, L.; Li, B.; Shi, W.; Wei, X. Optimization of the self-condensing CO2 transcritical power cycle using solar thermal energy. Appl. Eng. 2019, 253, 113608. [Google Scholar] [CrossRef]
- Persichilli, M.; Kacludis, A.; Zdankiewicz, E.; Held, T. Supercritical CO2 Power Cycle Developments and Commercialization: Why sCO2 can Displace Steam. In Proceedings of the Power-Gen India & Central Asia, Pragati Maidan, New Delhi, India, 19–21 April 2012. [Google Scholar]
- Ahn, Y.H.; Bae, S.J.; Kim, M.S.; Cho, S.K.; Baik, S.J.; Lee, J.I.; Cha, J.E. Cycle layout studies of S-CO2 cycle for the next generation nuclear system application. In Proceedings of the Korean Nuclear Society Autumn Meeting, PyeongChang, Korea, 30–31 October 2014. [Google Scholar]
- Ahn, Y.; Lee, J.I. Study of various Brayton cycle designs for small modular sodium-cooled fast reactor. Nucl. Eng. Des. 2014, 276, 128–141. [Google Scholar] [CrossRef]
- Zhang, Y.; Li, H.; Han, W.; Bai, W.; Yang, Y.; Yao, M.; Wang, Y. Improved design of supercritical CO2 Brayton cycle for coal-fired power plant. Energy 2018, 155, 1–14. [Google Scholar] [CrossRef]
- Binotti, M.; Astolfi, M.; Campanari, S.; Manzolini, G.; Silva, P. Preliminary assessment of sCO2 cycles for power generation in CSP solar tower plants. Appl. Eng. 2017, 204, 1007–1017. [Google Scholar] [CrossRef]
- Hou, S.; Wu, Y.; Zhou, Y.; Yu, L. Performance analysis of the combined supercritical CO2 recompression and recuperated cycle used in waste heat recovery of marine gas turbine. Energy Convers. Manag. 2017, 151, 73–85. [Google Scholar] [CrossRef]
- Cao, Y.; Ren, J.; Sang, Y.; Dai, Y. Thermodynamic analysis and optimization of a gas turbine and cascade CO2 combined cycle. Energy Convers. Manag. 2017, 144, 193–204. [Google Scholar] [CrossRef]
- Hou, S.; Zhou, Y.; Yu, L.; Zhang, F.; Cao, S. Optimization of the combined supercritical CO2 cycle and organic Rankine cycle using zeotropic mixtures for gas turbine waste heat recovery. Energy Convers. Manag. 2018, 160, 313–325. [Google Scholar] [CrossRef]
- Astolfi, M.; Alfani, D.; Lasala, S.; Macchi, E. Comparison between ORC and CO2 power systems for the exploitation of low-medium temperature heat sources. Energy 2018, 161, 1250–1261. [Google Scholar] [CrossRef]
- Wright, S.A.; Davidson, C.S.; Scammell, W.O. Thermo-economic analysis of four sCO2 waste heat recovery power systems. In Proceedings of the 5th International Symposium on Supercritical CO2 Power Cycles, San Antonio, TX, USA, 29–31 March 2016. [Google Scholar]
- Akbari, A.D.; Mahmoudi, S.M. Thermoeconomic analysis & optimization of the combined supercritical CO2 (carbon dioxide) recompression Brayton/organic Rankine cycle. Energy 2014, 78, 501–512. [Google Scholar]
- Li, C.; Wang, H. Power cycles for waste heat recovery from medium to high temperature flue gas sources-from a view of thermodynamic optimization. Appl. Eng. 2016, 180, 707–721. [Google Scholar] [CrossRef]
- Manente, G.; Fortuna, F.M. Supercritical CO2 power cycles for waste heat recovery: A systematic comparison between traditional and novel layouts with dual expansion. Energy Convers. Manag. 2019, 197, 111777. [Google Scholar] [CrossRef]
- Ren, L.; Wang, H. Parametric optimization and thermodynamic performance comparison of organic trans-critical cycle, steam flash cycle, and steam dual-pressure cycle for waste heat recovery. Energies 2019, 12, 4623. [Google Scholar] [CrossRef]
- Lemmon, E.W.; Huber, M.L.; McLinden, M.O. Reference Fluid Thermodynamic and Transport Properties REFPROP; Version 9.0; National Institute of Standards and Technology: Gaithersburg, MD, USA, 2013.
- Haglind, F.; Elmegaard, B. Methodologies for predicting the part-load performance of aero-derivative gas turbines. Energy 2009, 34, 1484–1492. [Google Scholar] [CrossRef]
- Macchi, E.; Astolfi, M. Organic Rankine Cycle (ORC) Power Systems-Axial Flow Turbines for Organic Rankine Cycle Applications; Woodhead Publishing, Politecnico di Milano: Milan, Italy, 2017; Volume 9, pp. 299–319. [Google Scholar]
- Dai, X.; Shi, L.; An, Q.; Qian, W. Chemical kinetics method for evaluating the thermal stability of Organic Rankine Cycle working fluids. Appl. Therm. Eng. 2016, 100, 708–713. [Google Scholar] [CrossRef]
- Calderazzi, L.; di Paliano, P.C. Thermal stability of R-134a, R-141b, R-1311, R-7146, R-125 associated with stainless steel as a containing material. Int. J. Refrig. 1997, 20, 381–389. [Google Scholar] [CrossRef]


© 2020 by the authors. Licensee MDPI, Basel, Switzerland. This article is an open access article distributed under the terms and conditions of the Creative Commons Attribution (CC BY) license (http://creativecommons.org/licenses/by/4.0/).