Article

Massively Parallel Large Eddy Simulation of Rotating Turbomachinery for Variable Speed Gas Turbine Engine Operation †

1
Department of Aerospace Engineering, University of Maryland, College Park, MD 20742, USA
2
Vehicle Technology Directorate, US Army Research Laboratory, Aberdeen Proving Ground, MD 21005, USA
3
Cascade Technologies Inc., Palo Alto, CA 943035, USA
*
Authors to whom correspondence should be addressed.
This paper is an extended version of our paper published in ASME Turbo Expo 2019: Turbomachinery Technical Conference and Exposition, Phoenix, AZ, USA, 17–21 June 2019.
Energies 2020, 13(3), 703; https://doi.org/10.3390/en13030703
Submission received: 20 December 2019 / Revised: 22 January 2020 / Accepted: 3 February 2020 / Published: 6 February 2020

Abstract

:
Gas turbine engines are required to operate at both design and off-design conditions that can lead to strongly unsteady flow-fields and aerodynamic losses severely impacting performance. Addressing this problem requires effective use of computational fluid dynamics tools and emerging models that resolve the large scale fields in detail while accurately modeling the under-resolved scale dynamics. The objective of the current study is to conduct massively parallel large eddy simulations (LES) of rotating turbomachinery that handle the near-wall dynamics using accurate wall models at relevant operating conditions. The finite volume compressible CharLES solver was employed to conduct the simulations over moving grids generated through Voronoi-based unstructured cells. A grid sensitivity analysis was carried out first to establish reliable parameters and assess the quality of the results. LES simulations were then conducted to understand the impact of blade tip clearance and operating conditions on the stage performance. Variations in tip clearance of 3% and 16% chord were considered in the analysis. Other design points included operation at 100% rotor speed and off-design conditions at 75% and 50% of the rotor speed. The simulation results showed that the adiabatic efficiency improves dramatically with reduction in tip gap due to the decrease in tip leakage flow and the resulting flow structures. The analysis also showed that the internal flow becomes highly unsteady, undergoing massive separation, as the rotor speed deviates from the design point. This study demonstrates the capability of the framework to simulate highly turbulent unsteady flows in a rotating turbomachinery environment. The results provide much needed insight and massive data to investigate novel design concepts for the US Army Future Vertical Lift program.

1. Introduction

One of the key objectives of the US Army Future Vertical Lift modernization program is the development of advanced gas turbine engine concepts for enhanced mission capability and endurance. Computational fluid dynamics plays an essential role in achieving this goal, and has been used with significant success in the cost-effective design of modern engines. Historically, simulations of the internal flow in gas turbine engines have remained limited to steady state models, mainly due to the exceedingly large computational resource requirements needed to perform the analysis and the wide range of flow physics scales present. However, models that can capture unsteady flow phenomena in turbomachinery are of growing interest due to the urgent need to improve the aerodynamic and thermal performance for future engine concepts. Due to the rapid increase in computational power and algorithms, large-scale massively parallel simulations now provide the ability to investigate a wide range of unsteady flow problems with fewer assumptions and simplifications. These have set the stage for the emergence of high-fidelity large eddy simulation tools, which open the possibility to explore a much wider design space and will be crucial towards the development of very powerful, high efficiency, turbomachinery design innovations.
In today’s engine, the turbine blades shape and position are designed for peak performance at a fixed rotor speed and incidence angle. This operating condition is called the design point, and is considered the optimal condition. At the design point, the alignment of the blade tip and flow incidence allows a smoother passage through the nozzle vanes providing the best aerodynamic and thermal performance. Operating at off-design conditions introduces excessive flow separation and thermal stresses, and thereby drastically reduces the aerodynamic performance. To meet next generation vertical take-off and landing rotorcraft requirements, engines will need to operate with variable speeds, including operation at multiple off-design points. For example, during hover flight, the engine will operate at maximum speed and reduce to 51% speed during cruise flight [1]. To maintain performance at multiple speeds, new design strategies are needed that can effectively minimize losses while maintaining optimal incidence angles at all times with the blade. Such “incidence tolerant” blade concepts have been investigated by NASA Glenn Research Center and U.S. Army Research Laboratory for their application to variable-speed power turbines (VSPT) [2]. VSPT is a key enabling concept needed for balanced performance of high-speed tilt rotorcraft. Multi-speed operation introduces a wide range of internal flow velocities, Reynolds numbers, and incidence angles on the blade [3] that will be far from optimized. Attempting to maintain efficiency solely by slowing down the rotor speed at a fixed pitch may not be feasible for sustained operation.
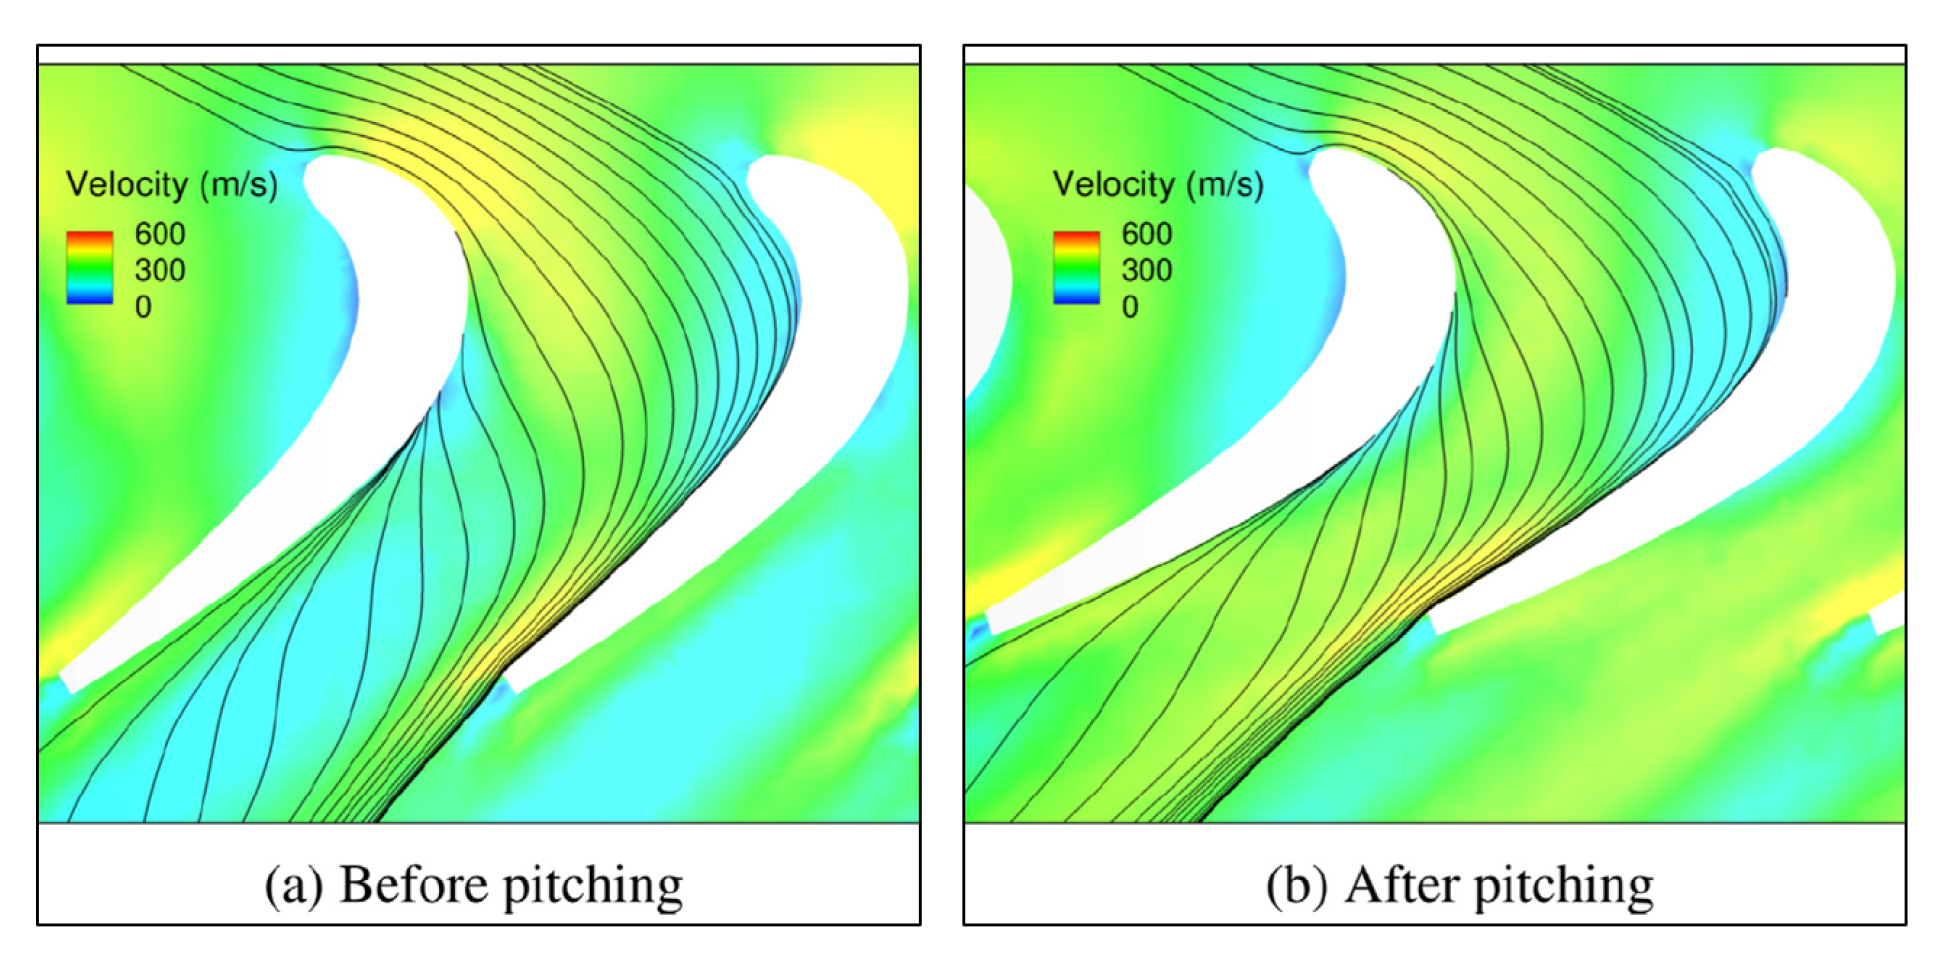
A useful analysis tool in turbomachinery design is the velocity triangle diagram, here shown in Figure 1, drawn for both inlet and outlet sections of nozzle guide vane. At design conditions, the incoming flow to the stator inlet has a tangential velocity component allowing it to enter smoothly into the stator blade passage with zero incidence. The flow then exits the stator at the absolute velocity vector C 2 , as shown in Figure 1. The rotor spins with a uniform tangential velocity of the frame of motion specified by U. The fixed orientation (or angle) of the rotor blades ensures optimal flow passage within the nozzle guide vanes. At off-design conditions, such as in multi-speed FVL engines, the rotor speeds may vary from take-off at 100% speed to cruise flight at 51% speed. Figure 1 also shows the resulting velocity triangles at the off-design conditions of interest. At reduced speeds, the incoming flow to the rotor no longer enters the nozzle guide vane passages smoothly at zero incidence, as shown by the vector V 2 . This flow misalignment creates a rapid increase in aerodynamic losses due to increased flow separation. Numerous concepts have been explored in the literature to address this issue. Variable stator vane design is one such concept that has been successfully applied to marine and ground based turbines [4]. Under this concept, the performance of the turbine engine is improved by physically changing the angle of the inlet guide vane [5,6,7,8]. The focus in most of these studies, however, has been on improving compressor performance rather than the performance of turbine geometry. Roy-Aikins [9] demonstrated that the variable inlet guide vanes can be utilized to control the airflow into an engine and maintain its aerodynamic performance. They also reported that vane modulation is limited by inlet separation, fan stall, and resulting vibratory stresses. This limits the operating range and extensibility of variable stator vane technology. A more recent concept included articulating the rotor blades to align with the incoming incident flow and aid in minimizing losses. This was demonstrated by Murugan et al. [10], as shown in Figure 2, where articulating the rotor blades reduces flow separation and the local wake velocity. The extent to which the rotor blades can be articulated is limited by mechanical design factors and the possibility of flow choking. One way to minimize choking is to synchronously articulate the stator and rotor blades, while constraining the throat area to maintain performance through a wide range of operating conditions.
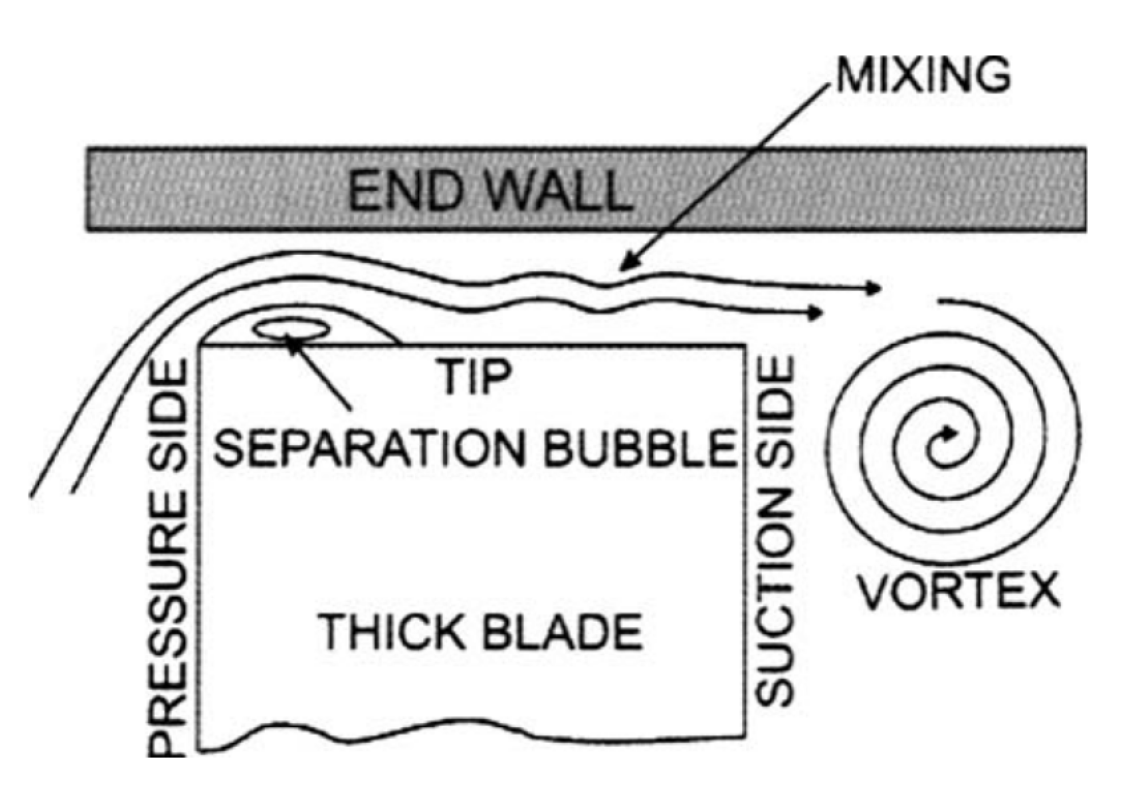
Tip clearance is another crucial design parameter that substantially impacts the performance of the high-pressure turbine stage. Tip clearance denotes the radial gap between the rotor blades and the stationary shroud. It is required to prevent rubbing between the blades and the shroud structure. However, the pressure difference between the suction and the pressure side of the blades result in leakage of the fluid through the gap leading to undesirable flow separation and mixing, as shown in Figure 3. The leaked fluid does not transfer any energy to the turbine blades and therefore directly contributes to performance losses. The requirement for high efficiency has therefore led to substantial research towards determining the optimal value for the tip clearance and quantifying the losses associated with it. In their experiments, Holeskt and Futral [11] demonstrated that a larger tip clearance results in turbine efficiency reduction. Booth et al. [12] found that the tip clearance of 1% results in 1–3% loss in turbine stage efficiency. By using a validated tip clearance model, Bringhenti and Barbosa [13] showed that the reduction in tip clearance allows for engine operation at lower temperatures because of improved efficiency. Other relevant studies have utilized idealized models for quantifying heat transfer and losses associated with tip clearance [14,15,16]. Only in recent years, numerical simulations have been conducted to resolve flow structures formed at the tip clearance. You et al. [17,18] performed LES simulations on low-speed compressor and captured complex tip-clearance vortex structures. Meng et al. [19] utilized RANS solver and shear stress turbulence model to quantify the influence of tip clearance on flow-field and obtain heat transfer characteristics near the blade tip. At present, there are no LES studies focusing on the tip-leakage flow-field for the single-stage turbine. In this study, we utilized the LES solver to investigate the effect of tip clearance on the integrated adiabatic efficiency of the engine. Conventionally, RANS based numerical models have been used for turbomachinery flows [20,21] because of their low cost and ability to predict mean flow behavior with reasonable accuracy. At off-design operation, however, the turbomachinery flow-field exhibits complex secondary flow features characterized by the formation of unsteady vortical structures when the boundary layers along the hub and shroud surfaces are disturbed by stator and rotor blades. Within the turbine stage, the secondary flow can develop through a number of mechanisms. Shed vortices near the blade tip clearance, separation due to non-smooth alignment of flow to the blade at off-design conditions, and unsteady structures due to boundary layer shock interaction and surface curvature are all examples of secondary flow. These features can be highly transient with widely varying scales and underlying physics. They interact directly with the primary flow-field as they are transported by it and cause enhanced mixing, heat transfer, and excessive energy dissipation. Resolving such transient features of flow are a challenge to conventional RANS simulations because of the model’s inherent averaging nature. WRLES methods, on the other hand, are well suited for off-design conditions because of their ability to resolve transient flow features due to high fidelity. The main factor limiting the usage of WRLES is the very high computational cost of resolving the turbulent boundary layer near the blade surface. Choi and Moin [22] determined that grid requirements for a WRLES scale as R e 1 . 86 . This means, in a typical gas turbine geometry operating at Reynolds number ranging from a few hundred thousand to a million, the number of grid points can easily reach a billion with most of them used to resolve the boundary layer. A feasible option is to use wall-modeled LES approach where the viscous sub-layer and the buffer region of the boundary layer are modeled instead of being resolved, substantially reducing the stringent grid requirements. Few studies have utilized WMLES for the numerical analysis of compressors [23,24,25] and turbines [26,27,28]. These studies have focused on the development of accurate physics based modeling tools for predictive design in complex geometries.
The overall goal of this project is to demonstrate the benefits of using wall-modeled large eddy simulation tools and massively parallel computing for predictive design in turbomachinery. The work is conducted as a collaborative effort between US Army Research Laboratory, University of Maryland, and Cascade Technologies Inc. to explore novel design concepts for multi-speed engines. The work considers a realistic high pressure turbine geometry that is studied using the CharLES code [30], based on moving Voronoi grids, at relevant combustor operating conditions. The paper presents results pertaining to grid sensitivity analysis and impact of tip clearance and rotor speed on single stage performance.

2. Computational Methodology

2.1. Numerical Method

LES simulations were conducted using CharLES [30], a massively-parallel framework developed by Cascade Technologies Inc. that utilizes fully compressible Navier–Stokes equations on dynamic Voronoi grid system [30,31] to simulate flow in complex geometries. The solver has been validated successfully for high-fidelity analysis of turbomachinery flows [32]. In space, the compressible fluxes are discretized using a central difference arbitrary Eulerian–Lagrangian (ALE) finite volume method that modifies the convective velocity at each Voronoi face by subtracting the local mesh velocity [33]. For example, the flux of density through the Voronoi face is written:
F ρ = ρ ( u i w i ) n i
where u i represents the fluid velocity and w i represents the mesh velocity. The ALE approach allows the Voronoi mesh points to move at arbitrary speed independent of the flow velocity. To simulate rotor motion relative to the stator, the Voronoi points on the disk surrounding the rotor are rotated at the speed of the rotor, while other points associated with the stator and the upstream/downstream region remain stationary. This approach has the advantage of allowing boundary-fitted meshes in the near-blade region of both the rotor and the stator that are fixed to these components. The approach introduces an interface between the moving and stationary regions that resemble a sliding mesh interface. However, unlike the sliding mesh interface, it is treated fully conservatively using the ALE approach. Another significant advantage of the Voronoi approach is that the connectivity and mesh details in the interface region can be reconstructed quickly at each time step using the Voronoi definition, thus removing conventional overheads due to heuristics and interpolation. For a detailed discussion of compressible flow solutions on moving Voronoi meshes, the reader is referred to the work of Springel [34]. The compressible flow system is advanced temporally using an explicit fourth-order Runge–Kutta scheme. Discrete satisfaction of the moving GCL, however, requires the solution of an implicit system in each time step. The moving GCL is a statement of conservation of volume and can be written discretely as:
v n + 1 v n Δ t = f a c e s w i n i A
where v is the discrete Voronoi volume at two different time levels. In general, the approximation to the divergence of the face velocities computed from the geometry of the Voronoi diagrams (represented by the right-hand-side) will not discretely balance the change in Voronoi volume. Similar to fractional step methods for incompressible flow, we assume the mesh face velocity can be corrected by the gradient of a scalar, leading to a Poisson system for the face velocity corrections that must be solved in each time step. Fortunately, the solution of this system is zero (i.e., no correction) in large parts of the mesh where the mesh velocity is exactly known, making it relatively efficient to solve.
In the present work, the compressible version of the constant coefficient Vreman model [35] was used as a sub-grid scale model to account for the unresolved scales. At all walls, a local algebraic equilibrium wall model was applied to compute the stress based on a constant stress layer approximation [36]. The numerical scheme was based on an approximately entropy-conserving flux discretization [37]. The accompanying discrete entropy analysis allowed for a local, matrix based dissipation to be introduced where significant violations of the second law arose from the inviscid flux calculation.

2.2. Domain Description

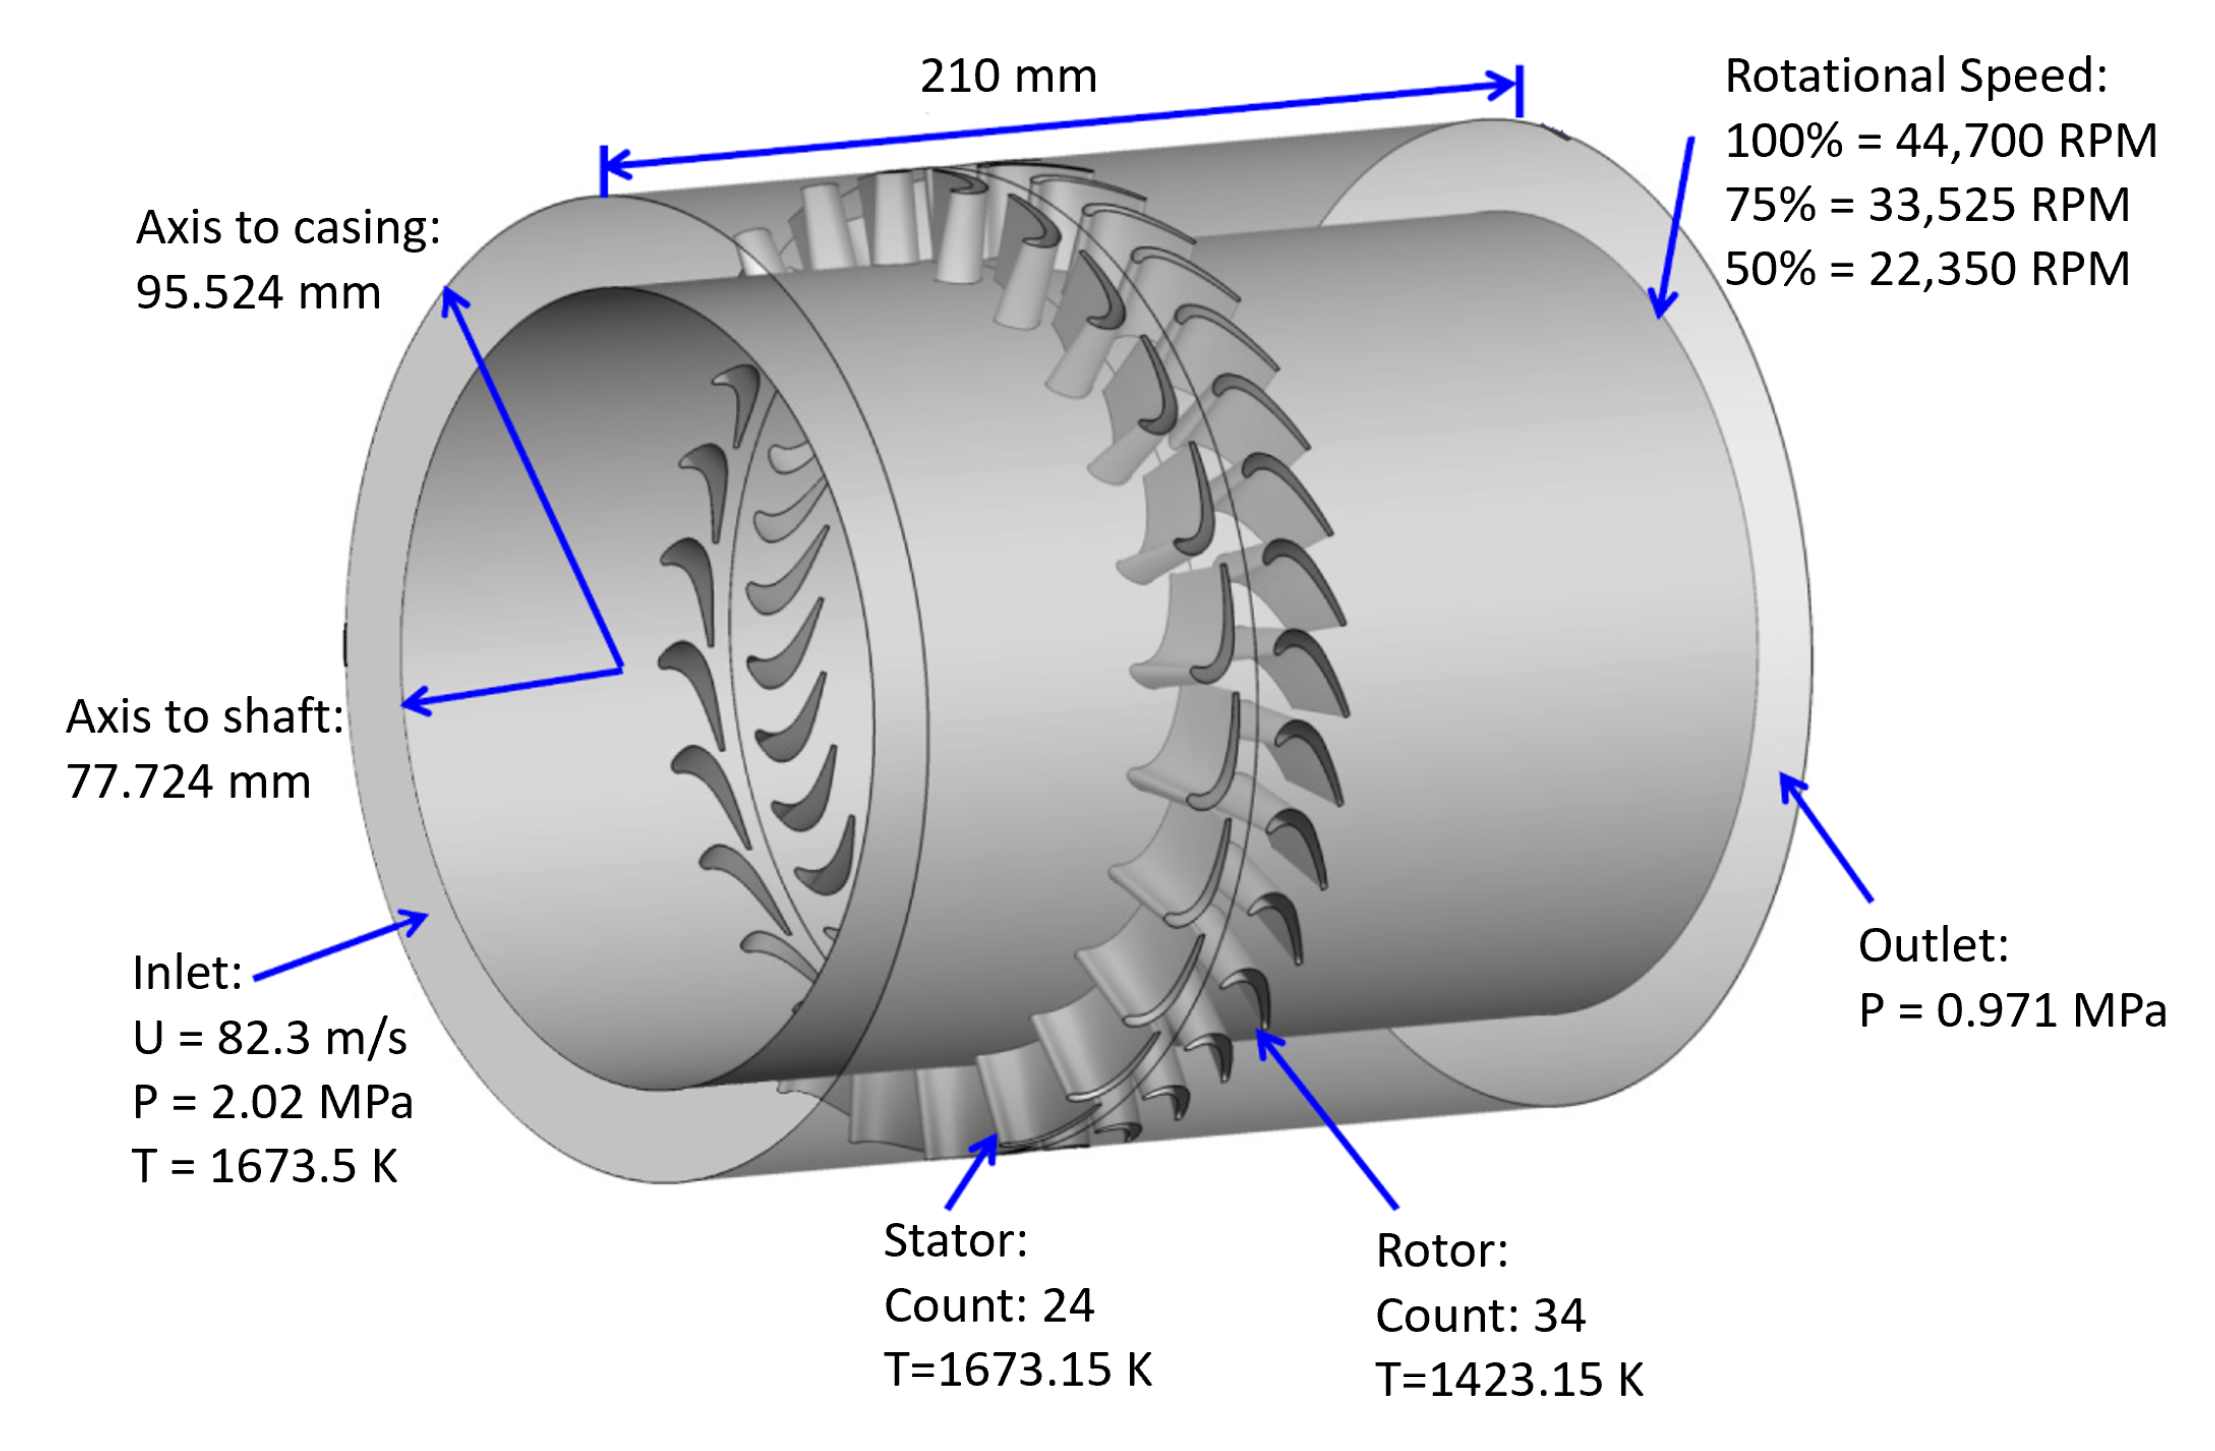
The representative single-stage power turbine sector geometry was adopted from the study by Murugan and Bazilevs [38]. The geometry spans from the combustor exit plane to the engine exit. It comprises of 24 stator vanes and 34 rotor blades with an inner shaft radius of 77.7 mm, shroud radius of 95.5 mm, and a total length of 210 mm, as shown in Figure 4. The baseline incidence angles are 24 for the stator and 0 for the rotor. The stationary component of the geometry comprises the stator vanes and inner shaft from inlet to outlet with a gap in between for the rotational component. The rotational component comprises a cylindrical hub with rotor blades attached to it. Independent meshes were generated for the two components and the Voronoi approach handled the interaction between stationary and moving meshes. A uniform axial flow with a velocity of 82.3 m/s corresponding to Mach 0.1, a pressure of 2.02 MPa, and a temperature of 1669.78 K [39] were applied at the inlet boundary. The averaged chord length for both stator and rotor blades is about 21.1 mm. The inlet Reynolds number is 130,392 with rotor chord as the reference length. The gas turbine geometry along with its dimensions, boundary conditions, and components is shown in Figure 4. For this study, all geometrical surfaces were modeled as adiabatic wall with no slip. While it is feasible to only model a fraction of the power turbine sector due to its axisymmetry, the entire geometry was used in simulations for the current investigation. Use of a computational domain based on the complete power sector geometry allowed for adequate development of three-dimensional turbulent structures in strongly unsteady flow during off-design conditions. Additionally, the next phase of this investigation is to model realistic sand particle entrained flow through the power turbine sector after it exits the combustor under high temperature and pressure. Such an inlet condition is no longer axisymmetric and requires modeling of the full power sector stage.

2.3. Mesh Generation

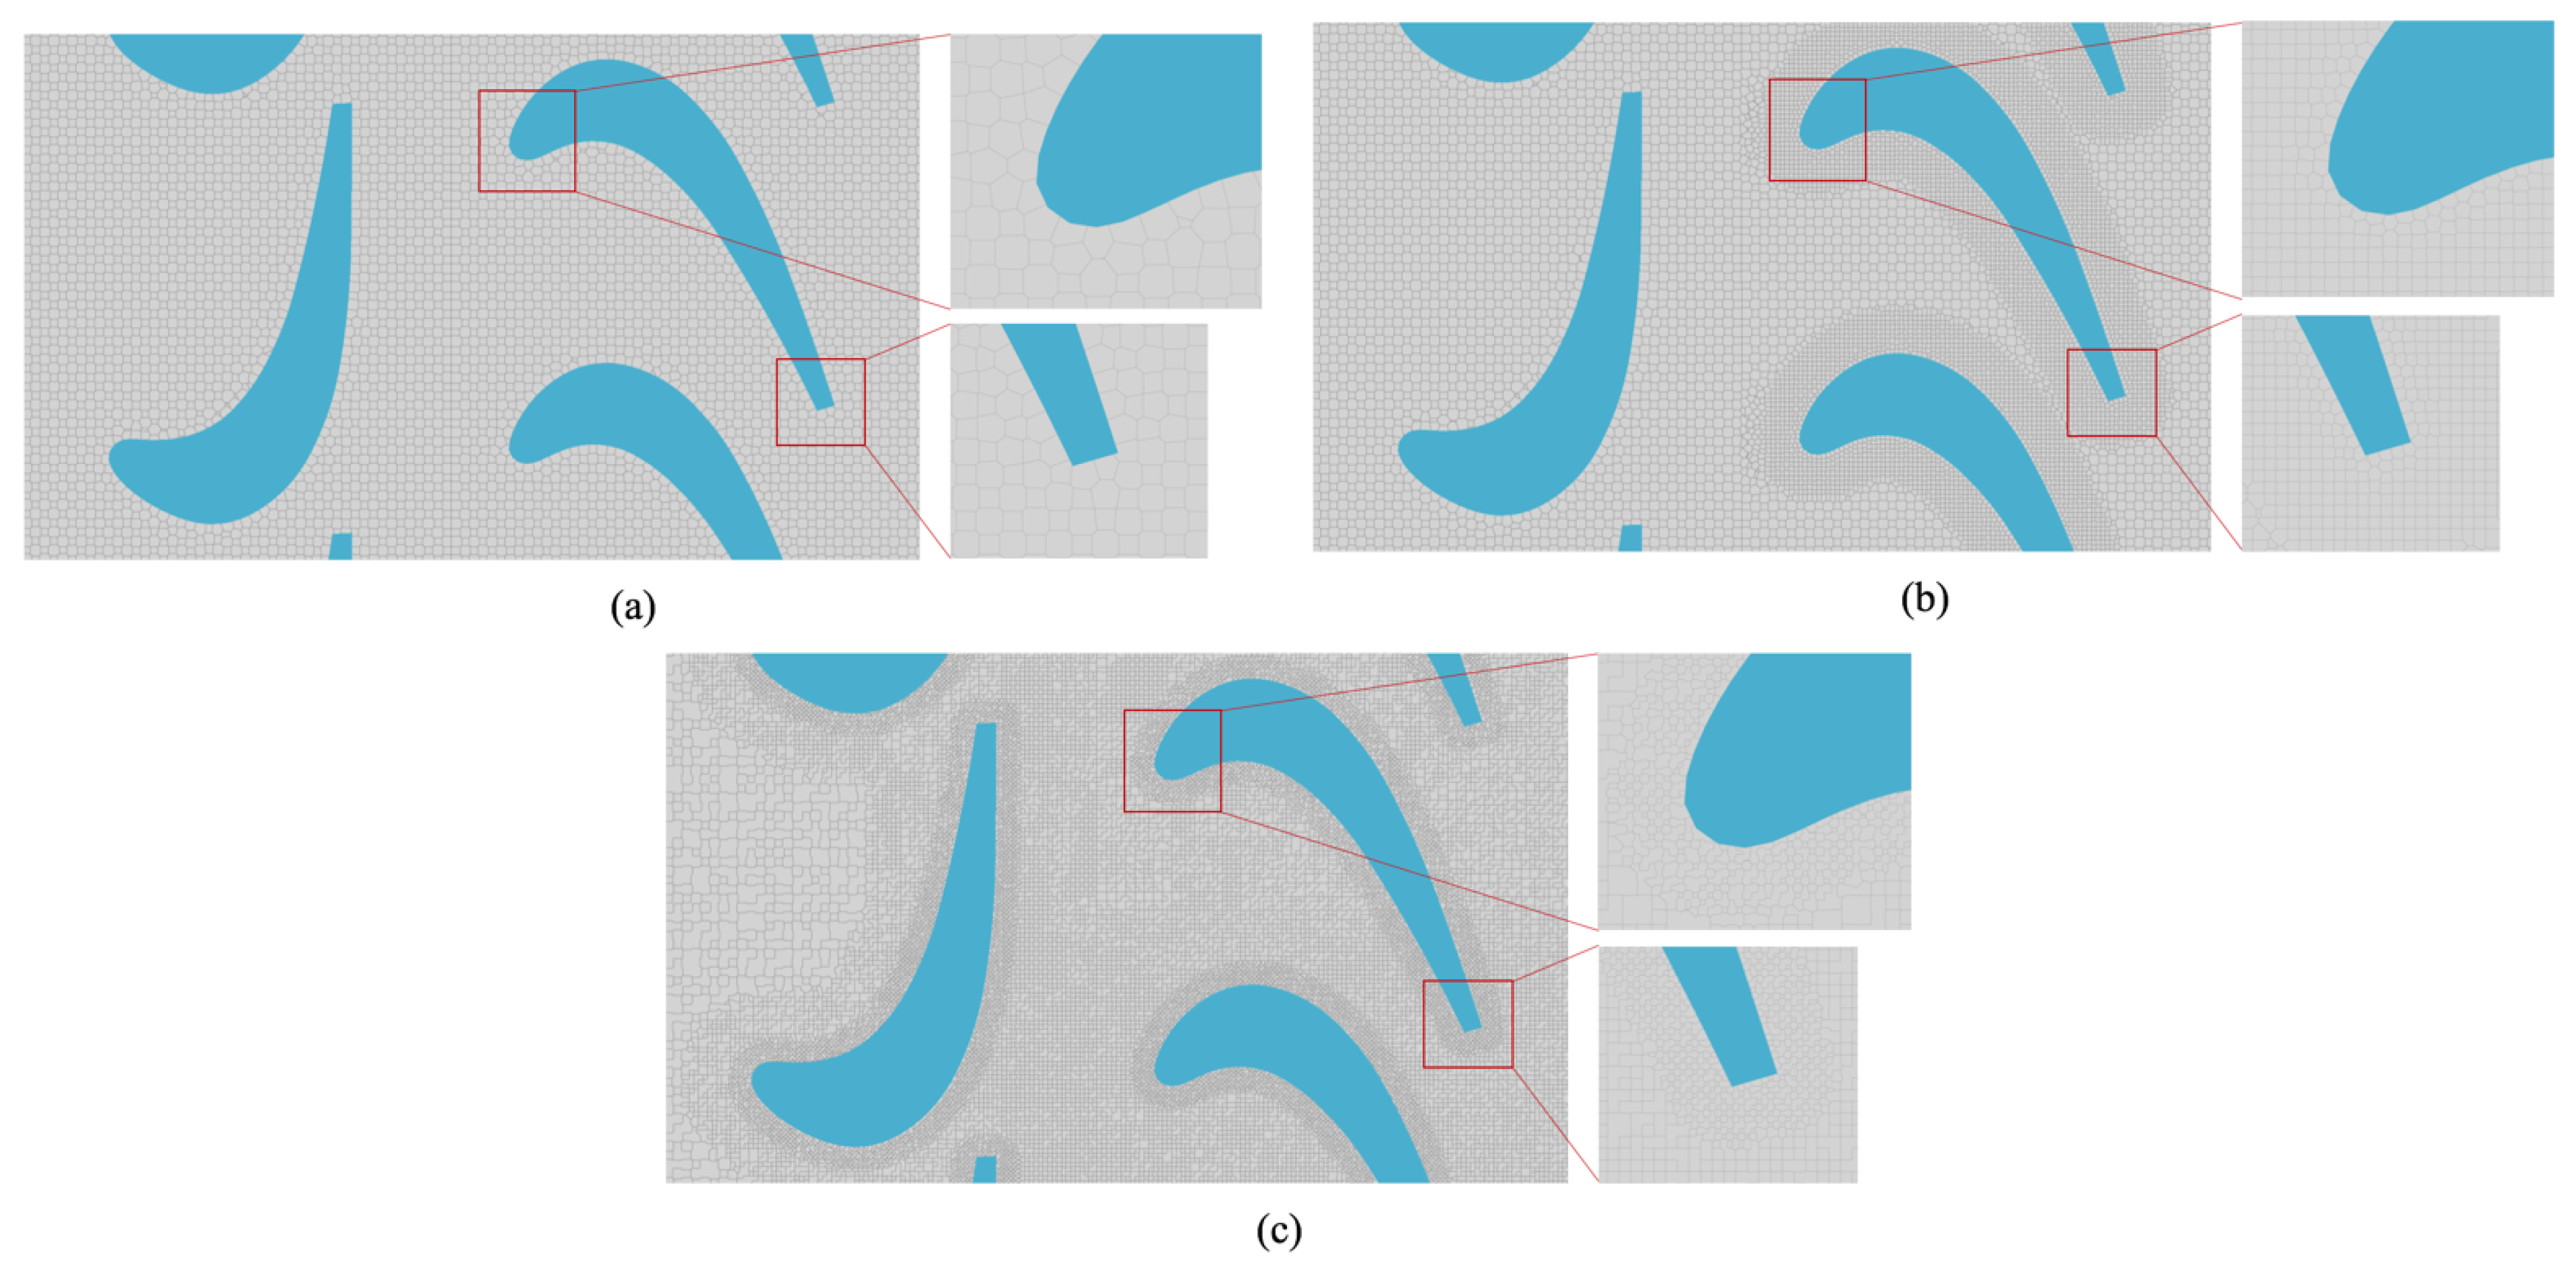
The Voronoi diagram methodology generates a unique grid by taking the geometry surface description and a set of seed points as input. For the given geometry, the surface topology was generated first followed by seeding of specified points into the computational domain. The Voronoi concept was then employed to generate the complete grid by creating polygons in a manner that each polygon comprises exactly one seed and every point in that polygon is closer to its seed that any other other seeds. The grid was then smoothed using Lloyd iterations [40] leading to anisotropic nearly-hexagonal body-fitted meshes. During the smoothing operation, the generating points were moved to the centroids of their Voronoi cells, and the Voronoi mesh was recomputed (see Figure 5). An important benefit of including Lloyd iterations is that this smoothing step can be used to produce boundary alignment of the generating points near surfaces. It can also be restricted to a subset of the point cloud so that it does not disturb pre-existing point spacing. For simulation of flow through turbomachinery aided by wall function, relevant studies [41,42,43,44] have suggested that the y + value between 20 and 200 for the cells nearest to the wall is usually sufficient. Based on these recommendations, Voronoi grids with three separate resolutions were generated to conduct WMLES simulations of the flow through the baseline turbine stage geometry and examine grid sensitivity. These three grids are illustrated in Figure 6 with the relevant y + values tabulated in Table 1. Note that the grid esd refined near the boundary layer of the rotor blade in Grid B based on Grid A. The total number of control volumes for Grids A–C are 7.97 million, 13.5 million, and 79.3 million, respectively. The mesh resolution near the leading and trailing edges of the rotor blade is also depicted in Figure 6 for all three grids.

3. Results and Discussion

3.1. Effect of Grid Resolution

The generated grids were utilized in LES simulations of flow through the baseline stage geometry at 100% RPM (44700) to understand the sensitivity of predicted flow-field to grid resolution. The baseline stage geometry comes with a tip clearance of 3.39 mm, which corresponds to 16% of the rotor chord. Since the time marching scheme used is partially explicit, the time-step size for each grid was selected to ensure that the CFL remains less than 2 for numerical stability. The resulting time-step values were 2 . 5 × 10 7 s, 1 . 25 × 10 7 s, and 4 × 10 8 s for Grids A–C, respectively. To obtain statistically converged flow-field, each simulation was allowed to run at least five rotor revolutions or 26 flow through time based on the rotor chord and the inlet velocity. Wall times to complete one rotor revolutions were obtained to be 0.9, 2.4, and 20.1 h for Grids A–C, respectively, using 1536 Intel Xeon E5-2698 v3 processors on Department of Defense Excalibur high-performance computing platform. This wall time includes the overhead of writing files needed for flow visualization and data analysis.
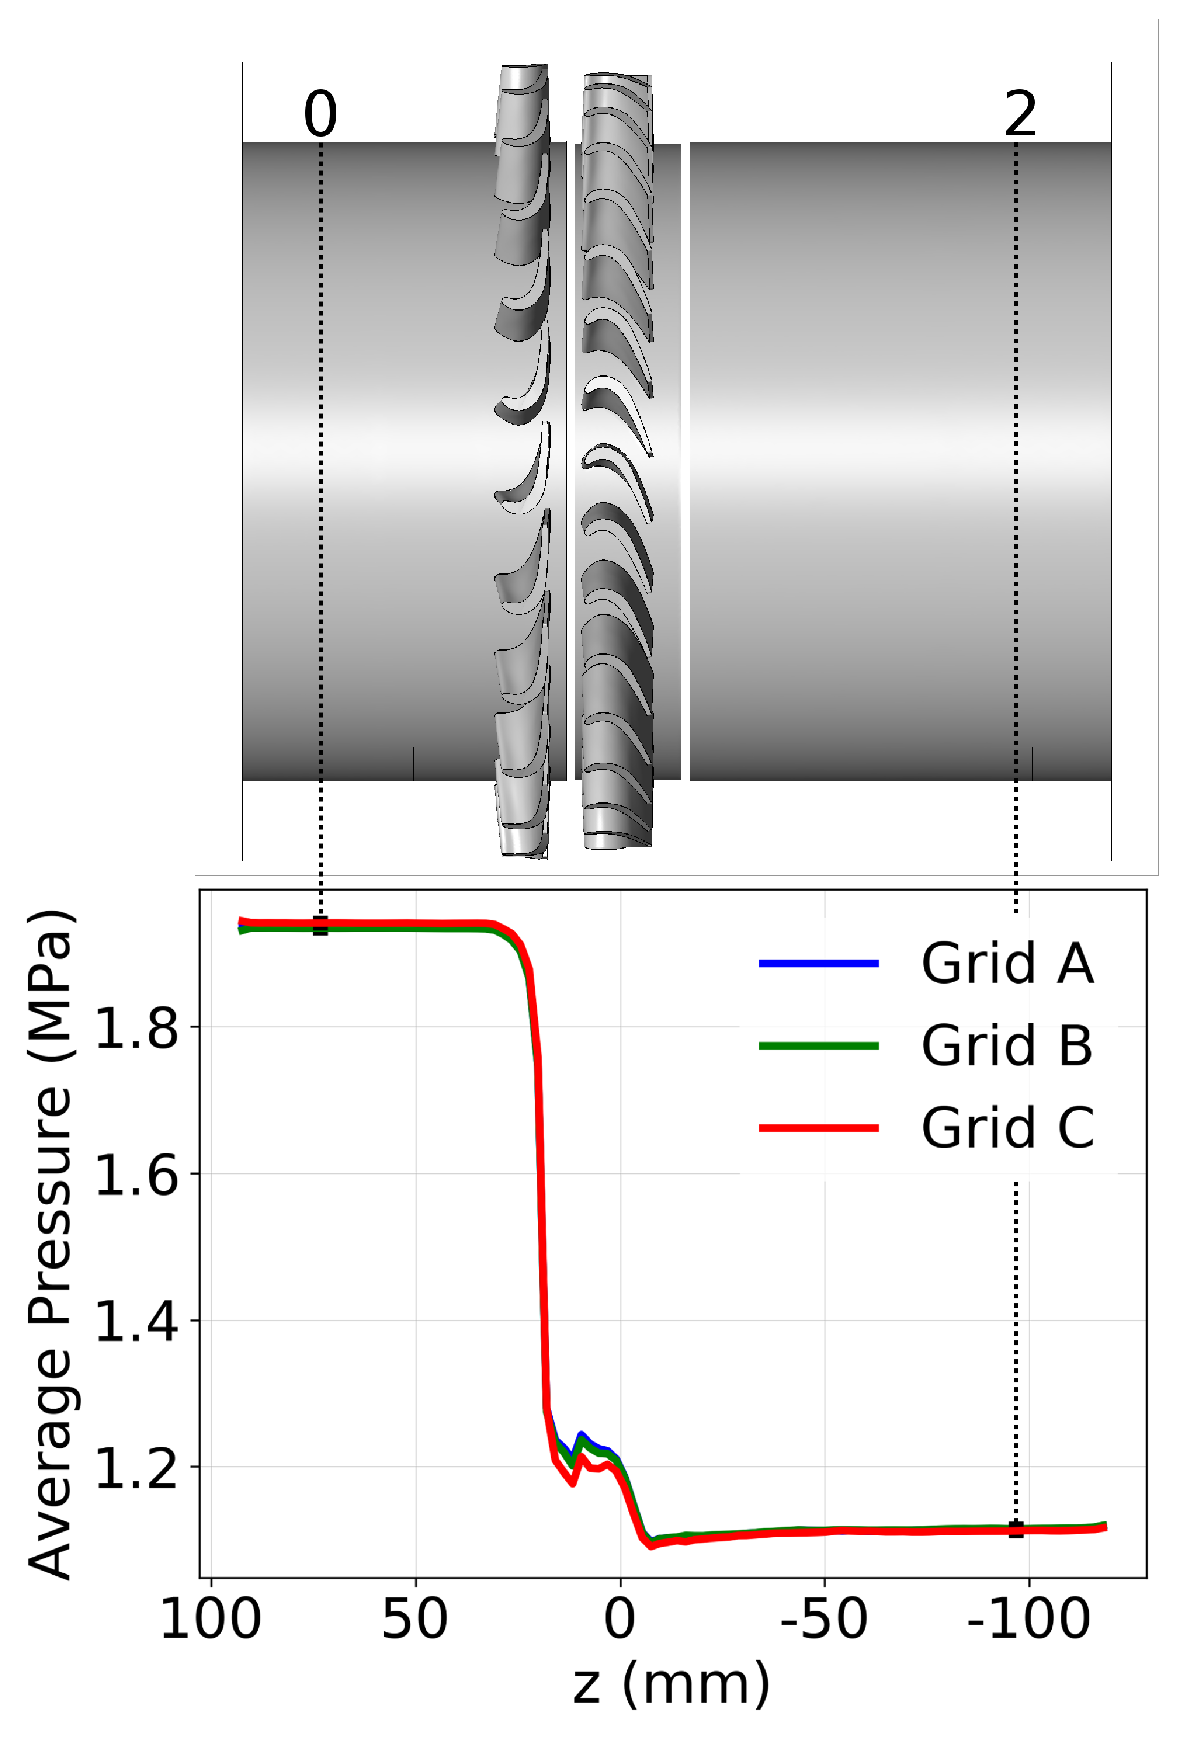
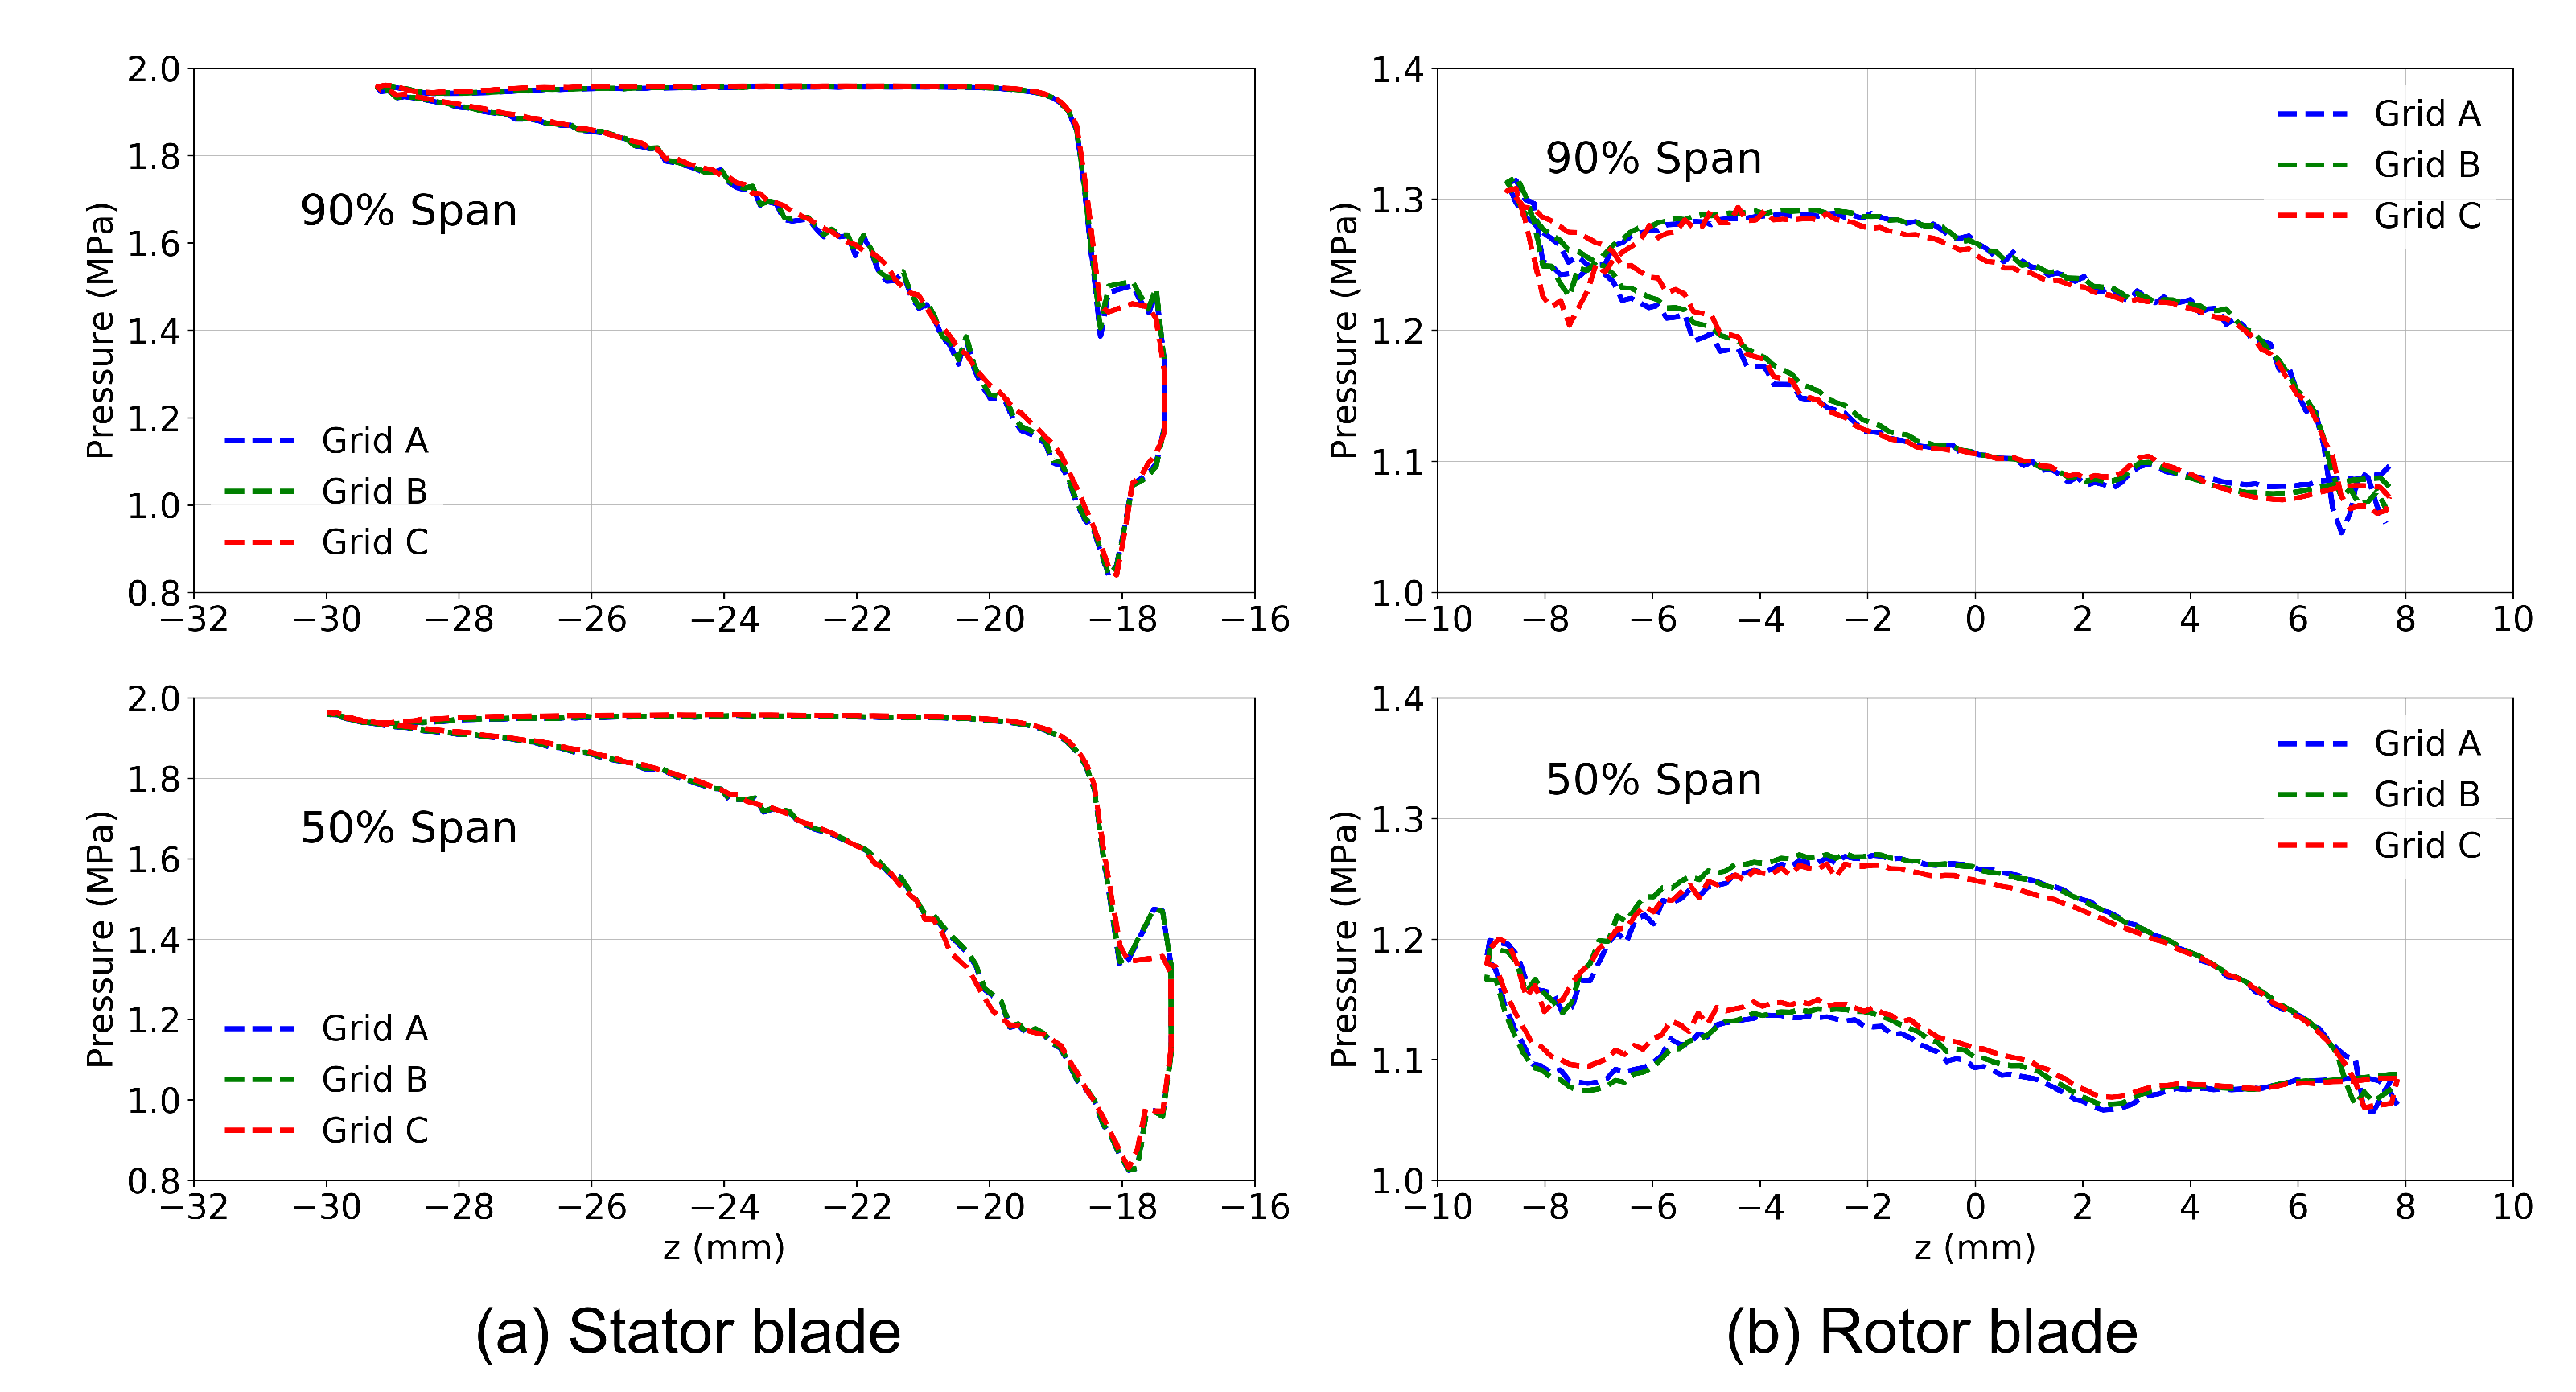
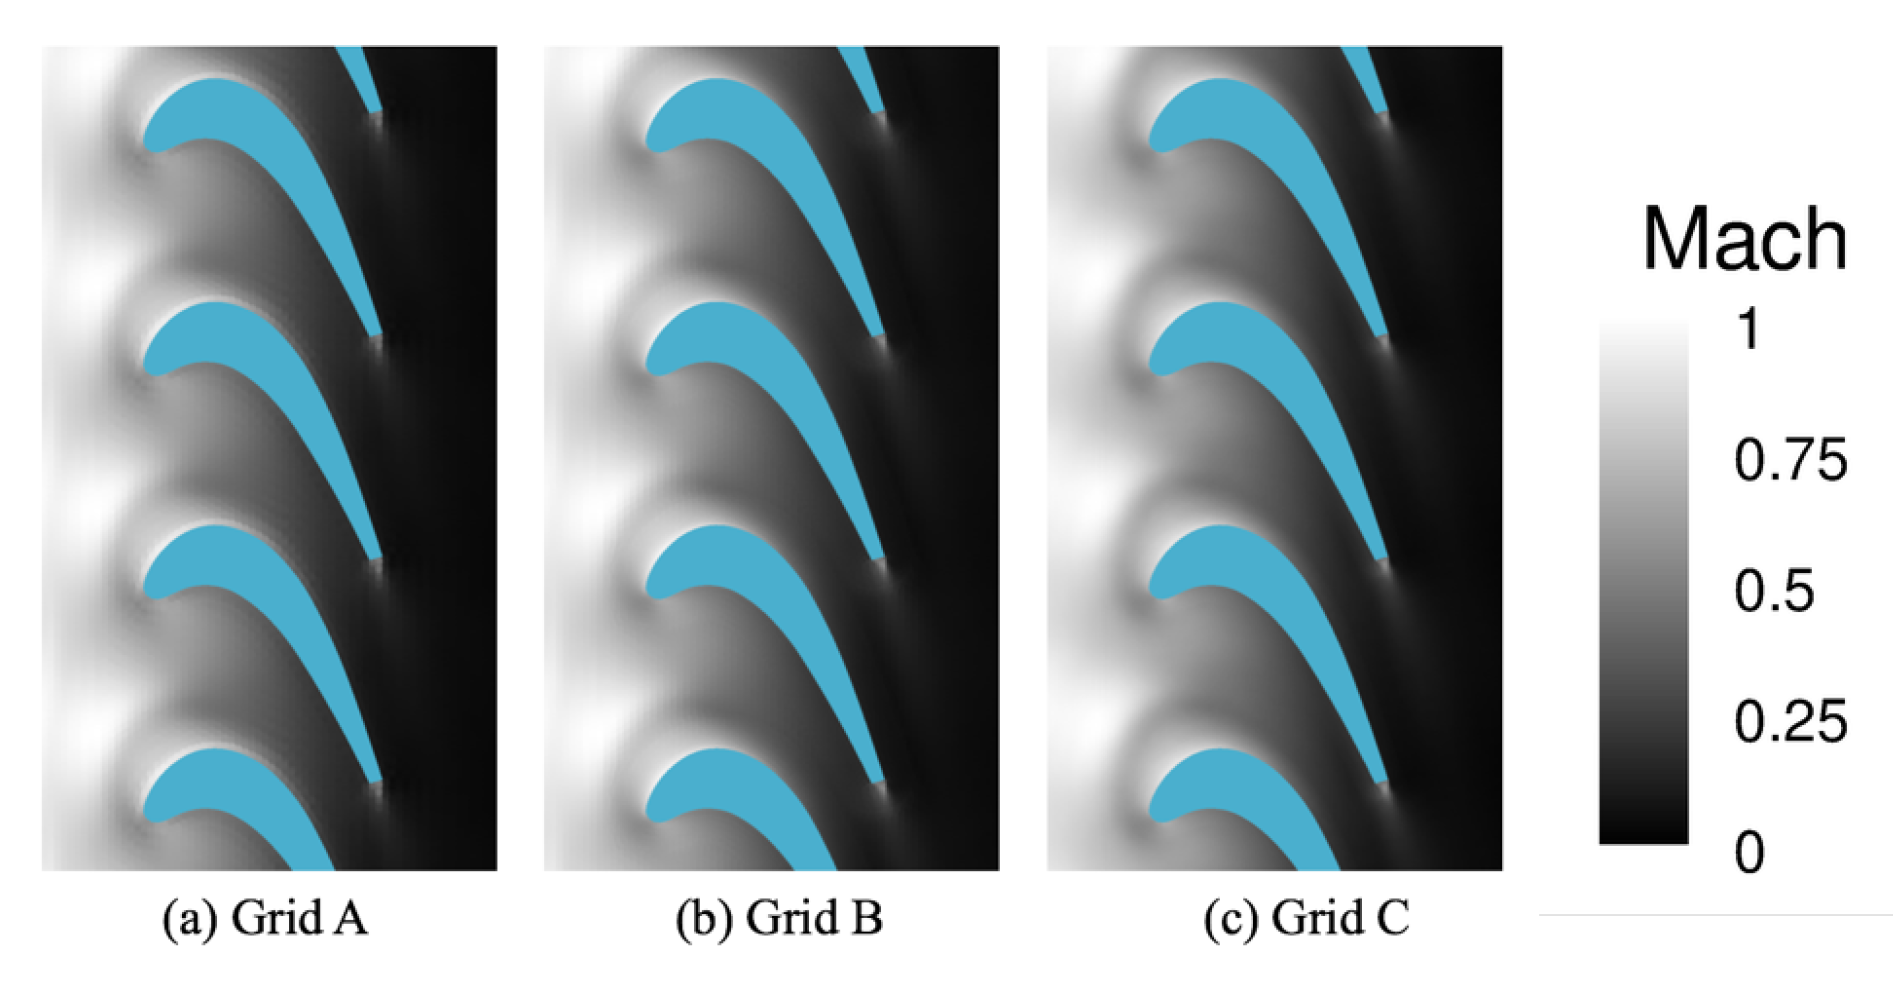
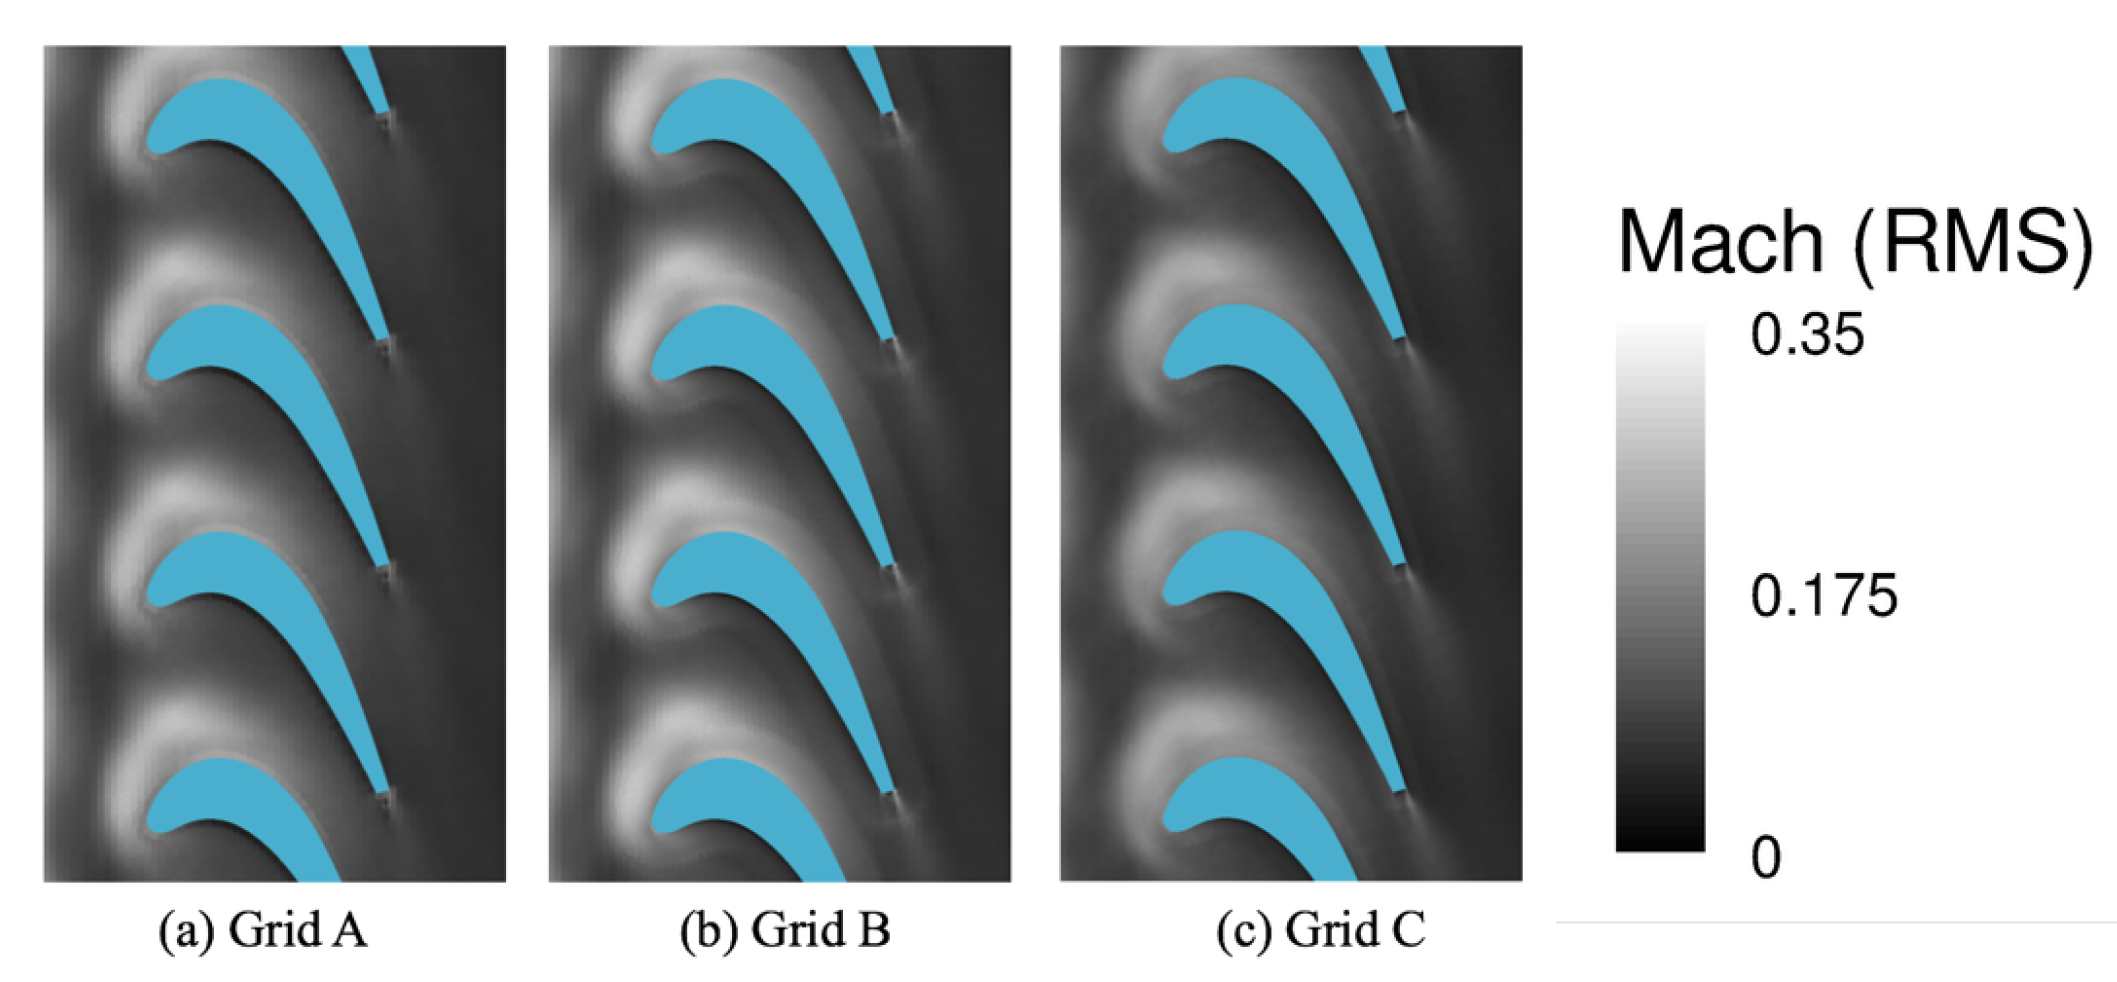
Figure 7 shows the azimuthally averaged pressure across the baseline geometry for the three grids. Note that the azimuthally averaged pressure was computed at a single time instant after the statistical convergence was reached within simulations. All three grids predict nearly the same trend of mean pressure in the stream-wise direction, indicating that grid convergence was achieved with respect to the mean pressure. There are minor differences in the predicted pressure near z = 0 location, which can be attributed to the resolution of secondary flow characteristics. Figure 8 shows the instantaneous surface pressure near the location z = 0. Flow separation due to secondary circulation at the sharp corner between the blade and the hub is clearly visible for the finest grid, Grid C. The coarsest grid, Grid A, is not able to capture these secondary circulation features completely. Figure 9 shows the mean static pressure profiles along the stator and rotor blades at two-span heights (50% and 90%). The results from three different grid resolutions are all consistent over the pressure and suction sides of both blades. Figure 7 and Figure 9 illustrate that the integrated pressure and temperature values are not strongly sensitive to the grid resolution. The contours of instantaneous Mach number and temperature are presented for the grids in Figure 10 and Figure 11. Note that the contour planes were obtained by projecting the cylindrical surface with radius of 86 mm (50% span of the rotor) to the plane. As shown in Figure 10, the vortical flow shed from the trailing edge of the stator and the small-scale features in the flow are not well captured in Grids A and B compared to the finest grid, Grid C. Figure 12 and Figure 13 show the mean and RMS contours of Mach number obtained from phase-averaging over multiple rotations and time-averaging during one rotation respectively. These figures show that the characteristics of flow and unsteady physics are similar in the broad-scale for all grids.
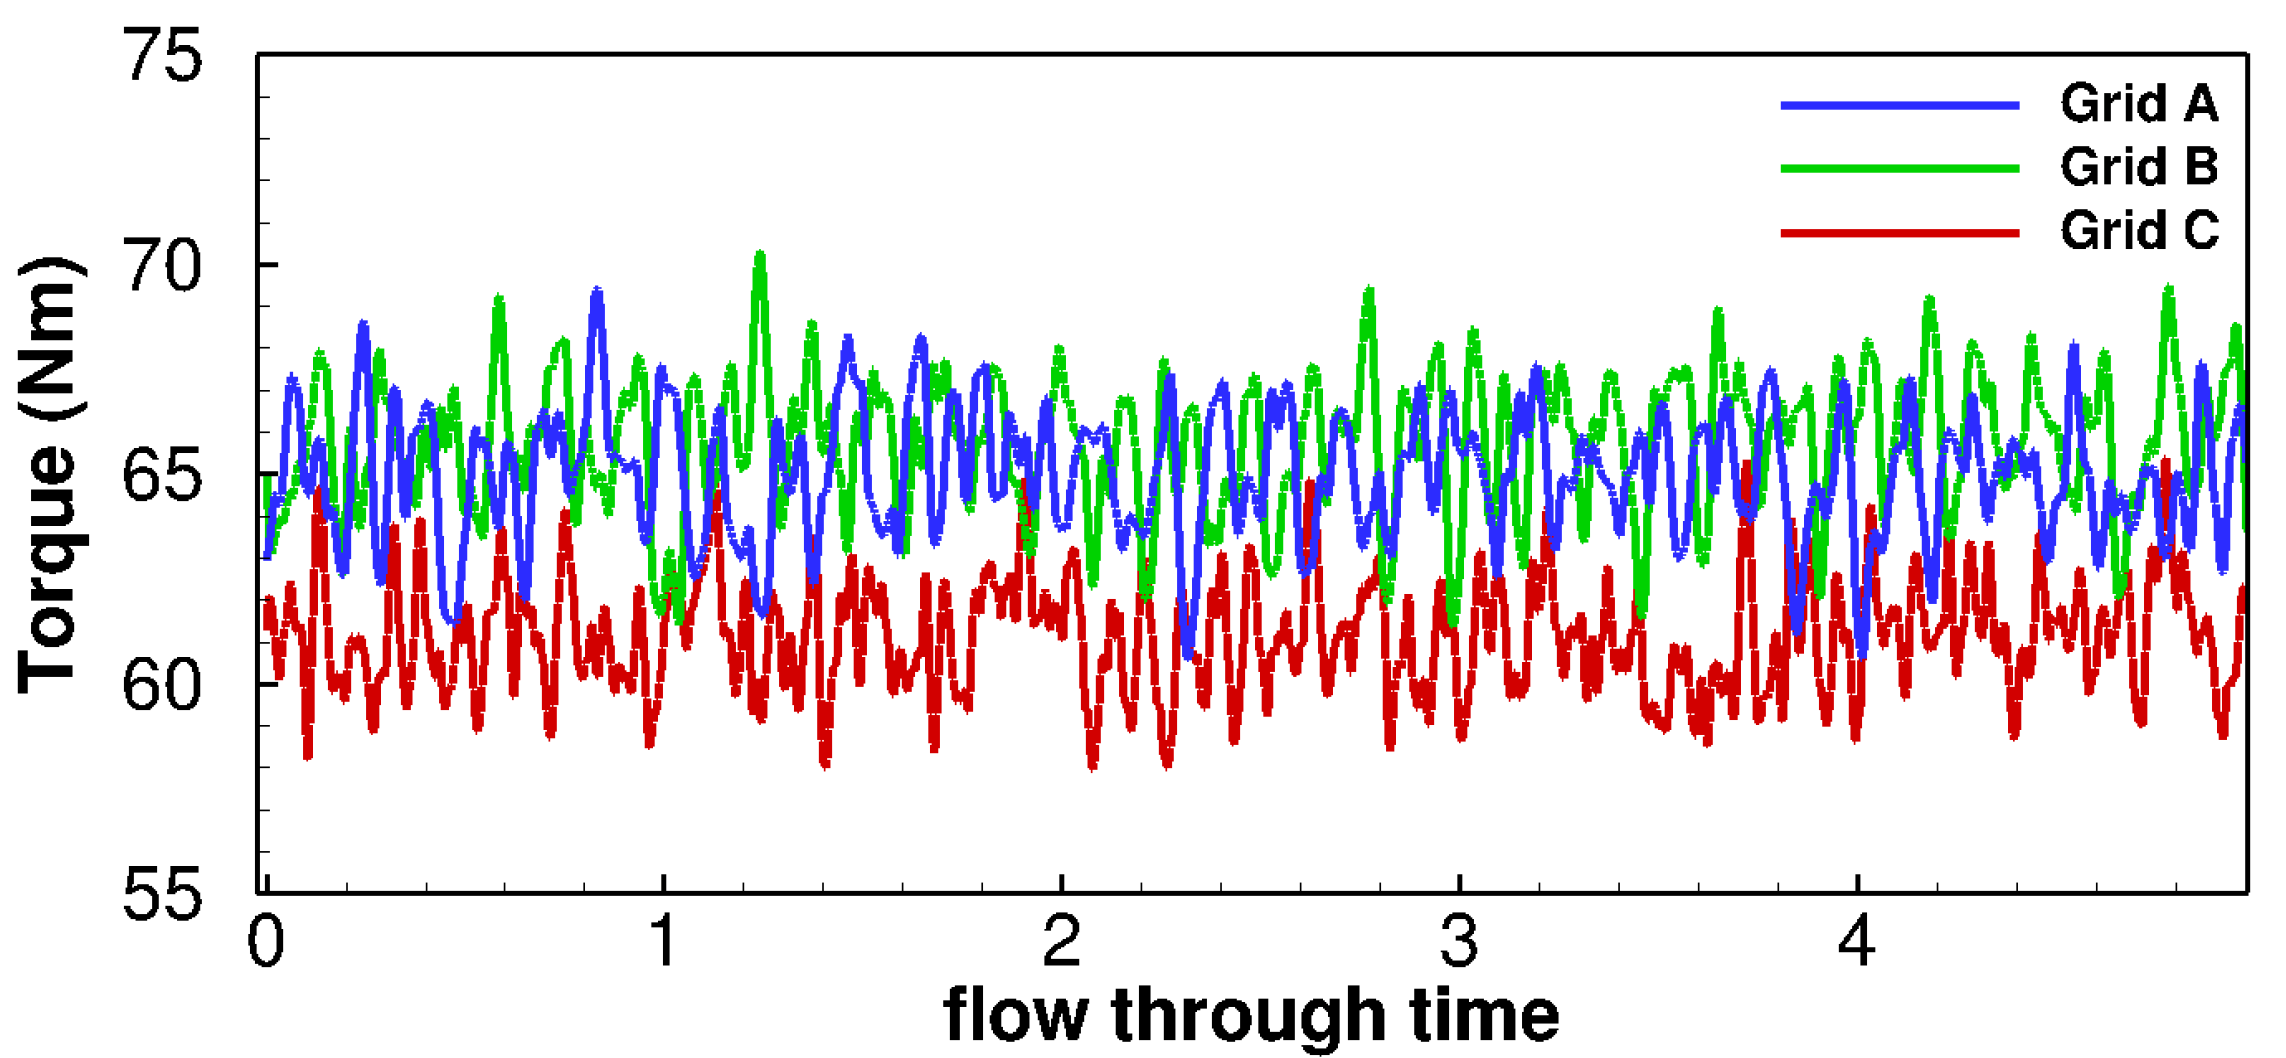
The time histories of the axial component of torque acting on the rotating part including the rotor and hub are presented in Figure 14 for the three grids. The flow through time scale is based on the chord length of the rotor blade (21.1 mm) and the inlet uniform velocity (82.3 m/s). The time for one rotation corresponds approximately to a 5.3 flow through time. Unlike the pressure in Figure 7 and Figure 9, the predicted torque values are decreasing with increase in grid resolution, showing 10% errors between finest and coarsest cases. This indicates that the near-wall flow is still not completely captured by finest grid tested in the present study.
The integrated performance of the turbine stage was quantified using adiabatic efficiency, which is defined as the ratio of actual and isentropic (ideal) power output. In Figure 7, Station 0 indicates stator inlet and Station 2 denotes the sufficiently downstream outlet location. The adiabatic efficiency [45] was obtained from the stagnation quantities at these two stations:
η = 1 T 2 T 0 1 p 2 p 0 γ 1 γ
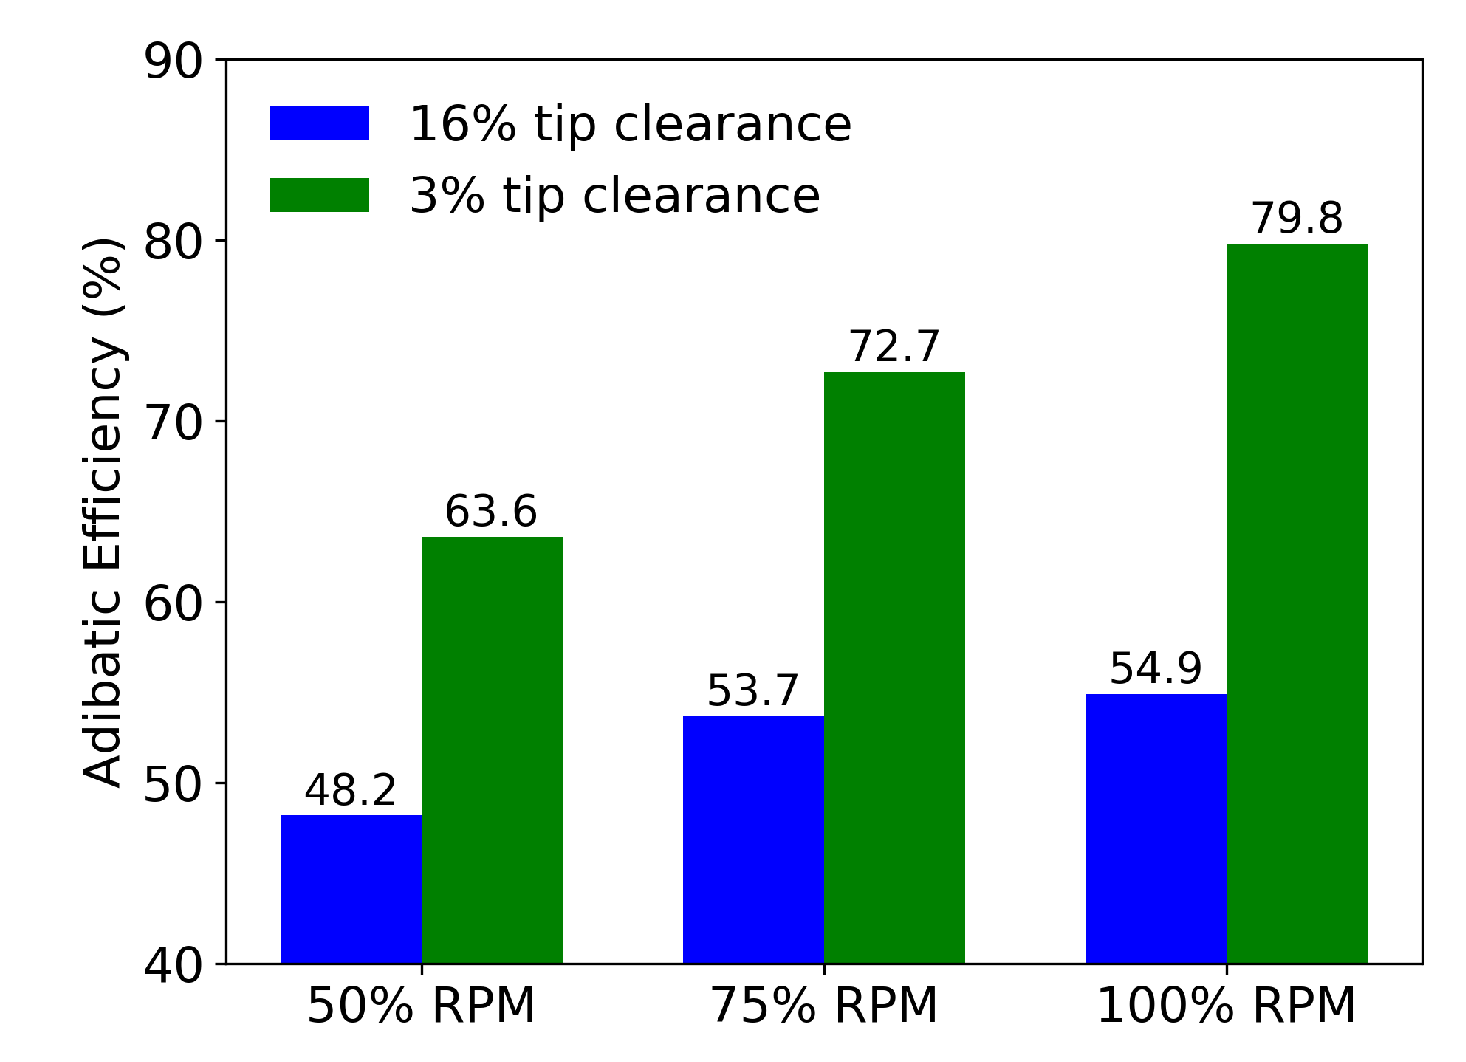
With the baseline geometry providing tip clearance of 16% rotor chord, the simulations predicted adiabatic efficiencies of 51.7%, 51.6% and 54.9% when Grids A–C were used, respectively. Additional details of predicted flow-field in grid sensitivity simulations at 16% tip clearance is available in the authors’ previous work [46]. The predicted adiabatic efficiency values are lower than typically observed in gas turbine engines and are likely caused by the losses incurred due to the large tip clearance in the baseline CAD geometry. To address this issue, the tip clearance was reduced based on previous studies and another set of simulations was conducted with new tip clearance. The results of these simulations and the effect of tip clearance are discussed in the next section.

3.2. Effect of Tip Clearance

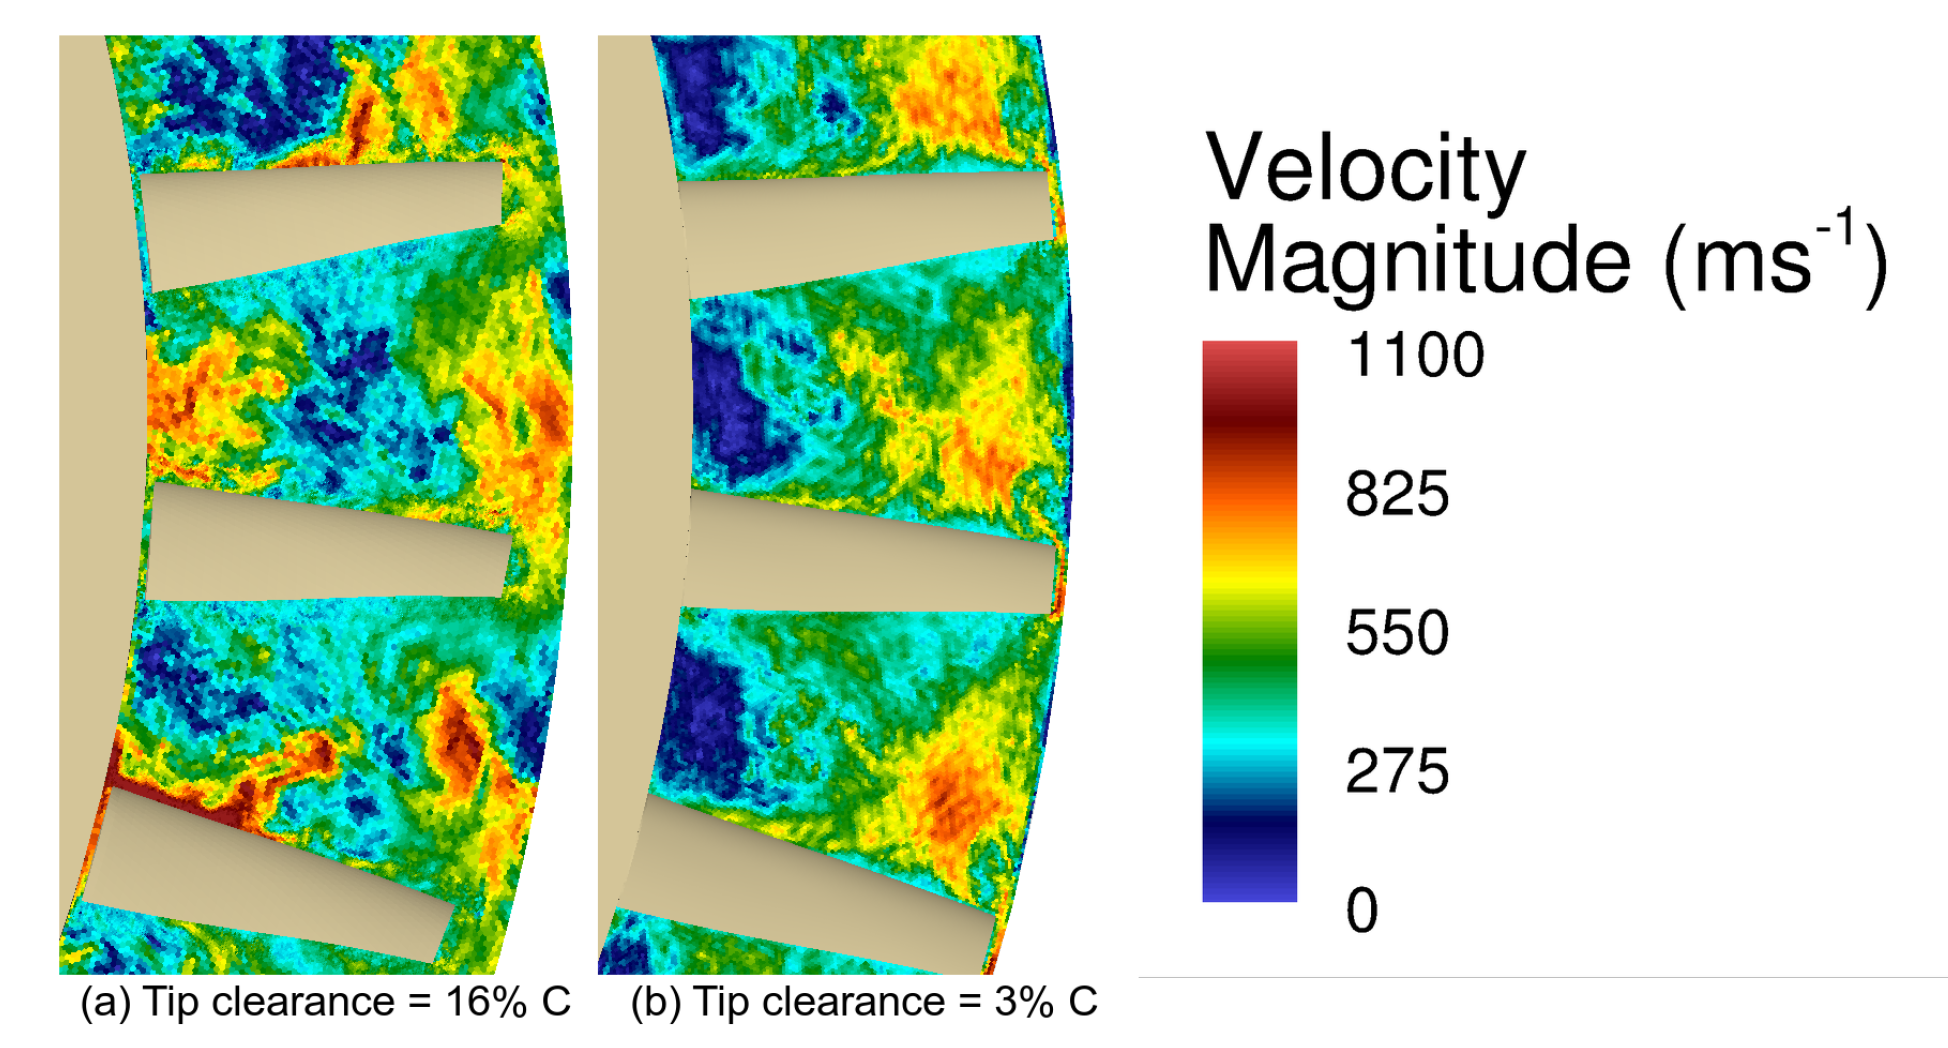
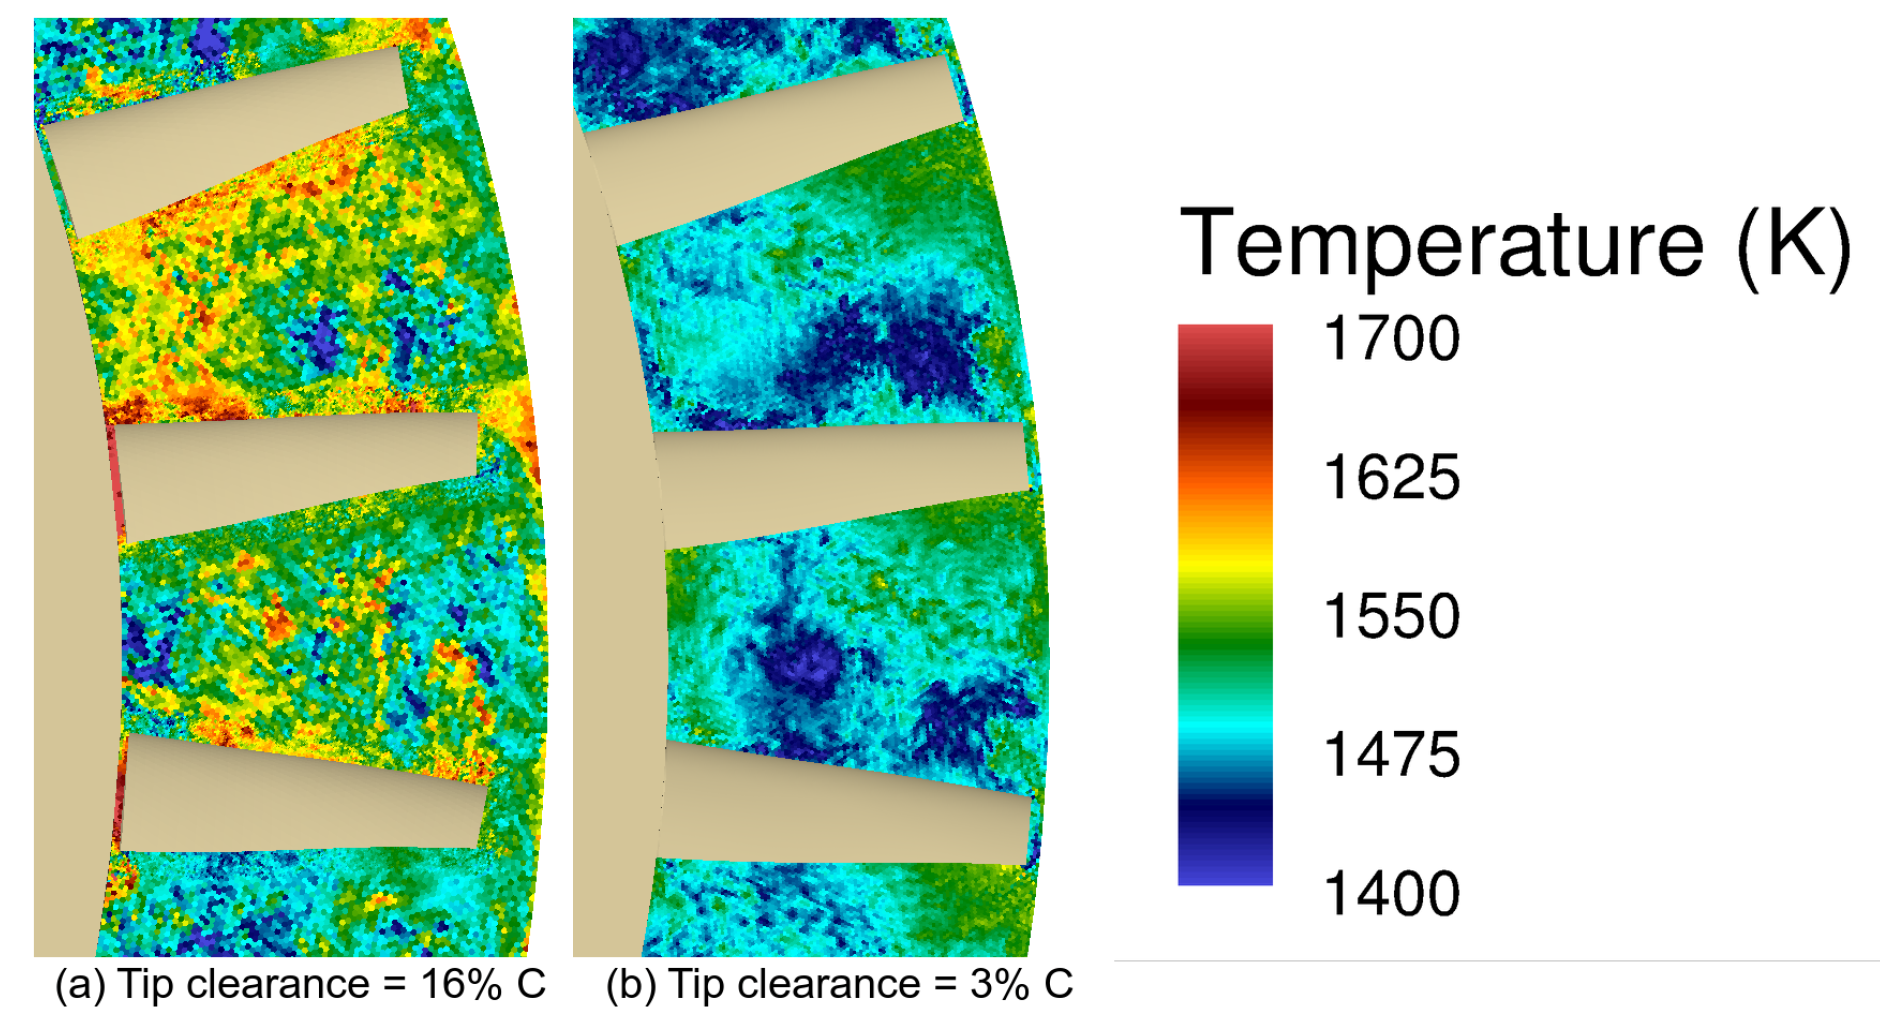
To investigate the effect of tip leakage flow through the clearance gap between rotor blade and the shroud, LES simulations were conducted for two values of tip clearance using the finest grid, Grid C. For the first case, a large tip clearance of 3.39 mm was used, which is equivalent to 16% of the rotor chord. The geometry was then revised for the second case to reduce the tip gap to 0.62 mm, resulting in a realistic 3% tip clearance Booth et al. [12], Bringhenti and Barbosa [13] with respect to the rotor chord. Figure 15 compares the instantaneous velocity magnitude contours obtained for the two cases in the middle of the rotor section in a plane normal to the stream-wise direction. At higher tip clearance, the flow is completely separated at the blade tips, indicating excessive leakage and increased mixing. This is also apparent from the increased incoherency in flow structures within the rotor passage for the case with higher tip clearance. Figure 16 shows the instantaneous static temperature contours for the two tip gaps. At reduced tip clearance, the overall temperature of the flow is lower compared to the case with a higher tip gap. Note that all stationary and rotational components were modeled as adiabatic wall with no-slip boundary condition on the surface. Energy dissipation is expected to be higher in the case of 16%C tip clearance due to excessive leakage and mixing and can be strongly detrimental to the stage performance. In the baseline design point simulation, a 16%C tip gap resulted in low adiabatic efficiency of 54.9%. With the tip gap of 3%C, the adiabatic efficiency increased considerably, to 79.8%. Equation (3) was used to compute the adiabatic efficiency.

3.3. Effect of Rotor Speed

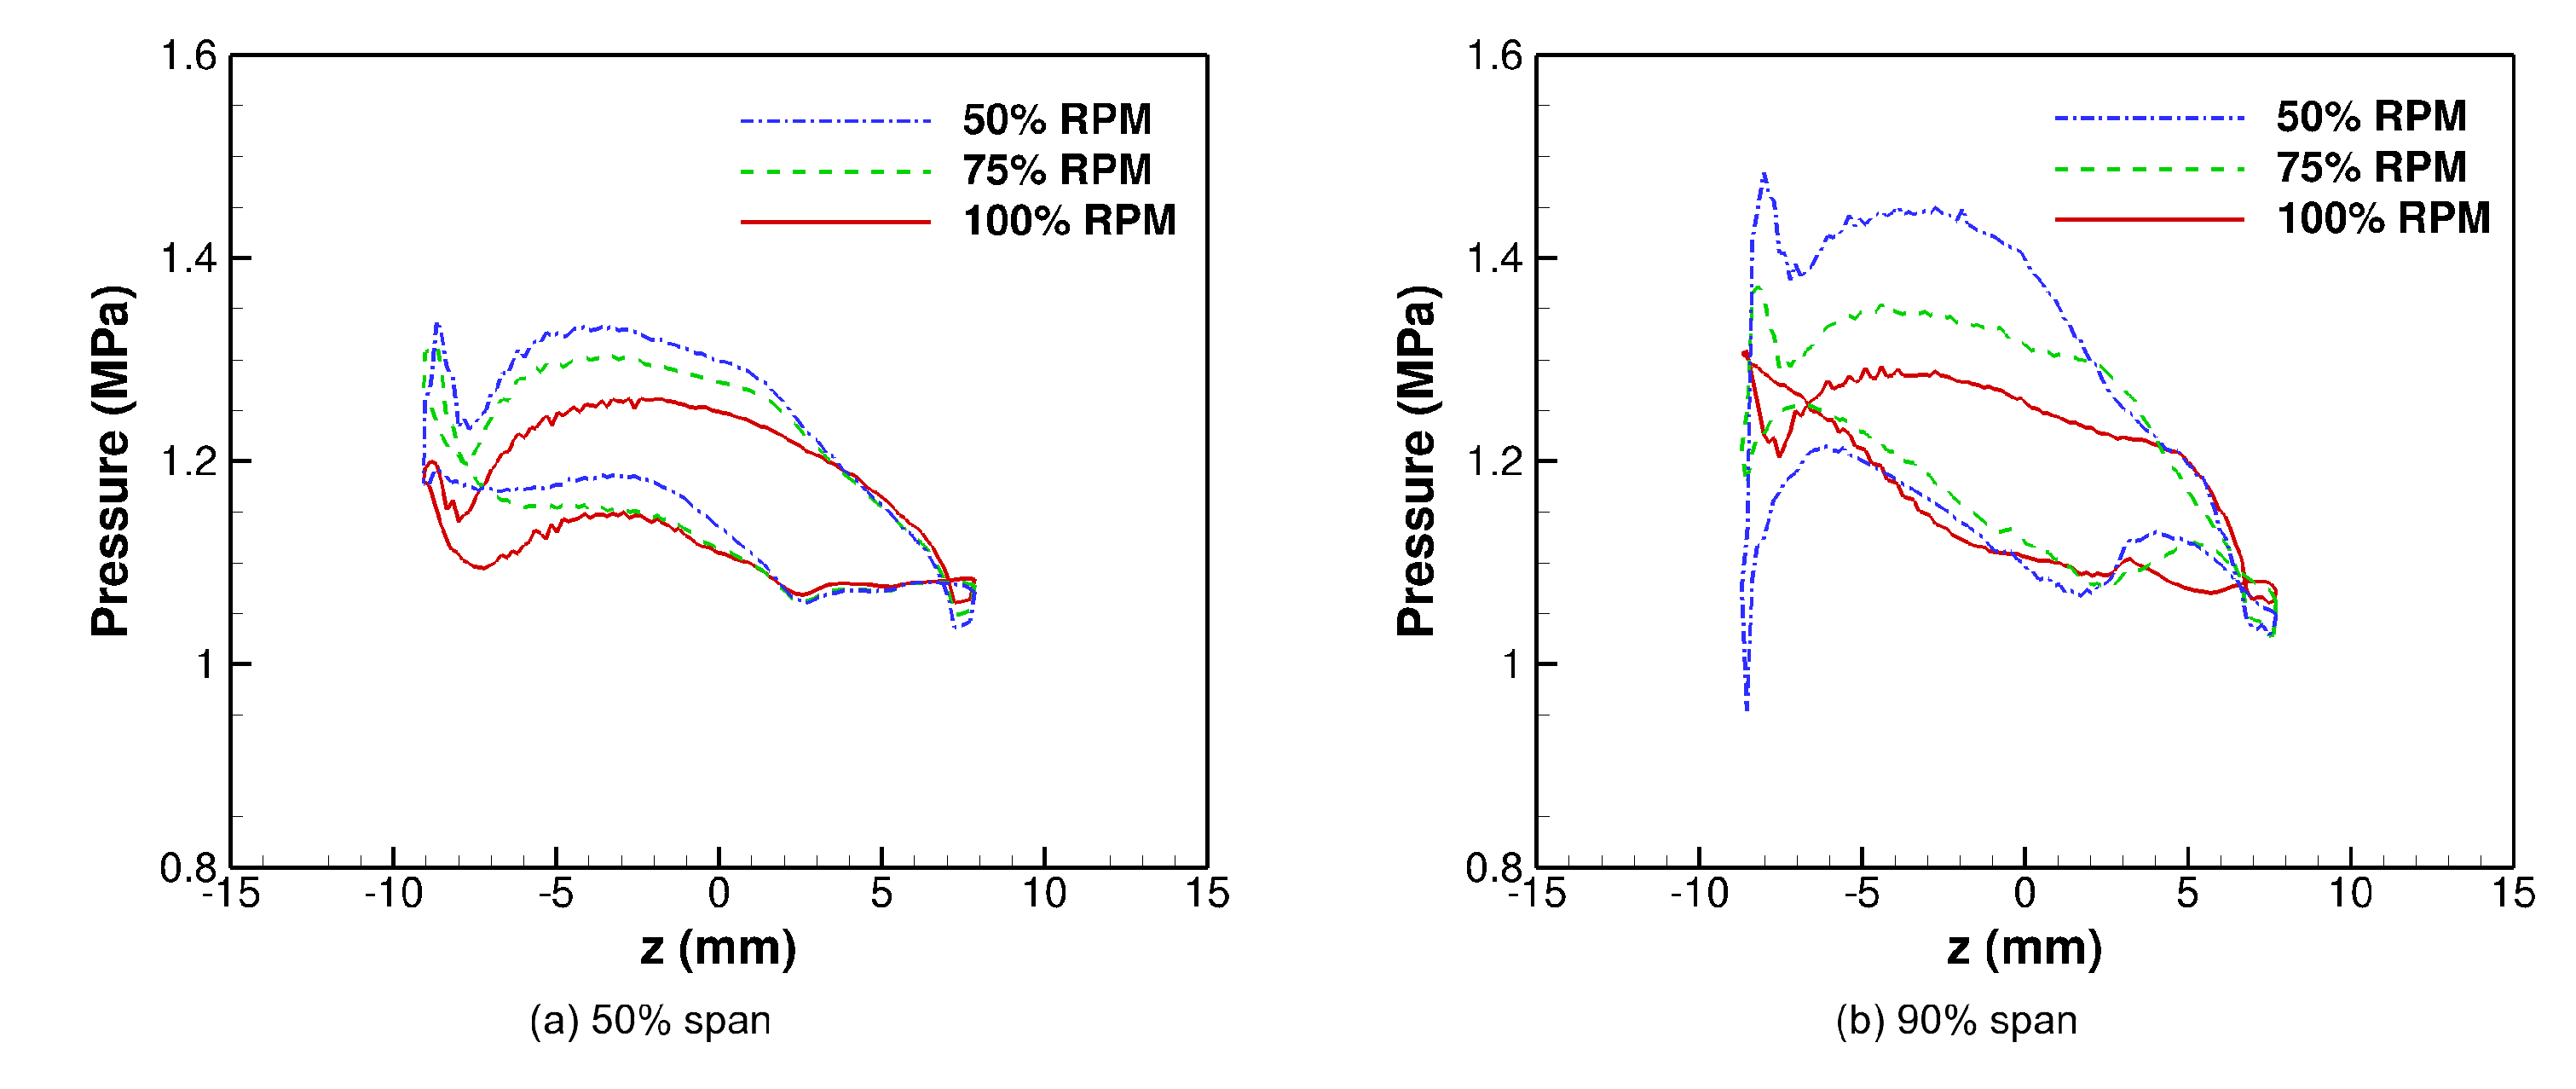
Off-design simulations were conducted by reducing the rated RPM to 75% (33,525) and 50% (22,350) of design value. Tip clearance of 3% chord was used in all simulations to minimize losses due to tip leakage. The finest grid, Grid C, was used to perform off-design simulations. Significant unsteady flow characteristics are expected during the off-design operation, which potentially leads to loss of overall gas turbine performance. Figure 17 shows the mean static pressure profiles along with the rotor blades for three different rotating speeds at two different spanwise locations. On the pressure side of the rotor blade, as expected, the pressure increases with a reduction in RPM. At the 90% span height, the pressure is more substantially increased because the difference in velocity is higher close to the tip. On the suction side, however, the pressure curves show different behaviors for the different spanwise locations. The pressure increases with a reduction in RPM at 50% span height. However, a significant drop was observed in pressure at the leading edge of the rotor at 90% height for both 50% and 75% RPM cases. The predicted pressure distribution on the surface of the rotor blade is a result of interaction between multiple phenomena, including centrifugal forces on fluid, velocity variations due to blade shape, tip leakage vortices, separated flow, and boundary layer shock interaction. It is not trivial to provide definitive explanation of the pressure profiles observed along the rotor blade surface for 50% and 90% span locations at different RPM values. At 90% span location, the effect of centrifugal acceleration and tip-leakage is expected to be higher compared to 50% span location. This is evident in Figure 16 as the large difference between the maximum and minimum value of pressure coefficient at 90% span location for all three rotor speeds. Considering only the rotor speed, since the same power is maintained, the torque is minimum for the highest RPM. The area enclosed by the pressure coefficient curve is indicative of the aerodynamic force acting normal to the blade that directly contributes in torque calculation. As such, the area observed for the highest RPM is smallest at both span locations.
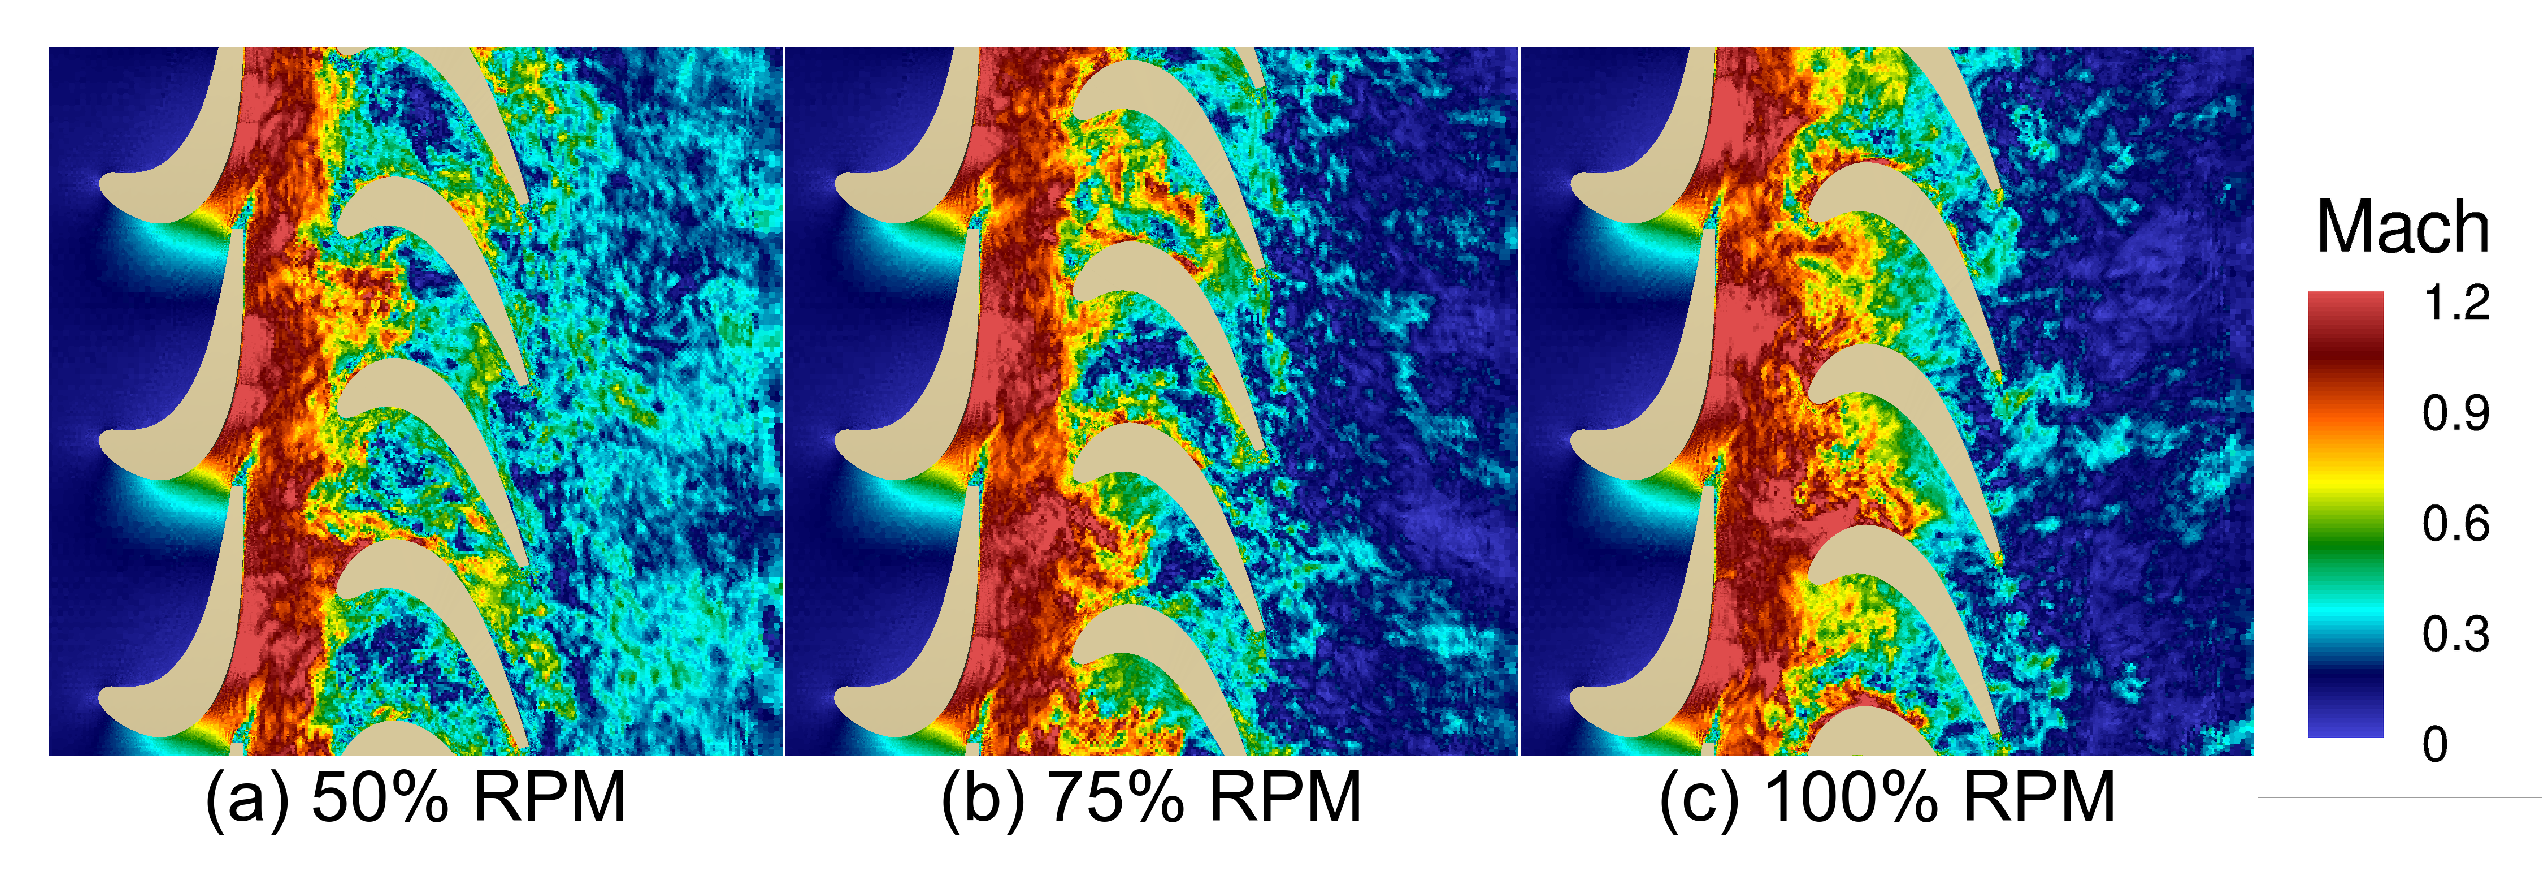
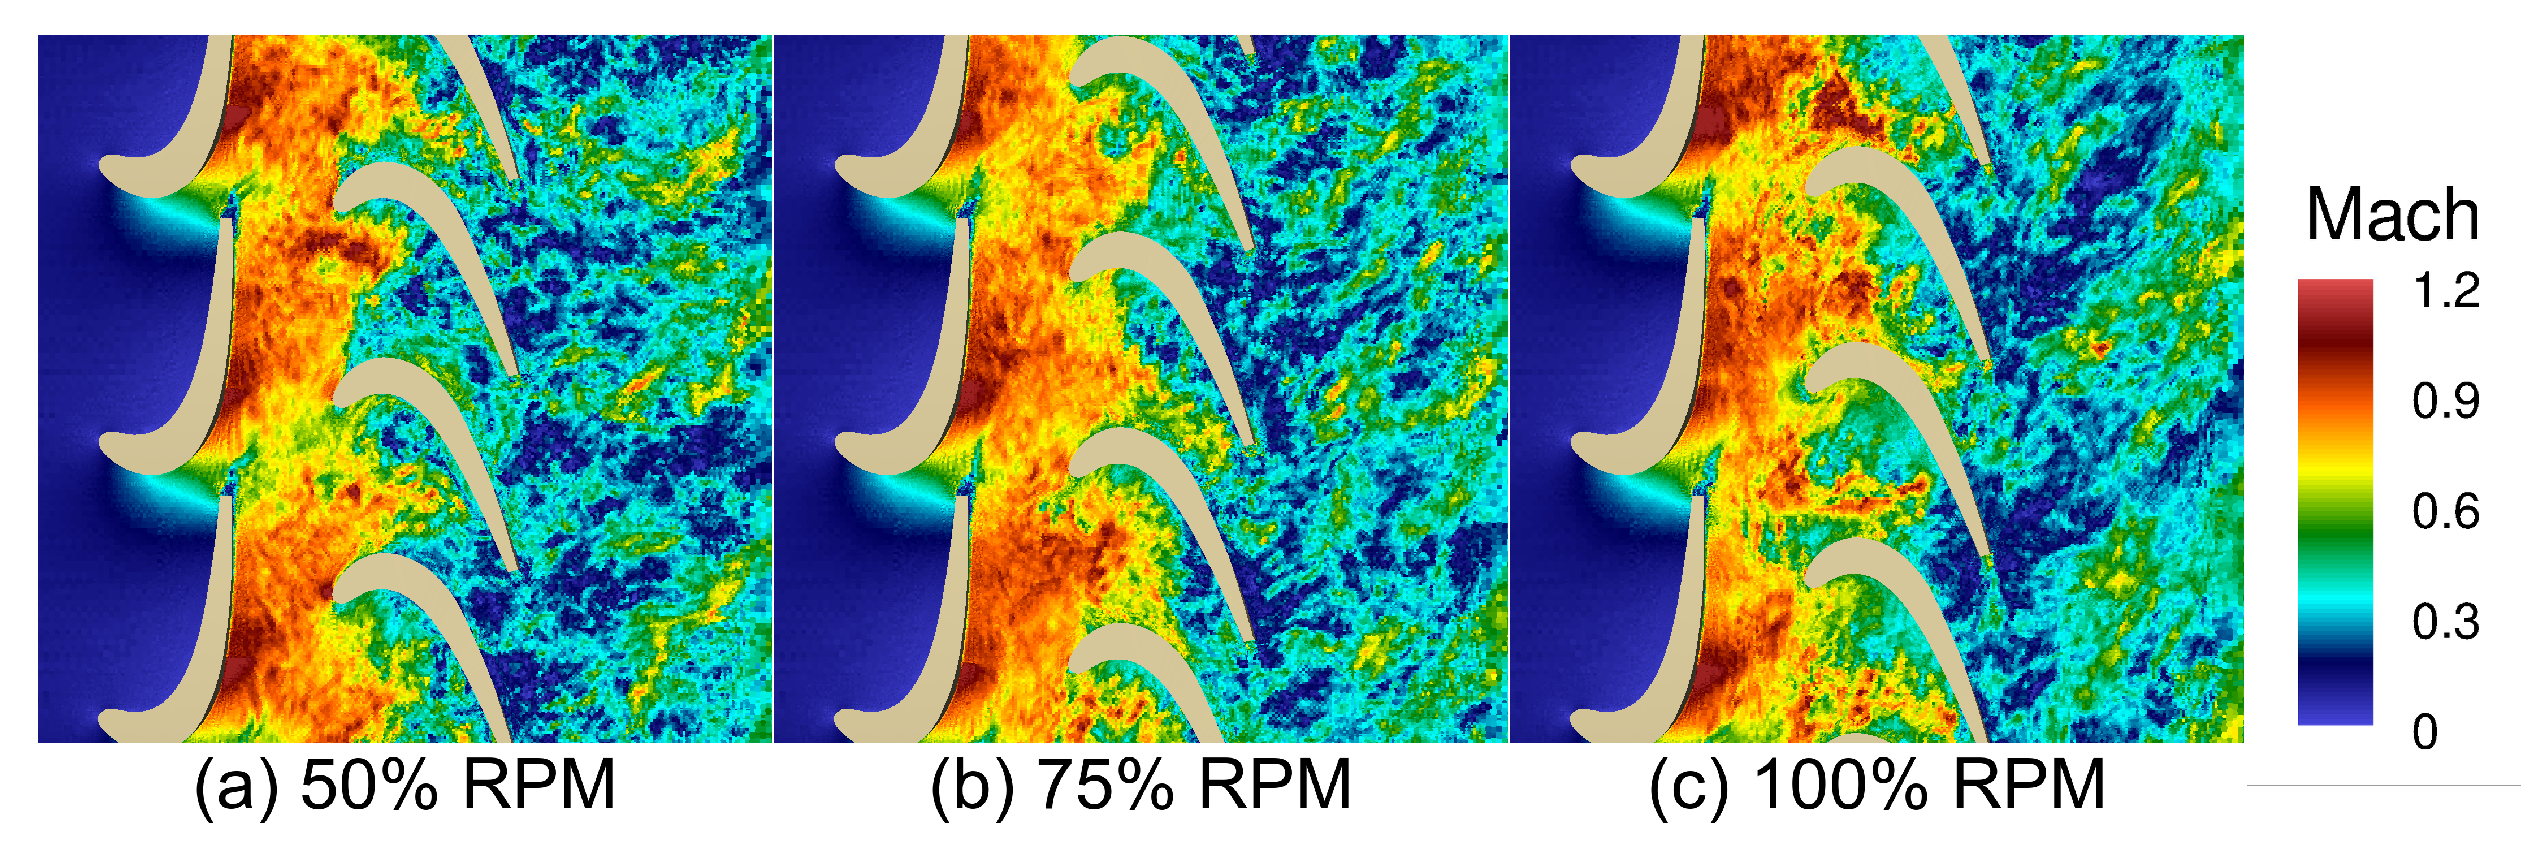
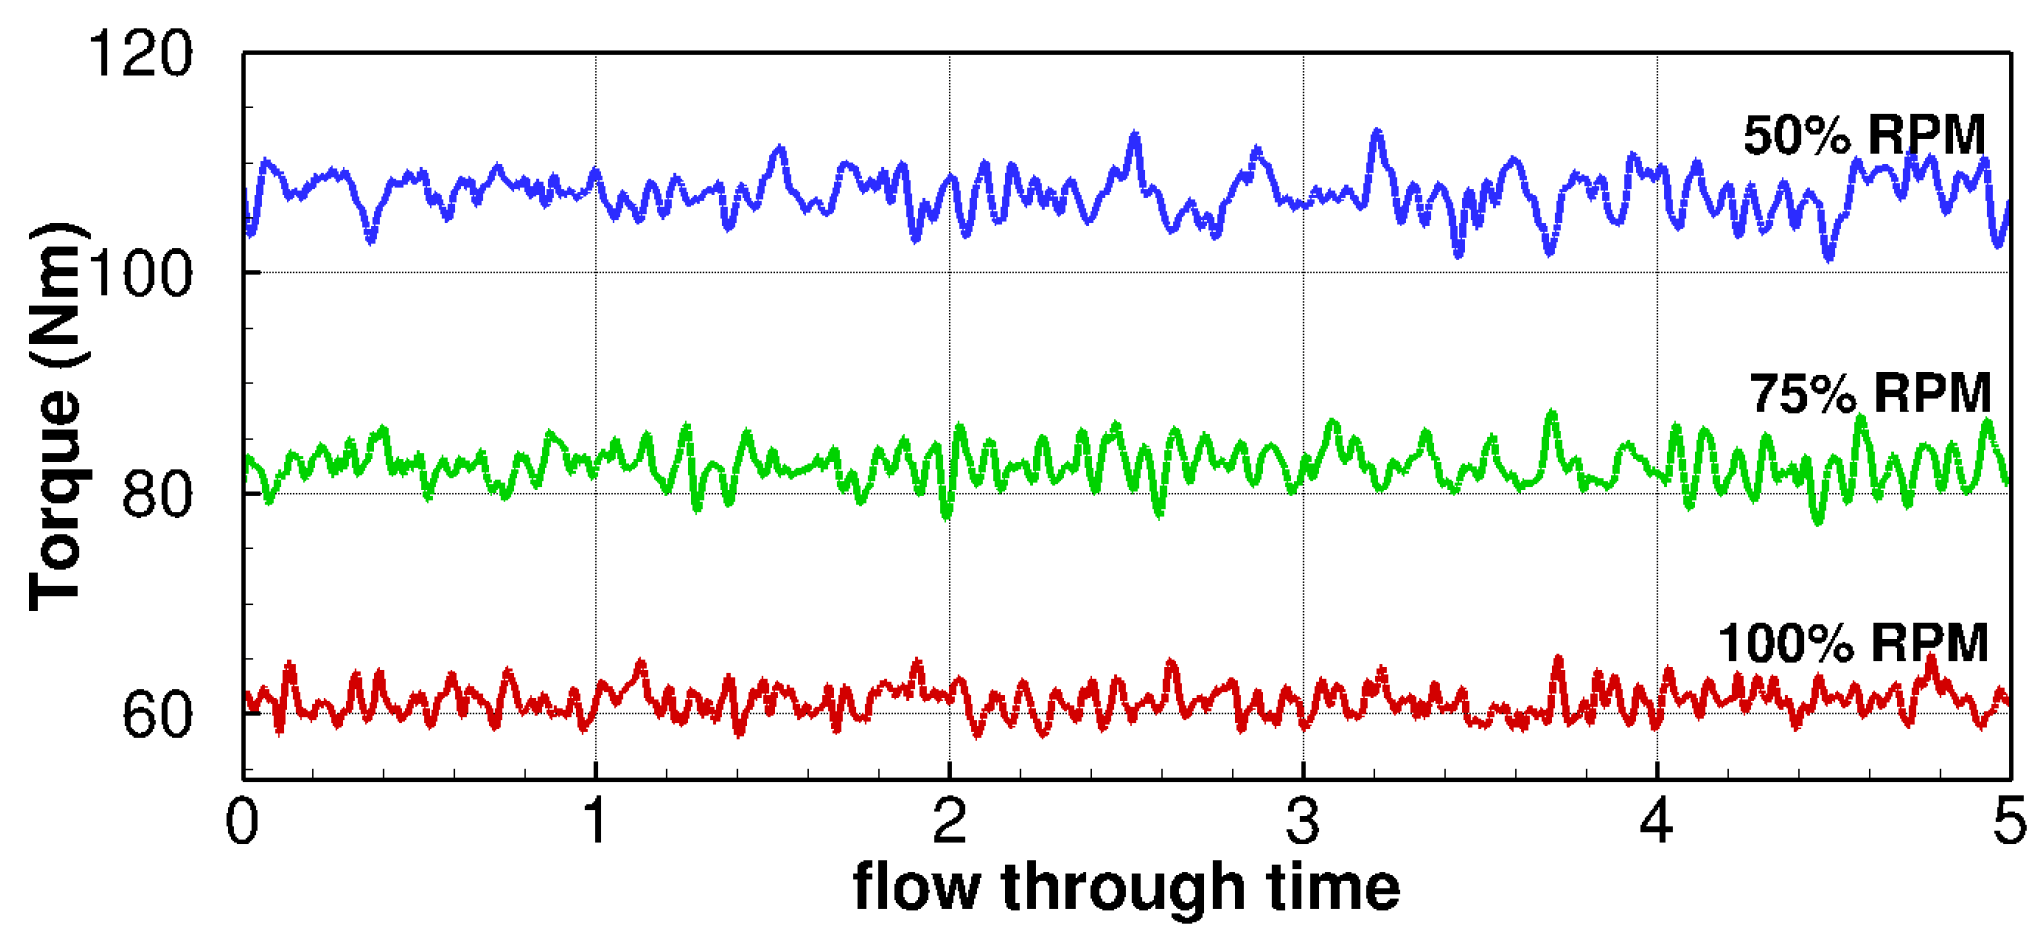
Figure 18 and Figure 19 present the contours of instantaneous Mach number at two span heights, illustrating the unsteady flow structures between the stator and rotor blades at different speeds. The contour planes in Figure 18 and Figure 19 are depicted by projecting the cylindrical surface at 50% and 90% span height of the rotor blade, respectively. The differences in unsteady flow characteristics for different rotating speeds are captured from the mean and RMS contours in Figure 20 and Figure 21. Figure 20 clearly shows that the unsteadiness increases dramatically downstream of the rotor as the RPM deviates from the design point. In addition, in Figure 21, the higher RMS value of Mach number on the suction side of the rotor blades for cases with 50% RPM and 75% RPM indicates larger extent of flow separation at off-design conditions when compared to design operation at 100% RPM. The time histories of torque in the axial direction on the rotating part is shown in Figure 22 using the flow through time scale. The power produced by the turbine stage is approximately same for all three rotor speeds and therefore the predicted torque rotor decreases with increase in operating RPM.
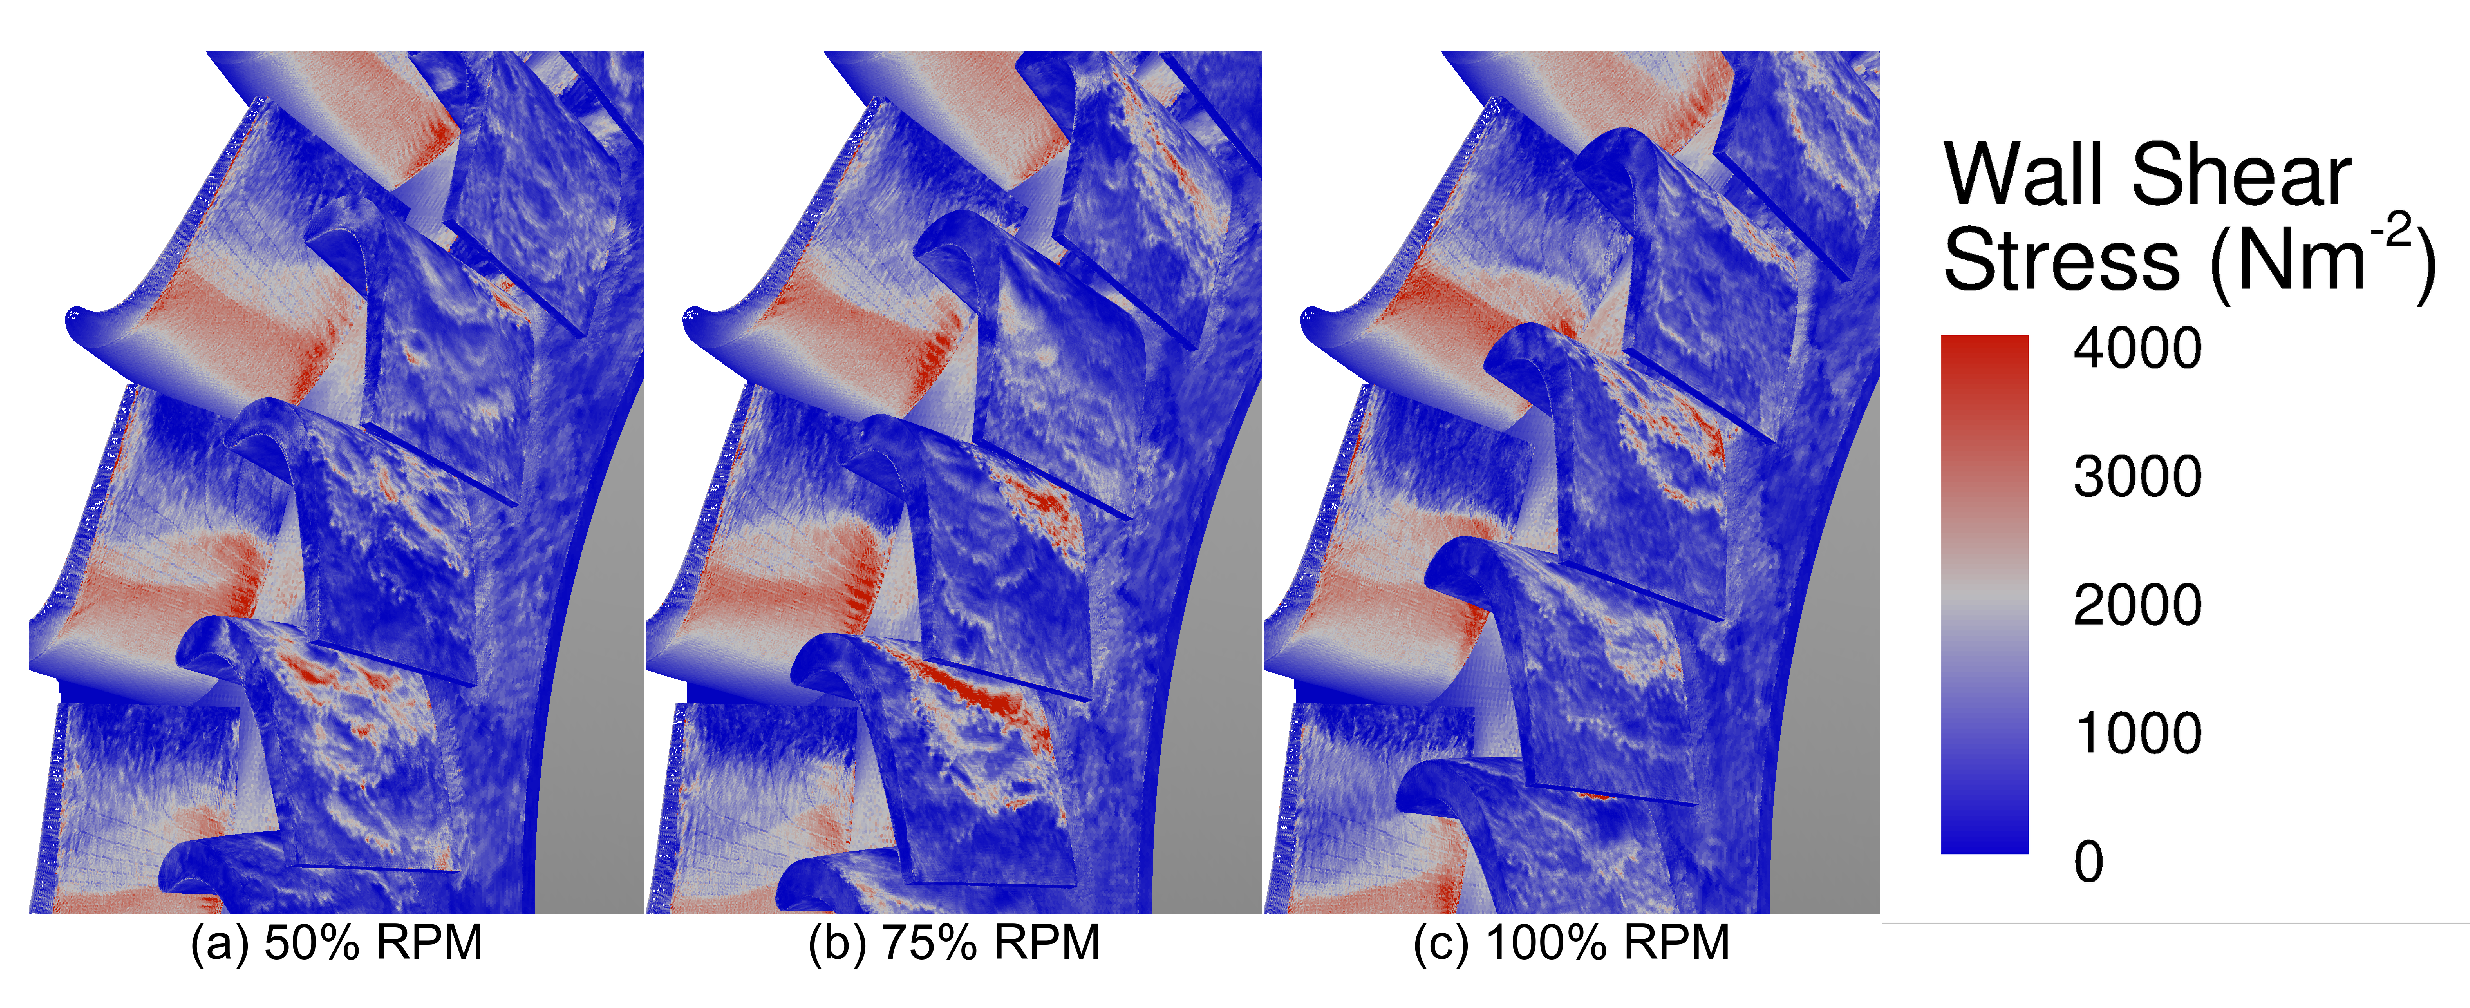
Figure 23 shows the instantaneous wall shear stress distribution on the surface of the blades for three RPM values. Wall shear stress plays an important role in determining particle deposition patternation on blade surfaces when the flow is entrained with molten sand/dust particles. Wall shear stress patterns in Figure 23 indicate that cases with 75% and 50% RPM experience a faster transition to turbulence and higher flow separation. Abrupt changes in wall shear stress on the suction side of the stator blades indicate the occurrence of multiple shocks within the stator–rotor passage. The variation in adiabatic efficiency with rotor RPM for the two tip clearances is shown as a bar chart in Figure 24. The adiabatic efficiencies at 16% chord tip clearance were obtained from the authors’ previous publication [46]. As evident in the bar chart, the reduction in efficiency with deviation in RPM from design value highlights the performance deterioration at off-design conditions due to the increase in unsteady flow interaction. The sharp differences in predicted performance is also apparent in the bar chart for the two tip gaps.

4. Conclusions and Future Work

Detailed wall-modeled large eddy simulations of flow through the power sector stage of a gas turbine engine were carried out in this work at realistic operating conditions using a highly scalable finite volume based compressible solver framework. To understand the grid requirements of the simulations and assess the capability of solver in predicting unsteady turbomachinery flow-field, a grid sensitivity analysis was conducted first by performing simulations over three grids at different resolutions at design operating condition. The grids were generated using Voronoi-based description and were smoothed using Lloyd iterations. The analysis showed that the generated grids are resolved sufficiently to establish grid convergence with respect to the pressure and integrated stage performance but may require further refinement to resolve near-wall flow features and improve torque prediction. Mean pressure profiles along stator and rotor blade surfaces were also computed and were found to be nearly insensitive to grid resolution. Large eddy simulations were then carried out to quantify the impact of tip clearance on the predicted adiabatic efficiency of the stage by utilizing the finest of the three grids. Tip clearance of 16% rotor chord and 3% rotor chord were used for this analysis. It was found that the efficiency improved substantially when the tip clearance was reduced from 16% to 3% due to decrease in tip leakage flow and the resulting secondary flow structures. Simulations were also carried out at different operating conditions. To simulate off-design conditions, the rotor speed was reduced to 50% and 75% of the rated value. The results show that the flow becomes highly unsteady as the rotational speed of the rotor is reduced from the design point value. For the given power, the torque acting on the rotor increased with decrease in rotational speed. Changes in rotational speed considerably altered the mean pressure profile along the rotor blade surface with significant impact observed at the span locations closer to tip. The numerical framework utilized in this study is well suited to conduct future design investigations of the blade articulation concept because of the demonstrated high computational efficiency, fidelity in predicting transient flow features, and integrated stage performance with acceptable accuracy.

Author Contributions

Conceptualization, N.J., L.B., and M.M.; Methodology, N.J., D.K., and F.H.; Software, D.K., and F.H.; Validation, N.J., D.K., and F.H; Formal analysis: N.J., L.B., M.M., and A.G.; Investigation: N.J., L.B., M.M., D.K, A.F., and A.G.; Resources: L.B., M.M., and A.G.; Data curation: N.J., L.B., A.F.; Writing—original draft preparation, N.J., and L.B.; Writing—review and editing, M.M., D.K., and A.F.; Visualization, N.J., D.K., and F.H.; Supervision, L.B., M.M., and A.F.; Project administration, L.B., and A.F.; and Funding acquisition, L.B., and A.F. All authors have agreed to the published version of the manuscript.

Funding

This research was funded through the cooperative agreement #W911NF-16-2-0155 between the U.S. Army Research Laboratory and the University of Maryland, College Park and supported in part by the DoD High-Performance Computing Modernization Program (HPCMP).

Acknowledgments

The authors gratefully acknowledge the resources and support provided by Department of Defense Supercomputing Resource Center (DSRC) through use of “Excalibur” HPC system as part of a Frontier project to ARL Vehicle Technology Directorate in propulsion sciences.

Conflicts of Interest

The authors declare no conflict of interest.

Abbreviations

The following abbreviations are used in this manuscript:
ALEArbitrary Eulerian-Lagrangian
ARLArmy Research Laboratory
CADComputer-Aided Design
CFLCourant–Friedrichs–Lewy condition
DoDDepartment of Defense
DSRCDepartment of Defense Supercomputing Resource Center
FVLFuture Vertical Lift
GCLGeometric Conservation Law
HPCHigh Performance Computing
HPCMPHigh Performance Computing Modernization Program
LESLarge Eddy Simulation
NASANational Aeronautics and Space Administration
RANSReynolds Averaged Navier–Stokes
RMSRoot Mean Square
RPMRevolutions Per Minute
VSPTVariable-Speed Power Turbine
WMLESWall-modeled Large Eddy Simulation
WRLESWall-Resolved Large Eddy Simulation

References

  1. Dangelo, M. Wide Speed Range Turboshaft Study; Technical Report NASA-CR-198380; NASA Glenn Research Center: Cleveland, OH, USA, 1995.
  2. Welch, G.E.; McVetta, A.B.; Stevens, M.A.; Howard, S.A.; Giel, P.W.; Ameri, A.A. Variable-Speed Power-Turbine Research at Glenn Research Center; Technical Report NASA/TM-2012-217605; NASA Glenn Research Center: Cleveland, OH, USA, 2012.
  3. Welch, G.E. Assessment of Aerodynamic Challenges of a Variable-Speed Power Turbine for Large Civil Tilt-Rotor Application; Technical Report NASA/TM-2010-216758; NASA Glenn Research Center: Cleveland, OH, USA, 2010.
  4. Karstensen, K.W.; Wiggins, J.O. A Variable-Geometry Power Turbine for Marine Gas Turbines. J. Turbomach. 1990, 112, 165–174. [Google Scholar] [CrossRef]
  5. Schobeiri, M. Active Aerodynamic Control of Multi-Stage Axial Compressor Instability and Surge by Dynamically Adjusting the Stator Blades. In ASME Turbo Expo 2001: Power for Land, Sea, and Air; American Society of Mechanical Engineers: New Orleans, LA, USA, 2001; Volume 1. [Google Scholar]
  6. Cyrus, V. Aerodynamic Performance of an Axial Compressor Stage With Variable Rotor Blades and Variable Inlet Guide Vanes. In ASME 1998 International Gas Turbine and Aeroengine Congress and Exhibition; American Society of Mechanical Engineers: Stockholm, Sweden, 1998; Volume 1. [Google Scholar] [CrossRef] [Green Version]
  7. Camp, T.R.; Day, I.J. A Study of Spike and Modal Stall Phenomena in a Low-Speed Axial Compressor. In ASME 1997 International Gas Turbine and Aeroengine Congress and Exhibition; American Society of Mechanical Engineers: Orlando, FL, USA, 1997. [Google Scholar] [CrossRef] [Green Version]
  8. Celis, C.; Ribeiro Pinto, P.d.M.; Barbosa, R.S.; Ferreira, S.B. Modeling of Variable Inlet Guide Vanes Affects on a One Shaft Industrial Gas Turbine Used in a Combined Cycle Application. In ASME Turbo Expo 2008: Power for Land, Sea, and Air; American Society of Mechanical Engineers: Berlin, Germany, 2008; Volume 2, pp. 1–6. [Google Scholar] [CrossRef]
  9. Roy-Aikins, J.E.A. Some Aspects of Variable Geometry Gas Turbine Operation. In ASME 1992 International Gas Turbine and Aeroengine Congress and Exposition; American Society of Mechanical Engineers: Cologne, Germany, 1992. [Google Scholar] [CrossRef] [Green Version]
  10. Murugan, M.; Ghoshal, A.; Xu, F.; Hsu, M.C.; Bazilevs, Y.; Bravo, L.; Kerner, K. Analytical Study of Articulating Turbine Rotor Blade Concept for Improved Off-Design Performance of Gas Turbine Engines. J. Eng. Gas Turbines Power 2017, 139, 102601. [Google Scholar] [CrossRef] [Green Version]
  11. Holeskt, D.E.; Futral, S.M. Effect of Rotor Tip Clearance on the Performance of a 5-Inch Single-Stage Axial-Flow Turbine; Technical Report NASA-TM-X-1757; NASA Glenn Research Center: Cleveland, OH, USA, 1969.
  12. Booth, T.C.; Dodge, P.R.; Hepworth, H.K. Rotor-Tip Leakage: Part I—Basic Methodology. J. Eng. Power 1982, 104, 154–161. [Google Scholar] [CrossRef]
  13. Bringhenti, C.; Barbosa, J.R. Effects of Turbine Tip Clearance on Gas Turbine Performance. In ASME Turbo Expo 2008: Power for Land, Sea, and Air; American Society of Mechanical Engineers: Berlin, Germany, 2008; Volume 6, pp. 1715–1721. [Google Scholar] [CrossRef]
  14. Chen, G.; Dawes, W.; Hodson, H. Numerical and Experimental Investigation of Turbine Tip Gap Flow. In 29th Joint Propulsion Conference and Exhibit; American Institute of Aeronautics and Astronautics: Monterey, CA, USA, 1993. [Google Scholar] [CrossRef]
  15. Krishnababu, S.K.; Newton, P.; Dawes, W.N.; Lock, G.D.; Hodson, H.P. An Experimental and Numerical Investigation of the Tip Leakage Flow and Heat Transfer Using a Rotor Tip Gap Model. In Proceedings of the Fifth European Turbomachinery Conference, Lille, France, 23–25 May 2005. [Google Scholar]
  16. Jin, P.; Goldstein, R.J. Local Mass/Heat Transfer on Turbine Blade Near-Tip Surfaces. In ASME Turbo Expo 2002: Power for Land, Sea, and Air; American Society of Mechanical Engineers: Amsterdam, The Netherlands, 2009; pp. 1083–1094. [Google Scholar] [CrossRef]
  17. You, D.; Wang, M.; Moin, P.; Mittal, R. Large-Eddy Simulation Analysis of Mechanisms for Viscous Losses in a Turbomachinery Tip-Clearance Flow. J. Fluid Mech. 2007, 586, 177–204. [Google Scholar] [CrossRef] [Green Version]
  18. You, D.; Wang, M.; Moin, P.; Mittal, R. Effects of Tip-Gap Size on the Tip-Leakage Flow in a Turbomachinery Cascade. Phys. Fluids 2006, 18, 105102. [Google Scholar] [CrossRef] [Green Version]
  19. Meng, F.; Zheng, Q.; Gao, J.; Fu, W. Effect of Tip Clearance on Flow Field and Heat Transfer Characteristics in a Large Meridional Expansion Turbine. Energies 2019, 12, 162. [Google Scholar] [CrossRef] [Green Version]
  20. Ottavy, X.; Courtiade, N.; Gourdain, N. Experimental and Computational Methods for Flow Investigation in High-Speed Multistage Compressor. J. Propul. Power 2012, 28, 1141–1155. [Google Scholar] [CrossRef]
  21. Gamannossi, A.; Amerini, A.; Mazzei, L.; Bacci, T.; Poggiali, M.; Andreini, A. Uncertainty Quantification of Film Cooling Performance of an Industrial Gas Turbine Vane. Entropy 2020, 22, 16. [Google Scholar] [CrossRef] [Green Version]
  22. Choi, H.; Moin, P. Grid-Point Requirements for Large Eddy Simulation: Chapman’s Estimates Revisited. Phys. Fluids 2012, 24, 011702. [Google Scholar] [CrossRef]
  23. Papadogiannis, D.; Garnaud, X. Unstructured Large Eddy Simulations of the Transonic Compressor Rotor 37. In 23rd AIAA Computational Fluid Dynamics Conference; American Institute of Aeronautics and Astronautics: Denver, CO, USA, 2017. [Google Scholar] [CrossRef]
  24. de Laborderie, J.; Duchaine, F.; Vermorel, O.; Gicquel, L.; Moreau, S. Application of an Overset Grid Method to the Large Eddy Simulation of a High-Speed Multistage Axial Compressor. In ASME Turbo Expo 2016: Turbomachinery Technical Conference and Exposition; American Society of Mechanical Engineers: Seoul, Korea, 2016. [Google Scholar] [CrossRef]
  25. Cui, B.; Zhang, C.; Zhang, Y.; Zhu, Z. Influence of Cutting Angle of Blade Trailing Edge on Unsteady Flow in a Centrifugal Pump Under Off-Design Conditions. Appl. Sci. 2020, 10, 580. [Google Scholar] [CrossRef] [Green Version]
  26. Papadogiannis, D.; Duchaine, F.; Gicquel, L.; Wang, G.; Moreau, S. Effects of Subgrid Scale Modeling on the Deterministic and Stochastic Turbulent Energetic Distribution in Large-Eddy Simulations of a High-Pressure Turbine Stage. J. Turbomach. 2016, 138. [Google Scholar] [CrossRef]
  27. Moon, J.S.; Manuel, L.; Churchfield, M.J.; Lee, S.; Veers, P.S. Toward Development of a Stochastic Wake Model: Validation Using LES and Turbine Loads. Energies 2018, 11, 53. [Google Scholar] [CrossRef] [Green Version]
  28. Abkar, M. Impact of Subgrid-Scale Modeling in Actuator-Line Based Large-Eddy Simulation of Vertical-Axis Wind Turbine Wakes. Atmosphere 2018, 9, 257. [Google Scholar] [CrossRef] [Green Version]
  29. Krishnababu, S.K.; Newton, P.J.; Dawes, W.N.; Lock, G.D.; Hodson, H.P.; Hannis, J.; Whitney, C. Aerothermal Investigations of Tip Leakage Flow in Axial Flow Turbines—Part I: Effect of Tip Geometry and Tip Clearance Gap. J. Turbomach. 2009, 131. [Google Scholar] [CrossRef]
  30. Brès, G.A.; Bose, S.T.; Emory, M.; Ham, F.E.; Schmidt, O.T.; Rigas, G.; Colonius, T. Large-Eddy Simulations of Co-Annular Turbulent Jet Using a Voronoi-Based Mesh Generation Framework. In 2018 AIAA/CEAS Aeroacoustics Conference; American Institute of Aeronautics and Astronautics: Atlanta, GA, USA, 2018. [Google Scholar] [CrossRef] [Green Version]
  31. Ham, F.; Bose, S.; Hejazi, B.; Mittal, V. A Low-Dissipation Numerical Scheme on Voronoi Grids for Complex Geometries. In 68th Annual Meeting of the APS Division of Fluid Dynamics; American Physical Society: Boston, MA, USA, 2015; Volume 60. [Google Scholar]
  32. Joo, B.H.; Medic, G.; Philips, D.A.; Bose, S.T. Large-Eddy Simulation of a Compressor Rotor. In Proceedings of the Summer Program; Center for Turbulence Research: Stanford, CA, USA, 2014; p. 467. [Google Scholar]
  33. Hirt, C.W.; Amsden, A.A.; Cook, J.L. An Arbitrary Lagrangian-Eulerian Computing Method for All Flow Speeds. J. Comput. Phys. 1974, 14, 227–253. [Google Scholar] [CrossRef]
  34. Springel, V. E Pur Si Muove: Galilean-Invariant Cosmological Hydrodynamical Simulations on a Moving Mesh. Mon. Not. R. Astron. Soc. 2010, 401, 791–851. [Google Scholar] [CrossRef] [Green Version]
  35. Vreman, A.W. An Eddy-Viscosity Subgrid-Scale Model for Turbulent Shear Flow: Algebraic Theory and Applications. Phys. Fluids 2004, 16, 3670–3681. [Google Scholar] [CrossRef]
  36. Lehmkuhl, O.; Park, G.I.; Bose, S.T.; Moin, P. Large-Eddy Simulation of Practical Aeronautical Flows at Stall Conditions. In Proceedings of the Summer Program; Center for Turbulence Research: Stanford, CA, USA, 2018; pp. 87–96. [Google Scholar]
  37. Roe, P.L. Affordable, Entropy Consistent Flux Functions. In Proceedings of the Eleventh International Conference on Hyperbolic Problems: Theory, Numerics and Applications, Lyon, France, 17–21 July 2006. [Google Scholar]
  38. Murugan, M.; Ghoshal, A.; Bravo, L.; Xu, F.; Hsu, M.C.; Bazilevs, Y. Articulating Axial-Flow Turbomachinery Rotor Blade for Enabling Variable Speed Gas Turbine Engine. In 2018 Joint Propulsion Conference; American Institute of Aeronautics and Astronautics: Cincinnati, OH, USA, 2018. [Google Scholar] [CrossRef]
  39. Piehl, J.; Bravo, L.; Acosta, W.; Kumar, G.; Drennan, S.; Samimi-Abianeh, O. On Predictions of Fuel Effects on Lean Blow Off Limits in a Realistic Gas Turbine Combustor Using Finite Rate Chemistry. In ASME Turbo Expo 2018: Turbomachinery Technical Conference and Exposition; American Society of Mechanical Engineers: Oslo, Norway, 2018. [Google Scholar] [CrossRef]
  40. Du, Q.; Faber, V.; Gunzburger, M. Centroidal Voronoi Tessellations: Applications and Algorithms. SIAM Rev. 1999, 41, 637–676. [Google Scholar] [CrossRef] [Green Version]
  41. Tucker, P.; Eastwood, S.; Klostermeier, C.; Jefferson-Loveday, R.; Tyacke, J.; Liu, Y. Hybrid LES Approach for Practical Turbomachinery Flows—Part I: Hierarchy and Example Simulations. J. Turbomach. 2012, 134. [Google Scholar] [CrossRef]
  42. Montomoli, F.; Hodson, H.P.; Lapworth, L. RANS–URANS in Axial Compressor, a Design Methodology. Proc. Inst. Mech. Eng. Part A J. Power Energy 2011, 225, 363–374. [Google Scholar] [CrossRef]
  43. Köller, U.; Mönig, R.; Küsters, B.; Schreiber, H.A. Development of Advanced Compressor Airfoils for Heavy-Duty Gas Turbines: Part I—Design and Optimization. In ASME 1999 International Gas Turbine and Aeroengine Congress and Exhibition; American Society of Mechanical Engineers: Indianapolis, IN, USA, 1999; p. V001T03A021. [Google Scholar] [CrossRef] [Green Version]
  44. Leschziner, M.; Li, N.; Tessicini, F. Simulating Flow Separation from Continuous Surfaces: Routes to Overcoming the Reynolds Number Barrier. Philos. Trans. R. Soc. Math. Phys. Eng. Sci. 2009, 367, 2885–2903. [Google Scholar] [CrossRef] [PubMed]
  45. Boyce, M.P. Gas Turbine Engineering Handbook, 4th ed.; Elsevier: Waltham, MA, USA, 2011. [Google Scholar]
  46. Jain, N.; Bravo, L.; Kim, D.; Murugan, M.; Ghoshal, A.; Ham, F.; Flatau, A. Towards Large Eddy Simulation of Rotating Turbomachinery for Variable Speed Gas Turbine Engine Operation. In ASME Turbo Expo 2019: Turbomachinery Technical Conference and Exposition; American Society of Mechanical Engineers: Phoenix, AZ, USA, 2019; p. V02BT40A024. [Google Scholar] [CrossRef]
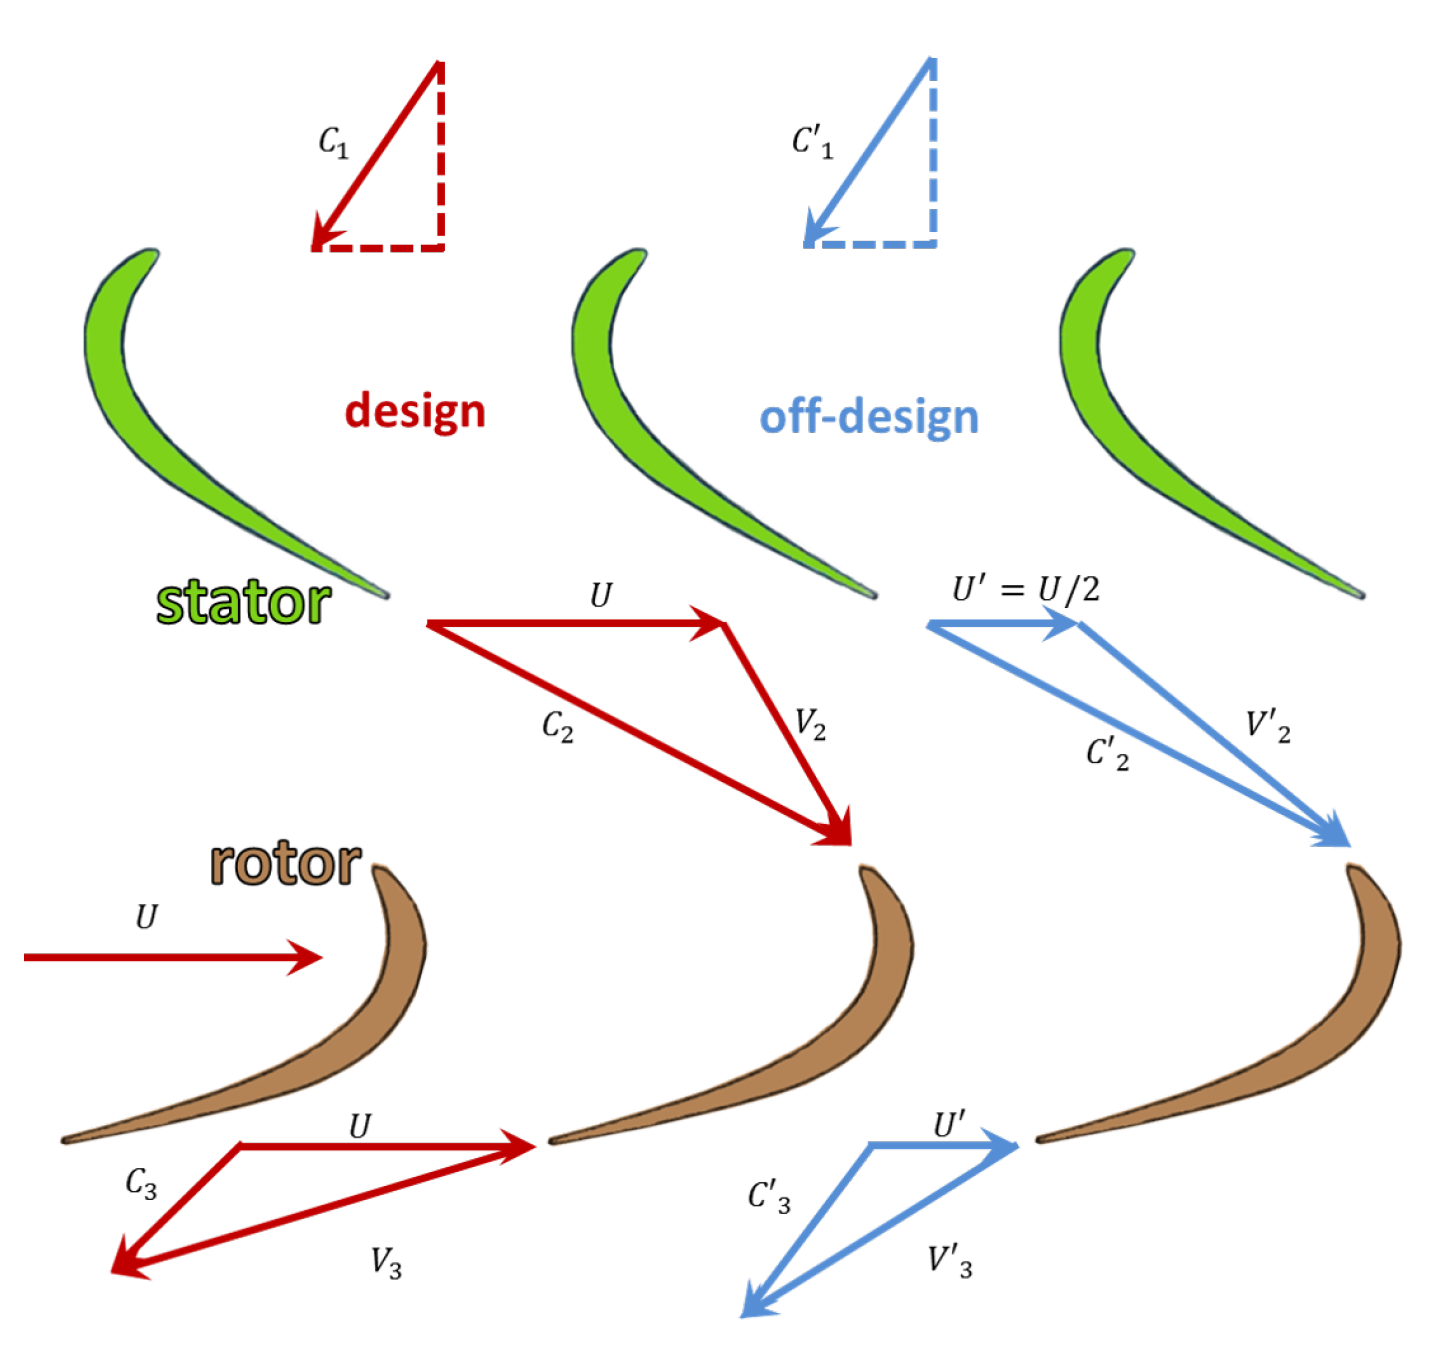
Figure 1. Representative flow velocity triangles through the stator–rotor passage for design and off-design conditions under variable speed power turbine operation.
Energies 13 00703 g001
Figure 2. Streamlines through rotor passage indicating reduced flow separation after pitching of the rotor blade cascade [10].
Energies 13 00703 g002
Figure 3. Leakage of the flow through the blade tip visualized with respect to the rotor blade [29].
Energies 13 00703 g003
Figure 4. CAD model of a single stage power turbine sector with baseline dimensions and boundary conditions [38].
Energies 13 00703 g004
Figure 5. Mesh smoothing using Lloyd iterations where seed points (red) move towards cell centroids (black +) with each iteration and the Voronoi diagram is recomputed (source: Wikipedia).
Energies 13 00703 g005
Figure 6. Visualization of generated Voronoi meshes in the stator–rotor region for three different resolutions: (a) Grid A (coarse); (b) Grid B (medium); and (c) GridC (fine).
Energies 13 00703 g006
Figure 7. Azimuthally averaged pressure along the axial direction for Grids A–C after statistical convergence is achieved.
Energies 13 00703 g007
Figure 8. Instantaneous pressure contours at the walls near z = 0 for: (a) Grid A; (b) Grid B; and (c) Grid C.
Energies 13 00703 g008
Figure 9. Mean pressure profiles along 50% and 90% spanwise locations for: (a) stator blade; and (b) rotor blade.
Energies 13 00703 g009
Figure 10. Instantaneous Mach number contours near the stator–rotor region at the location of 50% span of the rotor blade for: (a) Grid A; (b) grid B; and (c) Grid C.
Energies 13 00703 g010
Figure 11. Instantaneous temperature contours near the stator–rotor region at the location of 50% span of the rotor blade for: (a) Grid A; (b) grid B; and (c) Grid C.
Energies 13 00703 g011
Figure 12. Mean Mach number contours near the stator–rotor region at the location of 50% span of the rotor blade for: (a) Grid A; (b) Grid B; and (c) grid C.
Energies 13 00703 g012
Figure 13. Contours of RMS value of Mach number near the stator–rotor region at the location of 50% span of the rotor blade for: (a) Grid A; (b) Grid B; and (c) grid C.
Energies 13 00703 g013
Figure 14. Time histories of torque in the axial direction on the rotating parts for Grids A–C.
Energies 13 00703 g014
Figure 15. Instantaneous velocity magnitude contours on the plane normal to the axial direction at the location z = 0 passing through the middle of the rotor section at 75% rotor RPM for: (a) 16% chord tip clearance; and (b) 3% chord tip clearance.
Energies 13 00703 g015
Figure 16. Instantaneous temperature contours on the plane normal to the axial direction at the location z = 0 passing through the middle of the rotor section at 75% rotor RPM for: (a) 16% chord tip clearance; and (b) 3% chord tip clearance.
Energies 13 00703 g016
Figure 17. Mean pressure profiles along the rotor blade surface for different rotating speeds at: (a) 50% span of the rotor blade; and (b) 90% span of the rotor blade.
Energies 13 00703 g017
Figure 18. Instantaneous Mach number contours near the stator–rotor region at 50% span location of the rotor blade for: (a) 50% RPM; (b) 75% RPM; and (c) 100% RPM.
Energies 13 00703 g018
Figure 19. Instantaneous Mach number contours near the stator–rotor region at 90% span location of the rotor blade: (a) 50% RPM; (b) 75% RPM; and (c) 100% RPM.
Energies 13 00703 g019
Figure 20. Mean Mach number contours near the stator–rotor region at 50% span location of the rotor blade for: (a) 50% RPM; (b) 75% RPM; and (c) 100% RPM.
Energies 13 00703 g020
Figure 21. Contours of RMS value of Mach number near the stator–rotor region at 50% span location of the rotor blade for: (a) 50% RPM; (b) 75% RPM; and (c) 100% RPM.
Energies 13 00703 g021
Figure 22. Time histories of torque in the axial direction on the rotor at 50%, 75%, and 100% RPM.
Energies 13 00703 g022
Figure 23. Instantaneous wall shear stress on stator and rotor surface for: (a) 50% RPM; (b) 75% RPM; and (c) 100% RPM.
Energies 13 00703 g023
Figure 24. Predicted adiabatic efficiencies at different rotor speeds for two tip clearance values.
Energies 13 00703 g024
Table 1. Averaged smallest wall-normal spacing and y + value for three grids along the blade/vane surface operating at design RPM.
GridStator VanesRotor Blades
A (7.97M)0.5500 mm, y + = 5200.5500 mm, y + = 450
B (13.5M)0.5500 mm, y + = 5200.2750 mm, y + = 250
C (79.3M)0.1375 mm, y + = 1310.1375 mm, y + = 130