Abstract
Today, oil and gas fields gradually become mature with a high amount of water being produced (water cut (WC)), favoring conditions for gas hydrate formation up to the blockage of pipelines. The pressure drop is an important parameter which is closely related to the multiphase flow characteristics, risk of plugging and security of flowlines. This study developed a model based on flowloop experiments to predict the relative pressure drop in pipelines once hydrate is formed in high water cutsystems in the absence and presence of AA-LDHI and/or salt. In this model, the relative pressure drop during flow is a function of hydrate volume and hydrate agglomerate structure, represented by the volume fraction factor (Kv). This parameter is adjusted for each experiment between 1.00 and 2.74. The structure of the hydrate agglomerates can be predicted from the measured relative pressure drop as well as their impact on the flow, especially in case of a homogeneous suspension of hydrates in the flow.
1. Introduction
Gas (clathrate) hydrates are ice-like crystals composed of molecular water cages entrapping light hydrocarbons (methane, ethane, propane, etc.) at low temperature and high pressure [1]. In flow assurance, gas hydrate is a major concern, becoming a potential risk (plug) to subsea pipelines [2]. To prevent plugging, several chemical strategies are applied to subsea flowlines, such as using thermodynamic inhibitors (THIs) or low dosage hydrate inhibitors (LDHIs), such as kinetic hydrate inhibitors (KHIs) or anti-agglomerants (AAs). The conventional technique to prevent gas hydrate formation is thermodynamic inhibition (e.g., using methanol or glycols) which shifts the hydrate equilibrium conditions to a higher pressure and lower temperature. However, the severe conditions (higher pressure, lower temperature, higher acid gas content, and higher water cut) in oil and gas transport make thermodynamic solution less practicable due to the high amount of THIs used. To save Operational Expenditure (OPEX) and Capital Expenditure (CAPEX), LDHIs are used in small amounts compared to those of THIs. The role of KHIs is to delay the nucleation or growth of hydrate crystallization while AAs allow the hydrate formation but help to disperse hydrate particles finely in production fluids, in other words, preventing hydrate agglomeration and plugs. Recently, AAs are widely used [3,4,5] due to their ability to avoid hydrate accumulation and plugging and their role as hydrate KHIs.
Pressure drop is a key factor in the multiphase flow and pipeline system security in the oil and gas production and transport. It depends significantly on the viscosity of fluids and the presence of solids in the pipelines. For the hydrate issue in flow assurance, the increase in pressure drop is attributed to the increase in viscosity caused by hydrate particles and agglomerate structures. The agglomerate hydrate structure is an important, complicated and controversial topic. Several important previous studies reported that once hydrate is formed, hydrate particles tend to attach to each other, forming porous hydrate agglomerates with liquid trapped inside [6,7,8,9,10,11,12]. It was supposed that the size of hydrate agglomerates depends on the balance between the rate of hydrate particles agglomeration and hydrodynamic (shear) and adhesive force [7]. Additionally, water droplets might not be fully converted to hydrate; as a result, the effective hydrate volume is higher than the actual hydrate volume [13].
In fact, there is a shortage of models concerning the relative pressure drop as a function of hydrate volume and agglomerate structure in pipelines [14]. This work seeks to develop a relative pressure drop model for hydrate flow based on the flowloop experiments at high water cut with and without salt and/or AAs. Moreover, this study will clarify the dependence of relative pressure drop on the hydrate agglomerate structures with homogeneous and heterogeneous suspension of hydrates in the flow, which will be referred to in the text as homogenous and heterogeneous hydrate flow.
2. Materials and Methods
2.1. Apparatus
The experimental tests were performed in the Archimède flowloop (Figure 1) which reproduces the field conditions (high pressure, low temperature) encountered in the oil and gas transport lines. This system operates at a maximum pressure of 80 bar and low temperature between 0 °C and an ambient temperature. The flowloop is designed with 38.5 m of horizontal pipe with 1 cm of diameter, a riser and a descending pipe (both of them have a height of 12.6 m and a diameter of 1.5 cm), and a gas injection system. At the top of flowloop riser, there is a separator including two steps of separation (the primary and the secondary ones). A Moineau pump and/or a gas-lift system can be used to circulate the fluids in the flowloop. The total liquid volume is 11.5 L (including the volume of horizontal and vertical lines and separator). The total free gas head volume is 14.9 L (with both volume of ballasts and separator) and the gas volume of ballasts (in the gas-lift system) is 10 L approximately. The length (L) between two points of the main pressure drop (∆P) in the horizontal section is 24.08 m.
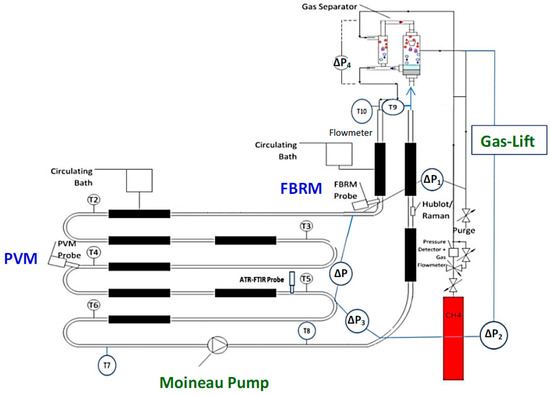
Figure 1.
Archimède flowloop with Moineau pump [15] and gas-lift system [16]; merged in one schema from [15,16].
This flowloop was equipped with temperature (thermocouples), pressure and pressure drop (differential pressure transducer) sensors to determine the beginning of the hydrate crystallization and identification of the agglomeration and plug. Furthermore, a mass flow meter was installed to measure the flowrate and density of fluid and suspension. A gas compensation system (gas flowrate meter and pressure controller) was employed to keep the total pressure at a constant value (75 bar). The temperature in the flowloop was controlled at a constant value (4.5 ± 0.5 °C) by circulating water/ethanol circulation in 9 jackets in the cooling systems. Focused Beam Reflectance Measurement (FBRM) and Particle Video Microscope (PVM) probes were used to identify and follow the hydrate formation, agglomeration, and deposition.
2.2. Materials
This study used ultrapure water, (provided from Millipore filter), oil (Kerdane®, provided by TOTAL FLUIDES, see Appendix A), methane (99.99% purity supplied by AIR LIQUID) and anti-agglomerant. The low dosage hydrate inhibitor was a commercial dispersant additive provided by TOTAL. The additive was water-soluble and was composed of surfactant (30 to 60 wt.%; the proprietary formula; the structure is not depicted in this study) and methanol (40 to 50 wt.%). The density of the additive is 0.8637 g·mL−1. The commercial anti-agglomerant (AA-LDHI) was added in order to understand and test its role in the prevention of hydrate agglomeration and pipeline plugging. Moreover, NaCl (provided by Chimie—Plus Laboratoires, 99.8% NaCl) was added into the water phase for several experiments. Kerdane® was used in this work as the oil phase because it is a clear oil without natural surfactants, which facilitates the observation of the gas hydrate formation and plugging phenomenon by the PVM probe.
2.3. Experimental Procedure
The experiments were made with variable water cuts from 80% to 100% volume of water, with and without salt and/or commercial anti-agglomerant. The water salinity was fixed at 30 g NaCl per 1 L of water (or 2.91 wt.% NaCl) and the AA-LDHI dosage used was in the range of 0 to 2 wt.% of water. The water and oil phases were injected in the flowloop and circulated by Moineau pump at the flowrate of 150 L·h−1 at 4.5 ± 0.5 °C and atmospheric pressure until the liquid–liquid dispersion attained a stable flowrate, FBRM average chord counts, and pressure drop.
The liquid volume in the separator was varied by taking out the liquid from the flowloop through several purge valves. At 85 vol.% of liquid, the PD4 (pressure drop in the separator) was 30 mbar, with a flowrate of 150 L·h−1.
Once the mixture in the flowloop was homogeneous (stability of the average chord length and pressure drop measurements) the flowloop was pressurized at 75 bar. After some dissolution, a second injection was performed up to 75 bar and the gas compensation system was turned on to stabilize experimental pressure at 75 bar. It was noted that the gas-lift system was used during short periods to enhance hydrate formation by injecting an amount of gas into the bottom of the riser which created liquid–gas interfaces where hydrates nucleated and grew.
Throughout the gas hydrate formation, the rate of gas consumption, the horizontal section and separator pressure drops, temperature, flowrate, density, FBRM and PVM signals were monitored. In the final stage of the experiment (gas hydrate crystallization was ended, i.e., no more hydrates are formed or the pipeline was plugged), the cooling system was stopped and the flowloop was depressurized gradually until reaching the ambient pressure.
2.4. Measurements and Calculations
In this study, the measurements were carried out during the hydrate crystallization processes; including the pressure of methane, the pressure drop, the temperature, gas consumption, liquid flowrate and density.
The water conversion and hydrate volume are very important factors in evaluating the cause of plugging in pipelines due to hydrate formation. The amount of hydrate formed (water conversion and hydrate volume fraction) was quantified by gas consumption (the decrease in total pressure or from the gas flowmeter in the gas compensation system).
The hydrate volume calculation was done by taking into account the lattice parameters of hydrate structure I [17].
Hydrate growth was evaluated through the crystallization rate. To calculate the rate of crystallization Ri(t) and the average crystallization rate Ṝ(t), Equations (1) and (2) were used.
where HV is hydrate volume fraction, (#); t(i) and t(i + 1) are times at point i and i + 1, (min); Δt is total time of crystallization, (min); and k is end point of time, (-).
3. Results and Discussion
3.1. Relative Pressure Drop Models of Suspension
The viscosity of the emulsion can be estimated in a laminar regime by Equation (3) [18]:
where ∆P is the pressure drop, (Pa); L is the length of pipe between two points of pressure drop measurement, (m); D is the diameter of pipe, (m); v is the velocity of flow, (m·s−1); and µ is the viscosity of fluid, (Pa·s).
The correlation between relative viscosity and pressure drop model of suspension in turbulent and laminar regime are in Equations (4)–(7). In Equations (5) and (7), the relative pressure drop (RPD) is equal to the relative viscosity in laminar regime and different from the relative viscosity in turbulent regime. The relative viscosity model of Mills [19] used the term φeff instead of φ [6,20]. The relative pressure drop is equal to the instantaneous pressure drop at time (t), ΔP(t) (after hydrate nucleation) divided by the initial pressure drop at time (t0) (before hydrate nucleation), ΔP(t).
In a laminar regime:
where is the density of fluid, (kg·m−3); f is Fanning friction factor, (-); Re is Reynolds’ Number (-); φeff is effective volume fraction, (-); and φmax is maximum volume fraction to which particles can pack or the packing concentration of randomly packed spheres, (-).
In turbulent regime:
where b is a constant in the Blasius equation.
3.2. Relative Pressure Drop Model Developed
From the experimental results, it is observed that in at dilute disperse system (0 to 0.1 of hydrate volume fraction), there is a very small increase in relative pressure drop. It is assumed that there is not enough hydrate volume to considerably increase the relative pressure drop and almost no liquid is trapped inside individual hydrate particles. However, in more concentrated disperse systems (hydrate volume fraction ranging from 0.1 to 0.2), a considerable increase in relative pressure drop is observed. This is possibly due to the higher viscosity of suspension with higher hydrate volume and a significant amount of liquid being entrapped inside hydrate particles and agglomerates. This hydrate volume range (0.1 to 0.2 of HV) could be an agglomeration transition threshold. As described in Section 3.1., it is necessary to add an extra coefficient in the model of Mills [19] to convert the relative viscosity model to the relative pressure drop model. In this study, an exponent coefficient (n) was added for the variable of (φeff/φmax) into the model of Mills [19] to better fit the experimental data with a developed model which also applies to highly concentrated disperse systems. The developed model is as follows in Equations (8) and (9):
where is relative pressure drop, (-); is the instantaneous pressure drop at (t) during the crystallization process, (bar); is the initial pressure drop at time (t0) just before hydrate formation, (bar); and n is a new degree of freedom to convert the relative viscosity model to the relative pressure drop model (n = 1 for laminar regime and n > 1 for turbulent regime). In this present work, it is supposed that the flow regime is always turbulent in the presence of hydrate particles and the optimized n is equal to 1.26; φeff is an effective particle hydrate volume fraction, (-); φ is the real hydrate volume fraction, (-); Kv is the correction (structural) agglomerate factor, (-); φmax is the maximum volume fraction of randomly packed hydrate particles, (-). The φmax is equal to 0.74, which represents highly poly-dispersed systems, (-) [21,22].
In the present work, the coefficient of multiple determinations (R2 is in the range of 0 to 1) is used to determine the fit between the experimental and the developed model data. If the coefficient of multiple determinations approaches 1, then there is a good agreement between the experimental and regressed data (Figure 2).
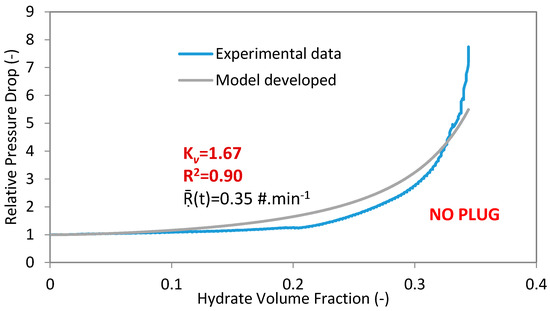
Figure 2.
Experimental data and model for experiment 4 with 100%WC-NaCl-1%AA-LDHI-75bar and 400 L·h−1.
The adjusted Kv factors and calculated R2 are shown in Table 1 for all the experiments done in the Archimède flowloop, together with the average crystallization rate and hydrate volume fraction at the end of each experimental test.

Table 1.
Kv, R2, and Ṝ(t) of the experimental tests done in the Archimède flowloop.
The results (in Table 1 show that the agglomerate structure factor (Kv) was influenced by the presence of additive and/or salt. This factor also depends on the velocity, water cut, and pressure. It is important to note that, in general, at higher crystallization rates, hydrates grow and agglomerate faster to form larger agglomerates which entrap more water. This induces a more heterogeneous hydrate flow [23] with a higher value of Kv and a higher pressure drop. In the presence of both salt and AA-LDHI, a small increase in the pressure drop was witnessed, even at a relative high hydrate volume, probably due to very little fluid being trapped between the hydrate particles. At 80% WC (percentage of water in the total volume of liquid), there was probably not only liquid water but also oil droplets trapped inside the hydrate agglomerates, and these complex hydrates induced a very heterogeneous flow compared with that at 100% WC.
The proposed model describes the hydrate agglomerate structures with (Kv) and predicts the relative pressure drop in pipelines. The Kv is adjusted between 1.00 and 2.74.
Figure 3 summarizes the relation between Kv and the structure of the agglomerates and their impact on the flow depending on the initial conditions of the experiment.
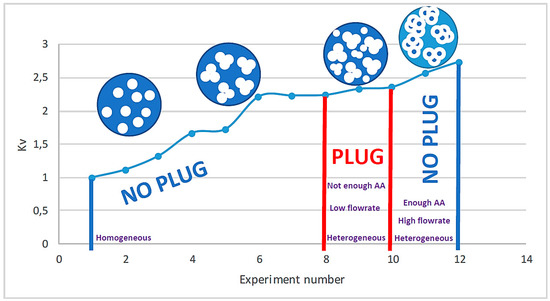
Figure 3.
The experimental tests versus Kv with homogeneous and heterogeneous hydrate flow and plug.
3.3. Homogeneous
The experimental results show that the higher flow rate causes a higher average crystallization rate, which may lead to a higher rate of agglomeration and larger hydrate agglomerates with higher Kv, and higher relative pressure drop.
The rate of crystallization increases with the use of AA-LDHI, but there is a better homogeneity of hydrate slurry flow. This was attributed to the role of AA-LDHI (in the presence of salt) in dispersing hydrate particles and decreasing RPD. The value of Kv in the experiment with AA-LDHI was lower than that in the experiment without AA-LDHI. It is supposed that larger hydrate agglomerates are formed in the absence of AA-LDHI, even at a low average crystallization rate. These large hydrate agglomerates caused more heterogeneity in the flow because they have more liquid entrapped, which induces a higher RPD (higher Kv).
The combination of salt and AA-LDHI increased the performance of AA-LDHI, leading to a smoother curve of pressure drop compared to the one with only AA-LDHI. Furthermore, at the same hydrate volume, the RPD of the experiment with only AA-LDHI was higher than that of the experiment with both salt and AA-LDHI. This can be explained because the addition of salt decreased the average crystallization rate, causing a decrease in the rate of agglomeration and resulting in a more homogeneous flow. Secondly, salt helped to attract more AA-LDHI to the surface of hydrate particles, which prevented agglomeration and decreased the hydrate particle size. Because, in this case, the hydrates are likely oil-wet, there was less liquid trapped between hydrate particles in contact.
3.4. Heterogeneous
As mentioned previously, Kv represents the agglomerate structure and the liquid trapped in a volume of hydrate slurry. Different relative pressure drops with different dosage of AA-LDHI were observed. It was assumed that a higher fluctuation of the relative pressure drop corresponds to a higher heterogeneity in the hydrate slurry. This variation in relative pressure drops observed was a consequence of a difference in the rate of crystallization. The increase in the rate of hydrate formation increased the rate of agglomeration leading to a more heterogeneous hydrate flow. Indeed, it was found that the heterogeneity of hydrate flow was proportional to the structural factor (Kv). It is assumed that the higher rate of agglomeration led to larger sizes of agglomerates. Consequently, the liquid trapped in the hydrate volume () was larger than φ. Moreover, at the same hydrate volume, the higher value of Kv corresponds to an increasing number of fluctuations in the measured relative pressure drop. The experiments at a high flowrate with a dosage of AA-LDHI of 1% weight of water did not show plugging, while the experiments with 0.5% weight of water (without salt) showed plugging. This can be attributed to the ability of the commercial AA-LDHI in dispersing hydrate particles and preventing plugging.
The differences between experimental and model results might be explained by several assumptions as follows:
- It is supposed that φmax is constant (0.74), regardless of flowrate, salt, and AA-LDHI presence. The fact is that φmax might be a function of shearing [21] depends on the presence of salt and/or AA-LDHI.
- In this study, it is supposed that Kv is constant. In fact, the Kv can change until hydrate particles reach a maximum packing volume fraction, φmax [21]. Kv might be dependent on crowding and shearing effects on the formation of agglomerates.
- In this model, the hydrate deposition phenomenon was not completely taken into account.
- The coefficient of multiple determinations (R2) is in the range of 0.76 to 0.98, and approaches 0.9 in the case hydrate agglomerates are homogeneously distributed in the flow (model results fit better with experimental data in case of homogeneous hydrate flow).
4. Conclusions
A relative pressure drop model inspired by the model of Mills [19] was proposed by replacing the viscosity with the pressure drop. A new parameter Kv was introduced to take into account the structure of the agglomerates. This parameter is adjusted between 1.00 and 2.74. Between 2.24 and 2.74, there is a heterogeneous flow; outside of this range, there is a homogeneous flow.
The quantities of AA-LDHI, salt, velocity, water cut, and pressure have an impact on the hydrate agglomerate structure factor (Kv), which is proportional to RPD:
- At higher values of Kv, larger hydrate agglomerates were observed, with higher liquid quantities entrapped. The existence of these larger hydrate agglomerates caused a higher relative pressure drop and a more heterogeneous flow, with higher risk of hydrate plugging.
- At intermediary Kv, higher amounts of AA-LDHI led to a higher rate of crystallization (AA-LDHIs promoted hydrate formation) which promoted a heterogeneous hydrate flow. At low Kv, the use of AA-LDHI decreased the size of hydrate particles and agglomerates, which led to lower RPD (decrease in Kv), preventing plugging.
The combination of AA-LDHI and salt decreased RPD or Kv—in other words, this decreased the size of hydrate agglomerates and led to a better dispersion of hydrate particles.
Higher velocities of flow and pressure caused a higher rate of hydrate crystallization, leading to large hydrate agglomerate size and more heterogeneous hydrate flow.
The decrease in water cut generally led to an increase in Kv.
Author Contributions
Conceptualization, T.-K.P., A.M. and A.C.; methodology, T.-K.P. and A.C.; validation, A.C.; investigation, T.-K.P.; writing—original draft preparation, T.-K.P; writing—review and editing, A.C.; supervision, A.C., A.M., J.-M.H. and P.G.; project administration, A.C.; funding acquisition, A.C. and P.G. All authors have read and agreed to the published version of the manuscript.
Funding
This research was funded by TOTAL E&P and by the Vietnamese Government for the financial support through the Ph.D. scholarship program 911.
Conflicts of Interest
The authors declare no conflict of interest.
Appendix A. Composition of Kerdane® Used
The composition of Kerdane® provided by TOTAL FLUIDES is shown in Table A1.
Table A1.
Chemical properties and composition of Kerdane®.
Table A1.
Chemical properties and composition of Kerdane®.
| Properties/Composition | Kerdane® |
|---|---|
| Chemical Composition | Hydrocarbons, C11–C14, n-alkanes, iso-alkanes, cyclic, <2% aromatics |
| Appearance | Clear light yellow |
| Boiling Point/Interval | 180–260 °C |
| Flash Point | >64 °C |
| Density | 790–825 kg·m−3 at 15 °C |
| Kinematic Viscosity | 2.1 mm2·s−1 at 25 °C |
References
- Sloan, E.; Koh, C.A. Clathrate Hydrates of Natural Gases, 3rd ed.; Taylor and Francis Group: Abingdon, UK, 2008. [Google Scholar]
- Wei, N.; Sun, W.; Meng, Y.; Zhao, J.; Kvamme, B.; Zhou, S.; Zhang, L.; Li, Q.; Zhang, Y.; Jiang, L.; et al. Hydrate Formation and Decomposition Regularities in Offshore Gas Reservoir Production Pipelines. Energies 2020, 13, 248. [Google Scholar] [CrossRef]
- Straume, E.O.; Kakitani, C.; Merino-Garcia, D.; Morales, R.E.M.; Sum, A.K. Experimental study of the formation and deposition of gas hydrates in non-emulsifying oil and condensate systems. Chem. Eng. Sci. 2016, 155, 111–126. [Google Scholar] [CrossRef]
- Dong, S.B.; Li, M.Z.; Firoozabadi, A. Effect of salt and water cuts on hydrate anti-agglomeration in a gas condensate system at high pressure. FUEL 2017, 210, 713–720. [Google Scholar] [CrossRef]
- Peng, B.Z.; Chen, J.; Sun, C.Y.; Dandekar, A.; Guo, S.H.; Liu, B.; Mu, L.; Yang, L.Y.; Li, W.Z.; Chen, G.J. Flow characteristics and morphology of hydrate slurry formed from (natural gas+diesel oil/condensate oil+water) system containing anti-agglomerant. Chem. Eng. Sci. 2012, 84, 333–344. [Google Scholar] [CrossRef]
- Camargo, R. Rheological Properties of Hydrate Suspensions in an Asphaltenic Crude Oil. In Proceedings of the 4th International Conference on Gas Hydrates, Yokohama Symposia, Yokohama, Japan, 19–23 May 2002; pp. 880–885. [Google Scholar]
- Colombel, E.; Gateau, P.; Barré, L.; Gruy, F.; Palermo, T. Discussion sur les mécanismes d’agglomération entre particules d’hydrate dans les émulsions eau dans huile. Oil Gas Sci. Technol. 2009, 64, 629–636. [Google Scholar] [CrossRef]
- Fidel-Dufour, A.; Gruy, F.; Herri, J.M. Rheology of methane hydrate slurries during their crystallization in a water in dodecane emulsion under flowing. Chem. Eng. Sci. 2006, 61, 505–515. [Google Scholar] [CrossRef]
- Palermo, T.; Arla, D.; Borregales, M.; Dalmazzone, C. Study of the agglomeration between hydrate particles in oil using differential scanning calorimetry (DSC). In Proceedings of the Fifth International Conference on Gas Hydrates, Trondheim, Norway, 12–16 June 2005. [Google Scholar]
- Leba, H.; Cameirao, A.; Herri, J.M.; Darbouret, M.; Peytavy, J.L.; Glénat, P. Chord length distributions measurements during crystallization and agglomeration of gas hydrate in a water-in-oil emulsion: Simulation and experimentation. Chem. Eng. Sci. 2010, 65, 1185–1200. [Google Scholar] [CrossRef]
- Pauchard, V.; Palermo, T.; Peytavy, J.L.; Mussumeci, A. Transformation of a Concentrated Oil/Water Emulsion into A Gel Due to Slight Hydrates Formation. In Proceedings of the 5th International Conference on Gas Hydrates, Trondheim, Norway, 12–16 June 2005. [Google Scholar]
- Austvik, T.; Li, X.; Gjertsen, L.H. Hydrate Plug Properties: Formation and Removal of Plugs. Ann. N. Y. Acad. Sci. 2000, 912, 294–303. [Google Scholar] [CrossRef]
- Turner, D.J.; Miller, K.T.; Dendy Sloan, E. Methane hydrate formation and an inward growing shell model in water-in-oil dispersions. Chem. Eng. Sci. 2009, 64, 3996–4004. [Google Scholar] [CrossRef]
- Glenat, P.; Pagezy, L.; Devoisselle, R.; Bourg, P.; Pere, M.; Melchuna, A. Rheological Study of Liquid Hydrates Slurries in Presence of Commercial Hydrates Dispersants (AA-LDHIs); ICGH: Denver, CO, USA, 2017. [Google Scholar]
- Melchuna, A.; Cameirão, A.; Herri, J.-M.; Glénat, P. Topological modeling of methane hydrate crystallization from low to high water cut emulsion systems. Fluid Phase Equilibria 2016, 413, 158–169. [Google Scholar] [CrossRef]
- Fidel-Dufour, A. Influence d’additifs anti-agglomérants sur l’agrégation et les propriétés de transport des hydrates de méthane dans des émulsions eau/dodécane. Ph.D. Thesis, Ecole des Mines de Saint-Etienne, Saint Etienne, France, 2004. [Google Scholar]
- Giavarini, C.; Hester, K. Gas Hydrates. Green Energy and Technology; Springer: London, UK, 2011. [Google Scholar]
- Midoux, N. Mécanique et Rhéologie des Fluides en Génie Chimique; Edition Lavoisier: Paris, France, 1993. [Google Scholar]
- Mills, P. Non-Newtonian behaviour of flocculated suspensions. J. Phys. Lett. 1985, 46, 301–309. [Google Scholar] [CrossRef]
- Moradpour, H.; Chapoy, A.; Tohidi, B. Bimodal model for predicting the emulsion-hydrate mixture viscosity in high water cut systems. Fuel 2011, 90, 3343–3351. [Google Scholar] [CrossRef]
- Quemada, D. Rheology of Concentrated Disperse Systems and Minimum Energy-Dissipation Principle 1. Viscosity-Concentration Relationship. Rheol. Acta 1977, 16, 82–94. [Google Scholar] [CrossRef]
- Krieger, I. Rheology of monodisperse latices. Adv. Colloid Interface Sci. 1972, 3, 111–136. [Google Scholar] [CrossRef]
- Hoekstra, L.L.; Vreeker, R.; Agterof, W.G.M. Aggregation of colloidal nickel hydroxycarbonate studied by light scattering. J. Colloid Interface Sci. 1992, 151, 17–25. [Google Scholar] [CrossRef]


© 2020 by the authors. Licensee MDPI, Basel, Switzerland. This article is an open access article distributed under the terms and conditions of the Creative Commons Attribution (CC BY) license (http://creativecommons.org/licenses/by/4.0/).