1. Introduction
This manuscript shows part of the research program related to the application of the matrix converter (MC) in the HV power network and power flow control of this network. The analysis of the existing MC structures, their control systems and application field requirements lead to the new approach.
Multiphase (6, 12) MC symmetrical structures were applied with the control based on output voltage buildup from fragments of the input voltage. The harmonic content (especially their order) was then limited similar to multilevel converters. PWM-based methods were not used [
1,
2,
3,
4,
5].
For the MATLAB simulation, the internal structure of the MC is made from ideal switches and does not include inside its structure any internal energy conservation elements.
The multiphase MC-based device used in this research (
Figure 1) consists of the MC itself, two multiphase transformers (3 × 6) and a standard load block. The controller, built for MATLAB simulations, was developed using standard Simulink blocks. The software, based on the S-function, is able to emulate signals from a custom build microprocessor board.
The idea of control of the MC structure is based on very simple principles [
6,
7,
8]. Output voltages are created from the fragments of input ones. In real-life, there are some limitations to the control procedure; some of them are derived from the control and some from application requirements (power system):
For constant frequencies at the input and output, every fragment of input voltage that creates an output waveform has the same length in time;
Every following fragment of output waveform comes from the following input phase;
There is no short-circuit at the input or output;
Symmetry at the input and output is required.
The increase of the number of input phases improves the quality of output voltage and input currents (lowers THD and increases order of the harmonics). The research was done on 6×6 structures; however, 12×12 ones were also considered. Thus, the developed real-life controller is able to drive all 144 converter switches (for the 6 × 6 structure, only 36 outputs are used). The number of phases was chosen to be 6 or 12, since 3 × 6, 400 kV and 3 × 12 transformers are already in use (High Voltage Direct Current link, Poland–Sweden).
Figure 1 illustrates the laboratory setup of the proposed MC device. The three-phase load (reactive component) is a variable
L and variable
R load.
In
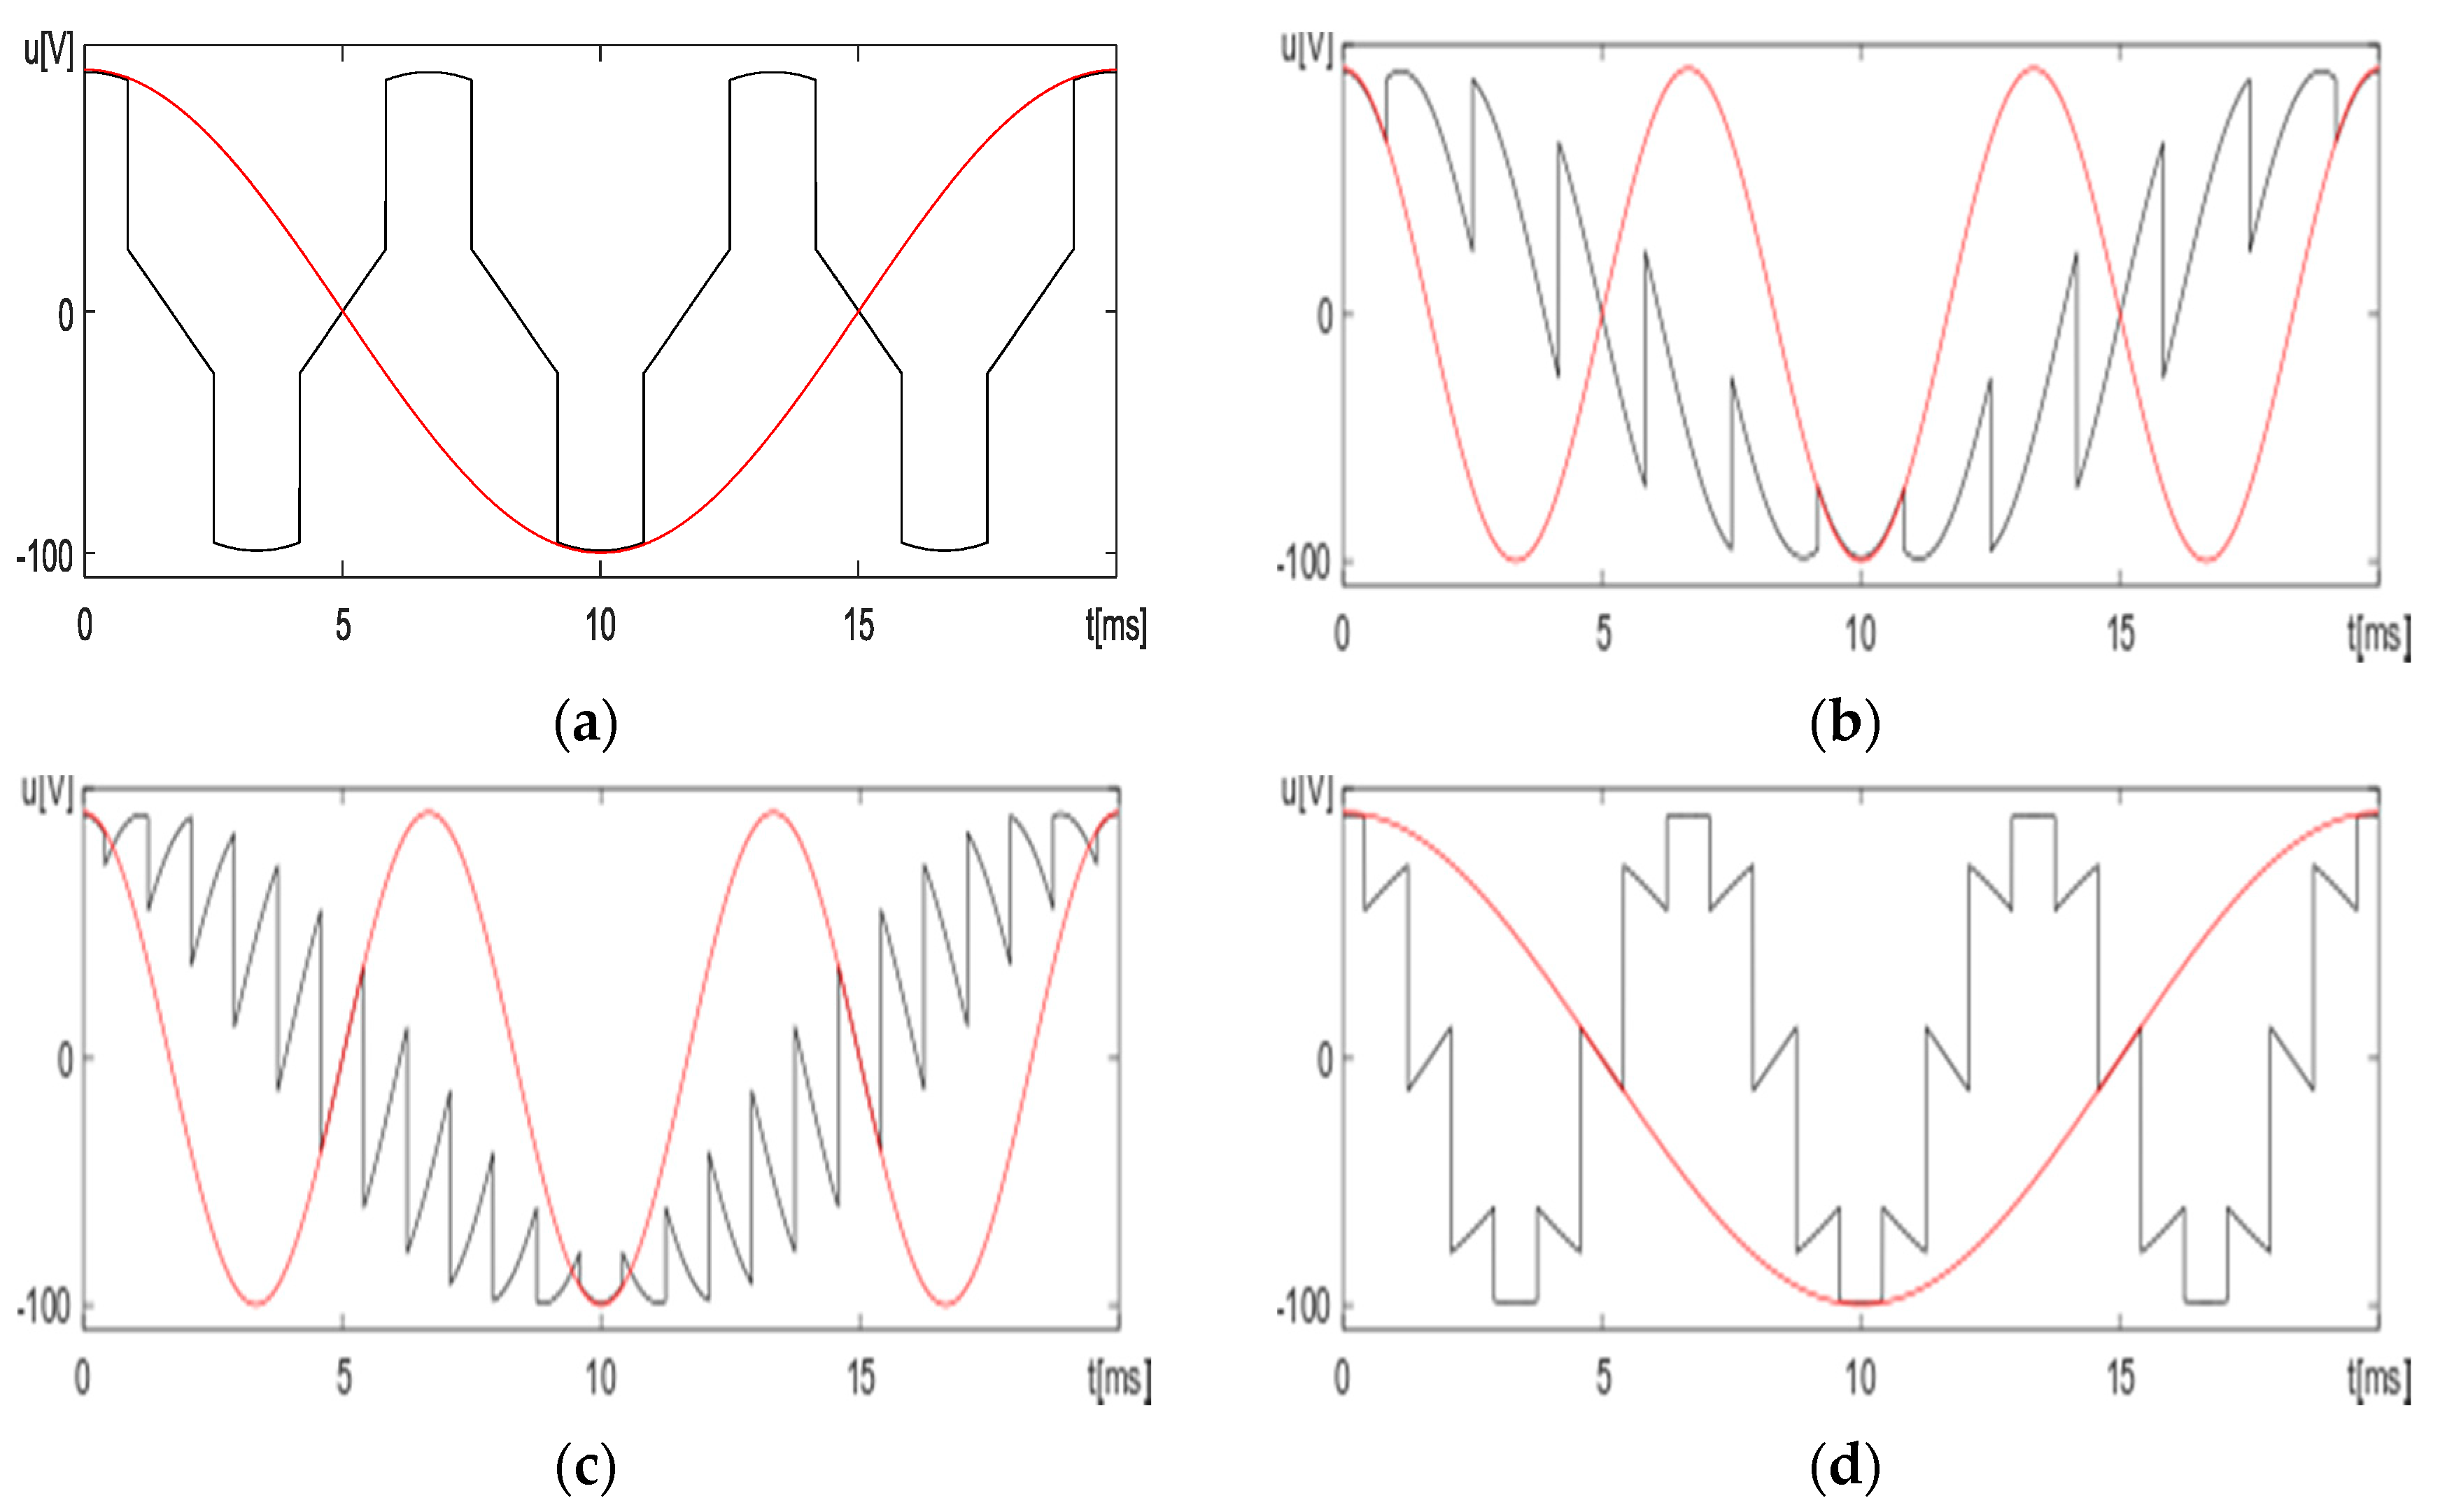
Figure 2, it can be noted that the desired output waveform is crossing almost all fragments of the input used for output creation by half and can be made two ways. The first is where the output is created from crossing the input waveform fragments with the slope opposite to the desired waveform. The second is where the output is created from crossing the waveform with the same slope as the desired waveform. The proposed control strategy is a part of control mechanisms belonging to the set of so-called “area-based” algorithms developed previously by the authors [
9,
10,
11]. This strategy was found to be easy to apply for the multiphase MC control.
2. Development of MC Symmetrical Component Model
To calculate the influence of the MC on reactive power flow, its mathematical model for the first harmonic only was built and analyzed. The model structure depends on the number of input and output phases and on the control used.
Since the MC does not include energy storage elements in its internal structure, the following ties between the input–output result from the matrix structure, energy conservation law and applied control strategy:
The control algorithm changes the state of the switches in the following way: from 1 to 6 and again to 1 (positive sequence) or 1-6-5-4-3-2-1 (negative sequence). This results in the construction of the desired output sinusoidal voltages with equal length fragments of the input voltages. These fragments “cross” the desired waveform (built from input fragments with an opposite sign of derivative) or they lie along the desired output sinusoidal waveform.
The article concentrates only on the first harmonics of voltages and currents since the shape of the waveforms at both sides of the MC is close to sinusoidal and, usually, in real-life devices, the higher-order harmonics are eliminated.
The derived model shows that if the control is changed from a positive to negative sequence, the character of the capacitors connected to the secondary side and visible at the primary site change from capacitive to inductive. Moreover, the angle
(angle between the first harmonic of output voltage and current) changes at the input to angle -
(angle between the first harmonics of input voltage and current). The value of the reactance visible from the input side can be controlled by the change of the output frequency. The equation (Equation (1)) describing the ties introduced to the matrix by its control was transformed using the standard symmetrical components transformation formula:
where
is the transformation matrix for the 6 × 6 structure.
When the input voltage is a symmetrical six-phase voltage with an initial phase shift
, then, after the proposed transformation, it consists only of positive and negative sequences:
where
is the input frequency and
is the input initial phase.
The matrix
after transformation
can still be treated as a tie between the input and output voltages:
Since, for the 6 × 6 MC, the input voltage after transformation consists only of elements in positions [
2] and [
6] (Equation (3)), only a single equation has to be considered. The solutions of equations from positions [
2] and [
6] are conjugated:
The transformation sequence can start up at the arbitrary phase with relation to the input waveform; thus, the angle
was introduced. At the end, the waveforms representing
for inputs voltage positive sequence, for first harmonic and for different frequencies at the input and output can be derived by simulation (
Figure 3).
After this assumption, for positive sequence and limitation of the divagations to the first harmonic only, the element [
2,
2] of matrix
can be then expressed as:
where
is the frequency of MC switches switching,
is the voltage transfer depending only on number of phases of the MC and
is the initial phase of the switching sequence.
For the positive sequence, the output voltage can be described as:
The frequency of the output is equal to the sum of input and control frequencies and the phase shift of the output is equal to the sum of the control and load phases.
For the negative sequence of control:
If , the sequence of the output voltage phases is negative with regards to the input phases sequence (input phases sequence is considered always positive) and the reaction of the output initial phase is in line with the control sequence phase and opposite to the supply phase change.
If , the sequence of the output phases is positive and the reaction of the output initial phase is in line with the control sequence phase and opposite to the supply phase change.
Let us load the MC by a multiphase symmetrical impedance
and introducing the phase shift
. Then, the output currents are symmetrical and have the same sequence (positive) as an output voltage. After transformation, those currents can be expressed as:
where
.
Equation (9) defines the output currents in symmetrical components if the converter output voltage has a positive sequence. If the output voltage has a negative sequence, the output current formula consists of elements conjugated to the elements given in Equation (9).
The goal of the analysis is to calculate the input power factor (phases on the input currents with respect to the input voltage) on the basis of the derived output current. To do it, the calculation of the back to front matrix linking MC currents is necessary. The form of the reverse transformation following the formula (Equation (10)) was applied.
Since the output voltage can be created as a positive (two separate cases) or a negative sequence, the analysis has to include three cases.
• Case 1: positive sequence MC control and positive output current sequence
For this case, when comparing the input current to the input voltage, the input power factor is the same as the output one. The reactive power was transferred from the source to the load via the MC. The character of the reactive power at both sides of the MC is the same (the same phase shifts ).
• Case 2: negative sequence MC control and negative output current sequence for
For this case, when comparing the input current to the input voltage, the input power factor has the same value as the output one; however, the sign of the phase shift acquired from the load is opposite (sign in front of ). The reactive power was transferred from the source to the load via the MC. The character of the reactive power at the input is opposite to the one at the output. When the output has an inductive character, the current at the input has a capacitive one.
• Case 3: negative sequence MC control and negative output current sequence for
In this case, the input power factor has the same value and the same character as the output one (the same phase shift sign as the load one). When the output has an inductive character, the current at the input has also an inductive one.
3. Construction of the MC Real-Life Model
Initially, the results of the divagations were checked using simulations using the MATLAB Simulink software. The simulations were performed for a matrix structure built from the ideal switches and control system, able to emulate the proposed one and for different sizes of a converter matrix. The considered results included voltage transfer, distortion of currents and voltages, introduced by converter phase shifts and the influence of the MC on reactive and active power flows for its different allocation in the power system.
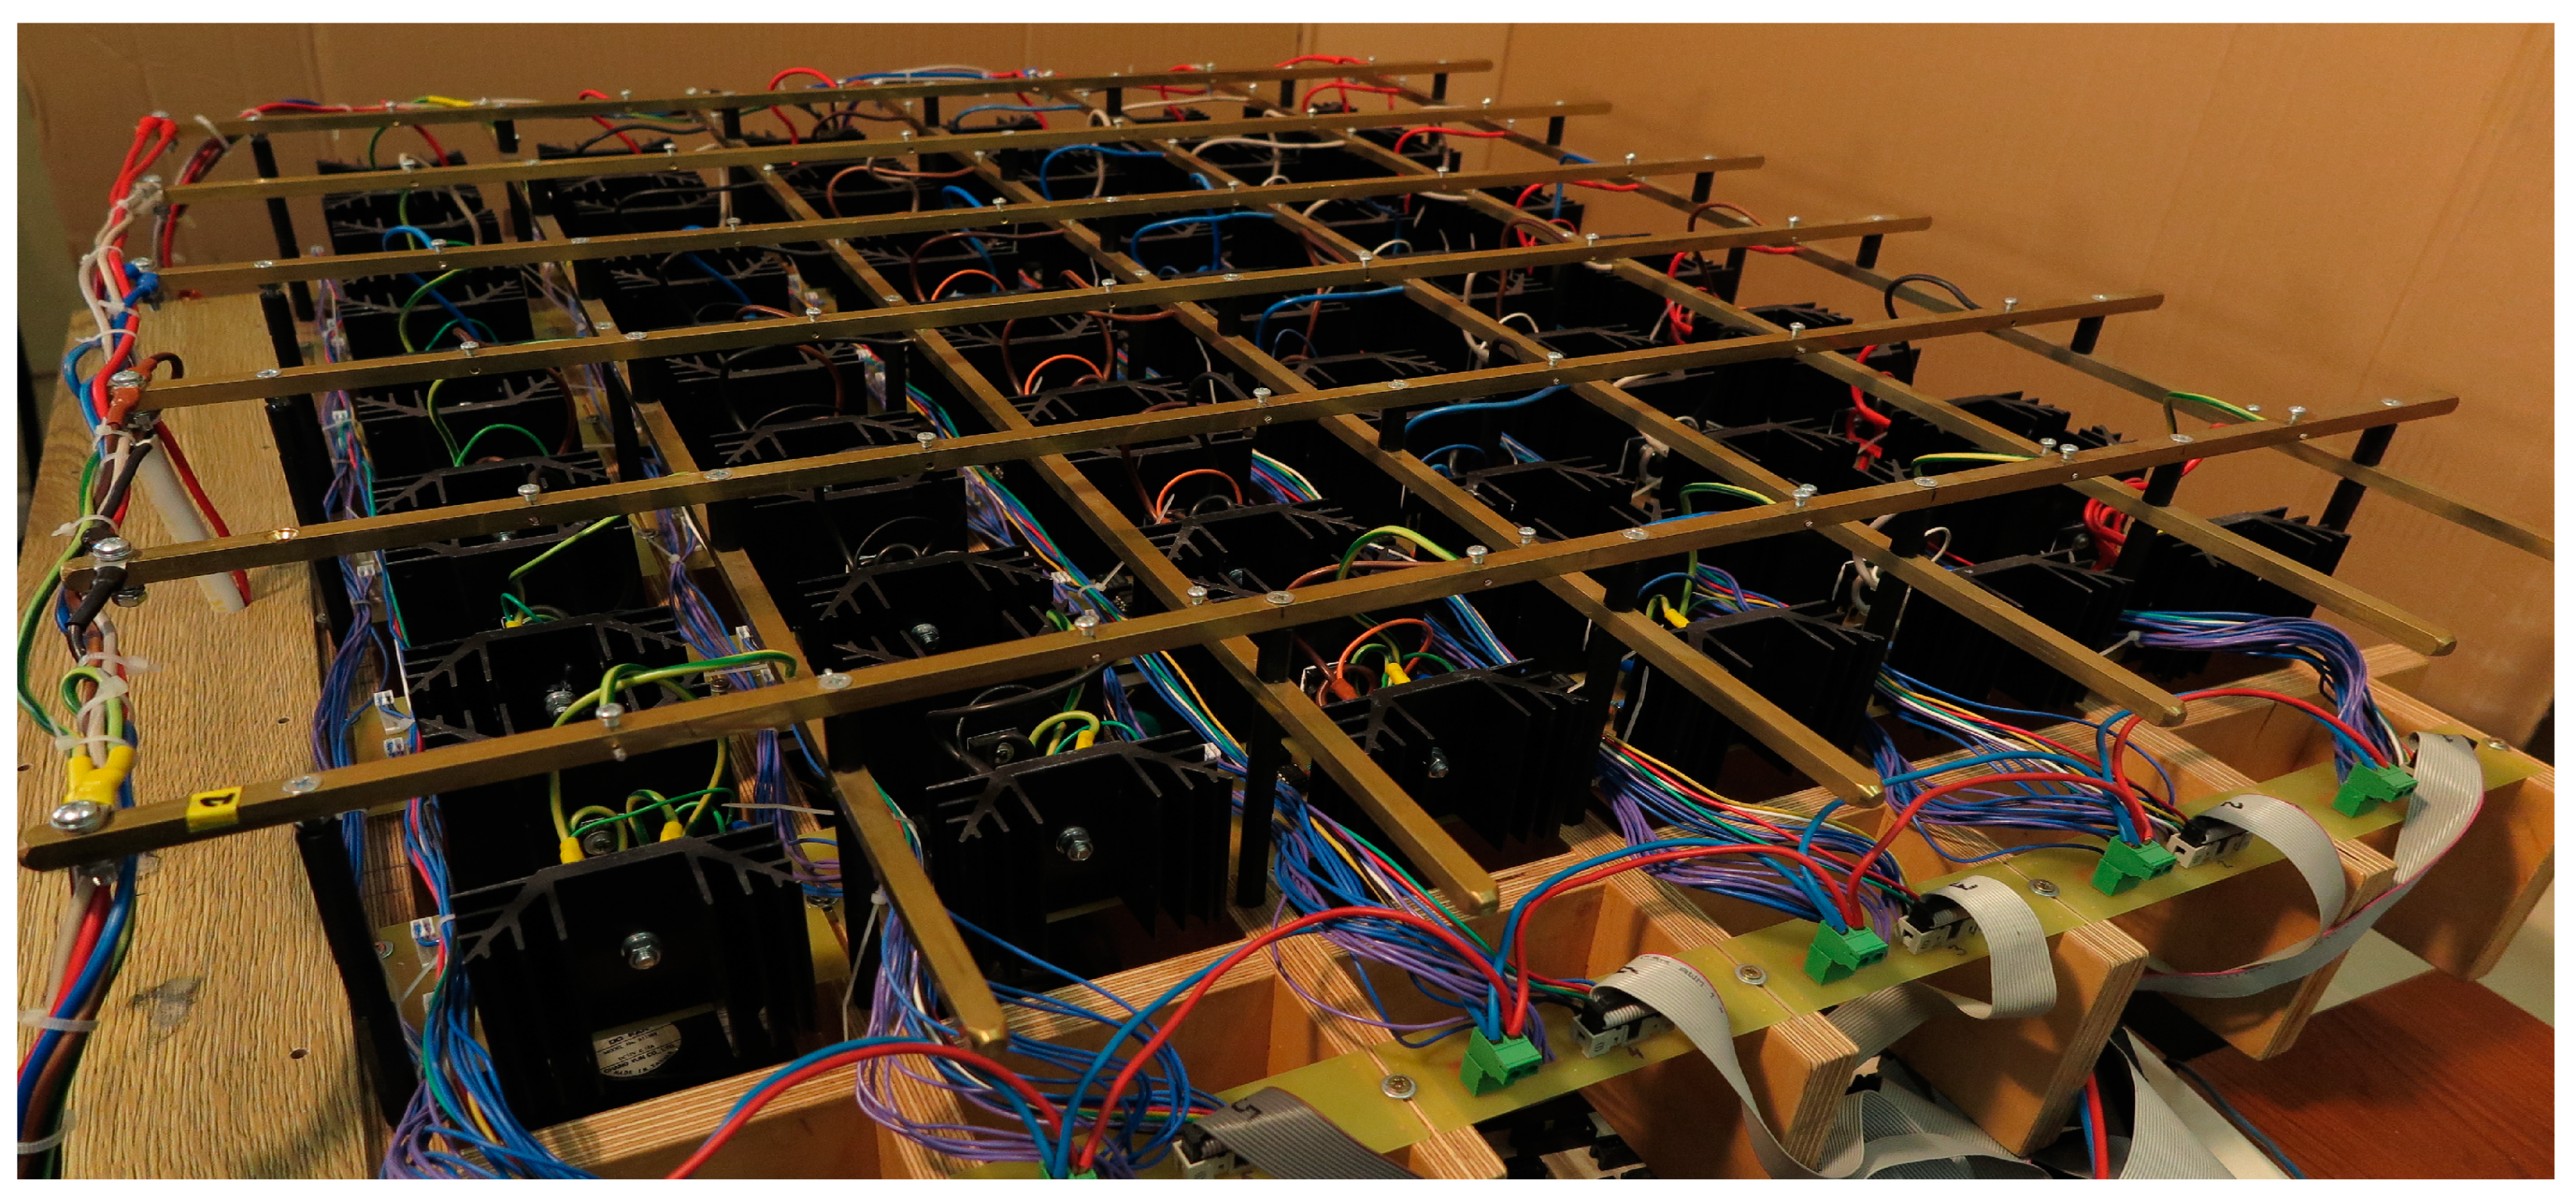
Further research comprised the development of laboratory model devices rated up to 30kVA and their microprocessor-based control boards (
Figure 4). For an area-based control, each concept of the control procedure requires different control areas (areas that determine the position of the switches between certain input and output phases). Thus, each change of the procedure is associated with the change of the map of the switches in the controller memory.
The results presenting the influence of the MC on reactive power flow were shown by measurements done directly at the terminals of the MC. The converter-based device consists of the converter itself and two 3 × 6 phases transformers: 230/110 V and 110/230 V (phase to ground voltages for common ground Y arranged windings). The load was a three-phase parallel inductive/resistive load (9 kvar and 5 kW) for nominal voltage; however, during the experiments, the voltage was lowered to about 50% of the nominal one.
4. Results
The results given by developed the MATLAB model were validated by the measurements done with a real-life laboratory model setup.
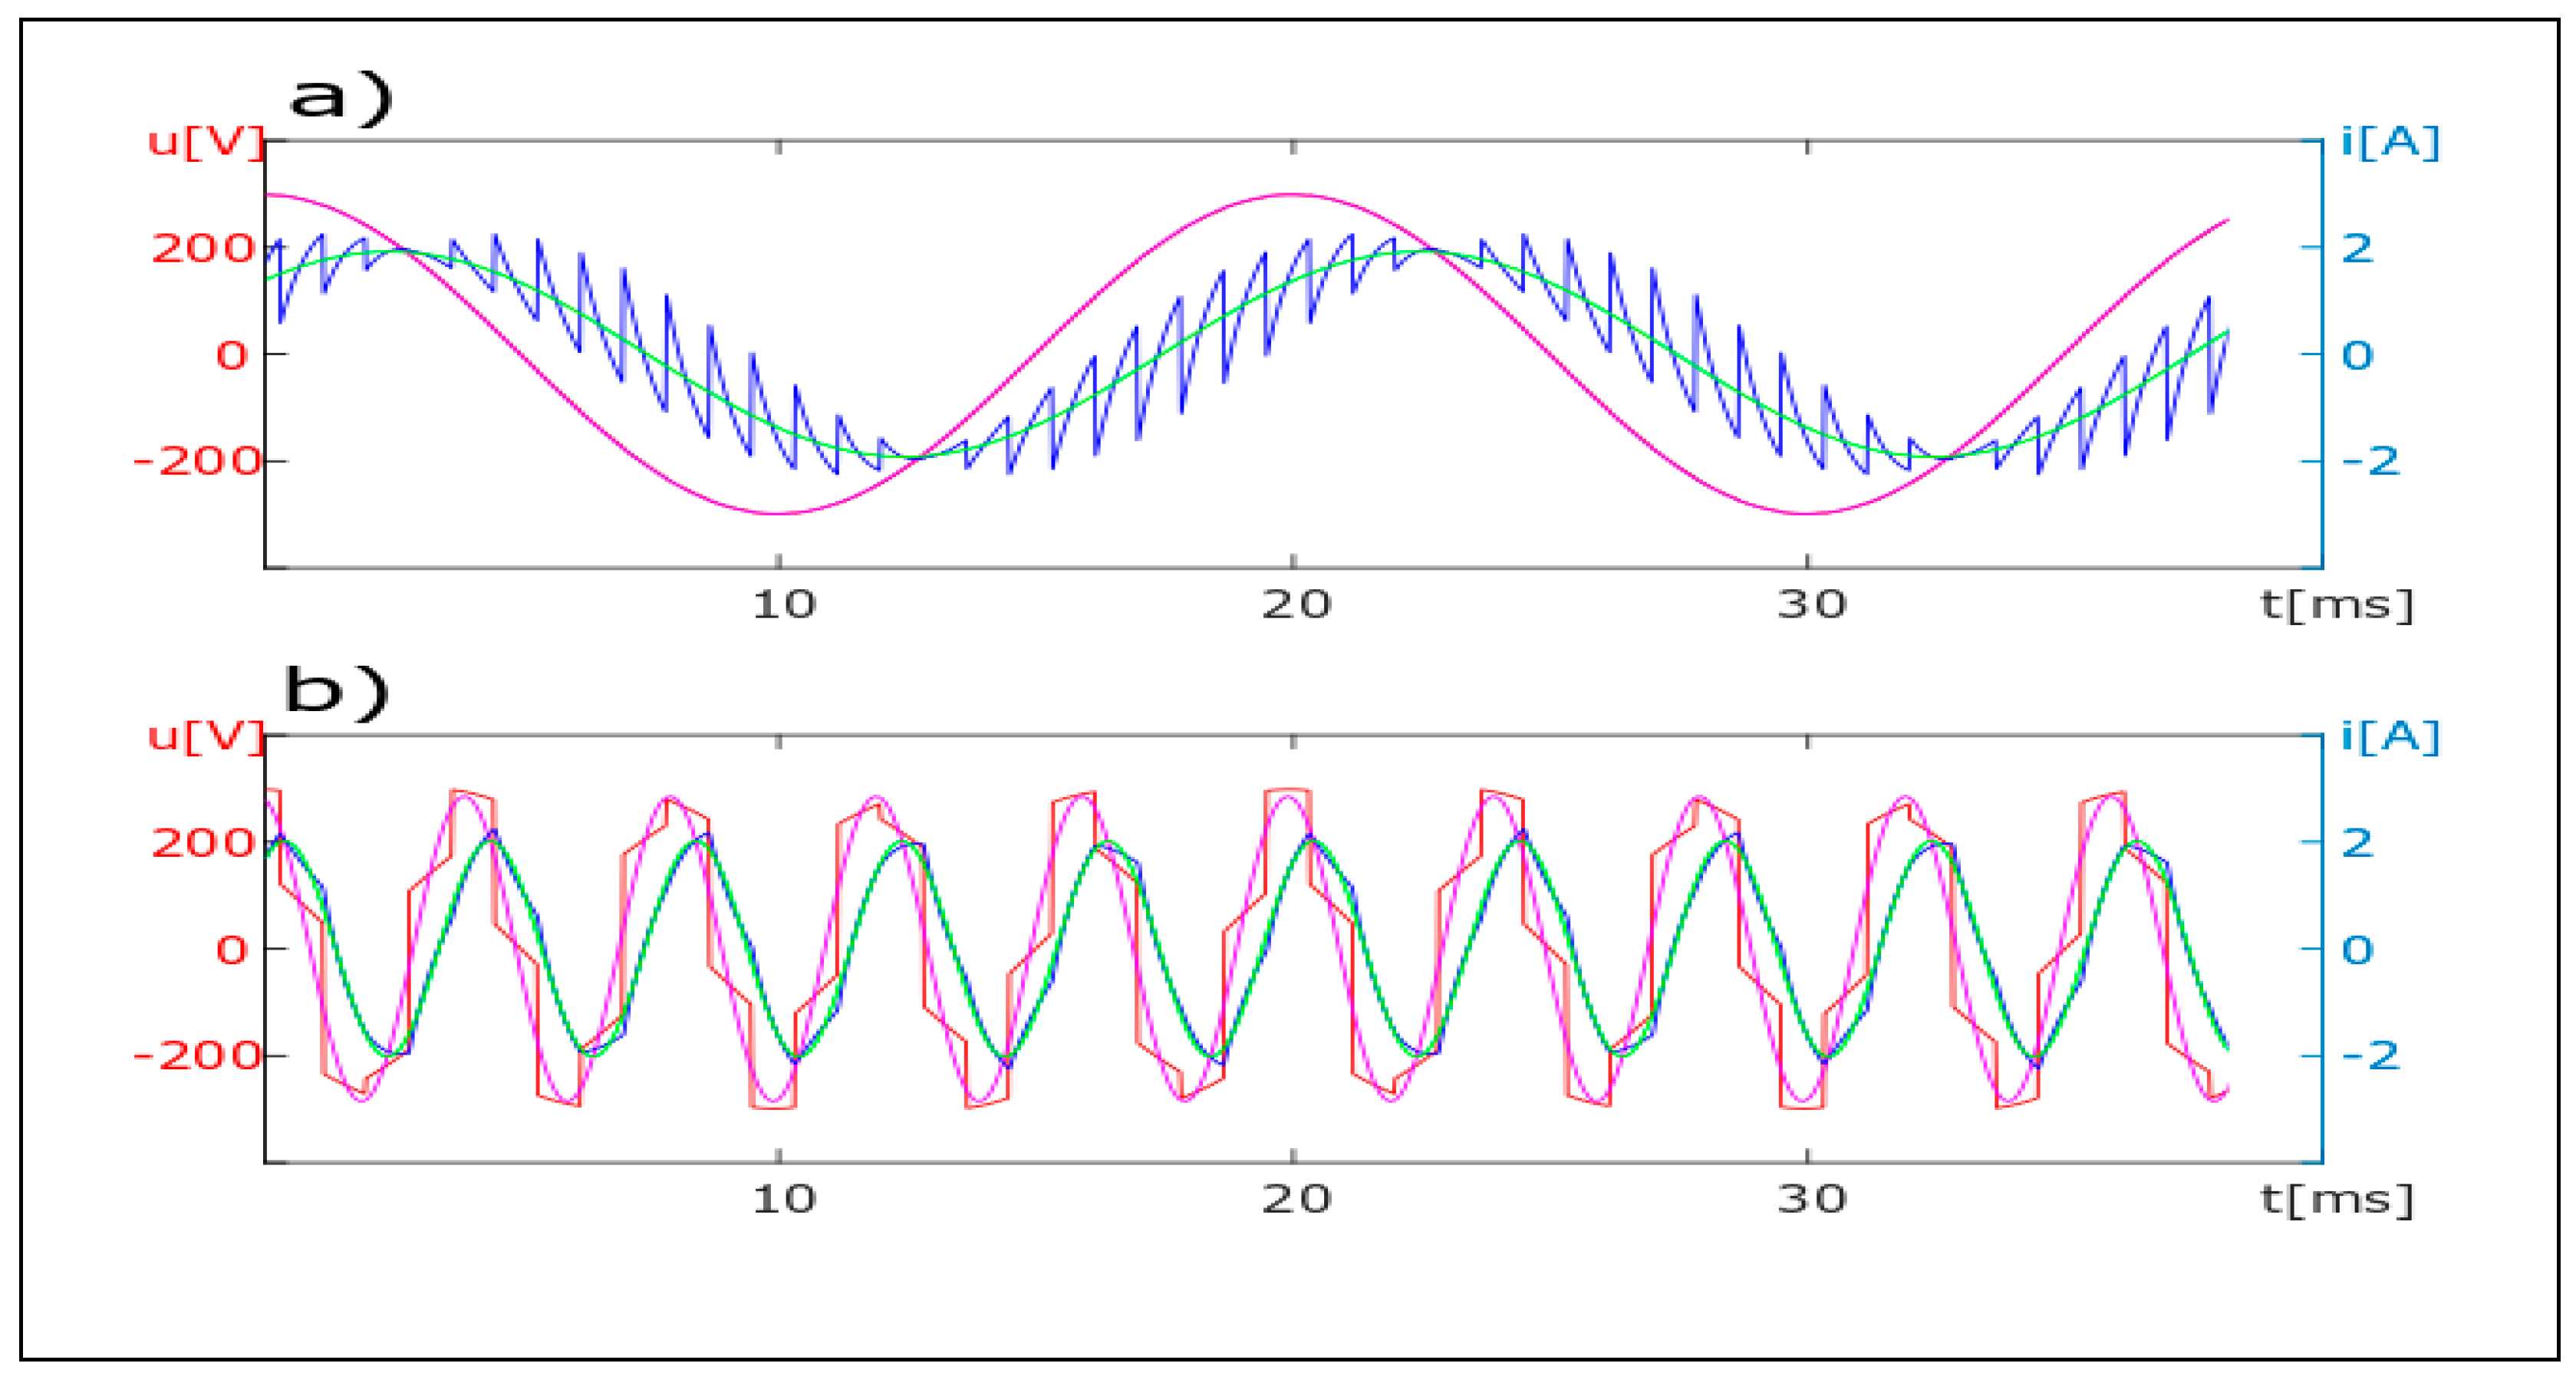
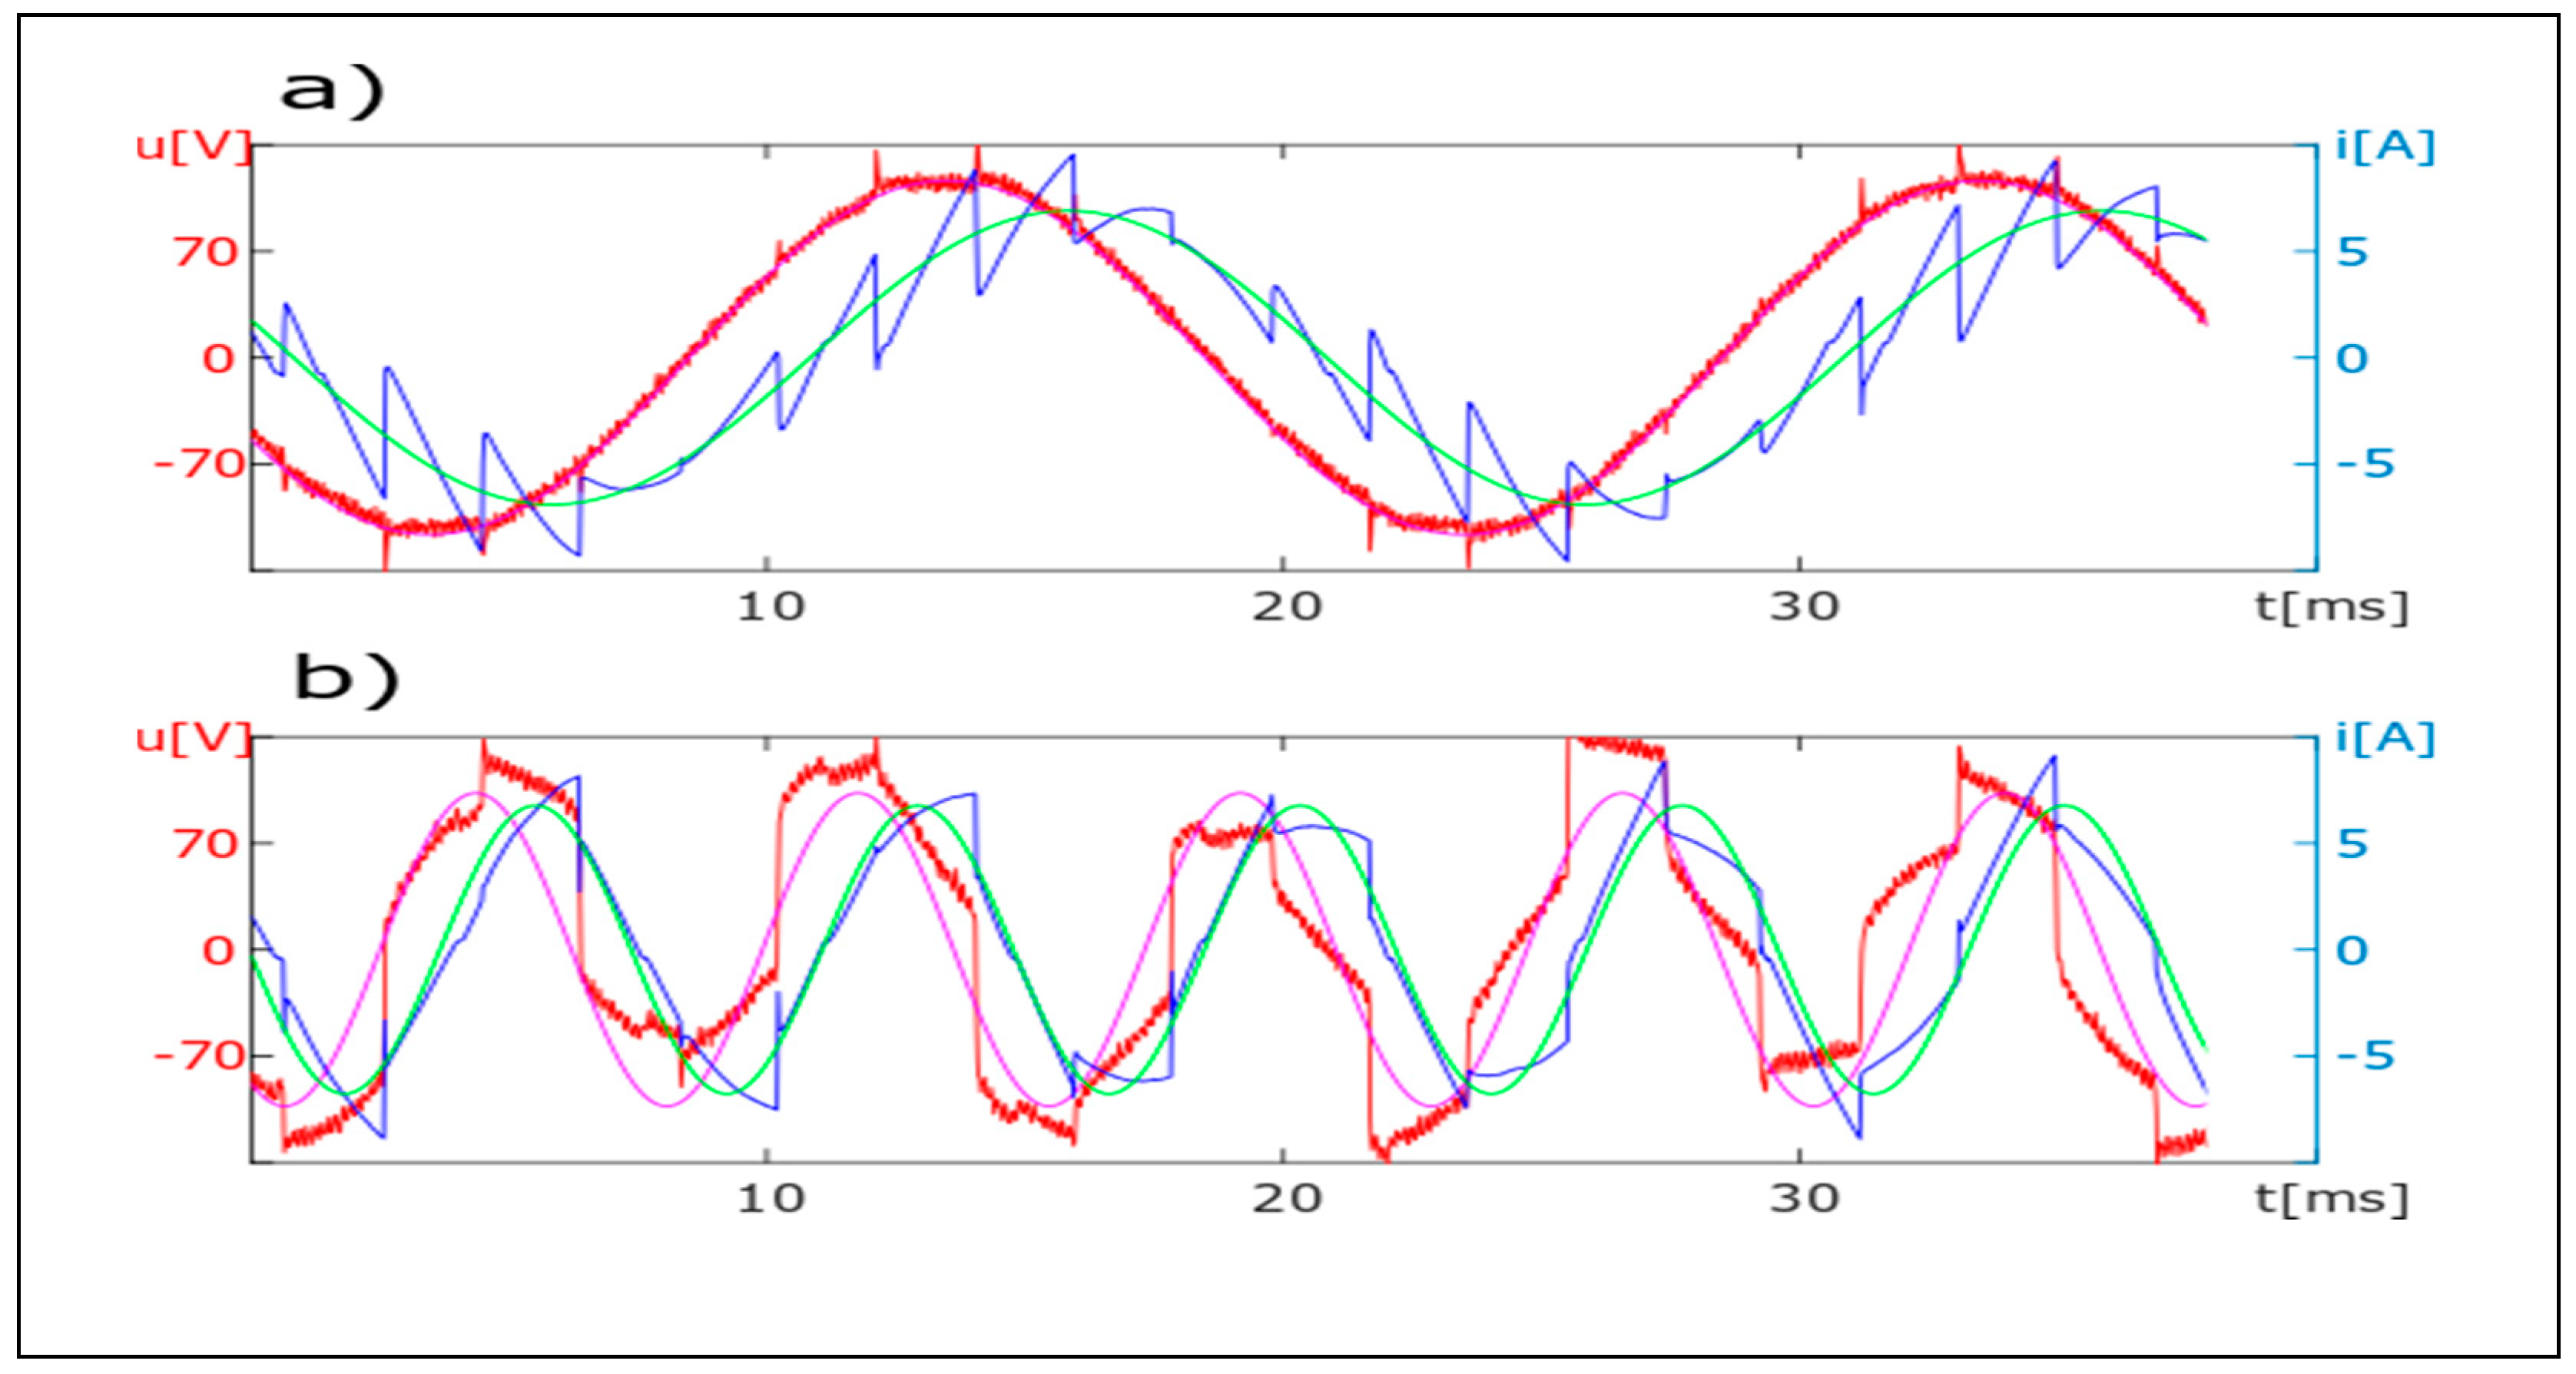
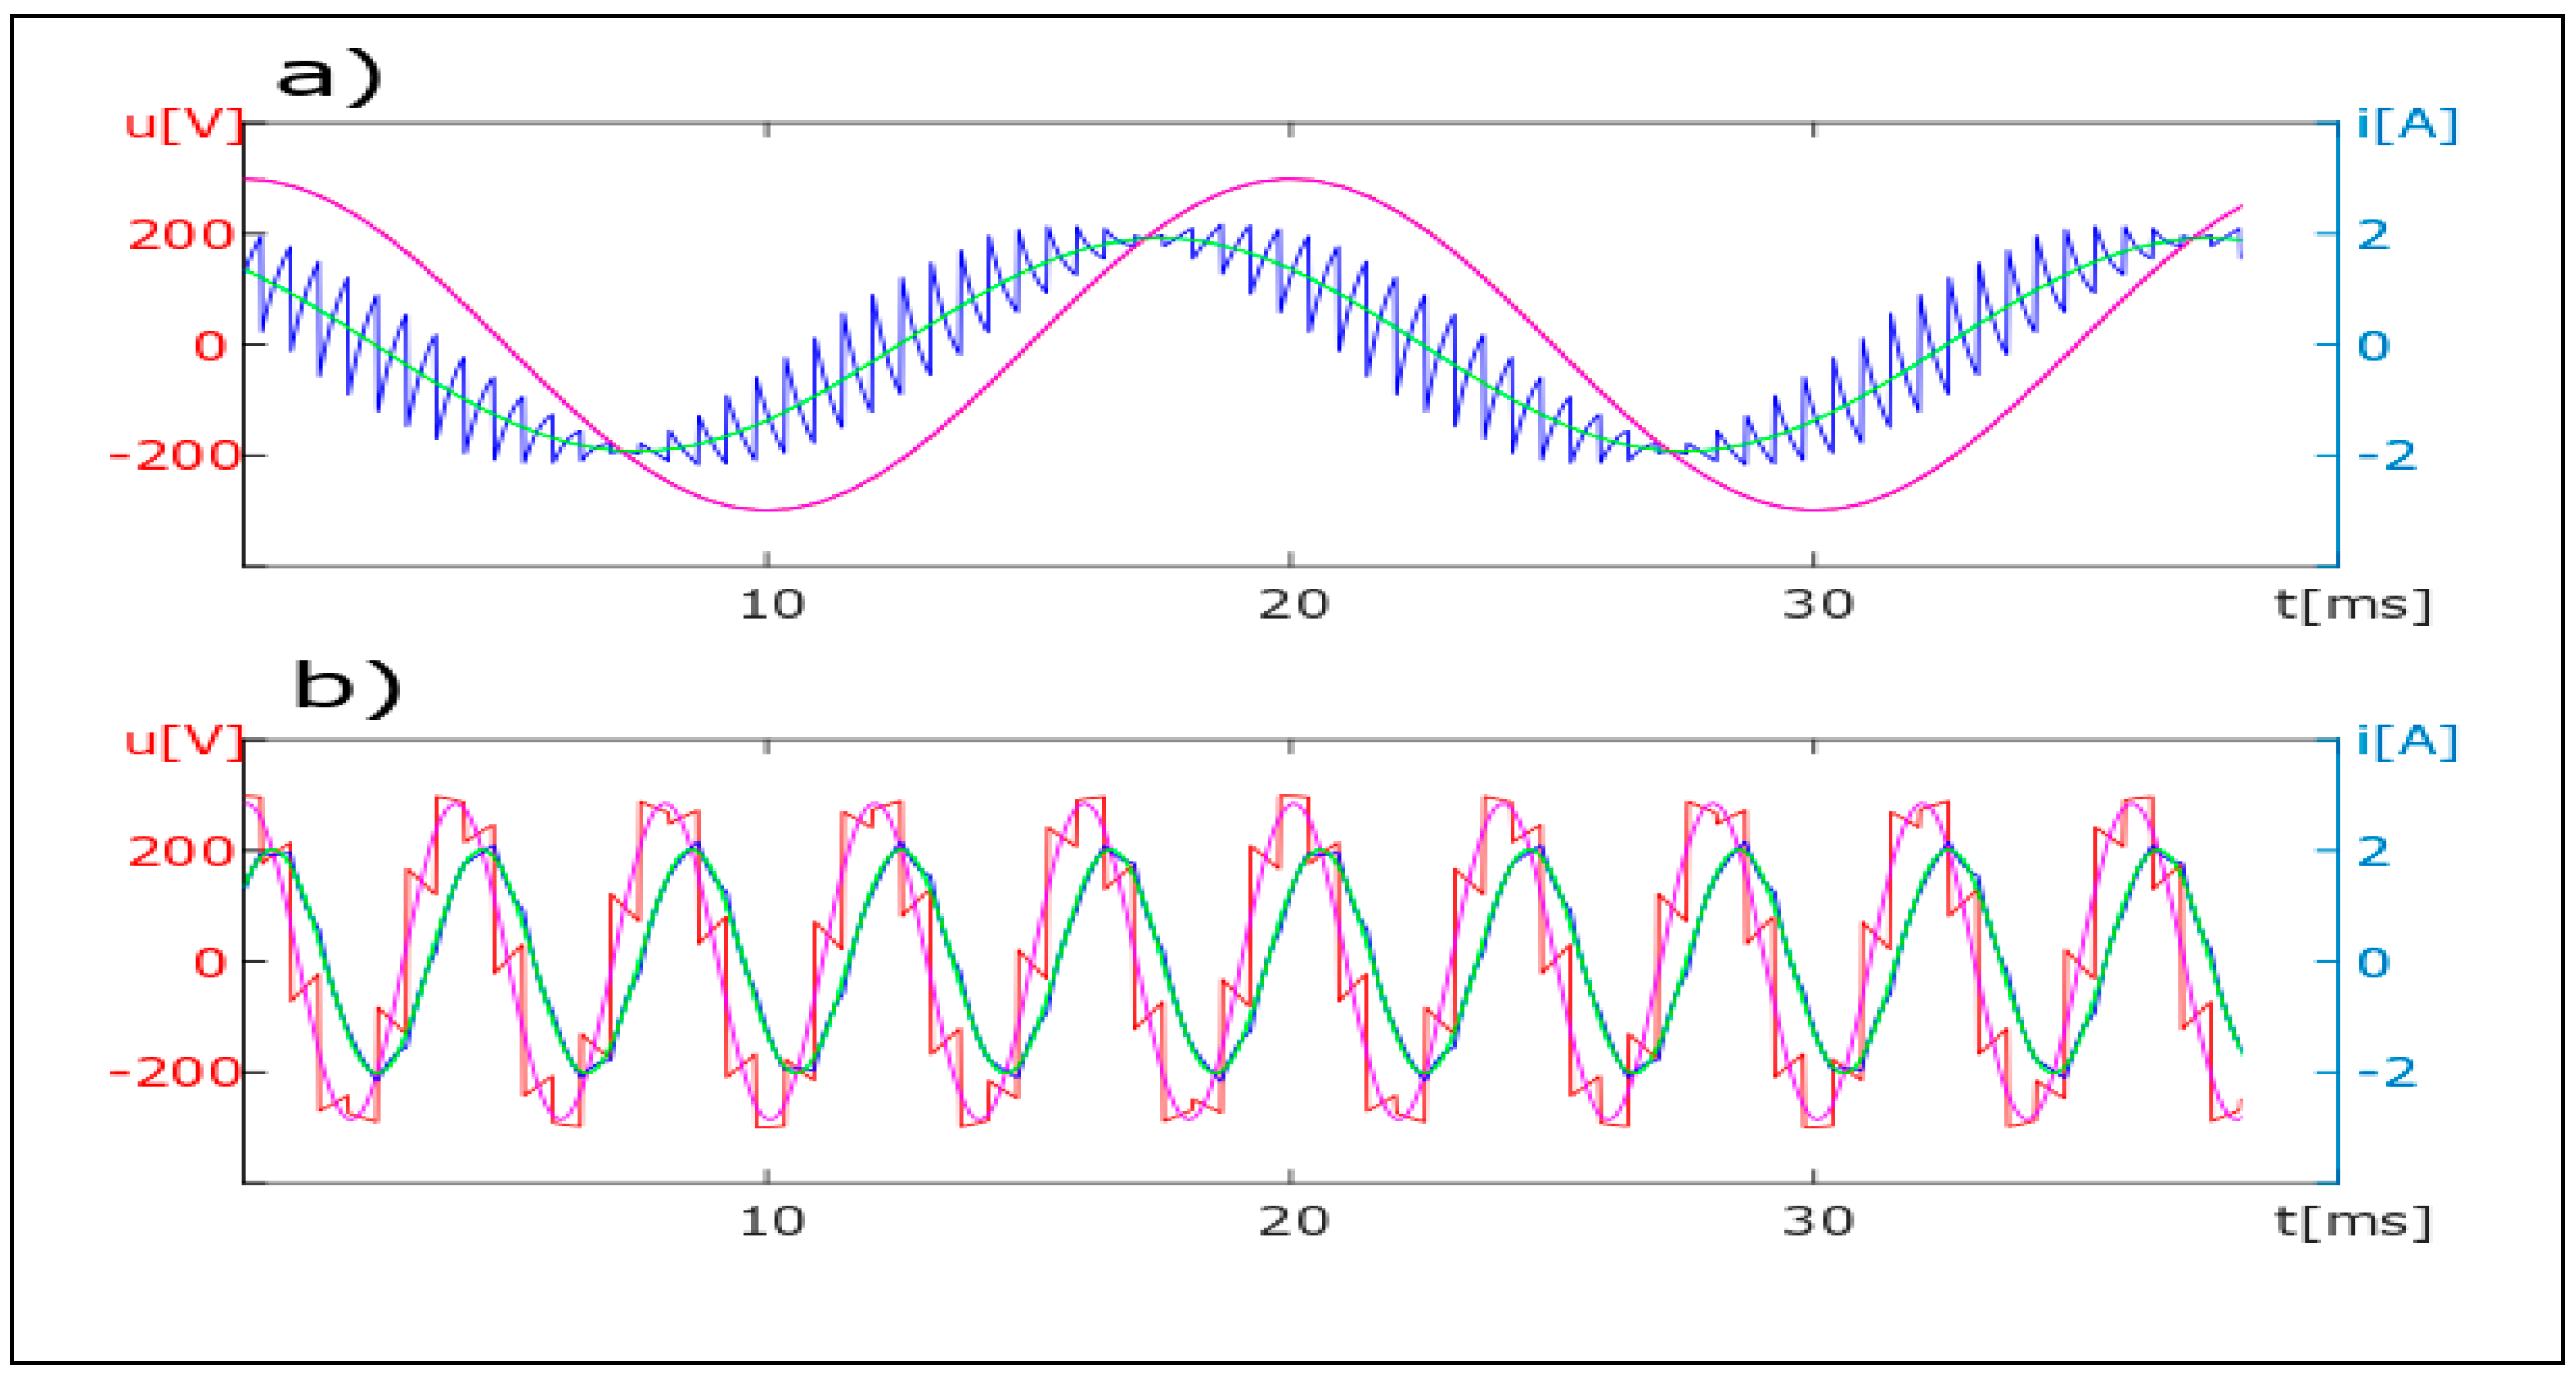
Figure 5 shows the examples of a waveform obtained from the MATLAB simulation and the waveforms in
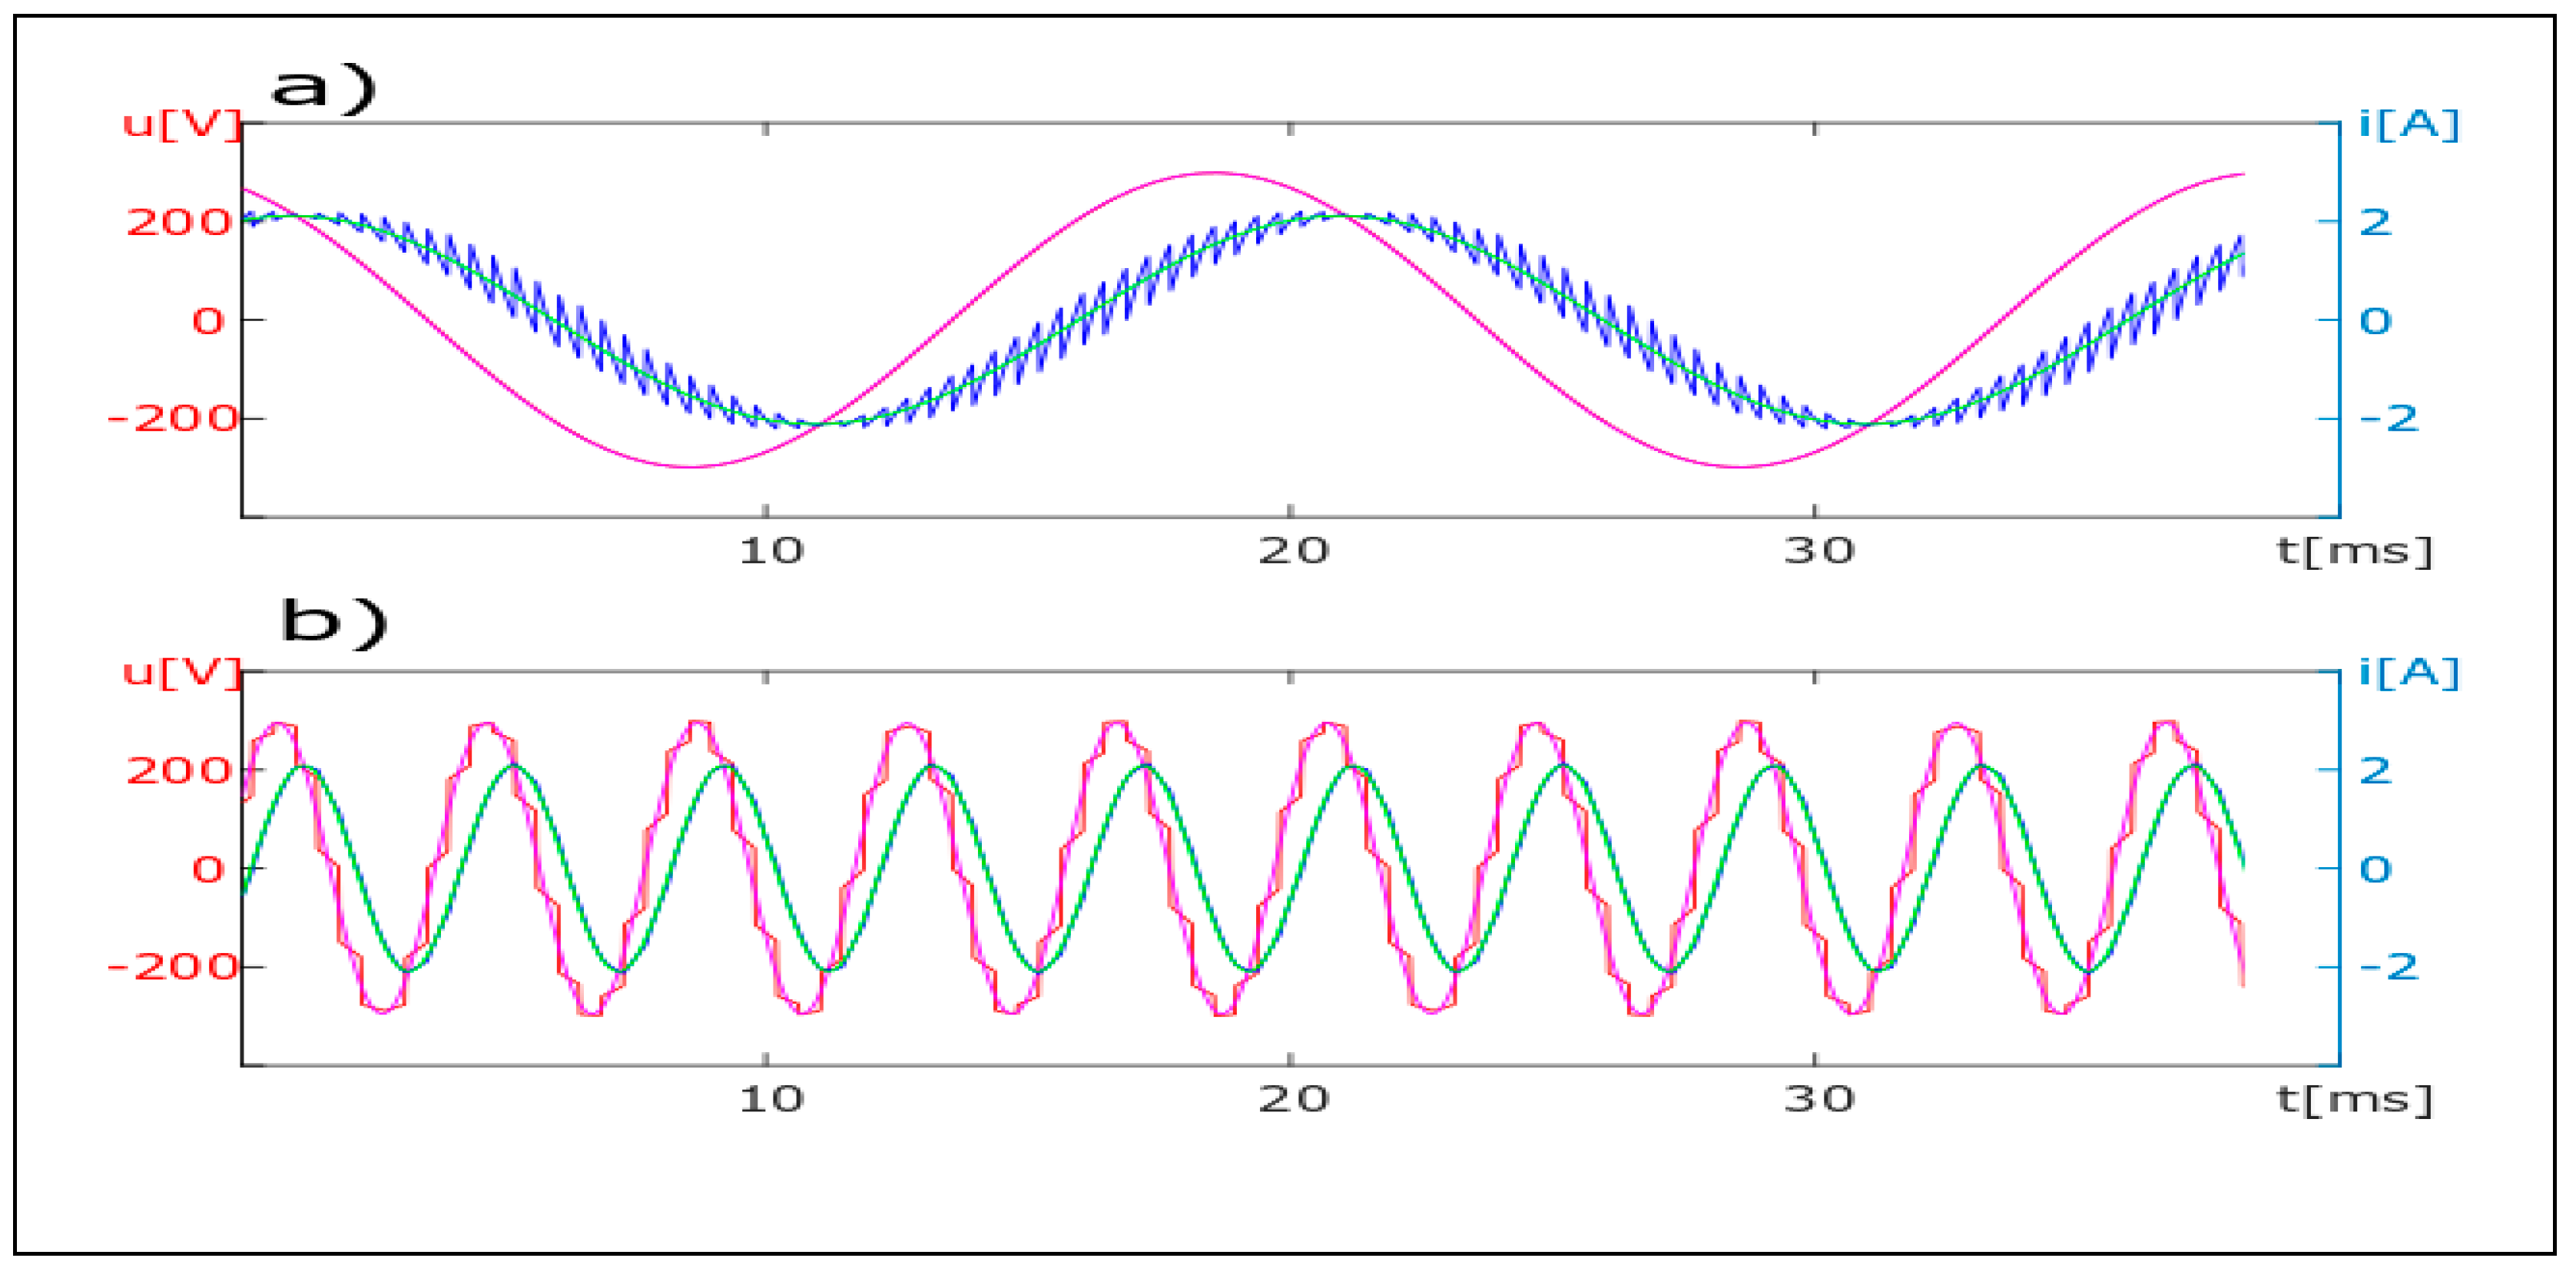
Figure 6 were obtained from the laboratory. Similarly
Figure 7 is a simulation figure and
Figure 8 is figure obtained from the lab setup.
Figure 9 was obtained from simulation for 12 × 12 MC structure.
The
Figure 5,
Figure 6,
Figure 7,
Figure 8 and
Figure 9 labeled “b” show converter output voltages and currents, which flow through the reactive component of the device. These elements were not further analyzed even if they contain high levels of harmonics (they only increase losses if an additional transformer is used at secondary of the device).
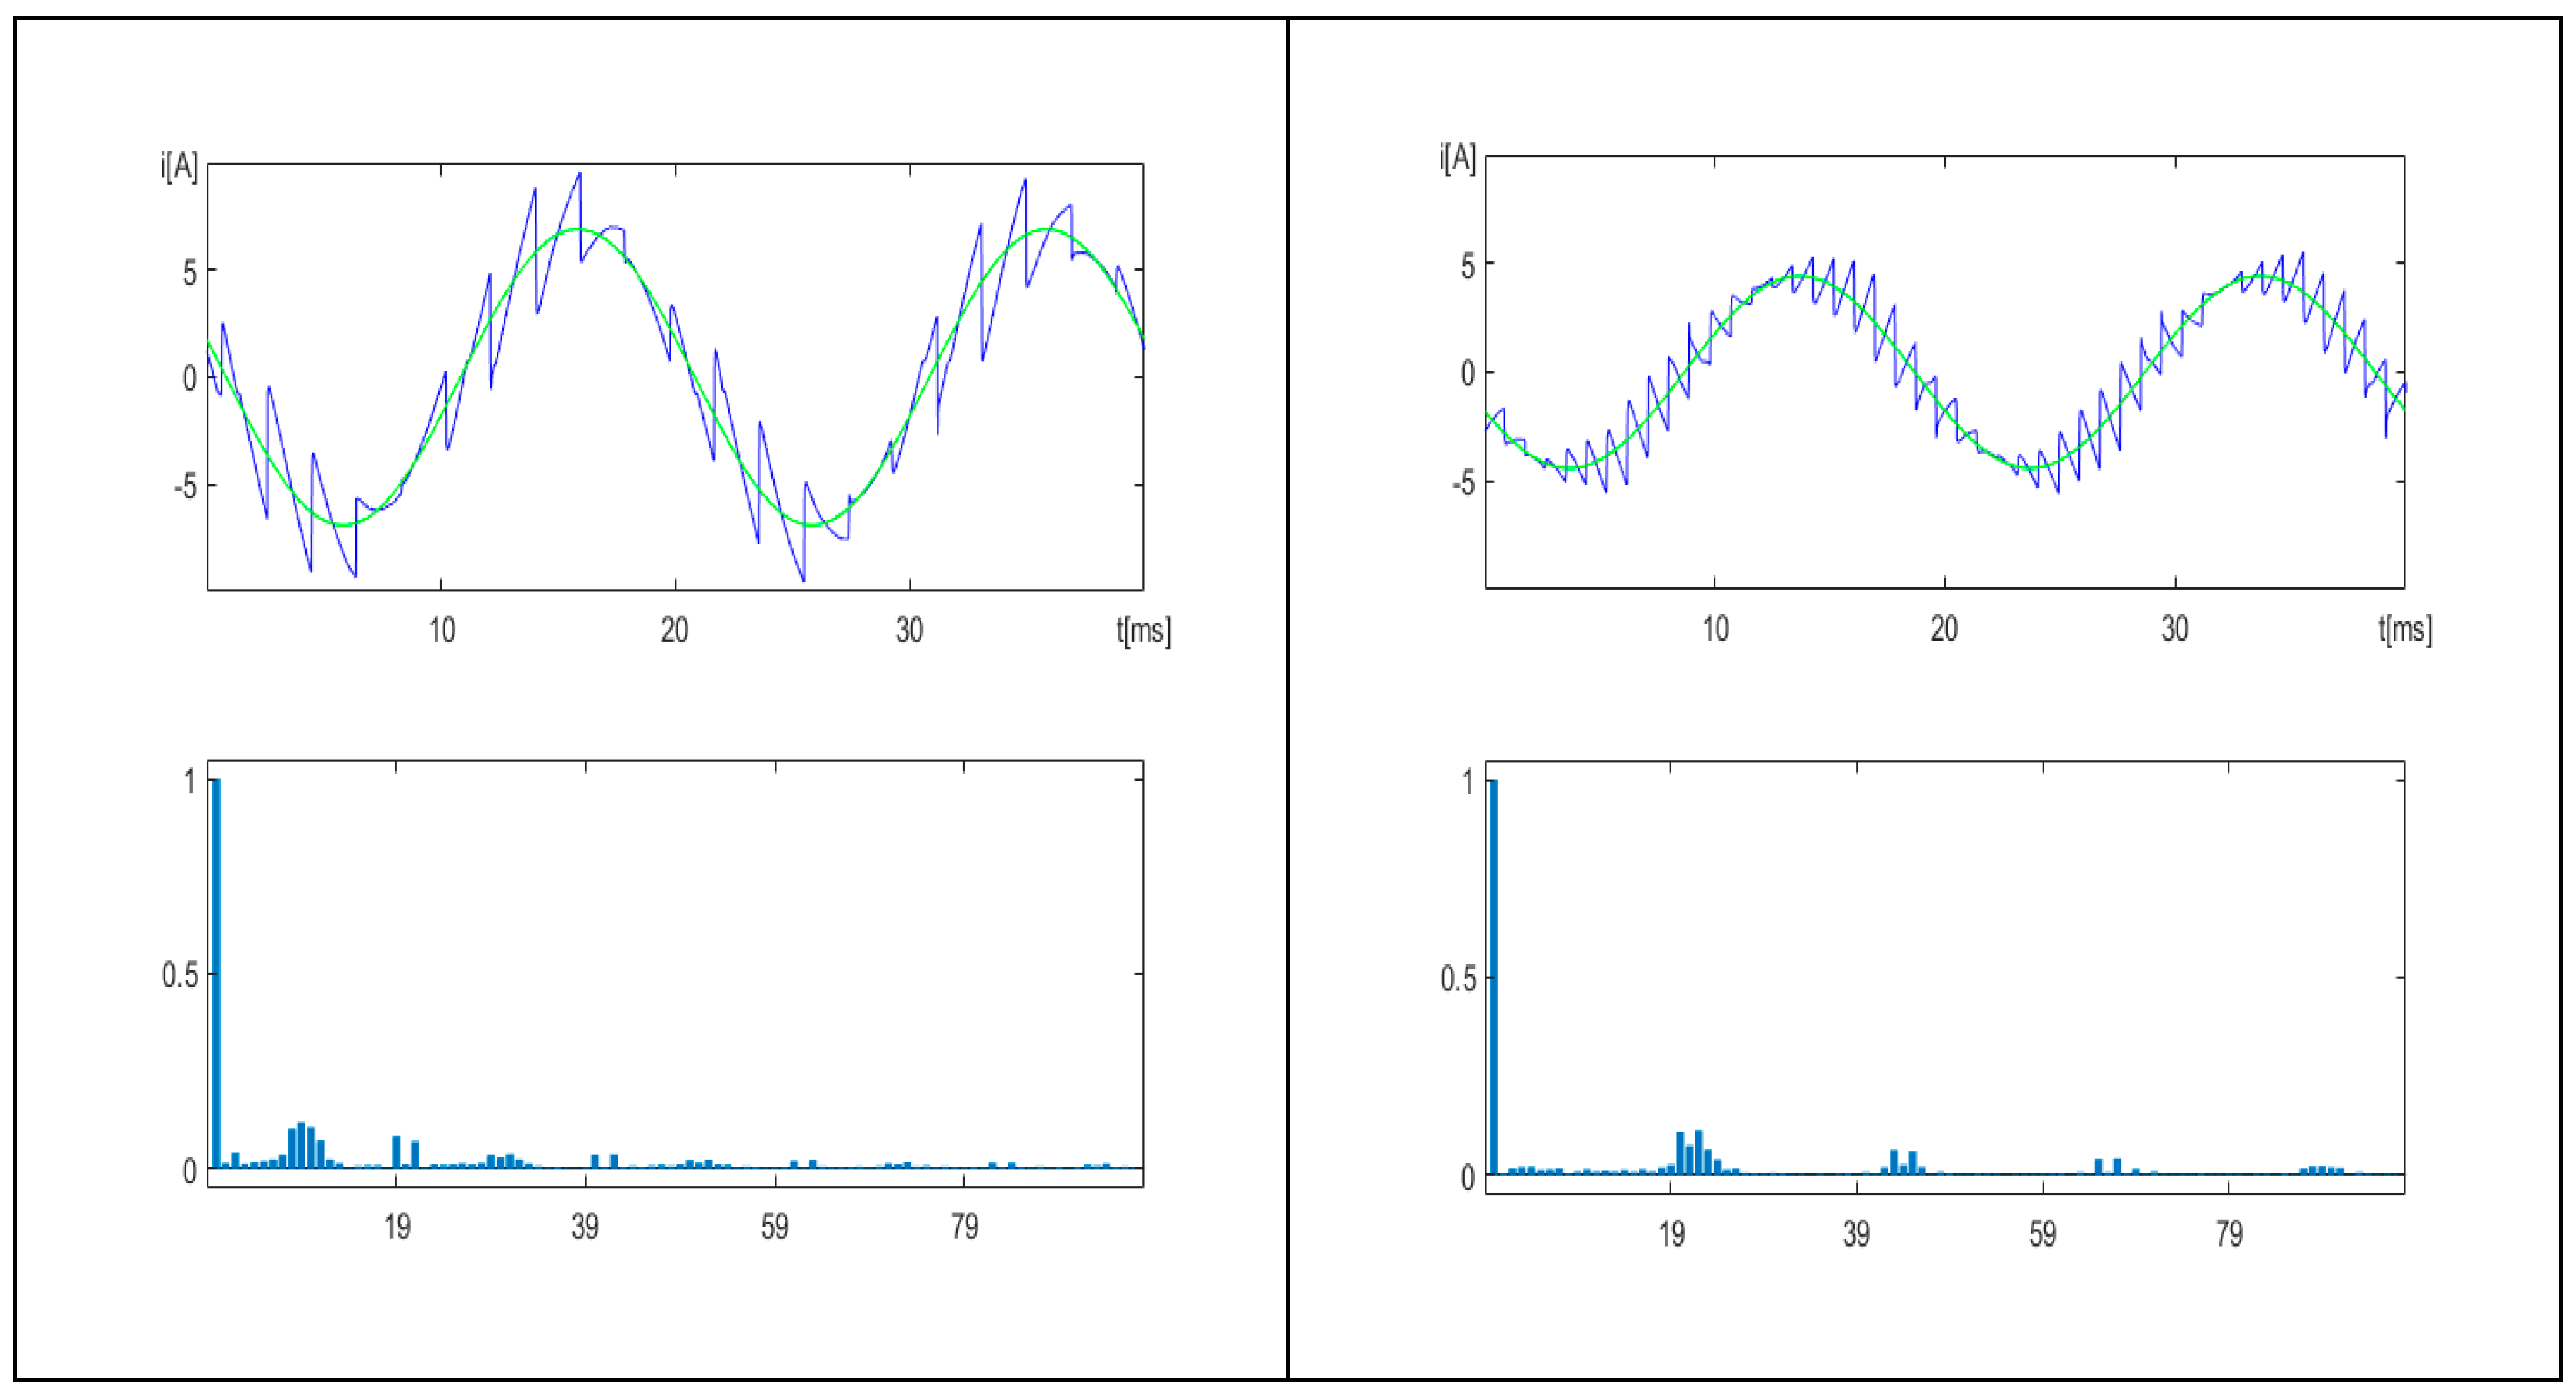
Figure 10 and
Figure 11 illustrate input currents of the proposed device for 6×6 and 12×12 MC structures and for different output frequencies.
Several hundred measurements were performed for different loads, different output frequencies and different control procedures. For the described control, two basic procedures are used: one for the creation of output from the positive sequence of input voltages only and a second for the creation of output voltage only from the negative sequence of input voltages.
Table 1 shows the influence of the applied output frequencies and the influence of the control sequence on the value of the angle shift between the input voltage and input current first harmonics. As it was expected, the change (increase) of output voltage frequency changes (increases) the value of inductive load impedance (
Figure 1), which causes the decrease of output current.
5. Discussion of the Results and Conclusions
The research on the application of the MC in HV power systems started over 10 years ago. The lack of such applications showed that the new approach to the MC and its control is needed. The MC multiphase structure and the new approach to the control system were proposed since, due to high power application, controls based on PWM methods were excluded. The multiphase structure was chosen to decrease the order of harmonics in MC input currents (similar as it is in multilevel converters). Since PWM control methods are not used, the applied control has to create output voltage from fragments of input voltages. In this paper, only one of the applications of the MC, working as part of the device able to supply reactive power to the grid, is proposed.
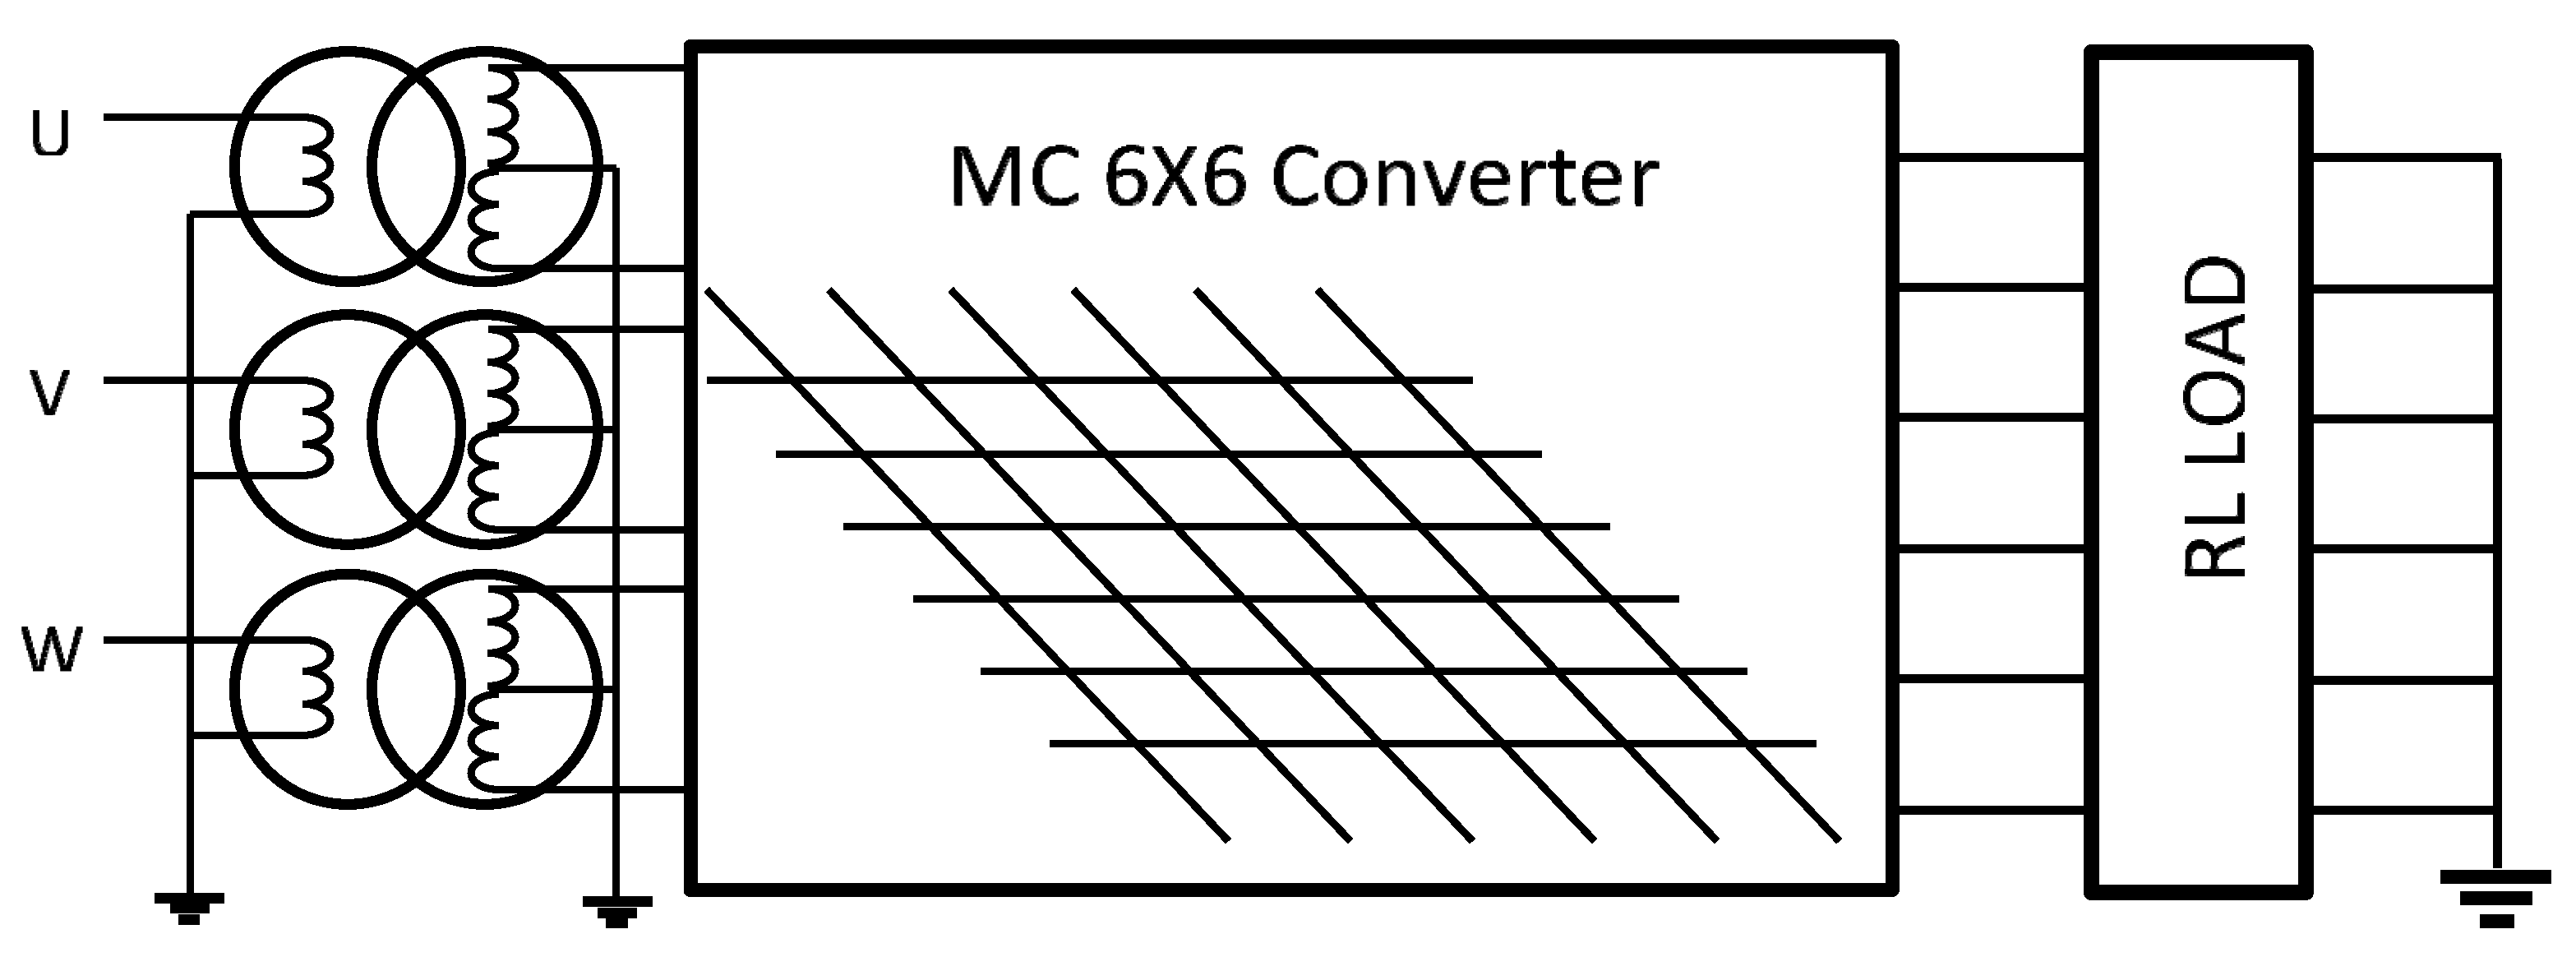
The laboratory arrangement (
Figure 1) can be further simplified and instead of a secondary transformer and three-phase load, the six-phase star connected, symmetrical and constant inductive load can be applied (
Figure 12). This will decrease the cost of the real device and substantially increase device efficiency since, at the device output, one can expect a variable frequency and current distortion that increases secondary transformer losses.
The change of the angle between the first harmonic of the device input current and the first harmonic of the input voltage depends mainly on the proposed MC control procedures. Several of such procedures based on the “intuitive” matrix control—“as close as possible”, “one periodical” or “two closest”—were investigated. The names of the control procedures indicate how the output voltage of the MC is created from fragments of the input voltage. In this research, only the “one periodical” control algorithm was taken into consideration as control of a matrix-converter-based device.
The analysis of the MC work was based firstly on the symmetrical components model simulated for first harmonic only. The application of the symmetrical component transformation for device modeling allowed the simple analysis of phenomena occurring in the MC during its work under the “one periodical” control. As mentioned before, the control procedure uses only a single sequence (positive or negative) of input voltage to build output voltage; thus, the load-driven secondary current contains only a positive or negative sequence. The ties introduced by the MC (Formula (1)) cause the input current to be very close to the sinusoidal waveform, which can be noticed from
Figure 5,
Figure 6,
Figure 7,
Figure 8,
Figure 9,
Figure 10 and
Figure 11. It is clearly visible that for the 6 × 6 MC structure, and when the output frequency is higher than the input frequency, the input current includes harmonics of the order grouped around multiple sixth harmonic. The harmonic content of the input current depends not only on the converter structure, but also on the secondary frequency (input frequency is considered constant 50 Hz).
The full model of the converter, derived earlier by authors, based on the harmonic and space decomposition, can give results closer to reality; however, it is more complicated, requires extra computation time and the results are not easy to understand and interpret. The results and conclusion given by the symmetrical component model were further validated using the model build in MATLAB Simulink and using standard Simulink blocks and S-function as a control block.
For the positive control sequence, the inductive load at the device output terminal is visible as the inductive load from the supply side. When the control algorithm operates using a negative sequence, the inductive output load is visible from the grid as capacitance. Thus, the change of the control sequence changes the character of the reactive power flow.
The value of reactive input power is altered, changing the output frequency, which changes the output reactive power consumption. The derived control algorithm allows the development of the MC-based compensation devices operating on a different principle than the ones presented in the literature.
In the end, simulation results were validated using the laboratory model of the MC operating on inductive load and working from an external power supply system.
Of course, there are some application issues regarding the harmonic distortion of the device input current. The order and value of harmonics changes during device operation, which complicates the construction of the filters (probably the application of active filters will be necessary).
The presented 6 × 6 MC control system operates the switches in such a way that only six switches are switched “on” at the same time and each switch operates at one-sixth of the input voltage period. This allows decreasing the rating of the switches compared to the 3 × 3 matrix structures.
The functionality of the application of the proposed MC-based device can be compared to the functionality of STATCOM, but it is really difficult to judge the pros and cons of the proposed device without application in a real system. The developed MC-based apparatus can be treated as an HV power system variable reactive load. The benefits of the application of such a device in the power grid will be node voltage control via the reactive power flow or HV supply line power flow optimization (limit of line losses). When the line is heavily loaded and an increase of voltage is needed, or where the line is slightly loaded and its own capacitance causes the increase of voltage to reach high levels at the line end, then the proposed device can be used to control the line voltage.
6. Patents Associated to the Research
Granted:
Polish title: Sposób kompensacji mocy biernej i urządzenie do kompensacji mocy biernej
English title: Method for wattless power compensation and the device for wattless power compensation
Number of claim: 408817
Date of submission: 2014-07-11
(11) Exclusive right number: 231305
Authors:
| SIEŃKO TOMASZ |
| SZCZEPANIK JERZY |
| HUDYM WASYL |
Patent procedure pending:
Polish title: Sposób regulacji impedancji linii i urządzenie do regulacji impedancji linii
English title: Method for adjustment of the line impedance and the device for the adjustment
of the line impedance
Number of claim: 419709
Date of submission: 2016-12-07
Authors:
| SIEŃKO TOMASZ |
| SZCZEPANIK JERZY |

