Article

Optimization of Cold Pressing Process Parameters of Chopped Corn Straws for Fuel

1
School of Biological and Agricultural Engineering, Jilin University, Changchun 130022, China
2
Key Laboratory of Bionic Engineering, Ministry of Education, Jilin University, Changchun 130022, China
3
College of Engineering, Shenyang Agricultural University, Shenyang 110866, China
*
Author to whom correspondence should be addressed.
Energies 2020, 13(3), 652; https://doi.org/10.3390/en13030652
Submission received: 24 December 2019 / Revised: 24 January 2020 / Accepted: 30 January 2020 / Published: 4 February 2020
(This article belongs to the Special Issue Optimal Design and Operation of Sustainable Energy Systems)

Abstract

:
Pressed condensation is a key process before the reclamation of loose corn straws. In this study, the effects of stabilization time on the relaxation density and dimensional stability of corn straws were studied firstly, and then the stabilization time was determined to be 60 s by comprehensively considering the compression effect, energy consumption, efficiency and significance. On this basis, the effects of the water content (12%, 15%, 18%), ratio of pressure maintenance time to stabilization time (0, 0.5, 1), maximum compression stress (60.4, 120.8, 181.2 kPa) and feeding mass (2.5, 3, 3.5 kg) on the relaxation density, dimensional stability coefficient, and specific energy consumption of post-compression straw blocks were investigated by the Box–Behnken design. It was found that the water content, ratio of pressure maintenance time to stabilization time, maximum compression stress, and feeding mass all very significantly affected the relaxation density, dimensional stability coefficient and specific energy consumption. The interaction between water content and maximum compression stress significantly affected both relaxation density and specific energy consumption. The interaction between the ratio of pressure maintenance time to stabilization time and feeding mass significantly affected the dimensional stability coefficient. The factors and the indices were regressed by quadratic equations, with the coefficients of determination larger than 0.97 in all equations. The optimized process parameters were water content of 13.63%, pressure maintenance time of 22.8 s, strain maintenance time of 37.2 s, maximum compression stress of 109.58 kPa, and raw material feeding mass of 3.5 kg. Under these conditions, the relaxation density of cold-pressed straw blocks was 145.63 kg/m3, the dimensional stability coefficient was 86.89%, and specific energy consumption was 245.78 J/kg. The errors between test results and predicted results were less than 2%. The low calorific value of cold-pressed chopped corn straw blocks was 12.8 MJ/kg. Through the situational analysis method based on the internal and external competition environments and competition conditions (SWOT analysis method), the cold-pressed chopped corn straw blocks consumed the lowest forming energy consumption than other forming methods and, thus, are feasible for heating by farmers. Our findings may provide a reference for corn straw bundling, cold-press forming processes and straw bale re-compressing.

1. Introduction

Economic growth relies on a continuous energy supply, but the energy demands are increasingly accelerated. Thus, energy supply should be sustainably adjusted so as to maintain the balance of nation-wide energy demand and to meet the energy demands [1]. Straws are a major type of renewable biomass resource with an annual global yield of over two billion tons, and the yield in China exceeds 0.9 billion tons [2], of which one third comes from corn straws [3]. However, due to the looseness, low density and strong seasonality, the reclamation and utilization rates of straws are very low [4]. On-field burning of straws is very common, which leads to the emission of particles and harmful gases and will induce severe air pollution. Such consequences will not only cause environmental pollution, but also have resulted in the waste of biomass resources [5]. To reduce transport, storage and utilization costs, it is required that straws should be condensed and formed into blocks [6,7], which will meet the power demand by cooking and warming, especially in rural areas [8]. Compared with coals, the burning of straw blocks causes fewer costs and emits less SO2, CO2 and soot, and thus will bring economic and environmental benefits [9]. Thus, straw condensation and forming will create a friendly relationship between biomass resources and the environment and satisfies the need for sustainable energy development.
Corn straws are viscoelastic materials [10,11]. To relieve the post-compression rebounding and to enlarge the dimensional stability coefficient of pressed straws, thereby increasing the straw compression efficiency, workers should apply the stabilization process, such as pressure maintenance or strain maintenance [12,13,14]. The dimensional stability coefficient after days of placement was studied after post-compression biomass departed from the compression module, and the pressure maintenance time significantly affected the dimensional stability of post-compression straws. As the pressure maintenance time was prolonged, the pressed density of biomass and the durability of blocks increased accordingly, and the energy consumption due to compression also increased [15]. With corn straw carbon as the raw material, Chen et al. [16] studied the effects of pressure maintenance on the dimensional stability at three days after removal from the mould and found that the dimensional stability first increased, then decreased slightly and finally stabilized with the prolonging of pressure maintenance time. Li at al. [17] observed that the higher the holding pressure time, the lower the expansion rate. The 5% increase in the relaxed density was observed when the briquette was held in a compressed condition for 10 s, but the influence on the relaxed density decreased significantly when the holding time increased to more than 20 s. With wood chips as the raw material at the water content of 11.25% and pressure of 100 MPa, Panwaret al. [18] studied the effect of pressure maintenance time (0–60 s) on the wood chip densities at 2 min or 24 h after unloading from dies. It was found that the densities increased by 14% at the pressure maintenance time of 10 s but did not significantly change with the further prolonging of pressure maintenance time. Zhang et al. [19] studied the effects of pressure maintenance time on compressing characteristics of wheat straws and found pressure maintenance time had no significant effect on the fuel and compressing characteristics. To avoid the rebounding of post-pressing straws, Henrikssonet al. [20] adopted the pressure maintenance time of 10 s, and Stasiak, Said and Mani et al. [21,22,23] set it at 60 s, but no criterion is available for the determination of pressure maintenance time. As for stabilization after strain maintenance, the existing research only reports that strain maintenance can avoid straw rebounding after pressing and improve the density of straw blocks. However, there is no detailed research about the effects of strain maintenance on the compression result [13]. Kashaninejad et al. [24] proposed that the stress maintenance time to avoid the rebounding of post-pressing straws was 60 s. Gong et al. [25] cited the stabilization process and parameters suggested by Kashaninejad. Moreover, Lu et al. [26] also adopted the stress maintenance time of 60 s to prevent post-pressing straws from rebounding, but Tumuluru et al. [27] selected the stress maintenance time of 30 ± 2 s. However, none of the above studies presented any criterion to determine the stress maintenance time. Some studies even did not mention the stabilization means or parameters.
The quality of straw compression and forming is affected by multiple factors, such as water content, compression force, straw feeding mass, straw granularity, temperature, and compression speed [28,29,30]. The indices of straw compression and forming include straw block density, dimensional stability and specific energy consumption of compression [24,31,32]. With crushed corn straws as raw material, Mani et al. [33] studied the straw blocks after low-water-content (5–10% w.b) and high-water-content (15% w.b) compression, and found the straw blocks under low water content were tighter, more stable and more durable, but the straw blocks pressed under high water content and high pressure were less qualified [34]. As the compression force was enlarged, the density of formed blocks increased, but the energy consumption due to compression increased accordingly [24]. Decreasing the straw particle size will help to increase the density of pressed condensation, but the use costs will significantly increase [35,36]. Yan et al. [37] studied the straw blocks made from rice wheat or corn straws and found the residual stress maximized at the largest feeding mass, but the residual stress at the lowest feeding mass was not the smallest, and optimal values were yet found at medium levels. Jayakumaret al. [38] studied the effects of the pretreatment process on the pressing characteristics and quality of rice husk pellets and found microwaves positively impacted the quality of pellets along with NaOH treatments in the production of rice husk pellets. Okot et al. [39] investigated the effects of pressure (100–250 MPa), temperature (20–80 °C) and straw particle size (2.36–4 mm) on the density, impact resistance, and compressive strength of pressed bean straws. Henriksson et al. [20] found that water content (5.3–10.5% w.b) significantly affected the pressing characteristics of various straws. Guo et al. [40] studied the effects of raw material water content and straw particle size on the forming energy consumption, throughput and physical properties of pressed blocks (density and durability) of barley, oat, canola and wheat straws. Wongsiriamnuay et al. [14] studied the effects of mold temperature (30–80 °C), pressure (150–250 MPa) and biomass type (cob, rice husk, straw) on the pressing characteristics and found that when the raw material particle size was 0.5–0.8 mm, the post-pressing relaxation density was 900–1000 kg/m3, and the durability was larger than 80%. Brand et al. [41] investigated the pressing and burning characteristics of pressed blocks of rice husk, rice straw and rice husk ash at different preparation ratios. Stasiak et al. [21] characterized the pressing of wood chips and straws mixed at different ratios and explored the mechanical properties and combustion performances of straw blocks.
The raw material for crushing straw is chopped straw, and the chopped straw block can also be used as fuel, which can avoid the crushing process and decrease use cost. Therefore, it is meaningful to study the compression characteristics of chopped straw. However, the commonly-used raw materials are the crushed straws among the existing studies, and the focus is the effects of water content, maximum compression stress, pressure maintenance time and feeding mass on the compression result and specific energy consumption of straws. And pressure or strain maintenance was adopted to avoid rebounding, but the determination of stabilization time has no basis in most of the literature. In addition, there is no report about the stabilization rules of pressed forming, pressure maintenance and strain maintenance of chopped corn straws as well as the use of stabilization processes of combined strain maintenance and pressure maintenance. In this study, chopped corn straw as a raw material, the effects of pressure maintenance and strain maintenance on the compression stability coefficient and relaxation density were explored, and the stabilization time was determined. Then, the stabilization time ratio combined with strain maintenance and pressure maintenance (ratio of pressure maintenance to stabilization time), moisture content, max compression stress and feeding mass were used as the factors, and dimensional stability coefficient, relaxation density and specific energy consumption were used as the evaluation indices, and the cold pressing process conditions for chopped corn straws were optimized. Finally, the strengths, weaknesses, opportunities and threats of cold-pressed chopped corn straws for fuel were analyzed by the SWOT method. Our aims were to improve the compression effect, decrease the energy consumption of compression, and thereby increase the straw utilization rate. Our findings may provide a reference for corn straw bundling and cold-press forming processes and offer some suggestions on the identification of straw utilization methods.

2. Materials and Methods

2.1. Materials

The corn samples used here were planted in the experimental base of Jilin University (Changchun, China). In the test fields, the straws were chopped by the Y-shaped gathering and crushing knives on a squared bundling machine (9YFSZ-2.2, Huade & Company, CN). The chopped straws were stripped in a length of 10–100 mm, a packing density of 40.75 kg/m3 and moisture content of 16.5% w.b. The straws were not bundled or compacted but were picked manually, dried naturally for days at the doorway of the laboratory, and then collected as raw materials. The moisture contents of the raw materials were roughly detected and modulated in accordance with the straw moisture content determination standard ASABE S358.2 [42]. The straw samples were placed into sealed bags and then stored at room temperature (4 °C) with a relative humidity of 52% [27].

2.2. Experimental Methods

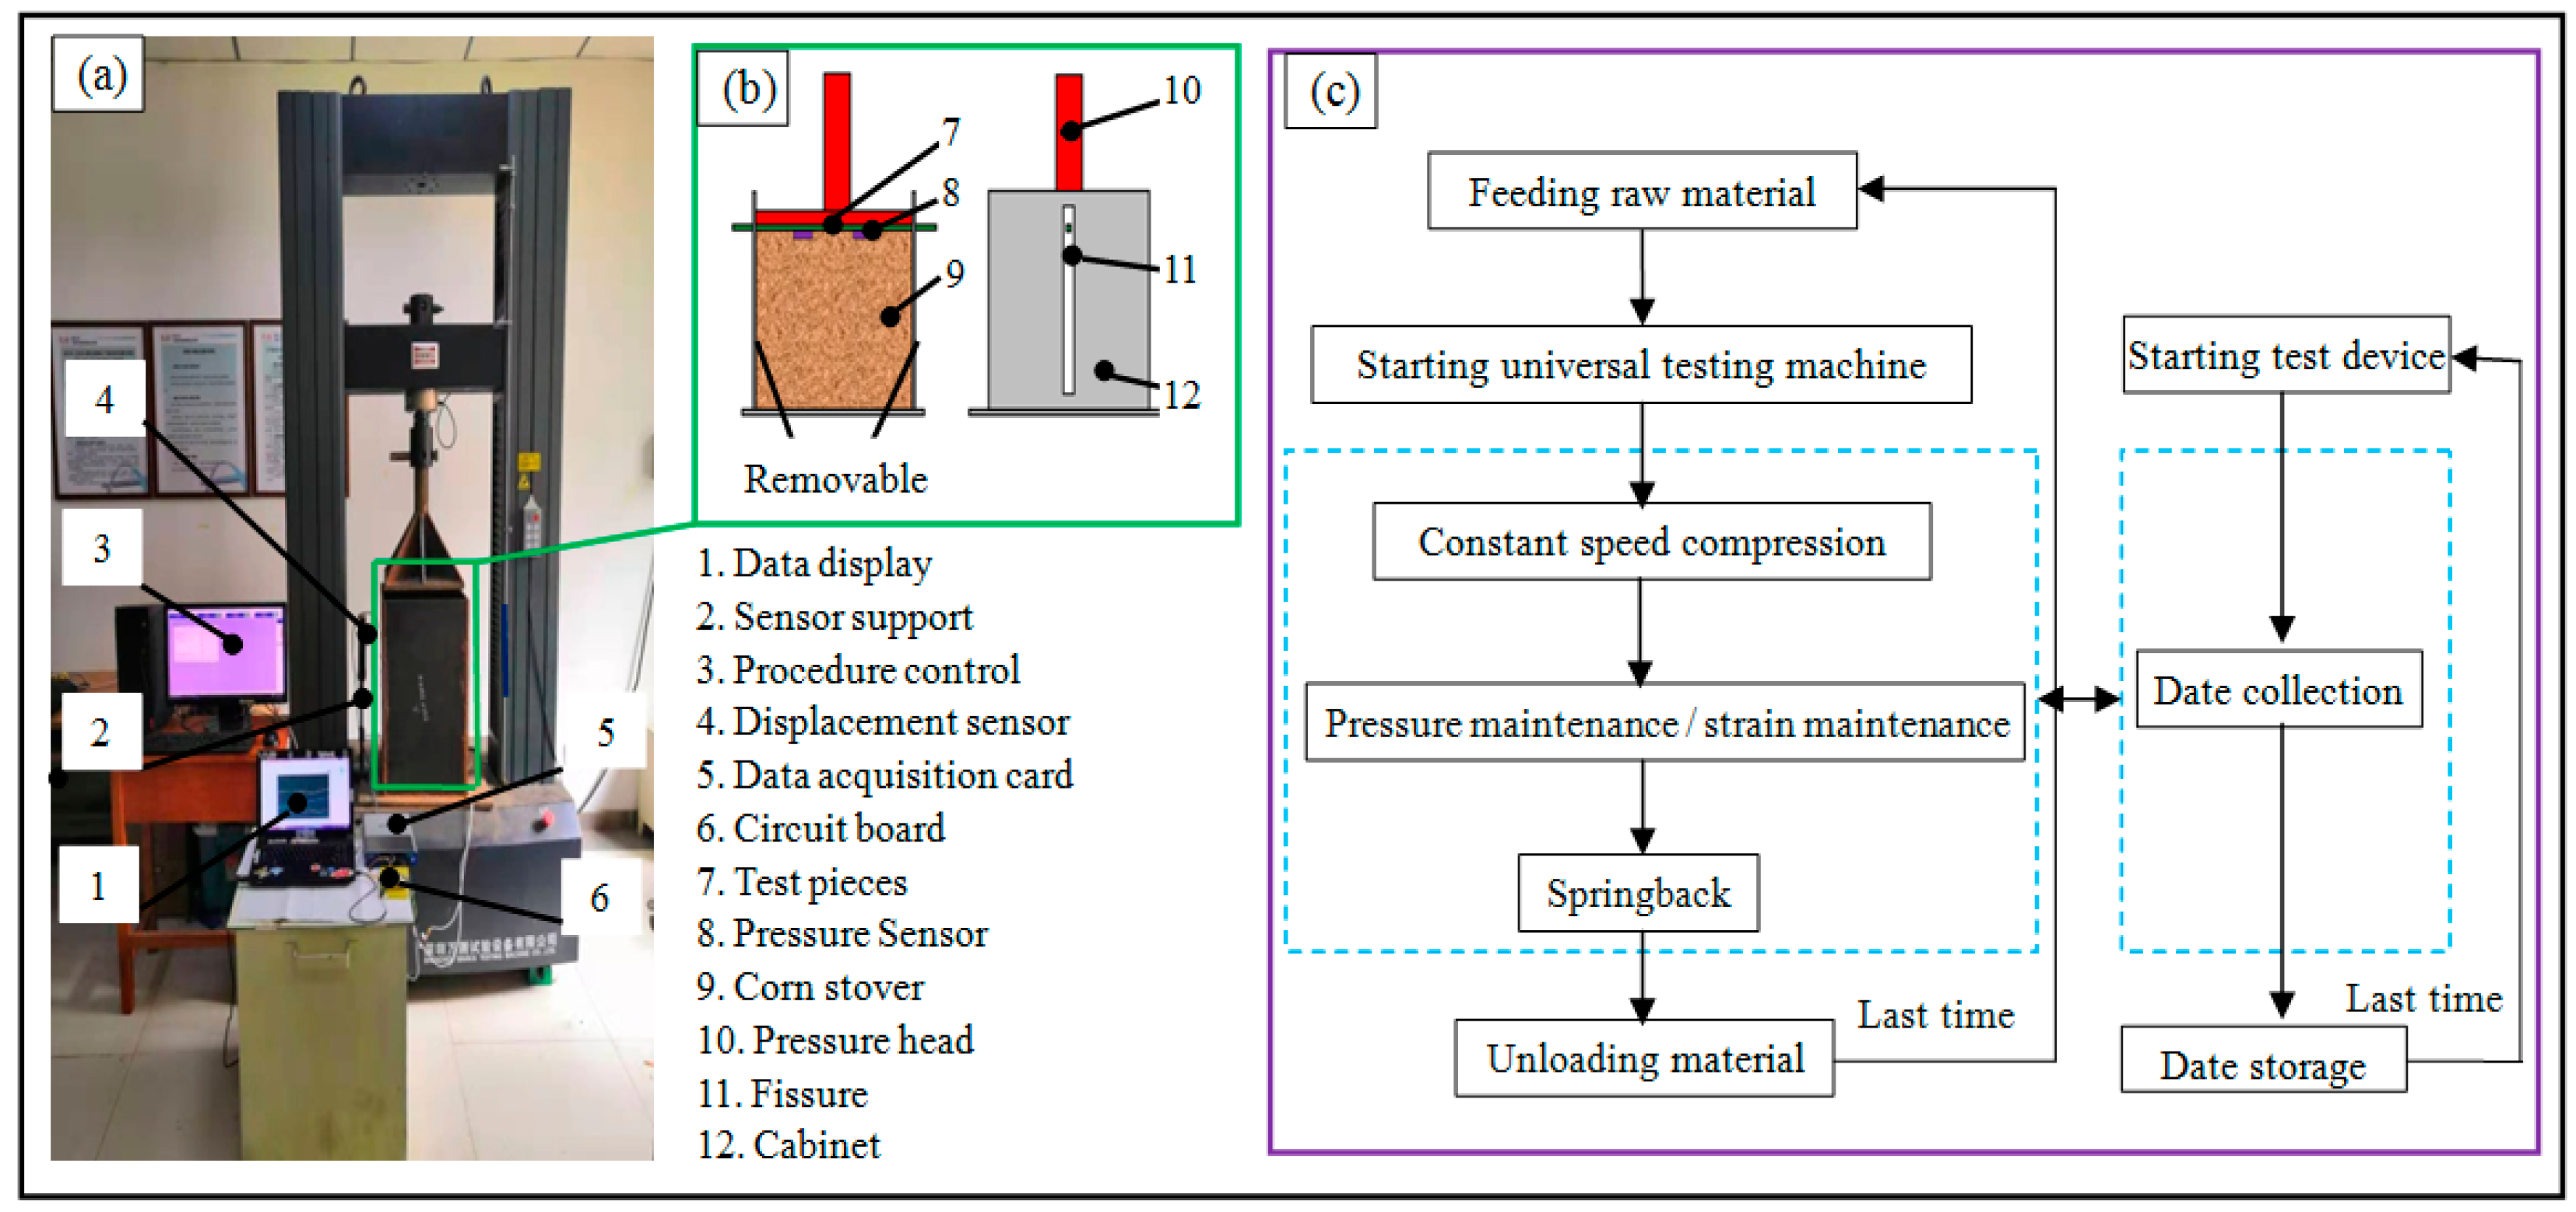
2.2.1. Instruments and Procedures

The straw compression and test system (Figure 1a,b) consisted of a ETM305D-300 microcomputer control electric hydraulic universal tester (WANCE Inc., China), a pressure head, a cabinet (360 × 460 mm in cross section, and 600 mm deep), film piezoresistance pressure sensors(IMS-C20; I-Motion Inc., China), a laser displacement mini-sensor (HG-C1400, Panasonic, JP), a data acquisition card (USB-6351, National Instruments, USA), and a displacement test sheet. The microcomputer control electric hydraulic universal tester provided the compression power and can control the compression procedures. In the middle of the cabinet, an 8 mm fissure was opened, which ensured the contactless migration of the displacement testing sheets, and then two film pressure sensors were stuck onto the displacement sheet. During compression and springback, the pressure stress was measured using the film pressure sensors, the compression and springback displacements were tested by the laser displacement mini-sensor, and the data of pressure stress and displacement were collected by the data acquisition card and displayed on 2018 Labview (National Instruments, USA) in the form of curves. The tested data were all stored. The sectional dimensions of straw blocks were measured using a digital display vernier caliper (FRN, Farina, Germany).
The compression procedures were illustrated in Figure 1c. After the raw materials were fed, the universal testing machine and the test facility were started, and the pressure head pressed the straws at a constant speed of 80 mm/min. When the compression stress reached the preset maximum, the stabilization process was initiated. Then the pressure head was returned at a constant speed of 300 mm/min to the initial position. Throughout the tests, the compression forces and the displacements at the straw surface and testing points were recorded in real time.

2.2.2. Experimental Design

Firstly, the effects of stabilization time (0, 15, 30, 45, 60, 75, 90, 105, 120, 135, 150 s) on the dimensional stability coefficient and relaxation density of corn straw blocks were studied through single-factor tests, and then the optimal stabilization time was determined from the aspects of compression effect, specific energy consumption, efficiency and significance. On this basis, water content, the ratio of pressure maintenance time to stabilization time, maximum compression stress, and straw feeding mass were selected as the testing factors. The Box–Behnken design, which can study the influence degrees of the factors, interactions and quadratic items on indicators by variance analysis, was adopted to optimize process parameters [43]. The Box–Behnken design is often used to optimize straw compression process parameters [26,27,44,45]. Based on the Box–Behnken Design, twenty-four groups of combined tests involving different factors, and three groups of central tests were designed. Each group of tests was repeated at least 6 times. The water content of corn straws upon harvest was approximately 17%, but the best compression water content was 10%–20% [46]. Thus, we selected the straws containing 12%, 15% or 18% water. After preliminary tests, the maximum compression stress was determined to be 60.4, 12.8 or 181.2 kPa. The feeding mass was 2.5, 3 or 3.5 kg [47]. The ratio of pressure maintenance time to stabilization time was 0, 0.5 or 1.Given the differences in the units and levels among factors and to facilitate the data processing, we linearly transformed the levels of all factors so that the level ranges of all factors were transformed to cubes with the center at the origin. Table 1 lists the real values and codes of the tested factors in this research.

2.2.3. Evaluation Indices

(1) Relaxation density
Relaxation density refers to the density of rebounding after the pressure head is removed from the pressed straws and is a major indicator reflecting the compression effect of straws. The preliminary tests implied that the rebounding of straw blocks stabilized after the pressed straws rebounded for 300 s. Thus, we studied the relaxation density of pressed straws after 300 s of rebounding, which was expressed as follows [14].
R B D = m × 10 9 ( H L S ) S
where RBD (kg/m3) is the relaxation density of pressed straws; LS (mm) is the displacement between the straw surface and the testing point after 300 s of rebounding; S (mm2) is the cross-sectional area of a straw block after 300 s of rebounding.
(2) Dimensional stability coefficient
The dimensional stability coefficient measures the ratio of springback displacement after compression to the compression displacement and can reflect compression and springback displacement, the dimensional stability coefficient of post-compression straws and useful work during compression. The dimensional stability coefficient was calculated using Equation (2).
D S C = [ 1 ( L S L 0 ) ( L C L 0 ) ] × 100 %
where DSC (%) is the dimensional stability coefficient; L0 (mm) is the initial displacement between the straw surface and testing point; LC (mm) is the displacement between the straw surface compression stage and testing point.
(3) Specific energy consumption
Specific energy consumption is an important indicator of straws compression condensation costs and directly affects the straws reclamation and utilization. The energy consumption was assessed by using the compression energy needed by unit mass [48].
E m = x s 1 x s 2 F ( x ) d x m
where Em (J/kg) is the specific energy consumption; F(x) (N) is the compression pressure (a function of the compression head coordinate x); xs1 and xs2 (mm) are the initial point and destination of the compression head stroke, respectively.

2.2.4. Data Analysis

The least squares method is a common method for curve fitting; thus, the least squares method of the Levenberg–Marquardt in the nonlinear fitting module in Origin 8.0 software (Data Analysis and Graphing, OriginLab, USA) was used for curve fitting [49,50]. Data were analyzed by using the analysis of variance (ANOVA) and least-significant difference (LSD) at the 0.05 level procedures in Origin 8.0 [51].
The Design-Expert 8.0.6 software (STAS-EASE Inc., Minneapolis, MN, USA) was employed to generate response surfaces and contour plots, analyze experimental data and conduct multi-objective optimization [22,26]. The fitting quality of the model was evaluated by the determination coefficients and analysis of variance (ANOVA). The quadratic polynomial equation of relaxation density, dimensional stability coefficient and specific energy consumption (Y), as a function of the independent variables and their interaction, could be established by utilizing Equation (4)
Y = β 0 + i = 1 4 β i x i + i = 1 4 β i i x i 2 + i = 1 3 j = i + 1 4 β i j x i x j
where Y is the response value (relaxation density, dimensional stability coefficient and specific energy consumption), Xi is the independent factor (moisture content, ratio of pressure maintenance to stabilization time, max compression stress and feeding mass), β0 is the intercept, βi is the first order model coefficient, βii is the quadratic coefficient for the variables i and βij is the linear model coefficient for the interaction between variable i and j.

2.2.5. Combustion Characteristics of Cold-Pressed Straw Blocks

Elemental analysis was conducted by an EA3000 Elemental analyzer (EuroVector Instruments and Software, Italy). Industrial analysis was carried out as per the Coal Industrial Analysis Methods (GB 212-2001). Calorific value was detected according to the Biomass Fuel Calorific Value Measuring Method (GB 5186-1985) by using an SXHW-2 digital-display thermostatic calorimeter (Henan Aibote Technology Development Co., Ltd., Zhengzhou, China) [52,53]. Each test was repeated six times, and the average value was computed.

3. Results and Discussion

3.1. Compression Stabilization Time

The effects of stabilization time on the stability coefficient and relaxation density under the pressure maintenance and strain maintenance process are illustrated in Figure 2. Clearly, as the stabilization time was prolonged, the pressed dimensional stability coefficient and relaxation density both significantly increased, but the increasing rates both declined. The mathematical relationships of stabilization time with dimensional stability coefficient and relaxation density can be both expressed as exponential functions, with the coefficient of determination R2 larger than 0.99 in both equations (Table 2).The increasing rates of the stability coefficient and relaxation density declined, which was because, as the strain maintenance time was extended, the stress relaxation rate decelerated [4,54,55], and the decreasing rate of the restoring force of the straw blocks dropped. Moreover, as for pressure maintenance, the increasing rate of pressed displacement decreased as the pressure maintenance time was prolonged [47]. Under the same stabilization time, the pressed dimensional stability coefficient after strain maintenance and the relaxation density after compression both were larger than those after pressure maintenance. The reason was that in the straw blocks after constant-speed compression, the compression force was instantly converted to the residual stress of the pressed straw blocks and became the restoring force for the rebounding of pressed straws. Moreover, the strain maintenance decreased the rebounding force of pressed straws and thereby significantly shortened the rebounding displacement. In comparison, the pressure maintenance enlarged the compression displacement, but at low magnitude, and did not decrease the rebounding force, so the rebounding of pressed straws was still large.
As the stabilization time was extended, the straw compression effect was improved, but the specific energy consumption significantly increased, and the compression efficiency was considerably lowered, which is consistent with the findings by Adapa [15]. Hence, with the prolonged stabilization time, some of the evaluation indices were improved and others were worsened. Significance analysis is one of the analytical methods to test the influence degree of the analytical factors on a certain index. Thus, we determined the stabilization time through the significant analysis of indices. The effects of stabilization time (45, 60, 75, 90 s) on the dimensional stability coefficient and relaxation density as well as significance analysis are summarized in Table 3. Under the pressure maintenance process, when the stabilization time was 60 s, the dimensional stability coefficient and relaxation density both decreased, but not significantly (P > 0.05). Li at al. [17] and Panwar et al. [18] found that when the pressure maintenance time was larger than 10 s, the relaxation density of the post-pressing straw blocks did not change significantly. Zhang et al. [19] found the pressure holding time had no significant effect on the fuel and pelletization characteristics. The reason for the inconsistency between the above studies and our study was that they used small-size straws, which were featured by low compression elasticity. After 10 s, the pressing heads did not move anymore, so the pressing densities did not change. In our study, however, we adopted the chopped long corn straws, which were featured by large elasticity. After 60 s, the pressing heads were still slowly moving downwards, so the pressure maintenance can significantly improve the pressing densities of the straws. Under the strain maintenance process, when the stabilization time was 60 s, the dimensional stability coefficient declined insignificantly (P > 0.05); when the stabilization time exceeded 90 s, the relaxation density decreased insignificantly (P > 0.05).When the stabilization time was longer than 60 s, the compression effect was excellent, but the majority of indices did not change significantly. In the meantime, the energy consumption significantly increased, and the efficiency was significantly lowered. Based on the above, the stabilization time for chopped corn straws compression is 60 s after taking the compression effect, efficiency, energy consumption and significance.

3.2. Results and Analysis of Combined Tests

The results of relaxation density, dimensional stability coefficient and specific energy consumption of chopped corn straws obtained as per testing requirements and testing design were listed in Table 4. The ranges of relaxation density, dimensional stability coefficient, and specific energy consumption were 105.27–165.19 kg/m3, 80.86%–87.97%, and 160.52–388.29 J/kg, respectively. Kashaninejad found that the block density of wheat straws was 699–1064 kg/m3, and the specific energy consumption was 4.35–33.64 MJ/t [24]. Gong et al. reported that the straw block density after pressing was 646–1052 kg/m3, and the specific energy consumption was 6.6–25.1 MJ/t [25]. Compared with our results, the density and specific energy consumption of straw blocks in the above two studies were larger, as the density was 4–10 times larger and the specific energy consumption was about 11–210 times larger. These differences were attributed to the differences in raw material types and in the characteristics and forming conditions of straws. In the above literature, the raw materials were the small size crushed straws prepared from the mixture of maize and peanut shells or from wheat straws, but the raw materials in our study were the chopped long straw stalks. Moreover, the above studies adopted hot pressing (90 ± 5 °C), but we used cold pressing.

3.2.1. Analysis of Variance (ANOVA) and Regression Equations

ANOVA is generally used as an important means of testing the significance and accuracy of a model [23]. The results above were sent to quadratic regression on Design-Expert 8.0.6, and the ANOVA of response surface methodology (RSM) is illustrated in Table 5. The coefficients of determination (R2) of relaxation density, stability coefficient and specific energy consumption were all larger than 0.97, suggesting that more than 97% of variations in the indices can be explained by the models. The predicted vs. actual values for the relaxation density, dimensional stability coefficient and specific energy consumption are shown in Figure 3. Predicted R2 was obtained by fitting, indicating good agreement between the predicted and actual values of three response models. In Table 5, the differences in Adjusted R2 and Predicted R2 were all less than 0.2 among the three models, also indicating that the three response models were highly consistent. The Adeq Precisions of relaxation density, stability coefficient and specific energy consumption were 25.79, 21.38 and 23.25 (far larger than 4), suggesting the models are precise [36].
Table 6 listed the ANOVA results of response variables. The regression models of relaxation density, dimensional stability coefficient and specific energy consumption were all very significant (P < 0.01), with insignificant lack-of-fit (P > 0.05), suggesting the regression models can be used to predict the relaxation density, dimensional stability coefficient and specific energy consumption of post-compression corn straws. It was found that the water content, the ratio of pressure maintenance time to stabilization time, maximum compression stress, and feeding mass all very significantly affected the relaxation density, dimensional stability coefficient and specific energy consumption of post-compression corn straws (P < 0.01). The literature showed that applied pressure, moisture content, and the corn stover-peanut shell mixture all significantly affected briquette density and specific energy consumption [33]. The influence of different factors on the relaxation density of post-compression corn straws ranks as maximum compression stress > water content > feeding mass > ratio of pressure maintenance time to stabilization time. The influence on the dimensional stability of pressed corn straws ranks as water content > ratio of pressure maintenance time to stabilization time > feeding mass > maximum compression stress. The influence on the specific energy consumption ranks as maximum compression stress > water content > feeding mass > ratio of pressure maintenance time to stabilization time. In terms of interaction, the interaction between water content and maximum compression stress significantly affected both relaxation density and specific energy consumption. The interaction between the ratio of pressure maintenance time to stabilization time and feeding mass significantly affected the dimensional stability (P < 0.05).
The regression equations of relaxation density, dimensional stability coefficient and specific energy consumption were obtained by regression analysis. The insignificant items were x1x2, x1x4, x2x3, x2x4 and x3x4 in the regression equation of relaxation density, the insignificant items were x1x2, x1x3, x1x4, x2x3, x3x4 and x 4 2 in the regression equation of dimensional stability coefficient, and the insignificant items were x1x2, x1x4, x2x3, x2x4, x3x4, x 1 2 and x 2 2 in the regression equation of specific energy consumption (P > 0.05). After the insignificant items were eliminated, the regression equations of relaxation density, dimensional stability coefficient and specific energy consumption were simplified into Equations (5), (6) and (7), respectively.
Y 1 = 223.23 + 10.68 x 1 + 29.62 x 2 + 0.72 x 3 152.84 x 4 0.02 x 1 x 3 0.45 x 1 2 37.52 x 2 2 ( 8.40 E 004 ) x 2 2 + 21.70 x 4 2
Y 2 = 48.17 + 3.14 x 1 2.51 x 2 + 0.04 x 3 + 11.05 x 4 + 2.15 x 2 x 4 0.12 x 1 2 6.90 x 2 2 ( 2.01 E 004 ) x 3 2
Y 3 = 688.45 + 22.44 x 1 2.89 x 2 + 4.51 x 3 + 357.44 x 4 0.102.15 x 1 x 3 ( 5.28 E 003 ) x 3 2 62.87 x 4 2

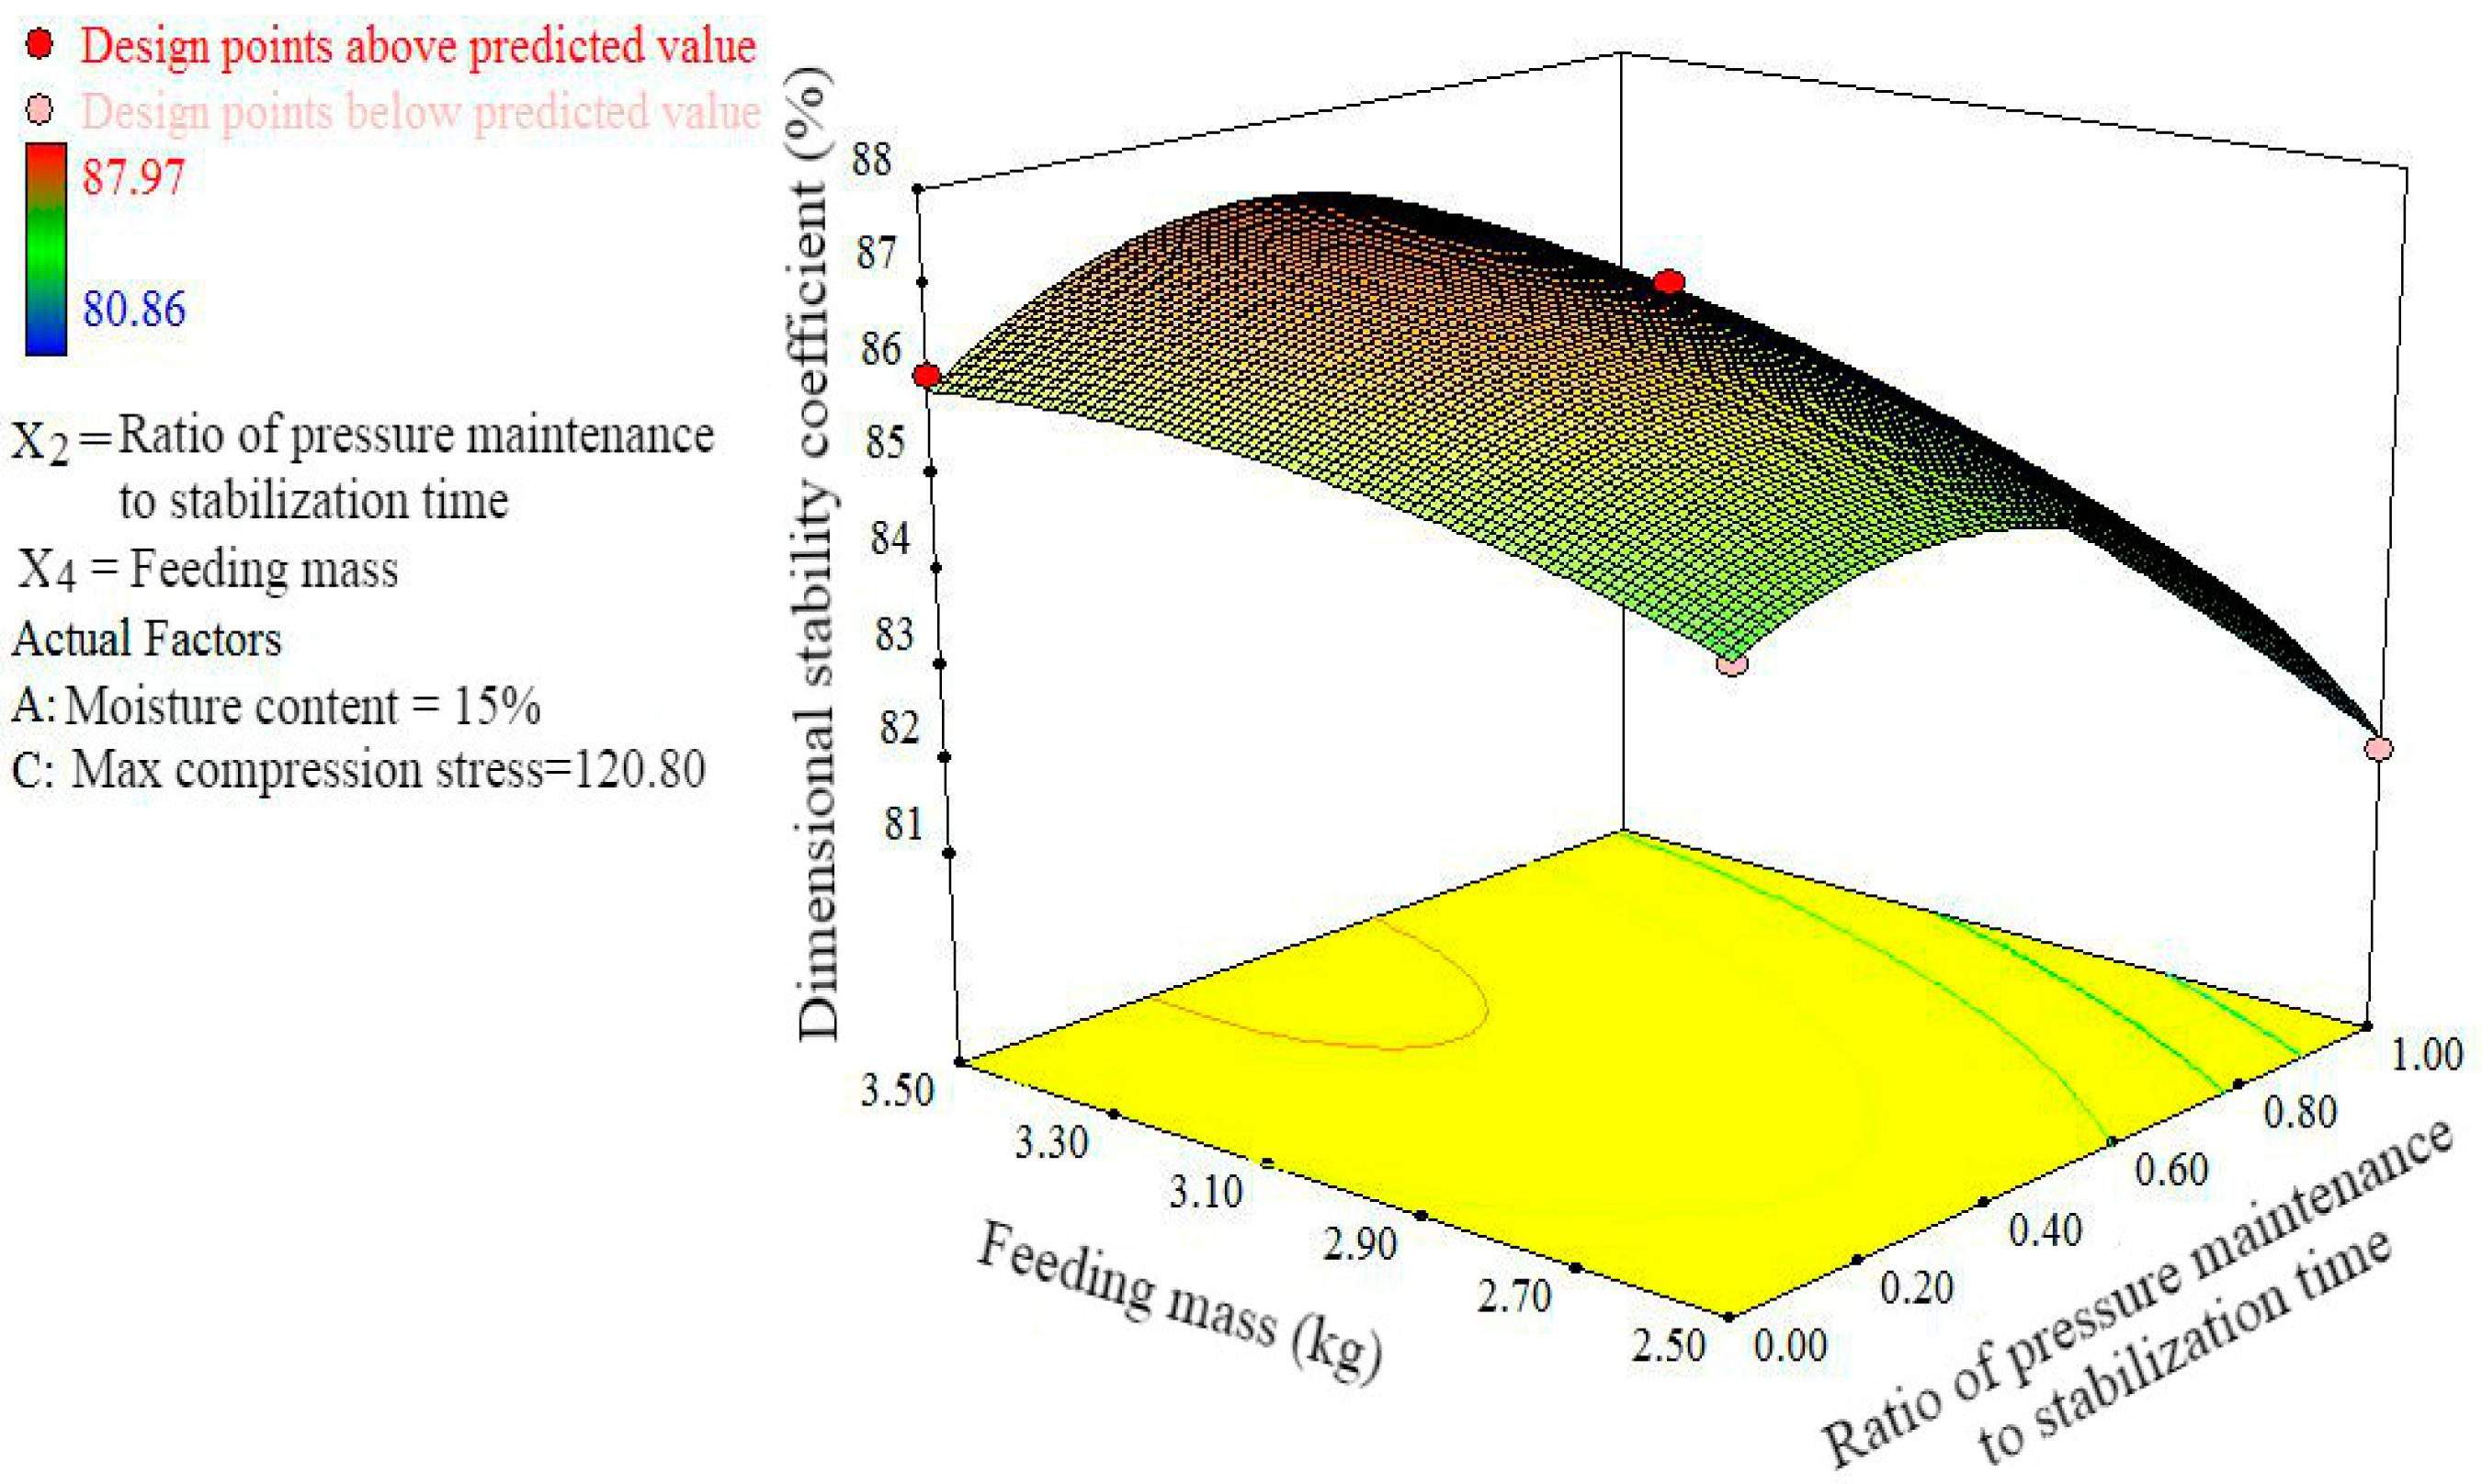
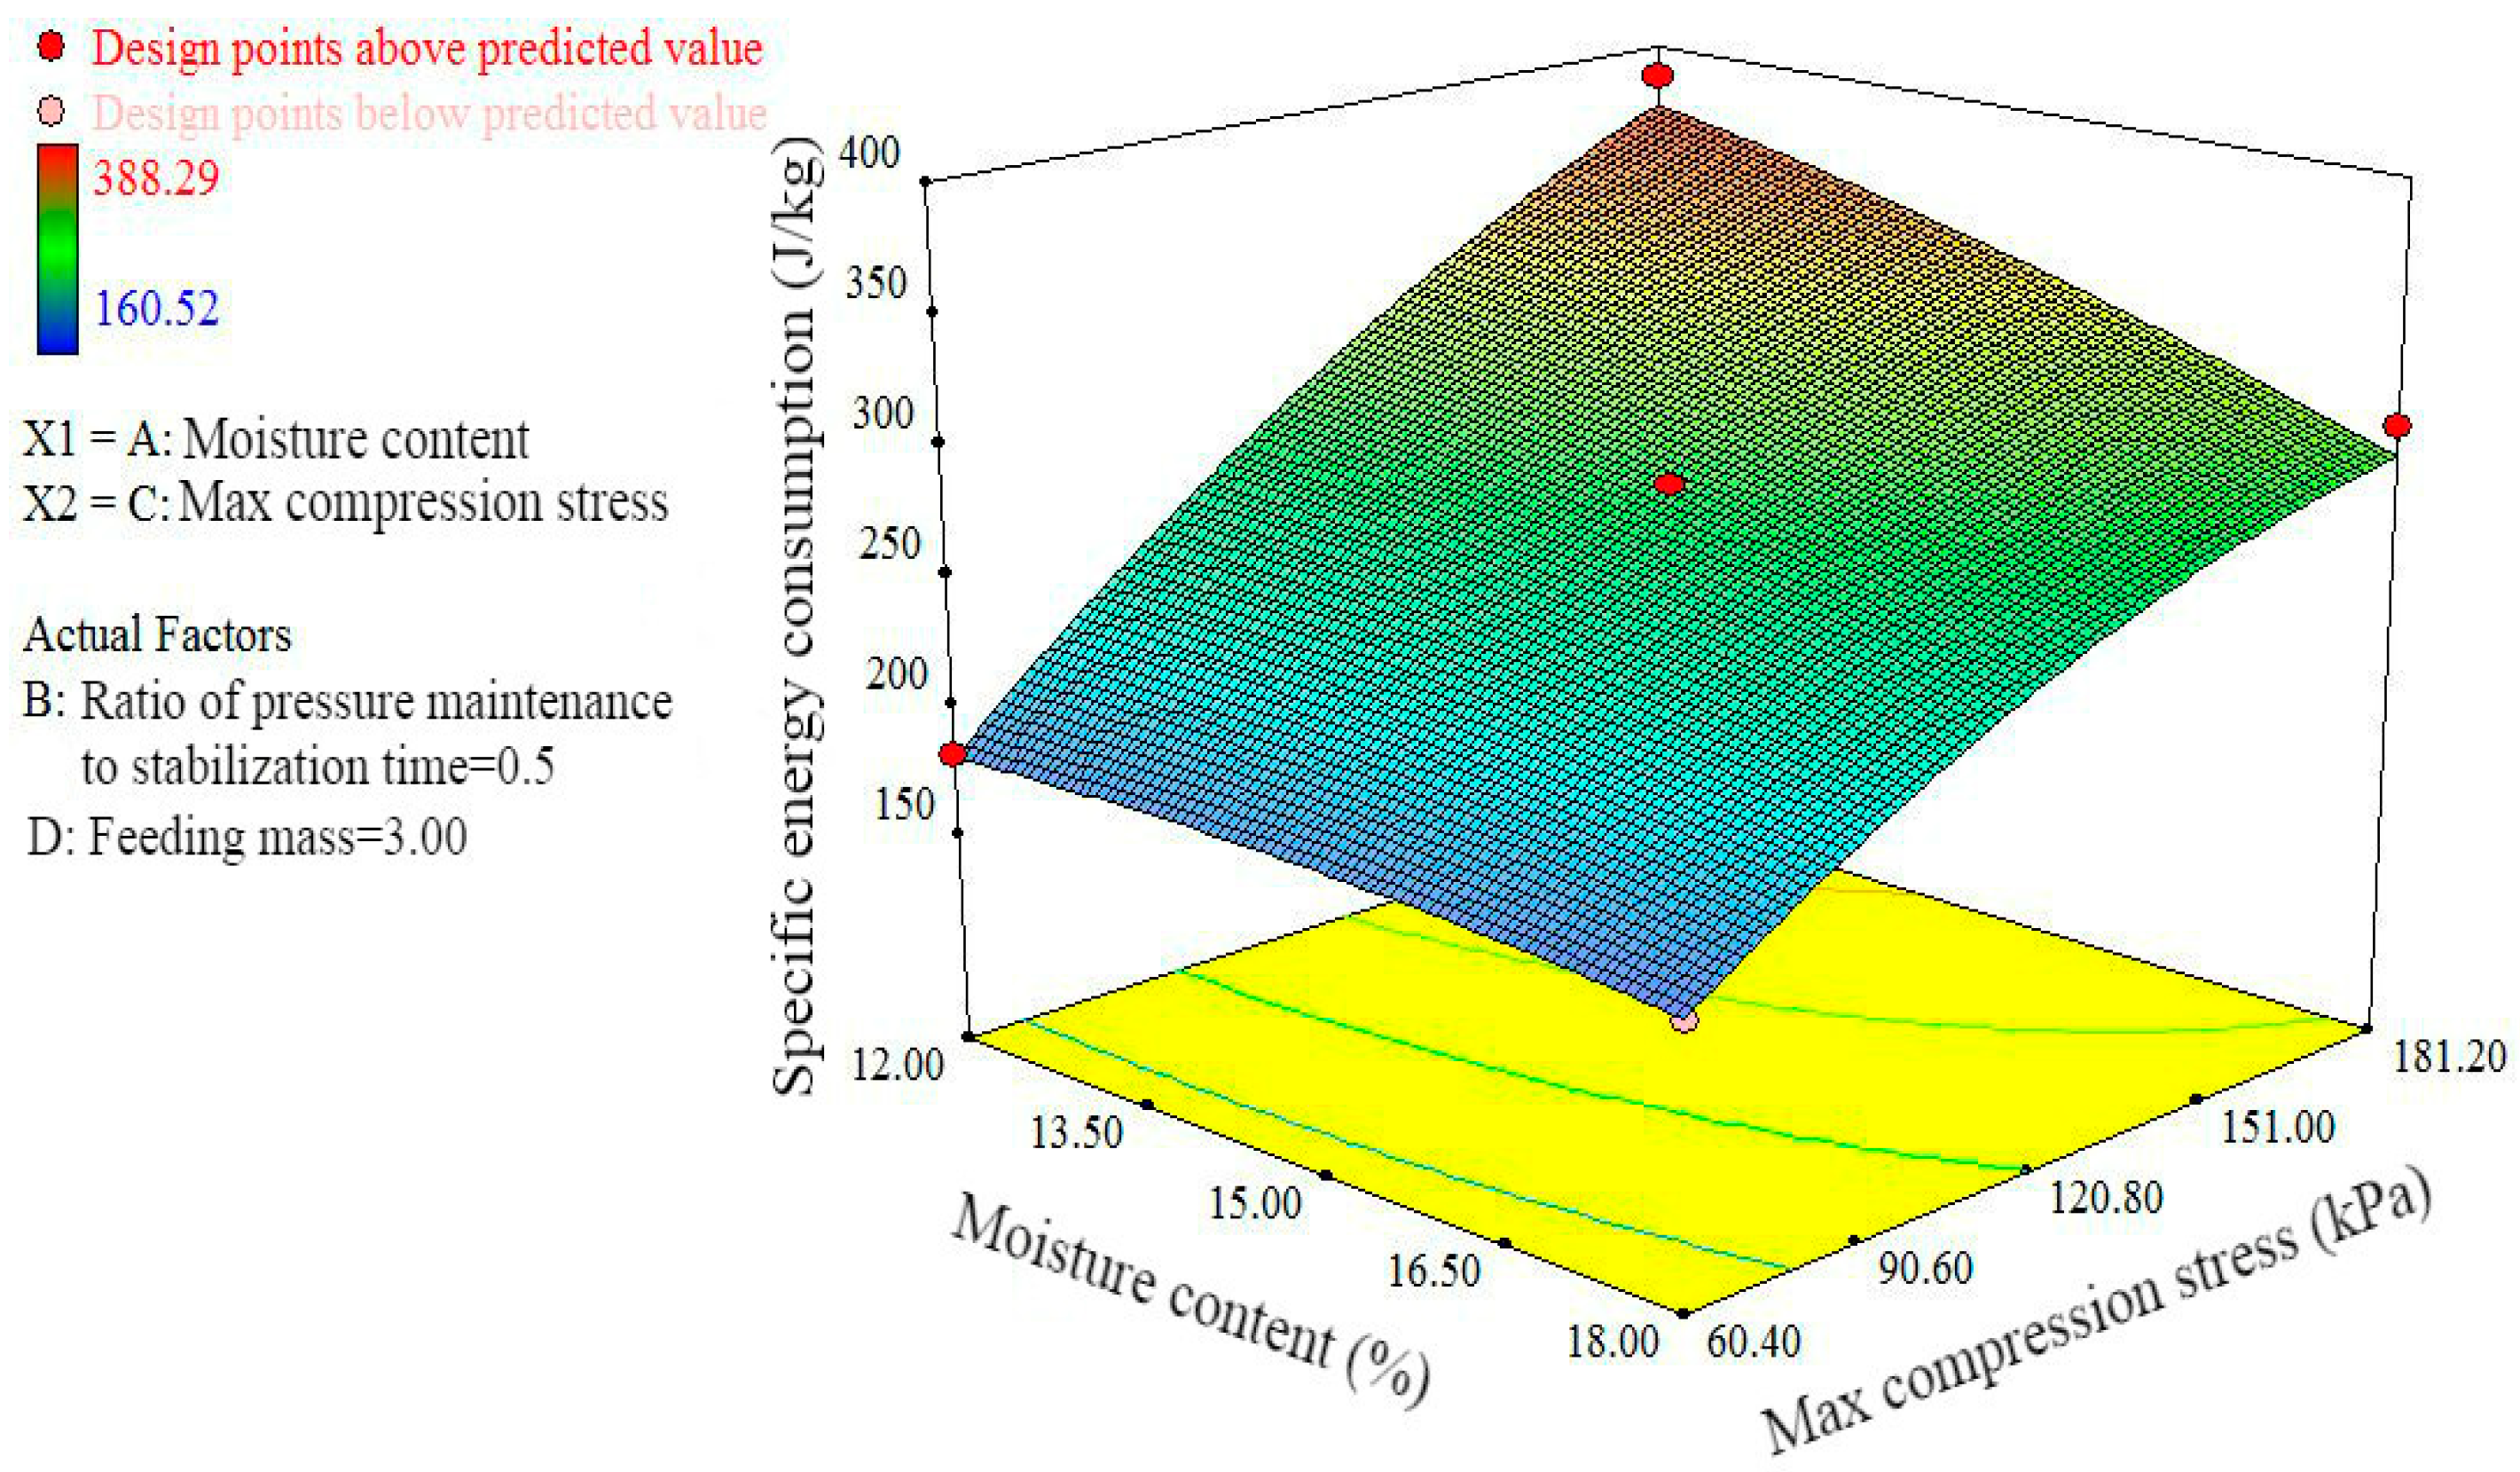
3.2.2. Two-Factor RSM Analysis

The significant two-factor interactions were sent into RSM analysis. The joint effect of water content and maximum compression stress on relaxation density are illustrated in Figure 4. When the water content was constant, the relaxation density of pressed straws increased with the increment of maximum compression stress. As reported, the maximum compression stress contributed to the density of pressed straws [56,57], which was because the increment of pressure led to the enlargement of press displacement and thereby a significant increase of compression density [22,24]. When the maximum compression stress was constant, the relaxation density of pressed straws increased with the rise of water content. Henriksson et al. [20] summarized that the density of straw after compaction can be increased or decreased, mainly caused by the type of straw. Lisowski et al. [58] studied the densities of post-compression walnut shells, and Tumuluru et al. [27] studied the densities of wheat, oat, canola, and barley straw both after compression and after two weeks of storage, these results showed the raw material water contents decreased the relaxation density of pressed straws. Zvicevicius et al. [43] reported that the water content has a negative effect on post-compression straw density. The reason was that the straws containing more water were more elastic, which promoted the rebounding after compression and led to a decrease in the density of pressed straws.
The interaction between the ratio of pressure maintenance time to stabilization time and feeding mass affected the dimensional stability (Figure 5).When the ratio of pressure maintenance time to stabilization time was constant, the dimensional stability coefficient increased with the increment of feeding mass. The feeding mass affected the compression displacement of straws and the rebounding displacement after compression. When the feeding mass increased, both increased, but the magnitude of compression displacement was very large, so the dimensional stability coefficient increased. When the feeding mass was constant, as the ratio of pressure maintenance time to stabilization time increased, the dimensional stability coefficient of pressed straws first increased, then optimized, and finally decreased. The reason was that pressure maintenance and strain maintenance both can intensify the dimensional stability of pressed straws, but the mechanisms are different. During strain maintenance, the rebounding of pressed straws is relieved through the relaxation of residual stress, so as to enhance the dimensional stability of pressed straws. On the contrary, during pressure maintenance, the above goal is achieved by enlarging the compression displacement, but the stress is not relaxed and instead is converted into the rebounding force of pressed straws, so the rebounding is enlarged. During pressure maintenance, the compression displacement is large at the early stage, but it declines with the prolonging of time [47,59]. At the early stage of strain maintenance, the stress relaxation is large, but it declines with the extension of time [4,54,55]. Thus, the combination of pressure maintenance and strain maintenance can significantly enhance the dimensional stability of pressed straws.
The effect of the interaction between water content and maximum compression stress on specific energy consumption is shown in Figure 6. When the water content was constant, the energy consumption increased with the increment of maximum compression stress. Adapa et al. [13] studied the compaction characteristics and energy consumption of barley, canola, oat and wheat straws and reported similar changing rules. The reason was that when the maximum compression stress increased, the compression displacement and the pressed force both increased, and hence, the specific energy consumption increased significantly [60]. When the maximum compression stress was constant, the specific energy consumption dropped with the rise of water content. Li et al. [61] found that the consumed energy decreased when the moisture increased in the range from 5% to 20%, which was consistent with this research result. The reason was due to the lubrication and adhesive action effects between particles that resulted from the added water [14].

3.2.3. Comprehensive Optimization and Verification Tests

Based on the optimization module on Design-Expert 8.0.6, we set the water content, ratio of pressure maintenance time to stabilization time, maximum compression stress, and feeding mass as ‘in range’, the relaxation density and dimensional stability coefficient as ‘maximize’, and specific energy consumption as ‘minimize’. The optimized process parameters were water content of 13.63%, ratio of pressure maintenance time to stabilization time at 0.38 (namely, pressure maintenance time of 22.8 s, strain maintenance time of 37.2 s), maximum compression stress of 109.58 kPa, and straw feeding mass of 3.5 kg, we found the predicted relaxation density was 143.73 kg/m3, the predicted dimensional stability coefficient was 87.97%, and the predicted specific energy consumption was 243.42 J/kg. Dinesha et al. [8] reported that the optimal water content for straw compression was 10–15% w.b. The optimal water content determined in our study fell within this range. With tensile strength, pellet density and specific energy consumption as the indices, Lu et al. [26] optimized wood residue, bentonite, glycerol and compression load when the pressure maintenance time was 60 s. With the density immediately after pressing, the density at two weeks after pressing, and durability as the indices, Tumuluru et al. [27] optimized die temperature, feedstock moisture content, compression pressure and hammer mill screen size when the stress maintenance time was 30 ± 2 s. Cui et al. [44] optimized temperature, pressure and moisture content by using mechanical durability, bulk density, and energy consumption as the testing indices but did not give details about the stabilization method or time. In conclusion, when optimizing the straw compression process parameters, researchers often use a fixed time alone to maintain pressure or shape to prevent rebound among the existing studies. The stabilization time is not used as a factor. In this paper, the optimized ratio of pressure maintenance time to stabilization time is not 0 or 1 (namely, neither pressure maintenance time nor strain maintenance time was 60 s), indicating the combined process results in higher density and dimensional stability and lower specific energy consumption compared with the separate use of pressure maintenance or strain maintenance in the literatures.
The optimized parameters were then experimentally validated, and the relaxation density, dimensional stability coefficient and specific energy consumption of straw blocks were optimized to be 145.63 kg/m3, 86.89% and 245.78 J/kg respectively. The comparison shows that the measured data and predicted data are different to some extent, indicating the regression model used to index prediction will generate errors. The level of errors reflects the accuracy degree of the model prediction and can be calculated according to Equation (8) [26].
P E = | Y O Y P | Y P × 100 %
where PE (%) are the percent errors of indices; YP are the predicted values of indices; YO are the observed values of indices.
The percent errors of the relaxation density, dimensional stability coefficient and specific energy consumption were obtained 1.32%, 1.23% and 0.97% by Equations (5), (6) and (7), respectively. These errors may be caused by the difference of chopped straws in each test group and the accuracy of test equipment. The main reason of these errors is the difference of the chopped straws due to the difference of the whole straw and the irregular chopping. With the same method, Cui and Lu determined the straw compression process parameters and verified the accuracy of the regression model under the optimal compression conditions. Moreover, the prediction errors of the indices (mechanical durability, bulk density, energy consumption and tensile strength) were less than 5% [26,44]. In our study, the prediction errors of the indices are less than 2%, which are smaller compared with the above two studies. These small errors indicate that the areas optimized by the binomial expressions were consistent with our design aims and that the RSM models and testing design were reliable and reproducible.

3.3. Characteristics of Straw Blocks for Fuel

The optimized cold-pressed chopped straw blocks were sent to Elemental analysis, industrial analysis, and calorific value measurement. The results in comparison with coals for agricultural use (bituminous lump coal, anthracite lump coal, lump semicoke and briquette coal) were listed in Table 7. Greinert et al. [62] found the ash, S and N contents of biomass pellets were 2.74%, 0.14% and 0.28%, respectively, which are all smaller than our results but not significantly. This situation can be related to the quality, forming way, species and origin of the material [63,64]. Compared with coals for agricultural use, the straw blocks contained 1/3 to 2/3 of S, less N and were featured by larger volatile content and lower ash content. Thus, the combustion of the straw blocks produced fewer ashes and S- or N-containing polluting gases [65]. The chemical composition of ash was dominated by the macroelements Ca, K, P and S [66], and which can substitute for classic mineral fertilizers and strengthen the ecological aspects of energy crop cultivation [67,68,69]. Lanzerstorfer et al. [70] reported that the lower fuel N content results in a lower NO concentration in the flue gas. The low calorific value of the straw blocks was 12.8 MJ/kg, which was lower than that of agricultural coals, but higher than that of straw bundles [53,67]. In all, the cold-pressed straw blocks are eco-friendly and ideal fuels.
Table 8 illustrates the burning characteristics, forming energy consumption, and use costs compared among different forms of corn straws. The density of corn straw bundles minimized, followed by cold-pressed chopped corn straw blocks, but the density of small-size corn straw blocks was very large. The low calorific values of different corn straw blocks were not significantly different, and the largest difference was 0.9 MJ/kg. As shown in Table 8, the densities and calorific values are very large. El-Sayed also reported that straw compression not only increased the straw densities but also improved the fixed carbon content and calorific value [71]. Since the straws should be chopped prior to use, we only analyzed the energy consumption due to crushing, compression and heating when we compared the energy consumption of different forming processes. Mani et al. [72] found the crushing energy consumption of corn straws was 25.06–123.48 kJ/kg, while Kaliyan et al. [73] reported the crushing energy consumption of corn straws was 93–661 kJ/kg and the crushing costs were 4.39–31.23 $/t. Bai [74] reported the compression energy consumption of corn straws was 282 kJ/kg. Heating helped to soften and activate the inherent or additive bonding agents, decrease the post-compression rebounding, and enlarge the density and durability of pressed straw blocks [22,30], but the energy consumption was larger than 150 kJ/kg. Straws are produced in farmlands. Based on the principle of rural energy utilization, straws and biomass pellet can be used for heating and cooking by farmers [75,76]. Compared with small-size straw formed particles, the bundled straws can be used for heat supply in rural areas at low costs (1.53–2.05 $·m−2) [53]. From the aspects of use costs, environmental protection and energy sustainability, we suggest cold-pressed chopped straw blocks and bundled straws are excellent substitutes of coals and can be used for warming in peasant households.
Table 9 showed the SWOT analysis of cold-pressed chopped corn straws for fuel. The above analysis suggests that the chopped straws are outstanding with smaller specific energy consumption under cold pressing, lower costs, and higher efficiency due to the avoidance of crushing. The straw blocks can replace fossil fuels and are featured by less pollution, but the calorific value is smaller than coals for agricultural use. The opportunities are that owing to the low density of straw bales, the optimized cold pressing process can be used into balers and can be referred to during secondary pressing of straw bales, which will improve the density of straw bales. The cold-pressed straw blocks are utilized according to the principle of proximity and can replace fossil fuels. When used to warm farmers, the cold-pressed straw blocks can decrease the transport and storage costs of straws and agricultural use coals, thereby relieving the crisis of fossil fuels and improving the use efficiency of straws. In addition, the straws are recycled, and the residues after combustion can be returned as fertilizers into farmlands. The threats are that mechanized cold-pressing equipment and professional combustion furnaces and fume cleaning equipment are needed.

4. Conclusions

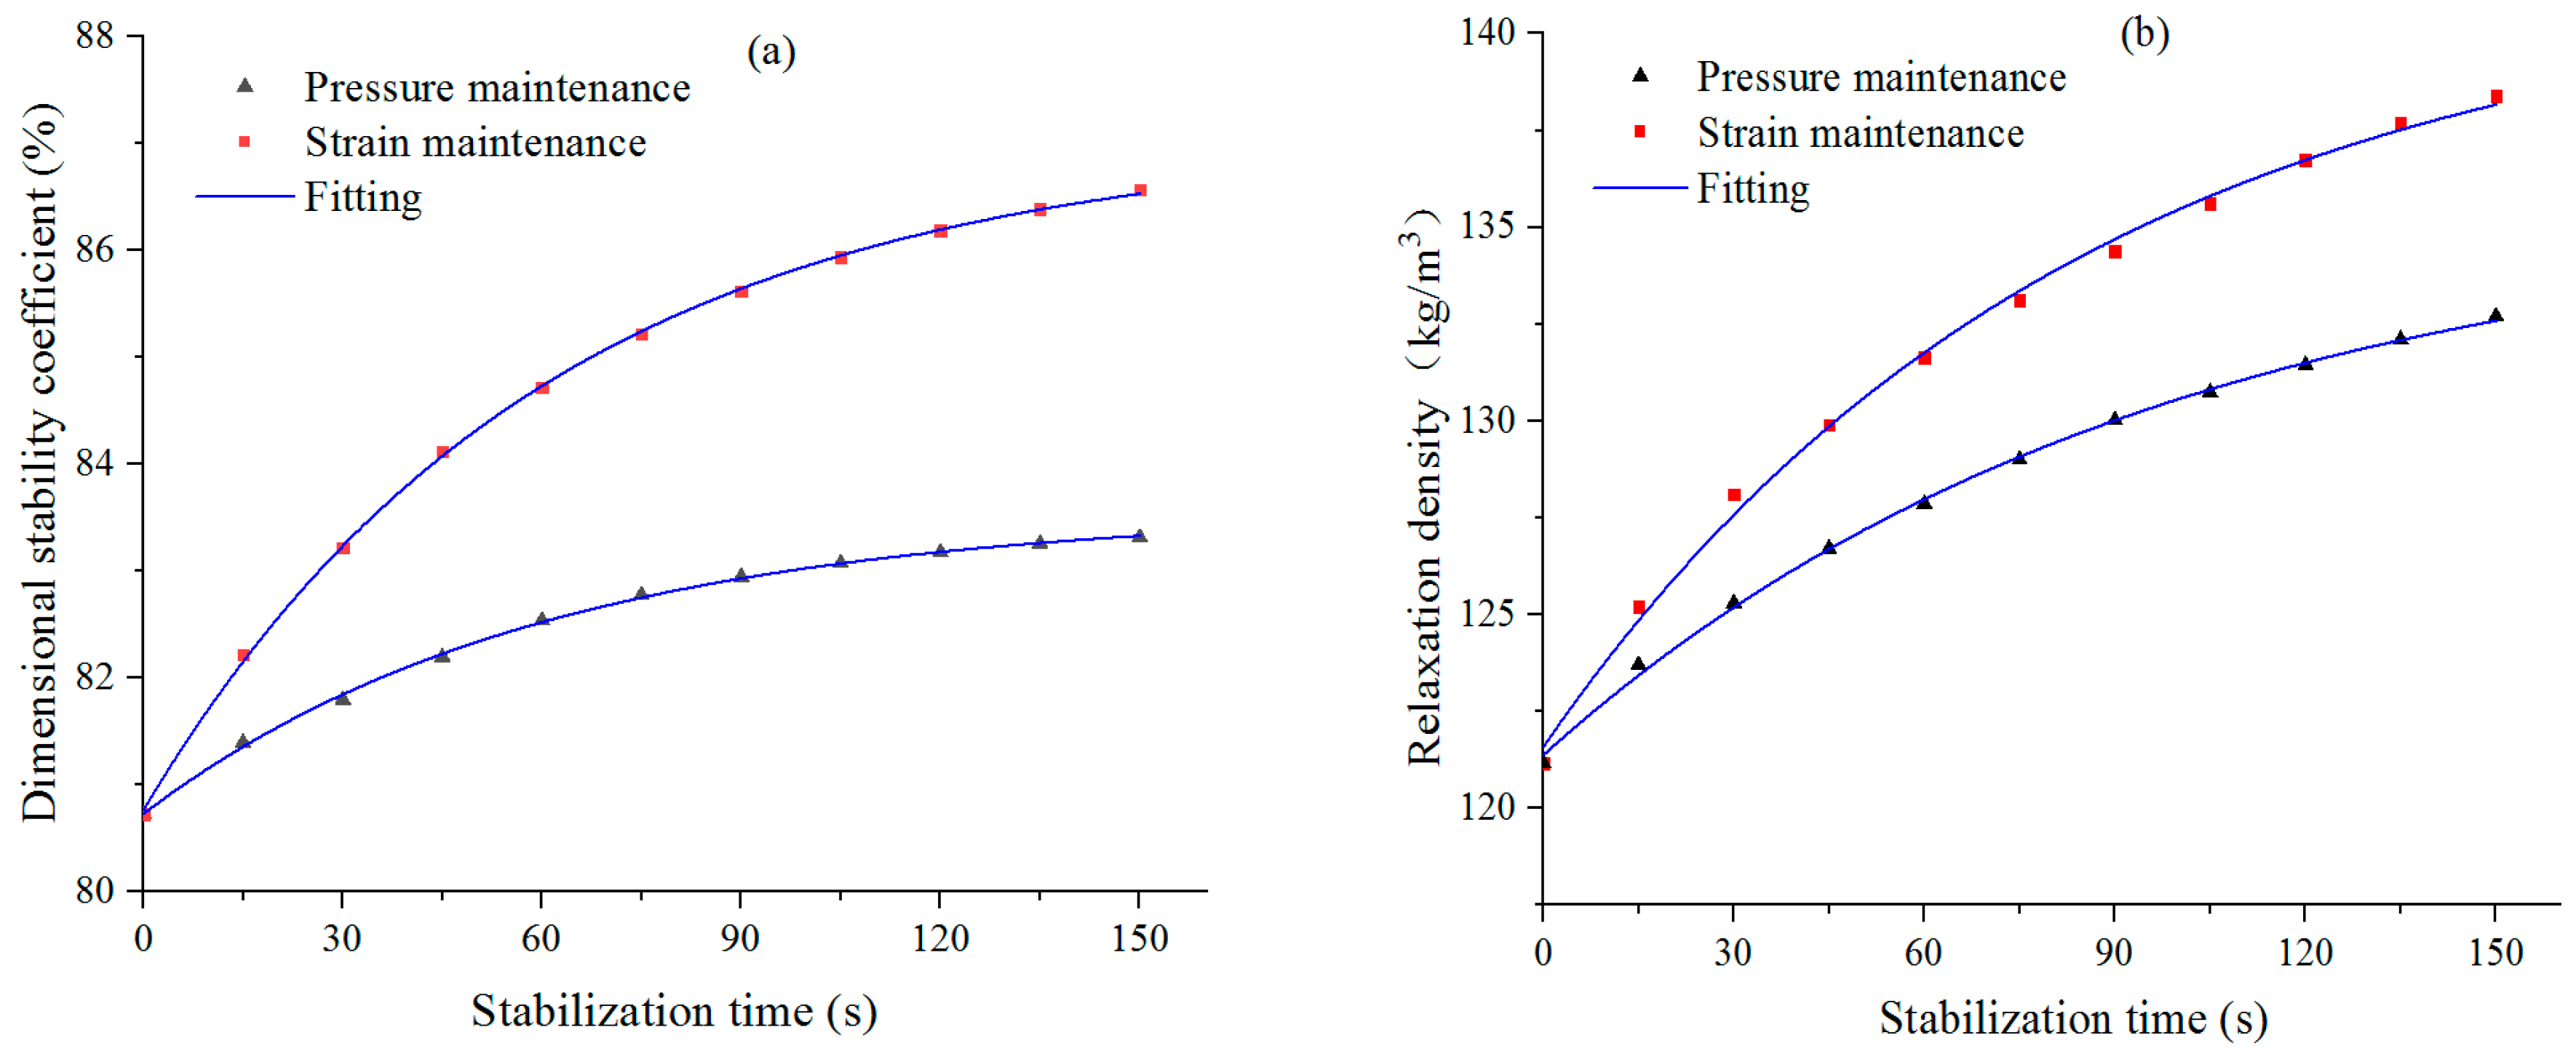
  • The relationships of stabilization time with the dimensional stability coefficient and relaxation density can be both expressed by exponential functions, and the coefficient of determination R2 was larger than 0.99 in both cases. As the stabilization time was prolonged, the dimensional stability coefficient and relaxation density both significantly increased, but the increasing rates declined. Comprehensive consideration of the compression effect, efficiency, energy consumption and significance implies that the stabilization time is 60 s.
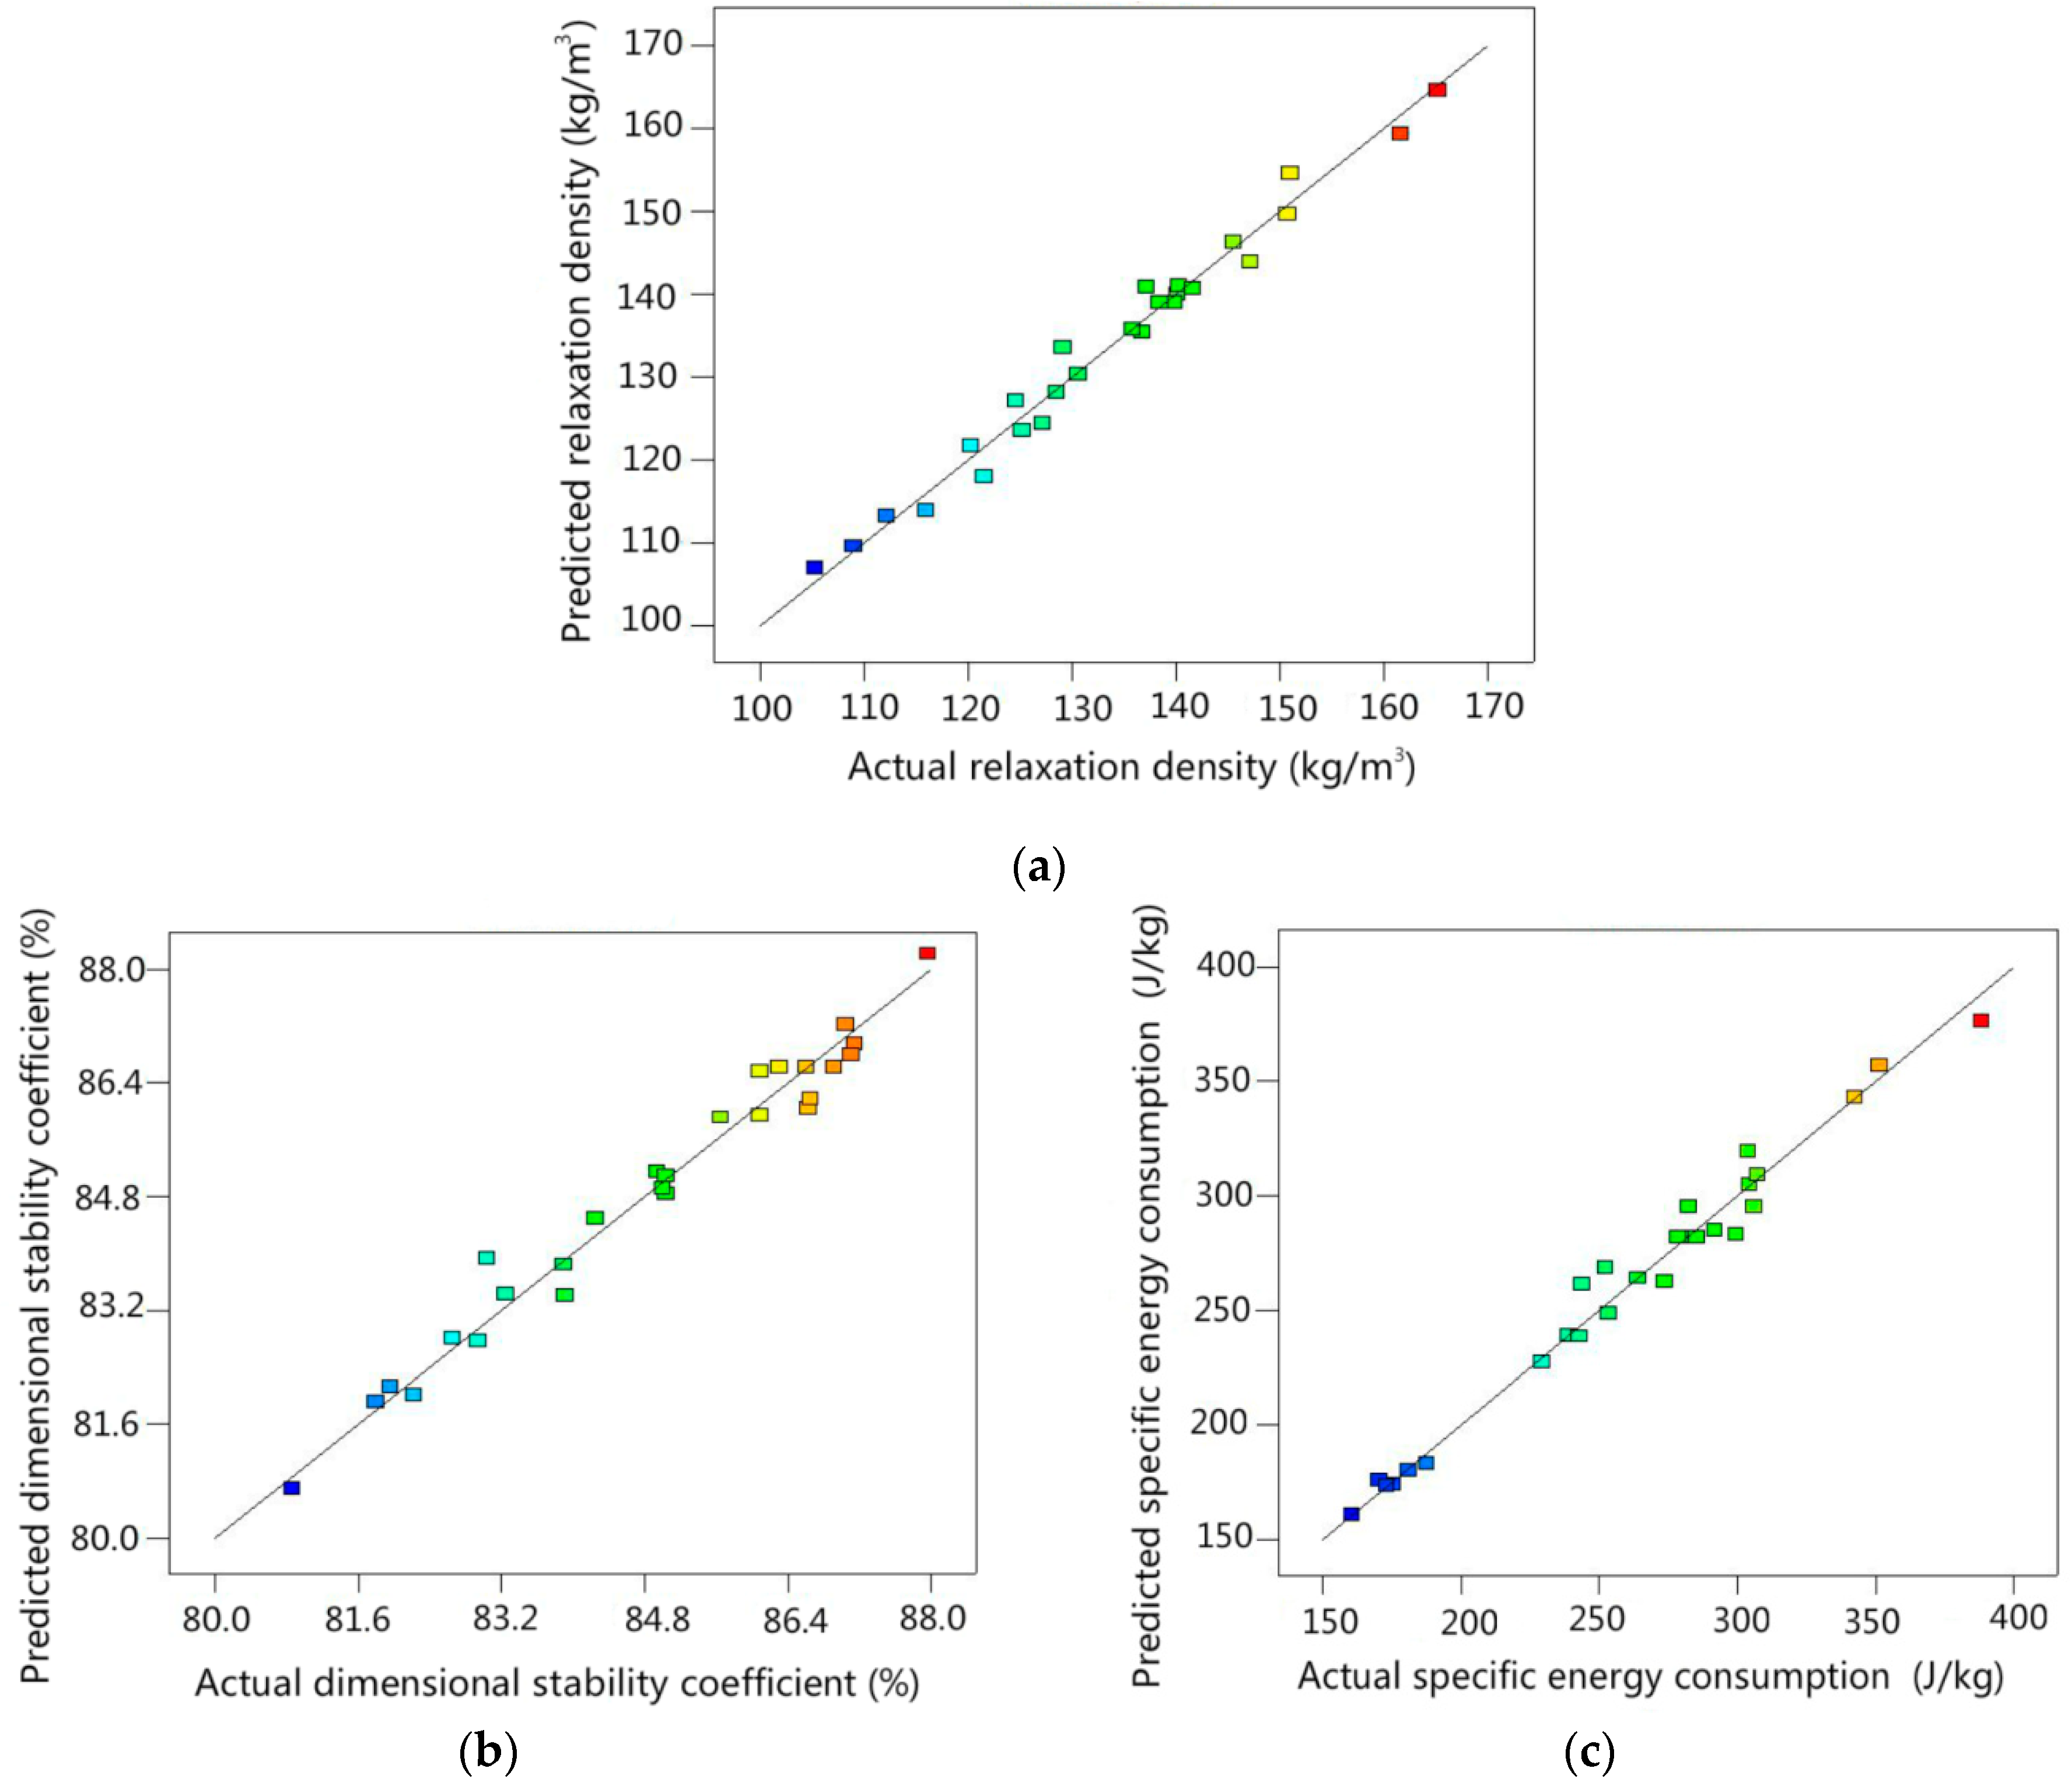
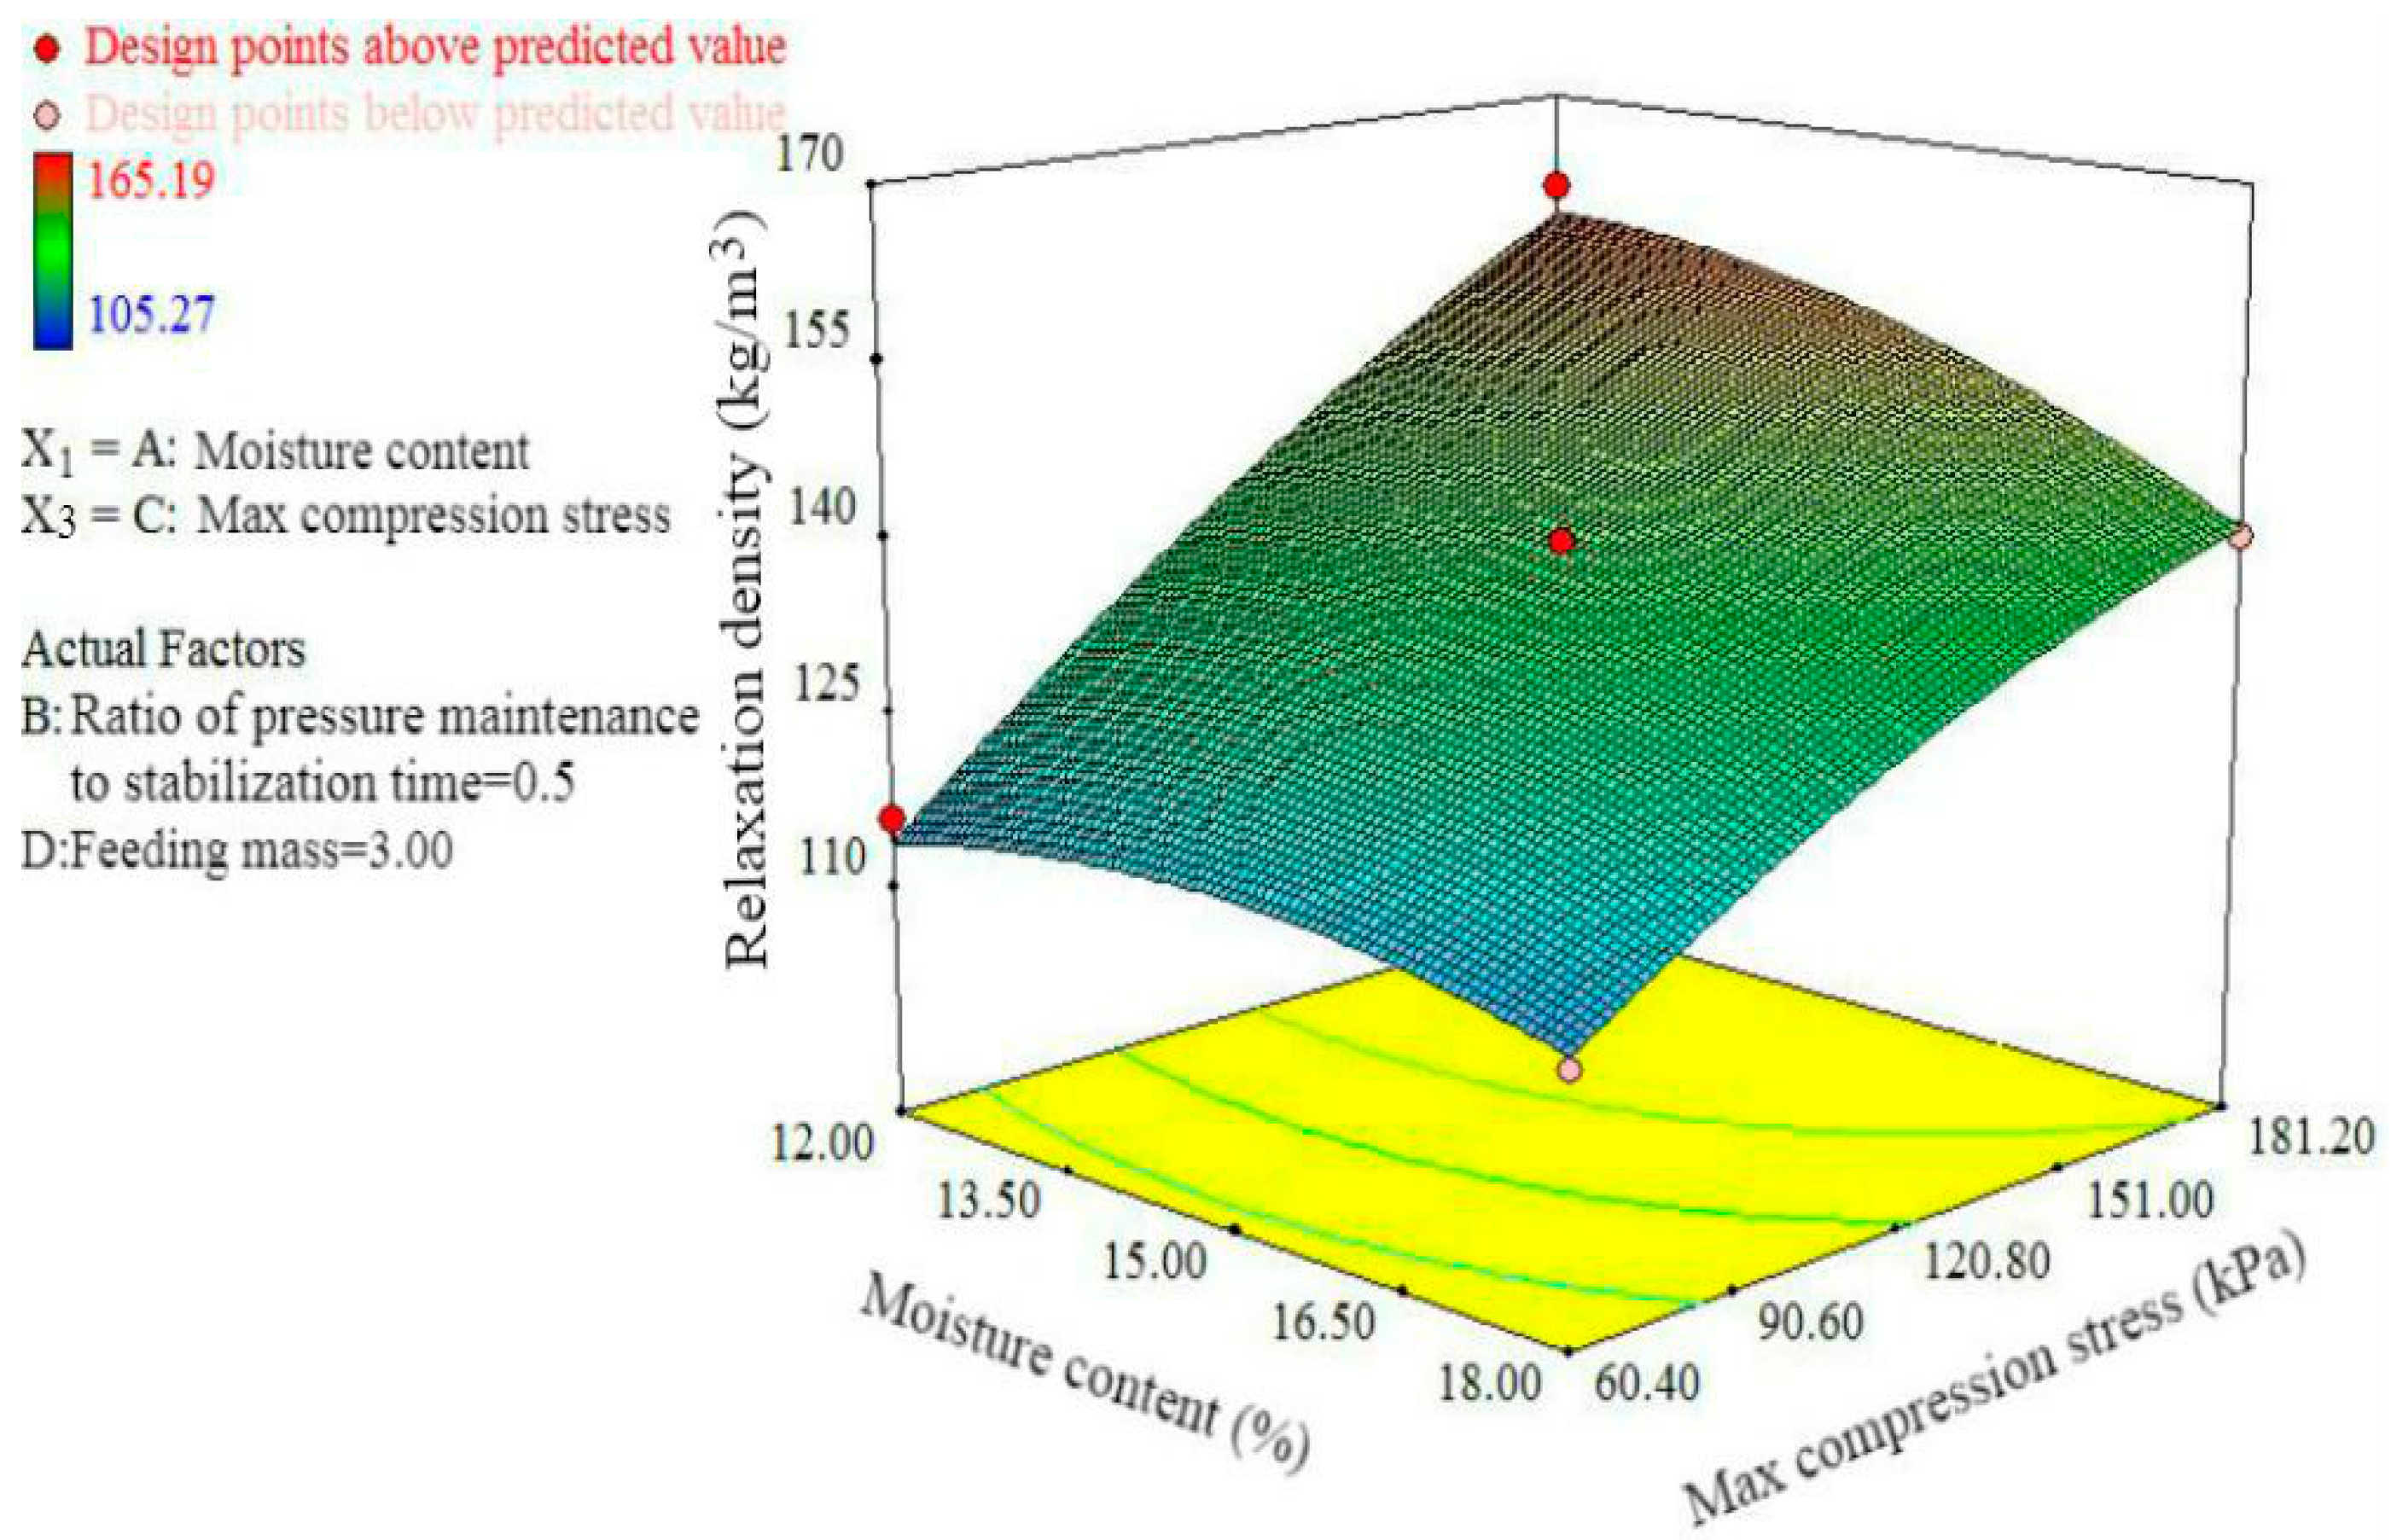
  • Water content, ratio of pressure maintenance time to stabilization time, maximum compression stress, and feeding mass all very significantly affected the dimensional stability coefficient, relaxation density and compression energy consumption. In terms of interaction, the interaction between water content and maximum compression stress significantly affected both relaxation density and specific energy consumption. The interaction between the ratio of pressure maintenance time to stabilization time and feeding mass significantly affected the dimensional stability. The factors and the indices were regressed by quadratic equations, with the coefficients of determination larger than 0.97 in all equations.
  • The optimized process parameters were water content of 13.63%, ratio of pressure maintenance time to stabilization time at 0.38 (pressure maintenance time of 22.8 s, strain maintenance time of 37.2 s), maximum compression stress of 109.58 kPa, and straw feeding mass of 3.5 kg. Under these conditions, the relaxation density of cold-pressed corn straw blocks was 145.63 kg/m3, the dimensional stability coefficient was 86.89%, and specific energy consumption was 245.78 J/kg. The errors between test results and predicted results were less than 2%.
  • The cold-pressed chopped corn straws showed a smaller low calorific value (12.8 MJ/kg) than agricultural coals and were featured by larger volatile content and lower ash content. Moreover, the combustion of the chopped corn straws produced fewer ashes and S- or N-containing polluting gases. Compared with other forms of straw blocks, the cold-pressed chopped straw blocks displayed smaller differences in calorific values and a significantly lower forming energy consumption. From the aspects of use costs, environmental protection and energy sustainability, we suggest cold-pressed chopped corn straw blocks are feasible for heating by farmers. Through the SWOT analysis, our findings may provide a reference for corn straw bundling, cold-press forming processes and straw bale re-compressing, but there are many threats for straw fuel application.

Author Contributions

T.C. and H.J. conceived and designed the experiments; T.C., H.J., S.Z., H.Y. and X.S. performed the experiments; T.C., S.Z. and X.S. analyzed the data; H.J. contributed experiment tools. T.C. and Y.S. contributed to the writing and proofreading of the manuscript. All authors have read and agreed to the published version of the manuscript.

Funding

The authors gratefully acknowledge the financial support from the National Natural Science Foundation of China (Grant No.: 51705191), the National Key Research and Development Program of China (Grant No.: 2018YFD0701102) and Science and Nature Foundation of Jilin province (Grant No.: 20180101090JC).

Acknowledgments

We highly appreciate Cong Yongjian, who is the teacher of the School of Biological and Agricultural Engineering, Jilin University, for corn straws collection.

Conflicts of Interest

The authors declare no conflict of interest.

References

  1. Marks-Bielska, R.; Bielski, S.; Novikova, A.; Romaneckas, K. Straw Stocks as a Source of Renewable Energy. A Case Study of a District in Poland. Sustainability 2019, 11, 4714. [Google Scholar] [CrossRef] [Green Version]
  2. Wang, H.Y.; Wang, F.; Sun, R.H.; Gao, C.Y.; Wang, Y.J.; Sun, N.; Wang, L.; Bi, Y.Y. Policies and regulations of crop straw utilization of foreign countries and its experience and inspiration for China. Trans. Chin. Soc. Agric. Eng. 2016, 32, 216–222. [Google Scholar]
  3. Yuan, X.F.; Li, P.P.; Wang, H.; Wang, X.F.; Cheng, X.; Cui, Z.J. Enhancing the anaerobic digestion of corn stalks using composite microbial pretreatment. J. Microbiol. Biotechnol. 2011, 21, 746–752. [Google Scholar] [CrossRef] [PubMed] [Green Version]
  4. Chen, L.J.; Liao, N.; Li, X.; Han, L.J. Description of Wheat Straw Relaxation Behavior Based on a Fractional-Order Constitutive Model. Agron. J. 2013, 105, 134–142. [Google Scholar] [CrossRef]
  5. Fushimi, A.; Saitoh, K.; Hayashi, K.; Ono, K.; Fujitani, Y.; Villalobos, A.M.; Shelton, B.R.; Takami, A.; Tanabe, K.; Schauer, J.J. Chemical characterization and oxidative potential of particles emitted from open burning of cereal straws and rice husk under flaming and smoldering conditions. Atmos. Environ. 2017, 163, 118–127. [Google Scholar] [CrossRef]
  6. Miao, Z.; Phillips, J.W.; Grift, T.E.; Mathanker, S.K. Measurement of mechanical compressive properties and densification energy requirement of miscanthus × giganteus and switchgrass. BioEnergy Res. 2015, 8, 152–164. [Google Scholar] [CrossRef]
  7. Adapa, P.; Tabil, L.; Schoenau, G. Grinding performance and physical properties of non-treated and steam-exploded barley, canola, oat, and wheat straw. Biomass Bioenergy 2011, 35, 549–561. [Google Scholar] [CrossRef]
  8. Dinesha, P.; Kumar, S.; Rosen, M.A. Biomass Briquettes as an Alternative Fuel: A Comprehensive Review. Energy Technol. 2019, 7, 1801011. [Google Scholar] [CrossRef]
  9. Cong, H.B.; Zhao, L.X.; Meng, H.B. Applicability evaluation of biomass yrolytic poly-generation technology on clean heating in northern rural of China. Trans. Chin. Soc. Agric. Eng. 2018, 34, 8–14. [Google Scholar]
  10. Ma, Y.H.; Xuan, C.Z.; Wu, P.; Yang, J.N.; Su, H.; Zhang, Y. Experiment on stress relaxation of corn stoverduring compression with assisted vibration. Trans. Chin. Soc. Agric. Eng. 2016, 32, 88–94. [Google Scholar]
  11. Ma, F.; Bai, X.W.; Liu, D.J.; Gong, Y.J.; Chen, Z.Y. The typical biomass cold-pressing constitutive model and influence factors analysis of viscous—Elastic—Plasticity. Acta Energy Sol. Sin. 2017, 38, 98–105. [Google Scholar]
  12. Jha, S.K.; Singh, A.; Kumar, A. Physical characteristics of compressed cotton stalks. Biosyst. Eng. 2008, 99, 205–210. [Google Scholar] [CrossRef]
  13. Adapa, P.; Tabil, L.; Schoenau, G. Compaction characteristics of barley, canola, oat and wheat straw. Biosyst. Eng. 2009, 104, 335–344. [Google Scholar] [CrossRef]
  14. Wongsiriamnuay, T.; Nakorn, T. Effect of densification parameters on the properties of maize residue pellets. Biosyst. Eng. 2015, 139, 111–120. [Google Scholar] [CrossRef]
  15. Adapa, P.; Schoenau, G.; Tabil, L. Compression of fractionated sun-cured and dehydrated alfalfa chops into cubes—Specific energy models. Bioresour. Technol. 2007, 98, 38–45. [Google Scholar] [CrossRef]
  16. Chen, T.Y.; Meng, J.; Xing, M.J.; Zhang, Q.; Song, Y.Q. Compaction Behavior of Biochar from Corn Stalk. J. Shenyang Agric. Univ. 2016, 47, 728–733. [Google Scholar]
  17. Li, Y.; Liu, H. High-pressure densification of wood residues to form an upgraded fuel. Biomass Bioenergy 2000, 19, 177–186. [Google Scholar] [CrossRef]
  18. Panwar, V.; Prasad, B.; Wasewar, K.L. Biomass Residue Briquetting and Characterization. J. Energy Eng. 2011, 137, 108–114. [Google Scholar] [CrossRef]
  19. Zhang, X.Y.; Gao, B.; Zhao, S.N.; Wu, P.F.; Han, L.J.; Liu, X. Optimization of a ‘coal-like’pelletization technique based on the sustainable biomass fuel of hydrothermal carbonization of wheat straw. J. Clean. Prod. 2020, 242, 118426. [Google Scholar] [CrossRef]
  20. Henriksson, L.; Frodeson, S.; Berghel, J.; Andersson, S.; Ohlson, M. Bioresources for sustainable pellet production in Zambia: Twelve biomasses pelletized at different moisture contents. BioResources 2019, 14, 2550–2575. [Google Scholar]
  21. Stasiak, M.; Molenda, M.; Bańda, M.; Wiącek, J.; Parafiniuk, P.; Gondek, E. Mechanical and combustion properties of sawdust-Straw pellets blended in different proportions. Fuel Process. Technol. 2017, 156, 366–375. [Google Scholar] [CrossRef]
  22. Said, N.; Daiem, M.M.A.; García-Maraver, A.; Zamorano, M. Influence of densification parameters on quality properties of rice straw pellets. Fuel Process. Technol. 2015, 138, 56–64. [Google Scholar] [CrossRef]
  23. Mani, S.; Tabil, L.G.; Sokhansanj, S. Specific energy requirement for compacting corn stover. Bioresour. Technol. 2006, 97, 1420–1426. [Google Scholar] [CrossRef] [PubMed]
  24. Kashaninejad, M.; Tabil, L.G.; Knox, R. Effect of compressive load and particle size on compression characteristics of selected varieties of wheat straw grinds. Biomass Bioenergy 2014, 60, 1–7. [Google Scholar] [CrossRef]
  25. Gong, C.; Lu, D.; Wang, G. Compression characteristics and energy requirement of briquettes made from a mixture of corn stover and peanut shells. BioResources 2015, 10, 5515–5531. [Google Scholar] [CrossRef] [Green Version]
  26. Lu, D.H.; Tabil, L.G.; Wang, D.C.; Wang, G.H.; Wang, Z.Q. Optimization of binder addition and compression load for pelletization of wheat straw using response surface methodology. Int. J. Agric. Biol. Eng. 2014, 7, 67–78. [Google Scholar]
  27. Tumuluru, J.S.; Tabil, L.G.; Song, Y.Q.; Iroba, K.L.; Meda, V. Impact of process conditions on the density and durability of wheat, oat, canola, and barley straw briquettes. BioEnergy Res. 2015, 8, 388–401. [Google Scholar] [CrossRef] [Green Version]
  28. Temmerman, M.; Rabier, F.; Jensen, P.D.; Hartmann, H.; Bohm, T. Comparative study of durability test methods for pellets and briquettes. Biomass Bioenergy 2006, 30, 964–972. [Google Scholar] [CrossRef]
  29. Kashaninejad, M.; Tabil, L.G. Effect of microwave-chemicalpre-treatment on compression characteristics of biomassgrinds. Biosyst. Eng. 2011, 108, 36–45. [Google Scholar] [CrossRef]
  30. Mostafa, M.E.; Hu, S.; Wang, Y.; Su, S.; Hu, X.; Elsayed, S.A.; Xiang, J. The signifcance of pelletization operating conditions: An analysis of physical and mechanical characteristics as well as energy consumption of biomass pellets. Renew. Sustain. Energy Rev. 2019, 105, 332–348. [Google Scholar] [CrossRef]
  31. Shaw, M.D. Feedstock and Process Variables Influencing Biomass Densification. Master’s Thesis, University of Saskatchewan, Saskatoon, SK, Canada, 2008. [Google Scholar]
  32. Adapa, P.K.; Tabil, L.G.; Schoenau, G.J. Factors affecting the quality of biomass pellet for biofuel and energy analysis of pelleting process. Int. J. Agric. Biol. Eng. 2013, 6, 1–12. [Google Scholar]
  33. Mani, S.; Tabil, L.G.; Sokhansanj, S. Effects of compressive force, particle size and moisture content on mechanical properties of biomass pellets from grasses. Biomass Bioenergy. 2006, 30, 648–654. [Google Scholar] [CrossRef]
  34. Guo, L.; Wang, D.F.; Tabil, L.G.; Wang, G.H. Compression and relaxation properties of biomass for briquetting. Biosyst. Eng. 2016, 148, 101–110. [Google Scholar] [CrossRef]
  35. Kaliyan, N.; Morey, R.V. Factors affecting strength and durability of densified products. In Proceedings of the Annual International Meeting, Portland, OR, USA, 9–12 July 2006; Paper Number 066077. American Society of Agricultural and Biological Engineers: St. Joseph, MI, USA, 2006. [Google Scholar]
  36. Kaliyan, N.; Morey, R.V. Densification characteristics of corn stover and switchgrass. In Proceedings of the ASABE Annual International Meeting, Portland, OR, USA, 9–12 July 2006; Paper Number 066174. American Society of Agricultural and Biological Engineers: St. Joseph, MI, USA, 2006. [Google Scholar]
  37. Yan, C.Z. Study on the Comoression Performance and Rheological Properties of Straw Bales. Master’s Thesis, Nanjing Agricultural University, Nanjing, China, 2015. [Google Scholar]
  38. Jayakumar, E.; Chittibabu, S.; Shanmugasundaram, S.; Tabil, L.G. Synergetic effect of microwave heated alkali pre-treatment on densification of rice (Oryza sativa) husk biomass grinds. Energy Sources Part A Recovery Util. Environ. Eff. 2019, 8, 1–11. [Google Scholar]
  39. Okot, D.K.; Bilsborrow, P.E.; Phan, A.N. Briquetting characteristics of bean straw-maize cob blend. Biomass Bioenergy 2019, 126, 150–158. [Google Scholar] [CrossRef]
  40. Guo, L.; Tabil, L.G.; Wang, D.C.; Wang, G.H. Influence of moisture content and hammer mill screen size on the physical quality of barley, oat, canola and wheat straw briquettes. Biomass Bioenergy 2016, 94, 201–208. [Google Scholar] [CrossRef]
  41. Brand, M.A.; Jacinto, R.C.; Antunes, R.; Cunha, A.B.D. Production of briquettes as a tool to optimize the use of waste from rice cultivation and industrial processing. Renew. Energy 2017, 111, 116–123. [Google Scholar] [CrossRef]
  42. ASABE Standards. S358.2, Moisture Measurement–Forages; American Society of Agricultural and Biological Engineers: St. Joseph, MI, USA, 2008. [Google Scholar]
  43. Zvicevicius, E.; Raila, A.; Cipliene, A.; Cerniauskiene, Z.; Kadziuliene, Z.; Tilvikiene, V. Effects of moisture and pressure on densification process of raw material from, Artemisia dubia, Wall. Renew. Energy 2018, 119, 185–192. [Google Scholar] [CrossRef]
  44. Cui, X.Y.; Yang, J.H.; Shi, X.Y.; Lei, W.N.; Huang, T.; Bai, C. Pelletization of Sunflower Seed Husks: Evaluating and Optimizing Energy Consumption and Physical Properties by Response Surface Methodology (RSM). Processes 2019, 591, 591. [Google Scholar] [CrossRef] [Green Version]
  45. Tumuluru, J.S. Pelleting of pine and switchgrass blends: Effect of process variables and blend ratio on the pellet quality and energy consumption. Energies 2019, 12, 1198. [Google Scholar] [CrossRef] [Green Version]
  46. Kaliyan, N.; Morey, R.V. Constitutive model for densification of corn stoverand switchgrass. Biosyst. Eng. 2009, 104, 47–63. [Google Scholar] [CrossRef]
  47. Li, W. Study on Creep Properties Maize Straw Rubbed During Open Compression. Master’s Thesis, Inner Mongolia Agricultural University, Huhhot, China, 2011. [Google Scholar]
  48. Tooyserkani, Z.; Kumar, L.; Sokhansanj, S.; Saddler, J.; Bi, X.T.; Lim, J.C.; Lau, A.; Melin, S. SO2–Catalyzed steam pretreatment enhances the strength and stability of soft wood pellets. Bioresour. Technol. 2013, 130, 59–68. [Google Scholar] [CrossRef] [PubMed]
  49. Ma, L.; Daemen, J.J.K. An experimental study on creep of welded tuff. Int. J. Rock Mech. Min. Sci. 2006, 43, 282–291. [Google Scholar] [CrossRef]
  50. Yu, H.C.; Shi, G.C.; Liu, H.D.; Deng, X.B.; Cui, X.L.; Pan, G.Z.; Xi, W. A nonlinear viscoelastic stress relaxation model of rock based on Fractional calculus. J. Basic Sci. Eng. 2019, 27, 199–209. [Google Scholar]
  51. Theerarattananoon, K.; Xu, F.; Wilson, J.; Ballard, R.; Mckinney, L.; Staggenborg, S.; Vadlani, P.; Pei, Z.J.; Wang, D. Physical properties of pellets made from sorghum stalk, corn stover, wheat straw, and big bluestem. Ind. Crop Prod. 2011, 33, 325–332. [Google Scholar] [CrossRef]
  52. Wang, J.; Liu, S.Y.; Zhang, P.; Yuan, F.; Lu, J.; Liu, T.T. Study on combustion characteristics of baled corn stalk. Acta Energy Sol. Sin. 2018, 39, 3499–3504. [Google Scholar]
  53. Jia, J.X.; Yao, Z.L.; Zhao, L.X.; Cong, H.B.; Liu, G.H.; Zhao, Y.N. Design and emission characteristics of straw bales fuel combustion-boiler. Trans. Chin. Soc. Agric. Eng. 2019, 35, 148–153. [Google Scholar]
  54. Hu, J.J.; Lei, T.Z.; Xu, G.Y.; Shen, S.Q.; Liu, J.W. Experimental study of stress relaxation in the process of cold molding with straw. BioResources 2009, 4, 1158–1167. [Google Scholar]
  55. Herak, D.; Kabutey, A.; Choteborsky, R.; Petru, M.; Sigalingginga, R. Mathematical models describing the relaxation behaviour of Jatropha curcas L. bulk seeds under axial compression. Biosyst. Eng. 2015, 131, 77–83. [Google Scholar] [CrossRef]
  56. Stelte, W.; Holm, J.K.; Sanadi, A.R.; Barsberg, S.; Ahrenfeldt, J.; Henriksen, U.B. Fuel pellets from biomass: The importance of the pelletizing pressure and its dependency on the processing conditions. Fuel 2011, 90, 3285–3290. [Google Scholar] [CrossRef] [Green Version]
  57. Unpinit, T.; Poblarp, T.; Sailoon, N.; Wongwicha, P.; Thabuot, M. Fuel properties of biopellets produced from selected materials under various compacting pressure. Energy Procedia 2015, 79, 657–662. [Google Scholar] [CrossRef] [Green Version]
  58. Lisowski, A.; Pajor, M.; Świętochowski, A.; Dabrowska, M.; Klonowski, J.; Mieszkalski, L.; Ekielski, A.; Stasiak, M.; Piatek, M. Effects of moisture content, temperature, and die thickness on the compaction process, and the density and strength of walnut shell pellets. Renew. Energy 2019, 141, 770–781. [Google Scholar] [CrossRef]
  59. Yang, M.S. Rheology of Agricultural Materials, 1st ed.; China Agriculture Press: Beijing, China, 2010; pp. 56–79. [Google Scholar]
  60. Iftikhar, M.; Asghar, A.; Ramzan, N.; Sajjadi, B.; Chen, W.Y. Biomass densification: Effect of cow dung on the physicochemical properties of wheat straw and rice husk based biomass pellets. Biomass Bioenergy 2019, 122, 1–16. [Google Scholar] [CrossRef]
  61. Li, H.; Jiang, L.B.; Li, C.Z.; Liang, J.; Yuan, X.Z.; Xiao, Z.H. Co-pelletization of sewage sludge and biomass: The energy input and properties of pellets. Fuel Process. Technol. 2015, 132, 55–61. [Google Scholar] [CrossRef]
  62. Greinert, A.; Mrówczy’nska, M.; Szefner, W. Study on the possibilities of natural use of ash granulate obtained from the combustion of pellets from plant biomass. Energies 2019, 12, 2569. [Google Scholar] [CrossRef] [Green Version]
  63. Toscano, G.; Alfano, V.; Scarfone, A.; Pari, L. Pelleting vineyard pruning at low cost with a mobile technology. Energies 2018, 11, 2477. [Google Scholar] [CrossRef] [Green Version]
  64. Falemara, B.C.; Joshua, V.I.; Aina, O.O.; Nuhu, R.D. Performance evaluation of the physical and combustion properties of briquettes produced from agro-wastes and wood residues. Recycling 2018, 3, 37. [Google Scholar] [CrossRef] [Green Version]
  65. Houshfar, E.; Løvås, T.; Skreiberg, Ø. Experimental Investigation on NOx Reduction by Primary Measures in Biomass Combustion: Straw, Peat, Sewage Sludge, Forest Residues and Wood Pellets. Energies 2012, 5, 270–290. [Google Scholar] [CrossRef] [Green Version]
  66. Zajac, G.; Szyszlak-Bargłowicz, J.; Gołebiowski, W.; Szczepanik, M. Chemical Characteristics of Biomass Ashes. Energies 2018, 11, 2885. [Google Scholar] [CrossRef] [Green Version]
  67. Han, J.; Liu, X.H.; He, J.D. Experimental study on the combustion of typical coal fuels in domestic decoupling stoves. Chin. J. Pro. Eng. 2019. [Google Scholar] [CrossRef]
  68. Zhao, X.Q.; Zhang, J.; Song, Z.L.; Liu, H.Z.; Li, L.X.; Ma, C.Y. Microwave pyrolysis of straw bale and energy balance analysis. J. Anal. Appl. Pyrolysis 2011, 92, 43–49. [Google Scholar] [CrossRef]
  69. Saletnik, B.; Zagula, G.; Bajcar, M.; Czernicka, M.; Puchalski, C. Biochar and Biomass Ash as a Soil Ameliorant: The Effect on Selected Soil Properties and Yield of Giant Miscanthus (Miscanthus x giganteus). Energies 2018, 11, 2535. [Google Scholar] [CrossRef] [Green Version]
  70. Lanzerstorfer, C. Combustion of Miscanthus: Composition of the Ash by Particle Size. Energies 2019, 12, 178. [Google Scholar] [CrossRef] [Green Version]
  71. El-Sayed, S.A.; Mohamed, M.K.E. Mechanical properties and characteristics of wheat straw and pellets. Energy Environ. 2018, 29, 1224–1246. [Google Scholar] [CrossRef]
  72. Mani, S.; Tabil, L.G.; Sokhansanj, S. Evaluation of compaction equations applied to four biomass species. Can. Biosyst. Eng. 2004, 46, 355–361. [Google Scholar]
  73. Kaliyan, N.; Schmidt, D.R.; Morey, R.V.; Tiffany, D.G. Commercial Scale Tub Grinding of Corn Stover and Perennial Grasses. Appl. Eng. Agric. 2012, 28, 79–85. [Google Scholar] [CrossRef]
  74. Bai, X.W. Process Parameters Optimization and Mechanical Simulation in Densification of Corn Stalk Powder. Ph.D. Thesis, Shenyang Agricultural University, Shenyang, China, 2014. [Google Scholar]
  75. Zhang, Y.; Zhang, Z.; Zhou, Y.; Dong, R. The Influences of Various Testing Conditions on the Evaluation of Household Biomass Pellet Fuel Combustion. Energies 2018, 11, 1131. [Google Scholar] [CrossRef] [Green Version]
  76. Huo, L.L.; Zhao, L.X.; Meng, H.B.; Yao, Z.L. Study on straw multi-use potential in China. Trans. Chin. Soc. Agric. Eng. 2019, 35, 218–224. [Google Scholar]
Figure 1. Instruments and procedures. (a) The straw compression and test system; (b) magnified figure; (c) compression procedure.
Energies 13 00652 g001
Figure 2. Effects of time on dimensional stability coefficient and relaxation density under different stabilization processes (water content of raw materials of 15%, maximum compression stress of 120.8 kPa, feeding mass of 3 kg). (a) Effects of time on dimensional stability coefficient under different stabilization processes; (b) Effects of time on relaxation density under different stabilization processes.
Energies 13 00652 g002
Figure 3. Predicted vs. actual values of compression indicator (a) Predicted vs. actual values of relaxation density. (b) Predicted vs. actual values of dimensional stability coefficient. (c) Predicted vs. actual values of specific energy consumption.
Energies 13 00652 g003
Figure 4. Effects of moisture content and max compression stress on relaxation density (ratio of pressure maintenance to stabilization time of 0.5 and feeding mass of 3 kg).
Energies 13 00652 g004
Figure 5. Effects of the ratio of pressure maintenance to stabilization time and feeding mass on dimensional stability coefficient (moisture content of 15% and max compression stress of 180.2 kPa).
Energies 13 00652 g005
Figure 6. Effects of moisture content and max compression stress on specific energy consumption (ratio of pressure maintenance to stabilization time of 0.5 and feeding mass of 3 kg).
Energies 13 00652 g006
Table 1. Actual and coded levels of compression process conditions.
Independent VariablesSymbolsCoded and Actual Levels
−101
Moisture content (%)x1121518
Ratio of pressure maintenance to stabilization timex200.51
Max compression stress (kPa)x360.4120.8181.2
Feeding mass (kg)x42.533.5
Table 2. The fitting results of dimensional stability coefficient and relaxation density under different stabilization processes.
Stabilization WayDimensional Stability Coefficient (%)Relaxation Density (kg/m3)
Fitting EquationR2Fitting EquationR2
Pressure maintenancey = 83.56 − 2.83 × exp (−x/59.84)0.999y = 135.53 − 14.15 × exp (−x/83.75)0.999
Strain maintenancey = 87.05 − 6.28 × exp (−x/60.1)0.999y = 141.48 − 19.89 × exp (−x/83.75)0.997
Table 3. Effects of stabilization time on dimensional stability coefficient and relaxation density as well as significance analysis.
Stabilization WayStabilization Time (s)Indicators
Dimensional Stability Coefficient (%)Relaxation Density (kg/m3)
Pressure maintenance4582.20 ± 0.11 a126.71 ± 0.44 a
6082.54 ± 0.11 b127.86 ± 0.56 b
7582.78 ± 0.16 b129.00 ± 0.61 b
9082.95 ± 0.17 b130.02 ± 0.54 b
Strain maintenance4584.12 ± 0.22 a129.89 ± 0.54 a
6084.72 ± 0.25 b131.63 ± 0.58 b
7585.22 ± 0.26 b133.12 ± 0.64 c
9085.62 ± 0.23 b134.39 ± 0.69 c
Data are shown as their replicate mean ± standard deviation. a–c Means followed by different superscripts in the same column are of significant difference at P < 0.05. a–c Means followed by the same superscripts in the same column are not of significant difference at P > 0.05.
Table 4. Mean values of relaxation density, dimensional stability coefficient and specific energy consumption based on the Box–Behnken design.
Test NumberFactorsIndicators
Moisture Content x1 (%)Ratio of Pressure Maintenance to Stabilization Time x2Max Compression Stress x3 (kPa)Feeding Mass x4 (kg)Relaxation Density (kg/m3)Dimensional Stability Coefficient (%)Specific Energy Consumption (J/kg)
1−1−100129.0787.15299.56
21−100125.2082.94239.00
3−1100124.5785.04304.27
41100121.5180.86243.75
500−1−1120.2384.94175.29
6001−1150.9883.90342.45
700−11127.1287.11160.52
80011165.1986.63307.25
9−100−1147.1486.65282.40
10100−1130.5881.96253.51
11−1001145.4987.97252.31
121001137.1283.04229.33
130−1−10108.9485.65170.51
1401−10105.2783.25187.68
150−110150.7584.25303.82
160110140.1182.65351.40
17−10−10115.9687.05180.98
1810−10112.1383.91173.02
19−1010161.5986.09388.29
201010140.2482.22306.00
210−10−1136.7385.04264.00
22010−1128.4781.8291.87
230−101141.5986.09242.85
240101135.7885.00273.70
250000138.6386.31280.98
260000139.8086.92285.36
270000138.4086.61278.63
Table 5. Response model fit summary output for relaxation density, dimensional stability coefficient and specific energy consumption.
IndicatorsR2Adjusted R2Predicted R2Predicted Precision
Relaxation density0.980.960.8925.79
Dimensional stability coefficient0.970.940.8521.38
Specific energy consumption0.980.960.8823.25
Table 6. Summary of analysis of variance (ANOVA) results for all responses.
SourceRelaxation DensityDimensional Stability CoefficientSpecific Energy Consumption
Sum of SquaresdfF ValueP ValueSum of SquaresdfF ValueP ValueSum of SquaresdfF ValueP Value
Model5611.321444.55<0.01 **991431.69<0.01 **88772.51440.99<0.01 **
x1271.13130.13<0.01 **52.171233.76<0.01 **5772.85137.32<0.01 **
x2111.45112.39<0.01 **13.06158.53<0.01 **1472.5319.52<0.01 **
x34004.421445.04<0.01 **3.17114.22<0.01 **75400.041487.39<0.01 **
x4121.35113.49<0.01 **11.12149.82<0.01 **1717.46111.1<0.01 **
x1x20.1610.020.890100.980100.1
x1x376.7418.530.01 *0.1310.60.451381.2418.930.01 *
x1x416.7711.860.20.110.070.88.7310.060.82
x2x312.1511.350.270.1610.720.41231.1911.490.25
x2x41.510.170.691.1615.180.04 *2.2210.010.91
x3x413.411.490.250.0810.350.56104.3510.670.43
x 1 2 87.6219.74<0.01 **6.21127.85<0.01 **198.411.280.28
x 2 2 469.21152.15<0.01 **15.86171.08<0.01 **69.1410.450.52
x 3 2 50.0915.570.04 *2.87112.85<0.01 **1976.42112.78<0.01 **
x 4 2 156.92117.44<0.01 **0.9614.280.061317.4118.520.01 *
Lack of Fit106.851018.960.052.49102.680.31833.071015.710.06
** Extremely significant level (P < 0.01); * Significant level (P < 0.05).
Table 7. Elemental analysis, industrial analysis, and calorific value of straw blocks and agricultural coals.
Fuel TypeElemental Analysis (%)Industrial Analysis (%)Low Calorific Value (MJ/kg)Ref.
CadHadNadSadOadMadAadVadFad
Straws briquette41.65.550.740.238.3710.423.7879.686.1212.8This paper
Bituminous lump coal68.244.521.340.578.794.0112.5339.2644.228.27[67]
Anthracite lump coal81.732.781.260.3222.539.387.2180.8831.1
Lump semicoke71.740.640.780.480.322.4923.558.4665.523.86
Briquette coal61.273.911.170.438.871.4522.933.2642.3923.27
Table 8. The burning characteristics, forming energy consumption, and use costs compared among different forms of corn straws.
Molding MethodMaterial CharacteristicsDensity (kg/m3)Low Calorific Value (MJ/kg-1)Specific Energy Consumption (kJ/kg)Heating Fuel Cost B ($·m-2)Ref.
MillingCompressionTotal A
Straw bale10–100 mm108.812.50.4–0.90.4–0.91.53–2.05[53]
Cold compression10–100 mm145.6312.80.250.25This paper
5.6 mm650–95025.06–66112–3037.06–691[33]
Heat compression1.4 mm81113.425.06–661282307.06–9433.47–4.62[47,53,74]
0.66–0.8 mm830–100025.06–661189214.06–850[36,53,72]
A Total specific energy consumption = milling specific energy consumption + compression specific energy consumption. B Heating fuel cost = straw cost + electricity costs.
Table 9. The SWOT analysis of cold-pressed chopped corn straws for fuel.
SWOTItems
Strengths1. Low cost for compression molding.
2. Higher efficiency due to the avoidance of crushing.
3. Cold-pressed blocks are clean fuels that can reduce pollution.
Weaknesses1. Low the calorific value.
Opportunities1. The optimized cold-pressed process can be used for baling.
2. The straw bales can be re-compressed to improve density according to the optimized process.
3. Cold-pressed blocks for rural heating can reduce transport and storage costs.
4. The straws are recycled, and the burning residues can be returned as fertilizers to farmlands.
Threats1. Mechanical cold-pressed equipment is needed.
2. Special furnaces and flue gas purification equipment are needed for block combustion.

