Article

Identification, Categorisation and Gaps of Safety Indicators for U-Space

by
Javier Alberto Pérez-Castán
1,*,
Fernando Gómez Comendador
1,
Ana Belén Cardenas-Soria
1,
Dominik Janisch
2 and
Rosa M. Arnaldo Valdés
1
1
Aerospace Systems, Air Transport and Airports, Universidad Politécnica de Madrid, 28040 Madrid, Spain
2
Centro de Referencia de Investigación Desarrollo e Innovación, ATM A.I.E., Avenida de Aragón 402, 28022 Madrid, Spain
*
Author to whom correspondence should be addressed.
Energies 2020, 13(3), 608; https://doi.org/10.3390/en13030608
Submission received: 13 December 2019 / Revised: 26 January 2020 / Accepted: 27 January 2020 / Published: 31 January 2020
(This article belongs to the Special Issue Modelling of Aerospace Vehicle Dynamics)

Abstract

:
Many civilian applications of commercial unmanned aircraft are being planned to operate in the years ahead. Several countries have developed their own framework to design the operation of unmanned aircraft and the different services that demand safe operation. This paper focuses on the European framework denoted as U-space which concludes with the joint integration of manned and unmanned aircraft in the airspace. U-space is a set of novel services and specific procedures designed to provide safe and efficient access into the airspace to the airspace users. U-space constitutes a management system to organise unmanned operations and provides relevant information to drone operators as well as manned aircraft, air navigation service providers and authorities. The understanding of associated hazards and risks to unmanned aircraft is a critical issue for their operation in complex and non-segregated airspaces. The safety assessment developed herein is crucial to identify safety indicators for U-space. In addition, the identification of safety indicators was used to identify gaps in U-spaces services that are not correctly covered by the U-space framework. Particularly, several safety indicators are identified that currently U-space services do not consider and can imply an increase in the operational risk of unmanned operations.

1. Introduction

During the last years, the potential of exploitation of unmanned aircraft shifted from the military to the civil domain [1]. In the short term, defence and recreation will continue being the greater market for business involving unmanned aircraft. However, the use of such vehicles for agriculture applications, infrastructure surveillance and urban transport shows promising growth in the long term [2]. Particularly, the European market associated with unmanned aircraft is expected to represent more than EUR5 billion by 2035 [2]. This expansion is underlined by further technological development, which makes the operation of small and affordable unmanned aircraft in low-altitude airspaces feasible, and paves the way for a large variety of civil markets to grow.
This is a point of major concern for air navigation service providers (ANSPs) as the growth of unmanned aircraft force the air traffic management (ATM) system to include new airspace users. Forecasts anticipate that more than seven million unmanned operators will operate in Europe in 2050 [3]. The major concerns focused on the safe and controlled operation of unmanned operations in very low level (VLL) airspace, and the resulting necessity to develop a drone-specific air traffic control (ATC) system. The integration of unmanned aircraft is a highly complex challenge, because of the large variety of drones, operational characteristics and proximity to the ground. Unmanned traffic management (UTM) is the evolution of the concept of ATM. UTM is a broadly extended concept, although it receives a different denotation depending on the geographical area of its deployment:
  • NASA developed the first UTM framework in 2013 which was adopted by the Federal Aviation Administration (FAA) to develop its implementation in the United States [4]. UTM framework foresees three operational environments for unmanned aircraft: operations in uncontrolled airspace, operations within controlled airspace but segregated from manned aircraft and joint operations with manned aircraft in controlled airspace.
  • Europe’s roadmap for unmanned aircraft is denoted as U-space [5]. U-space encompasses the integration for every airspace and airspace user. The main goal is to introduce unmanned air traffic gradually into the airspace, starting from lower airspace volumes and expanding to higher airspace classes until achieving full integration with manned aircraft.
  • Civil UAS Operation Management System (UOMS) is the UTM system proposed by the Chinese government [6]. UOMS is a cloud system coordinated with unmanned operators that allow the flight management in real-time with ATM system, it supports communications between unmanned aircraft and provides information to authorities.
  • The Japan UTM Consortium (JUTM) is constituted by several airspace users of UAS, data providers and operators [7]. JUTM manages flight plans, emergency alerts and provides instruction to avoid conflicts. First demonstrations took place in 2017 and its implementation is expected to start progressively after 2020.
Although there are several concepts of operations and the implementation can differ, there are common studies about the safe integration of unmanned aircraft. Dalamagkidis et al. [8] performed a complex and thorough analysis of the current framework for the integration and operation of remotely piloted aircraft systems (RPAS) in the FAA’s airspace. Clothier et al. [9,10,11] studied the implication of unmanned aircraft in non-segregated airspace. They focused on the safety analysis that should be performed to allow the operation of unmanned aircraft in different scenarios with different missions. Lum and Waggoner [12] analysed the risk of mid-air collisions and ground strikes based on a risk model. Pérez-Castán et al. [13,14] developed conflict-risk models to analyse the integration of unmanned aircraft into non-segregated airspace. There is a large number of hazard and risk assessments for manned and unmanned aircraft covering multiple technical, operational and technological aspects [10,15,16,17,18,19,20,21,22]. However, there is a lack of common safety indicators that should be utilised to ensure safe operations of unmanned aircraft within the UTM framework.
Therefore, the goal of this research is to identify and categorise the safety indicators expected to be used by U-space services. U-space demands certain services to be in place and to be used in order to provide safe RPAS operation. A further goal is to detect the inefficiencies of U-space based on the lack of safety indicators. This paper only considers U-space services related to flight safety and does not address other services related to operational issues. The content of this paper is structured as follows: Section 2 describes the U-space concept and indicates the primary services planned for the different U-space deployment phases. Section 3 identifies and categorises the primary hazards and risks posed by the operation of unmanned aircraft. Section 4 develops a safety framework for U-space in order to detect and identify the necessary safety indicators. Section 5 details the gaps in current U-space services that fail to cover specific hazards and risks. Lastly, Section 6 summarises the main conclusions.

2. U-space Description

The concept behind U-space is the provision of a network of services and specific procedures to drone operators and open for participating the market to third-party service providers together with the current ones in the eco-system. Through this, it aims to provide safe, equitable and efficient access to airspace for unmanned aircraft and associated business models. In order to ensure safety, U-space will deploy a management system to oversee unmanned operations and provide relevant information to drone operators, manned aircraft, ANSPs and authorities [5]. U-space will assist the proper operation of unmanned systems in lower altitude airspace, regardless of the airspace structure or level of unmanned-to-manned aircraft segregation. In addition, it tackles the need to support different mission types, airspace users and categories of unmanned aircraft. U-space main pillars are based on the following principles:
  • Ensure the safety of every airspace user that operates in the U-space framework, as well as affected third-parties (such as pedestrians).
  • Provide a flexible, adaptable and scalable system that can respond to the uncertainty of demand, technology and business models whilst cooperating with manned aircraft.
  • Allow fleet operations of automated drones in high-density scenarios.
  • Ensure equal and fair access to the airspace for every airspace user.
  • Provide continuous, cost-effective and competitive services to support various business models for unmanned aircraft operators.
  • Minimise the operational costs based on the implementation, services, communications and infrastructure (including GNSS).
  • Accelerate the implementation of U-space through new technologies and standards.
  • Ensure the approach based on risk, safety and performance. These requirements should be approved based on safety, cybersecurity and resilience whilst reducing their impact on the environment and prioritizing data protection.
U-space services will facilitate the operation of different unmanned aircraft types. On the one hand, the implementation of these services and procedures provide access to airspace to the smallest unmanned aircraft. On the other hand, U-space tackles the integration of bigger unmanned aircraft that can jointly operate with manned aircraft. Therefore, U-space is as much the evolution of the current ATM system as it is a drone-ecosystem provider.
U-space services initially address the operation of the smallest unmanned aircraft in very low level (VLL) airspace. VLL is considered the airspace below the legal operating limit for manned operations: between ground level and 500 feet (ft.) above ground level. However, U-space is expected to evolve to incorporate bigger unmanned aircraft, which operate from 500 up to 600,000 ft. As these types of unmanned aircraft share the same airspace they must be integrated with manned aircraft based on instrument flight rules (IFR). ICAO and SESAR are developing rules and recommended practices for these types of operations, which are expected to be finalised around 2020 and will allow operations from 2023 [23,24]. Both approaches must be developed in parallel as an iterative process because as the U-space services are deployed, the ATM system will need to evolve to facilitate their integration. This approach ensures that unmanned and manned aircraft will use adequate infrastructure, rules of the air and procedures.
The gradual deployment of U-space is planned in four phases:
  • Phase U1: The provision of basic services whose main goals are: To identify unmanned aircraft and operators; to inform about the existence of segregated areas; to facilitate administrative procedures of the flight approval and to authorise specific missions. This will open up visual line of sight (VLOS) operations in cities and extended VLOS operations in rural environments. Beyond VLOS (BVLOS) operations will be possible but still quite restricted.
  • Phase U2: This phase refers to an initial set of services that support the safe administration and management of unmanned aircraft. It provides the first level of connection with ATM, ATC and manned aviation. Where implemented, U2 will take advantage of the existing ATM infrastructure and exploit new available technologies. VLL operations will evolve to include operations in controlled airspace. Unmanned flights will not be evaluated individually and some BVLOS operations will become routine.
  • Phase U3: This phase evolves from the experience obtained during the U2 phase and will use new applications or missions based on high-density and complex areas. New technologies and automated functionalities (such as ’detect and avoid‘) and new means of communication will allow for a significant increase in operations in all environments. In this phase, a high increase in unmanned operations is expected, especially in urban areas.
  • Phase U4: This phase will integrate ATM functionalities to both manned and unmanned aircraft. It will provide the full deployment of U-space based on a high degree of automation.
Table 1 shows the drone capabilities associated with U-space phases and services.
Therefore, each phase proposes a new set of services while at the same time maintaining and updating the main services. Hence, U-space services evolve and expand alongside the increase in automation of unmanned aircraft.

3. Hazard and Risk Categorisation and Identification

To achieve an orderly introduction of drones into manned airspace, it is crucial to maintain the existing levels of safety within that airspace. To do so, it is necessary to identify how these new actors affect the operational environment. Therefore, the goal of this section is to identify and categorise the hazards and risks that threaten the U-space system.

3.1. Hazard and Risk Categorisation

A set of six categories was identified to classify diverse hazardous situations. This work takes advantage of the categorisation developed by Altiscope [25,26], which allows a modular approach to perform an in-depth and systematic analysis, reducing the possibility of leaving out any circumstance that may imply a critical situation. The categories that have been identified are as follows:
  • Vehicle reliability, equipment and redundancy. Any problem associated with the different vehicle elements and components that can affect the proper execution of the operation. Hence, it is necessary to bear in mind the failure rate of the mechanical components, the expected behaviour of the batteries, system redundancy, navigation and positioning systems.
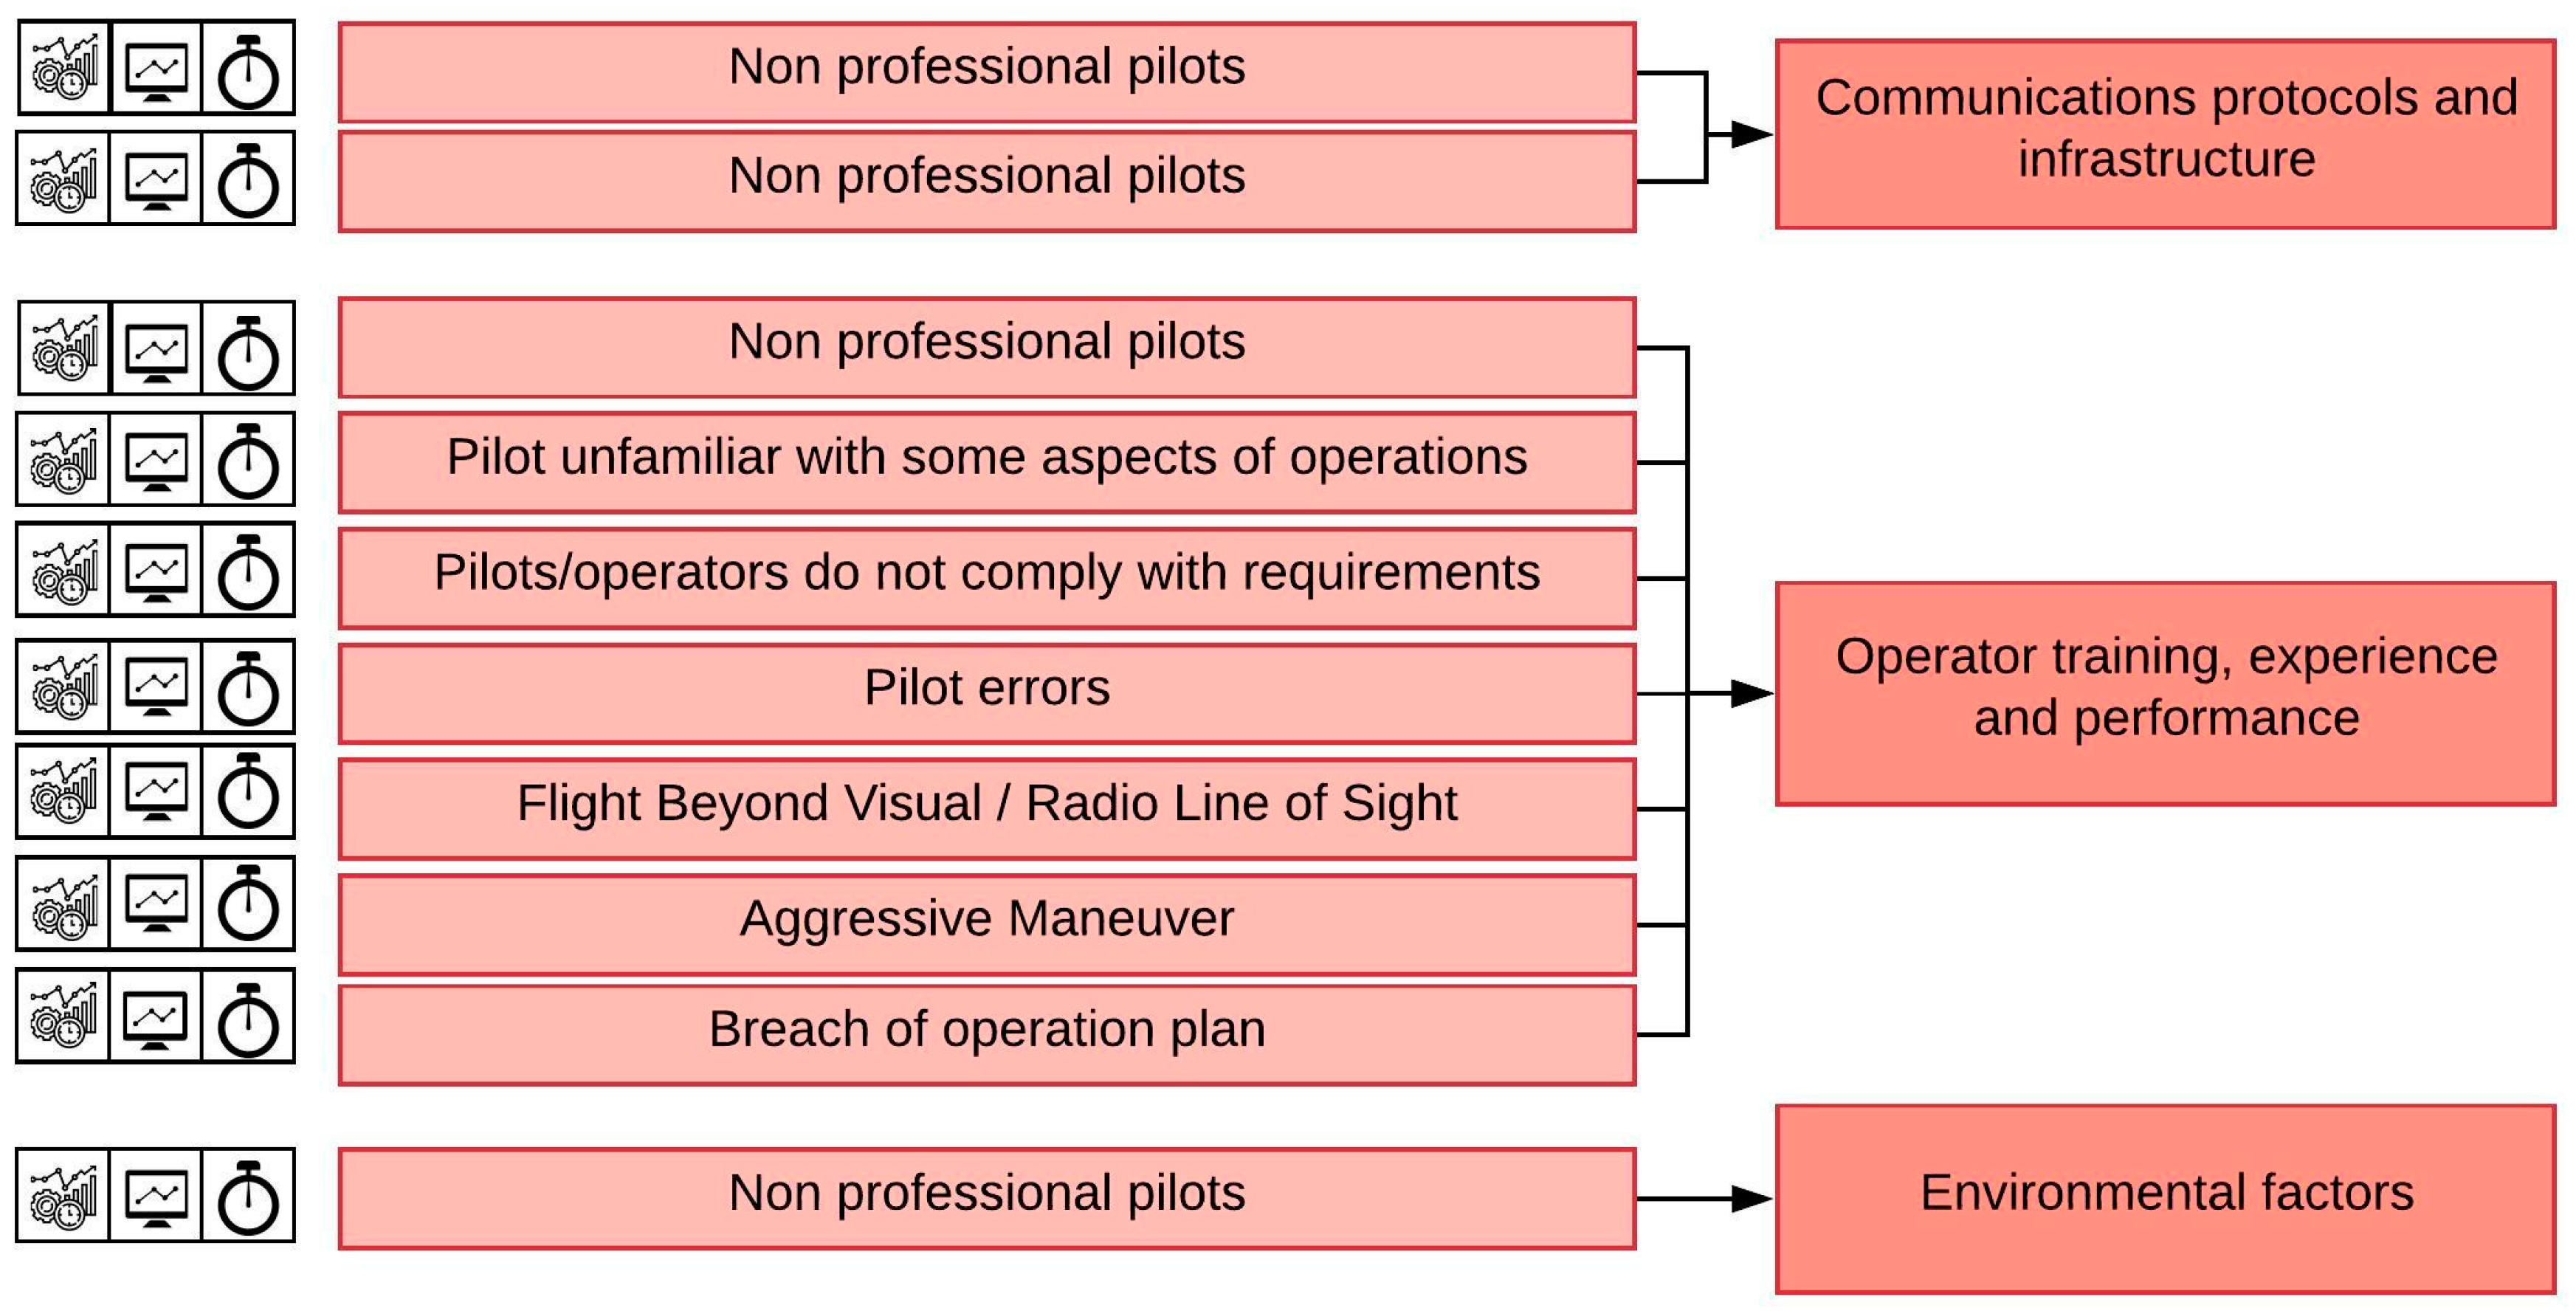
  • Communication protocols and infrastructure. The latency during the reception and communication of the control instructions (or the lack of ability to answer) represents an operational risk depending on the requirements of the airspace. Besides, communication flow must be ensured between all the elements involved (pilot, observer, ground control system and aircraft).
  • Operator training, experience and performance. The flight of unmanned aircraft relies heavily upon the decisions made by the pilot during (or before) the operation. Therefore, the qualification, experience and performance of the operator is a crucial factor that can affect the safety of unmanned operations.
  • Airspace usage and rules. The collision risk increases in high-density scenarios because of a large number of users. However, collision risk does not simply depend on the airspace class or the density of air traffic, but it significantly varies with risk exposure.
  • Environmental factors. Weather is a common and crucial factor of typical accidents or incidents in manned aviation. It is expected to affect unmanned aircraft to a large degree because of their lower speed and weight. Moreover, the operation of unmanned aircraft close to urban areas may imply new weather aspects to consider because of their proximity to high-rise buildings.
  • Population density, land use patterns and building/obstacle height/density patterns. The operation of unmanned aircraft close to urban areas entails an increase of the operational risk due to their proximity to pedestrians and infrastructure. Therefore, authorities can limit or inhibit the operation of unmanned aircraft around critical areas, such as hospitals and government buildings.
Each of the hazardous and risky situations considered above may be accompanied by various and (more or less) severe consequences. The most severe consequence we have identified is a collision of the unmanned aircraft with another element in one of the following manners:
  • Air collision: Collision between two unmanned aircraft or between unmanned and manned aircraft. The consequences are categorised according to ICAO Annex 19 [27].
  • Collision with obstacles: Unmanned aircraft can cause damage to third-party holdings or fauna.
  • Collision with infrastructure: Unmanned aircraft may cause damage to third-party holdings. If the infrastructure is denoted as critical, collisions can imply a risk to human health, national security or the interruption of critical services for society.
  • Collision with humans. The consequences may imply injury or even death.
In the case no collision occurs, it can imply the occurrence of incidents or serious incidents (depending on the gravity of the possible accident that could have occurred). Other consequences include delays or the obstruction of the normal operational performance.

3.2. Hazard and Risk Identification

The hazard and risk identification related to unmanned aircraft operations was built upon the analyses performed by the focus group. The focus group were experts from different areas related to air traffic management and U-space, such as ANSPs, regulation authorities, human factors experts, airspace designers and airspace users, that identified hazards or risks not covered by previous works. The focus group followed the Delphi’s method developed in two sessions. During the first session, the focus group started with a brainstorming of the different factors that could be included for each one of the six Altiscope’s categories. Then, the experts discussed and agreed upon the factors that should be taken into account in a risk assessment. In the second session, the focus group brought new hazards and risks and the same process was developed to cover the largest number of hazards. Table 2 shows the result of the work carried out by the focus group. This paper compiles those hazards and risks and adds several that were not considered in their analysis.
It is obvious that there are some hazards or risks not included in the work. Therefore, the list of hazards proposed herein should be improved by further research. Figure 1 shows the structuring of the different hazard, risk and safety indicators based on a fault-tree analysis, to be read from left to right.

4. U-space Safety

Once hazards and risks were identified and grouped depending on their characteristics, it is necessary to identify indicators for each of them. These indicators serve to gather the information required to determine safety levels, as well as to measure the safety performance of U-space.
According to ICAO [27], safety performance is defined as ‘state or a service provider’s safety achievement as defined by its safety performance targets and safety performance indicators’ and the performance targets as ‘the planned or intended objective for safety performance indicator(s) over a given period’. U-space is responsible for managing unmanned operations through a large set of services. These services allow users to mitigate risks during operations. In this way, safety performance indicators evaluate the performance of those services in mitigating risk impact [28].
Safety metrics or indicators used in different sources tended to focus only on performance analyses, for instance in terms of incidents and accidents. Incidents or accidents are easy to measure and normally entail the most severe consequences. However, with regard to safety, focusing only on these types of events makes the analysis insufficient for the following reasons:
  • Unmanned systems similar to manned aviation (with a very low rate of incidents and accidents) may give a false impression that they are just as safe.
  • The availability of operational information for different stakeholders (pilot, ATC and ANSP) is not immediate, which can delay the inclusion of measures to mitigate risk.
  • By only considering the outcomes, few systemic, dangerous or latent factors can be detected.
Therefore, a risk assessment is required to fully understand the different set of elements that affect safety. The classification of safety performance indicators selected for this study is the one provided by the Safety Management International Collaboration Group (SM ICG) [29]. The authors chose this classification because it provides better insight into the organisational needs of U-space. This classification considers two types of indicators:
  • Outcome or lagging indicators: This type of indicator measures safety critical events that have already happened. They lay down a way to validate the safety performance of the system. Moreover, the evolution of these indicators can be used to detect if latent conditions exist in the current systems.
  • Leading indicators: This type of indicator provides information about the current system and the way it can affect future performance. Therefore, lagging indicators measure aspects that potentially have a negative effect in the future and elements that contribute to safety They are further divided into two groups depending on the information they provide:
    Driving indicators: They are preliminary indicators that denote priorities in terms of safety and they constitute the actions for risk mitigation. Thus, this type of indicator helps to proactively improve safety management capacities.
    Monitoring indicators: They are complex indicators that provide information about the dynamic state of the system and how to face possible changes. They contribute to detect weaknesses and vulnerabilities that can arise during the operation, i.e., they focus on the surveillance process of the system and operations.

4.1. U-space Safety Framework

In this work, the authors propose a safety framework for U-space built on safety indicators. This framework is based on the safety culture model of [30,31]. Figure 2 synthesises the U-space operational concept and operational limits determined by interpretations of current safety levels. The operational concept ascertains the safety goals that must be achieved for a specific safety level.
Once safety goals are determined, driving indicators are applied before the onset of the operation, based on the available information that predicts safety levels during the flight. In this way, the driving indicators inform about the expected hazards and address the risk mitigation process because they indicate the more dangerous elements. Likewise, they must indicate the expected results obtained by the mitigation measures applied.
Throughout the operation, monitoring indicators provide a dynamic view of the airspace state, supplying operational data in real-time through surveillance. Moreover, they can evaluate whether driving indicators entail the expected safety level results or not.
Lastly, the re-counting of detected events for each hazard is measured by lagging indicators once the operation has finished. These indicators disclose the effectiveness of the control and mitigation measures prior to and during the operations. Figure 3 presents a flow chart of the proposed U-space safety framework, denoting the information provided by each indicator.
Finally, it is possible to analyse U-space safety performance with all the information obtained by driving, monitoring and lagging indicators. The safety analysis appraises the throughput of the U-space framework and identifies the safety levels obtained as well as their evolution. Therefore, this framework lays out a hierarchical and iterative process to maintain the safety levels in U-space.

4.2. U-space Safety Indicators

Now that the safety framework has been described, one of the most challenging steps is to define safety indicators. The hazards and risks have been identified based on a risk assessment that allows the definition of U-space safety indicators. It is important to point out that we only considered the information required to define the safety indicators. The definition of metrics that measure the indicators (as well as the maximum safety level) is beyond the scope of this work.
Table 3 shows the leading, monitoring and lagging indicators identified for the different hazards related to vehicle reliability, equipment and redundancy. As would be expected, similar hazards are associated with similar indicators for each indicator type.
Table 4 shows the leading, monitoring and lagging indicators identified for the different hazards related to communication protocols and infrastructure. In this case, leading and monitoring indicators are different for each hazard. However, there are no leading or monitoring indicators for communication protocol failure and inefficient datalink security.
Table 5 shows the leading, monitoring and lagging indicators identified for the different hazards related to operator training, experience and performance. In this case, lagging indicators are crucial for further analysis although there are several leading and monitoring indicators. This is one of the most difficult safety categories because of the lack of knowledge about the training and experience of UAS pilots.
Table 6 shows the leading, monitoring and lagging indicators identified for the different hazards related to airspace usage and rules. In this case, leading and monitoring indicators are different for each hazard. However, there are no leading or monitoring indicators for every hazard because of the difficulty to mitigate them.
Table 7 shows the leading, monitoring and lagging indicators identified for the different hazards related to environmental factors. In this case, leading, monitoring and lagging indicators are the same for each hazard.
Table 8 shows the leading, monitoring and lagging indicators identified for the different hazards related to population density, land use patterns and building/obstacle height/density patterns. In this case, leading and monitoring indicators are different for each hazard and provide critical indicators.
Figure 4 shows the proposed driving, monitoring and lagging indicators related to the different hazards and risks. Roughly half of the hazards identified have driving, monitoring and lagging indicators that provide the best safety scenario. On the other hand, half of the hazards identified demand an in-depth analysis to tackle the three types of indicators. The consequences and risks are identified through lagging indicators because they demand numbers of events detected.
One of the current problems with safety indicators is that there is currently no information available about the use of U-space safety indicators. Preferably, each U-space service should be built and operate regarding the safety indicators identified in this work. Nonetheless, ANSPs do not inform or publish what safety indicators they are currently using nor they have been defined. This crucial issue should be addressed by all European ANSPs. A common definition, characterisation and usage of the U-space safety indicators will bring benefits for every stakeholder.

5. Gaps in U-space Services

The proposal of U-space to ensure an established level of safety is the provision of an ensemble of services to airspace users. The intended purpose for the vast majority of U-space services is to deal with one or several hazards identified in the previous risk analysis. Table 9 relates the hazards identified in this study to the envisioned U-space services. However, identification and surveillance services are not considered in Table 9 because they underline more complex services, like airspace management, mission management or surveillance.
Besides determining the relation between the U-space services and associated hazards, it is convenient to detect the hazards that are not covered by current U-space services. There are gaps between the hazards identified and the U-space services defined that should be taken into account. Then, this work addresses further research efforts for the development of U-space to be able to manage any dangerous situation that threatens the optimum safety levels. Figure 5 shows the identified hazards that are not covered by current U-space services.
Attending to Figure 5, it is clear that the category of operator training, experience and performance is not covered by any current U-space services. This category is mainly associated with human factors, which is one of the most difficult to assess. Means to deal with the lack of accurate communication protocols, security failures with datalink, and the presence of wildlife in the airspace are also not covered. ANSPs will have to decide which of these U-space services and hazards are critical for the development of U-space, and, as a consequence, to define U-space safety indicators associated with them.
Moreover, although there will be new U-space hazards and safety indicators that are not considered herein, not all U-space safety indicators have the same importance or will be used in the same manner. The importance of the safety indicators will depend on the usefulness they provide to ANSPs and their implications to allow for safe unmanned flight operations. For instance, safety indicators regarding vehicle reliability, equipage and redundancy define the minimum requirements that manufacturers must ensure based on regulating authorities. However, the knowledge of these indicators is not crucial for the operation of the unmanned aircraft in the airspace. There are other safety indicators, such as communication protocols, infrastructure or airspace usage, that could be defined as crucial for the safe operation of unmanned aircraft. In addition, each ANSPs may have different interests in different safety indicators depending on their needs, which will be evaluated throughout the evolution of the U-space lifecycle.

6. Conclusions

This work proposes a set of safety indicators that will allow determining the safety level in U-space and evaluating its safety performance. First, it described the U-space framework and services to deal with the introduction of unmanned aircraft into the airspace. Second, hazards and risks were identified and categorised based on the framework developed by Altiscope. Hazards were divided into six categories to ensure a holistic and thorough analysis of different, potentially dangerous situations. Risks were identified and classified depending on their severity. The main contribution of this paper was two-fold: The identification of the potential indicators for the U-space service based on a holistic view of the different hazards and risks; and the identification of gaps attributed to those that have not been considered in the definition of U-space services. The different hazards were categorised and linked with the associated risks. Next, a safety framework was proposed as an iterative process to quantify and determine the safety indicators. Finally, the safety indicators were classified into three categories depending on their interaction over time: leading, monitoring or lagging. The three types of indicators can be used to evaluate hazards, but risks can only be evaluated by lagging indicators.
Through our analysis we found that there is a lack of a common definition, characterisation and usage of U-space safety indicators that will benefit every stakeholder. Moreover, the comparison between the identified safety indicators and current U-space services brought to light that some hazards were not covered by current U-space services. Therefore, a set of safety indicators was detected and should be incorporated in the U-space service description in order to provide a systematic and complete safety analysis scheme. The safety indicators identified and proposed in this work are not the final solution, as it is expected that new safety indicators will arise throughout the implementation of U-space. However, we do consider that the integration of these safety indicators should be mandatory. This integration process demands effort from all stakeholders in unmanned aircraft operations, authorities and airspace users. In addition, a common European framework for the development and implementation of safety indicators should be mandatory for all Member States, in order to assure homogenous safety levels. Further work will focus on the definition of the safety indicators as well as the maximum safety levels that should not be exceeded in order to ensure safe operations. This line of research will provide an analysis of U-space performance based on pre-determined safety levels. On-going research is required to continue identifying possible gaps among hazards, risk and safety indicators.

Author Contributions

Conceptualization, J.A.P.-C., F.G.C., A.B.C.-S., D.J. and R.M.A.V.; Funding acquisition, F.G.C. and R.M.A.V.; Investigation, J.A.P.-C. and A.B.C.-S.; Methodology, J.A.P.-C. and A.B.C.-S.; Project administration, F.G.C. and D.J.; Supervision, F.G.C., D.J. and R.M.A.V.; Validation, D.J. and R.M.A.V.; Writing – original draft, J.A.P.-C. and A.B.C.-S.; Writing – review & editing, J.A.P.-C. and D.J. All authors have read and agreed to the published version of the manuscript.

Funding

This research received no external funding.

Conflicts of Interest

The authors declare no conflict of interest.

References

  1. U.S. Department of Defense. US Army Unmanned Aircraft Systems Roadmap 2010-2035; U.S. Department of Defense: Arlington, VA USA, 2010. [Google Scholar]
  2. SESAR Joint Undertaking. European Drones Outlook Study; SESAR Joint Undertaking: Brussels, Belgium, 2016. [Google Scholar]
  3. EUROCONTROL. European Aviation in 2040—Challenges of Growth; EUROCONTROL: Brussels, Belgium, 2018. [Google Scholar]
  4. Kopardekar, P.; Rios, J.; Prevot, T.; Johnson, M.; Jung, J.; Robinson, J.E., III. UAS Traffic Management (UTM) Concept of Operations to Safely Enable Low Altitude Flight Operations. In Proceedings of the 16th AIAA Aviation Technology, Integration and Operations Conference, Washington, DC, USA, 13–17 June 2016; pp. 1–16. [Google Scholar] [CrossRef]
  5. SESAR Joint Undertaking. U-space blueprint—SESAR Joint Undertaking; SESAR Joint Undertaking: Brussels, Belgium, 2017. [Google Scholar]
  6. Zhang, J. UOMS in China. In Proceedings of the EU-China APP Drone Workshop, Shenzhen, China, 6–8 June 2018. [Google Scholar]
  7. Ushijima, H. UTM Project in Japan. In Proceedings of the Global UTM Conference, Montreal, QC, Canada, 26 June 2017. [Google Scholar]
  8. Dalamagkidis, K.; Valavanis, K.P.; Piegl, L.A. On unmanned aircraft systems issues, challenges and operational restrictions preventing integration into the National Airspace System. Prog. Aerosp. Sci. 2008, 44, 503–519. [Google Scholar] [CrossRef]
  9. Clothier, R.A.; Palmer, J.L.; Walker, R.A.; Fulton, N.L. Definition of an airworthiness certification framework for civil unmanned aircraft systems. Saf. Sci. 2011, 49, 871–885. [Google Scholar] [CrossRef] [Green Version]
  10. Clothier, R.A.; Williams, B.P.; Fulton, N.L. Structuring the safety case for unmanned aircraft system operations in non-segregated airspace. Saf. Sci. 2015, 79, 213–228. [Google Scholar] [CrossRef]
  11. Clothier, R.A.; Greer, D.A.; Greer, D.G.; Mehta, A.M. Risk Perception and the Public Acceptance of Drones. Risk Anal. 2015, 35, 1167–1183. [Google Scholar] [CrossRef] [PubMed]
  12. Lum, C.; Waggoner, B. A Risk Based Paradigm and Model for Unmanned Aerial Systems in the National Airspace. In Proceedings of the AIAA Infotech@Aerospace Conference, St. Louis, MI, USA, 29–31 March 2011; pp. 1–31. [Google Scholar] [CrossRef] [Green Version]
  13. Pérez-Castán, J.A.; Gómez Comendador, F.; Rodríguez-Sanz, A.; Armas Cabrera, I.; Torrecilla, J. RPAS conflict-risk assessment in non-segregated airspace. Saf. Sci. 2019, 111, 7–16. [Google Scholar] [CrossRef]
  14. Pérez-Castán, J.A.; Comendador, F.G.; Rodríguez-Sanz, Á.; Valdés, R.M.A.; Torrecilla, J. Conflict-resolution algorithms for RPAS in non-segregated airspace. Aircr. Eng. Aerosp. Technol. 2019, 91, 366–372. [Google Scholar] [CrossRef]
  15. Clothier, R.A.; Walker, R.A. Safety Risk Management of Unmanned Aircraft Systems. In Handbook of Unmanned Aerial Vehicles; Springer Science+Business Media: Berlin, Germany, 2015; pp. xix–xxi. [Google Scholar]
  16. Allouch, A.; Koubaa, A.; Khalgui, M.; Abbes, T. Qualitative and Quantitative Risk Analysis and Safety Assessment of Unmanned Aerial Vehicles Missions over the Internet. IEEE Access 2019, 7, 53392–53410. [Google Scholar] [CrossRef]
  17. Weibel, R.; Hansman, R.J. Safety Considerations for Operation of Different Classes of UAVs in the NAS. In Proceedings of the AIAA 3rd “Unmanned Unlimited” Technical Conference Workshoop Exhibit, Chicago, IL, USA, 20–23 September 2004; pp. 1–11. [Google Scholar] [CrossRef]
  18. EASA. Report UAS Safety Risk Portfolio and Analysis; EASA: Cologne, Germany, 2016. [Google Scholar]
  19. Wackwitz, K.; Boedecker, H. Safety Risk Assessment for UAV Operation; Drone Industry Insights: Hamburg, Germany, 2015. [Google Scholar]
  20. Jenie, Y.I.; Van Kampen, E.-J.; Ellerbroek, J.; Hoekstra, J.M. Safety Assessment of Unmanned Aerial Vehicle Operations in an Integrated Airspace. In Proceedings of the AIAA Infotech @ Aerosp., San Diego, CA, USA, 4–8 January 2016; pp. 1–11. [Google Scholar] [CrossRef]
  21. Kuchar, J.; Andrews, J.; Drumm, A.; Hall, T.; Heinz, V.; Thompson, S.; Welch, J. A safety analysis process for the Traffic Alert and Collision Avoidance System (TCAS) and see-and-avoid systems on remotely piloted vehicles. In Proceedings of the AIAA 3rd “Unmanned-Unlimited” Technical Conference Workshop Exhibit, Chicago, IL, USA, 20–23 September 2004; Volume 1, pp. 352–364. [Google Scholar] [CrossRef] [Green Version]
  22. Karanikas, N.; Kaspers, S. Finalisation and Application of New Safety Management Metrics; Amsterdam University of Applied Sciences: Amsterdam, The Netherlands, 2018. [Google Scholar]
  23. SESAR Joint Undertaking. European ATM Master Plan: Roadmap for the Safe Integration of Drones into All Classes of Airspace; SESAR Joint Undertaking: Brussels, Belgium, 2018. [Google Scholar]
  24. ICAO. Manual on Remotely Piloted Aircraft Systems (RPAS); ICAO: Montreal, QC, Canada, 2015. [Google Scholar]
  25. Airbus. Understanding UAV Mission Risk; Airbus: Leiden, The Netherlands, 2018. [Google Scholar]
  26. Airbus. Building Altiscope’s Risk Framework; Airbus: Leiden, The Netherlands, 2018. [Google Scholar]
  27. ICAO. Annex 19 - Safety Management; ICAO: Montreal, QC, Canada, 2013. [Google Scholar]
  28. Belcastro, C.M.; Newman, R.L.; Evans, J.K.; Klyde, D.H.; Barr, L.C.; Ancel, E. Hazards identification and analysis for unmanned aircraft system operations. In Proceedings of the 17th AIAA Aviat. Technol. Integr. Oper. Conf. 2017, Denver, CO, USA, 5–9 June 2017. [Google Scholar] [CrossRef] [Green Version]
  29. European Union Aviation Safety Agency. Medición del Rendimiento en Materia de Seguridad Operacional Guía Para Proveedores de Servicio; Safety Management International Collaboration Group: Cologne, Germany, 2013; pp. 1–19. [Google Scholar]
  30. Reiman, T.; Pietikäinen, E. Leading indicators of system safety – Monitoring and driving the organizational safety potential. Saf. Sci. 2012, 50, 1993–2000. [Google Scholar] [CrossRef]
  31. Piric, S.; De Boer, R.J.; Roelen, A.; Karanikas, N.; Kaspers, S. How does aviation industry measure safety performance Current practice and limitations. Int. J. Aviat. Manag. 2019, 4, 224. [Google Scholar] [CrossRef] [Green Version]
Figure 1. Hazards and risk analysis based on the fault tree structure.
Energies 13 00608 g001
Figure 2. Current U-space safety framework.
Energies 13 00608 g002
Figure 3. Proposed U-space safety framework.
Energies 13 00608 g003
Figure 4. U-space safety indicators associated with hazards and risk analysis.
Energies 13 00608 g004
Figure 5. Hazards not covered by current U-space services.
Energies 13 00608 g005
Table 1. UAS services capabilities required for U-space phases.
PhaseU-space ServicesAssociated Drone Capabilities
U1e-Registration
e-Identification
Pre-tactical geofencing
e-Identification
Geofencing
Security
Communication, navigation and surveillance
Command and control
U2Tactical geofencing
Tracking
Flight planning management
Weather information
e-Identification
Geofencing
Security
Telemetry
Tracking
Vehicle to infrastructure communication
Communication, navigation and surveillance
Detect and avoid
Emergency recovery
Command and control
Operations management
U3Dynamic geofencing
Collaborative interface with ATC
Tactical de-confliction
Dynamic capacity management
e-Identification
Geofencing
Security
Telemetry
Tracking
Vehicle to vehicle communication
Vehicle to infrastructure communication
Communication, navigation and surveillance
Detect and avoid
Emergency recovery
Command and control
Operations management
U4Full integration of UAV flights into non-segregated airspace
Table 2. Hazards identified during risk assessment.
Hazards Identified in Previous AnalysisHazards Identified by Focus Group
Propulsion system failures
Battery failures
Avionics systems failures
Structural failures
Redundant systems failures
Delays in communications
Interference in communication
Insufficient data-link security
Pilots/operators do not comply with requirements
Pilot errors
Flight beyond visual/radio line of sight
Insufficient geo-fencing
Meeting with manned operations
Meeting UAS without plan operation
High density air traffic
Extreme temperatures
Rain
Snow, ice
Wind, shear
Reduced visibility
Night operations
Presence of Wildlife
Operations near people
Obstacles
UAS performance failures
Permanent loss of communication
Insufficient standards for communication processes
Non-professional pilots
Pilot unfamiliar with some operational aspects
Aggressive manoeuvre
Breach of operation plan
Meeting with emergency operations
Rugged terrain
Table 3. Safety indicators regarding vehicle reliability, equipage and redundancy.
Hazards.Indicator
DrivingMonitoringLagging
Propulsive system failureMeantime between failures (MTBF)Fault warningNumber of detected failures
Battery failure
On-board avionics failure
Structural failure
Redundancy system failure
Maintenance failure
UAS performance failure
Table 4. Safety indicators regarding communication protocols and infrastructure.
HazardsIndicator
DrivingMonitoringLagging
Communication-link disturbancesFailure rateNoise levelNumber of detected events
Communication delayFailure rateCommunication latency
Communication lossCoverage level for communications before an operationReal-time coverage level for communications
Communication protocol failuresPrior security levelReal-time level
Datalink security
Table 5. Safety indicators regarding operator training, experience and performance.
HazardIndicator
DrivingMonitoringLagging
Flights operated by non-licensed pilotsStatistics of non-licensed pilotsReal-time detected flightsNumber of detected events
Number of flights operated by non-licensed pilots
Pilot does not fulfil the operational requirementsHistorical pilot dataPilot or ATC reportNumber of flights that pilots do not fulfil the requirements
Pilot is not familiar with some operational aspectPre-survey for pilot awarenessNumber of detected events
Pilot failuresHistorical pilot dataNumber of pilot failures
Loss or inadequate line of sight between the pilot and UASNumber of detected events
Aggressive manoeuvreNumber of detected events
Non-compliance flight planPilot reliability (point-system license)Flight plan monitoringNumber of flights that violate the flight plan
Table 6. Safety indicators regarding airspace usage and rules.
HazardIndicator
DrivingMonitoringLagging
Confusing or poorly defined limitsHistorical reports in confusing airspacesPilot or ATC reportNumber of detected events
Flights nearby dangerous or forbidden areasNumber of flight plans operated close to X NMNumber of operations close to X NMNumber of detected events
Coordination between UAS and manned operationsNumber of manned aircraft estimated
Is the flight procedure pre-defined? (Yes/No)
Pilot or ATC reportNumber of detected events
Coordination between UAS and emergency operationsNumber of emergency operations estimatedPilot, ATC or emergency reportNumber of detected events
Encounters with unplanned UASNumber of aircraft estimatedPilot or ATC reportNumber of detected events
Air traffic high densityAir traffic estimation
Workload admissible
Minimum closing time
Number of nearby aircraft
Number of detected events
Table 7. Safety indicators regarding environmental factors.
HazardIndicator
DrivingMonitoringLagging
Extreme TemperaturesMeteorological forecastLocal meteorological informationNumber of detected events
Strong winds
Precipitation
Ice, snow
Low visibility
WildlifeWildlife migration patternsWildlife monitoring radarNumber of detected events
Table 8. Safety indicators regarding population density, land use patterns and building/obstacle height/density patterns.
HazardIndicator
DrivingMonitoringLagging
Flights in or closed to citiesAir traffic density
Population density
Live population density
Live air traffic density
Number of detected events
Obstacle presenceObstacle map
Number of flight plan closed to critical obstacles
Number of flights close to critical obstaclesNumber of detected events
Rugged terrainGeographical mapNumber of flights operating in rugged terrainNumber of detected events
Table 9. Hazards related to U-space services.
U-Space ServiceHazard
Airspace management/geo-fencingConfusing or poorly defined limits
Flights nearby dangerous or forbidden areas
Mission managementNon-compliance flight plan
Monitoring
Conflict management
Air traffic high density
Emergency managementEncounter with emergency vehicle
Alert of vehicle failures
Coordination with ATCEncounter with manned aircraft
EnvironmentMeteorological informationExtreme temperatures
Strong wind
Precipitation, snow, ice
Low visibility
Population density mapPopulation close to operations
Geospatial information serviceObstacles
Hilly relief
CNS coverage information
Disturbance coverage information
Communication disturbances
Communication delays
Communication failures
Total loss of communications

