An Offshore Floating Wind–Solar–Aquaculture System: Concept Design and Extreme Response in Survival Conditions


Abstract

1. Introduction
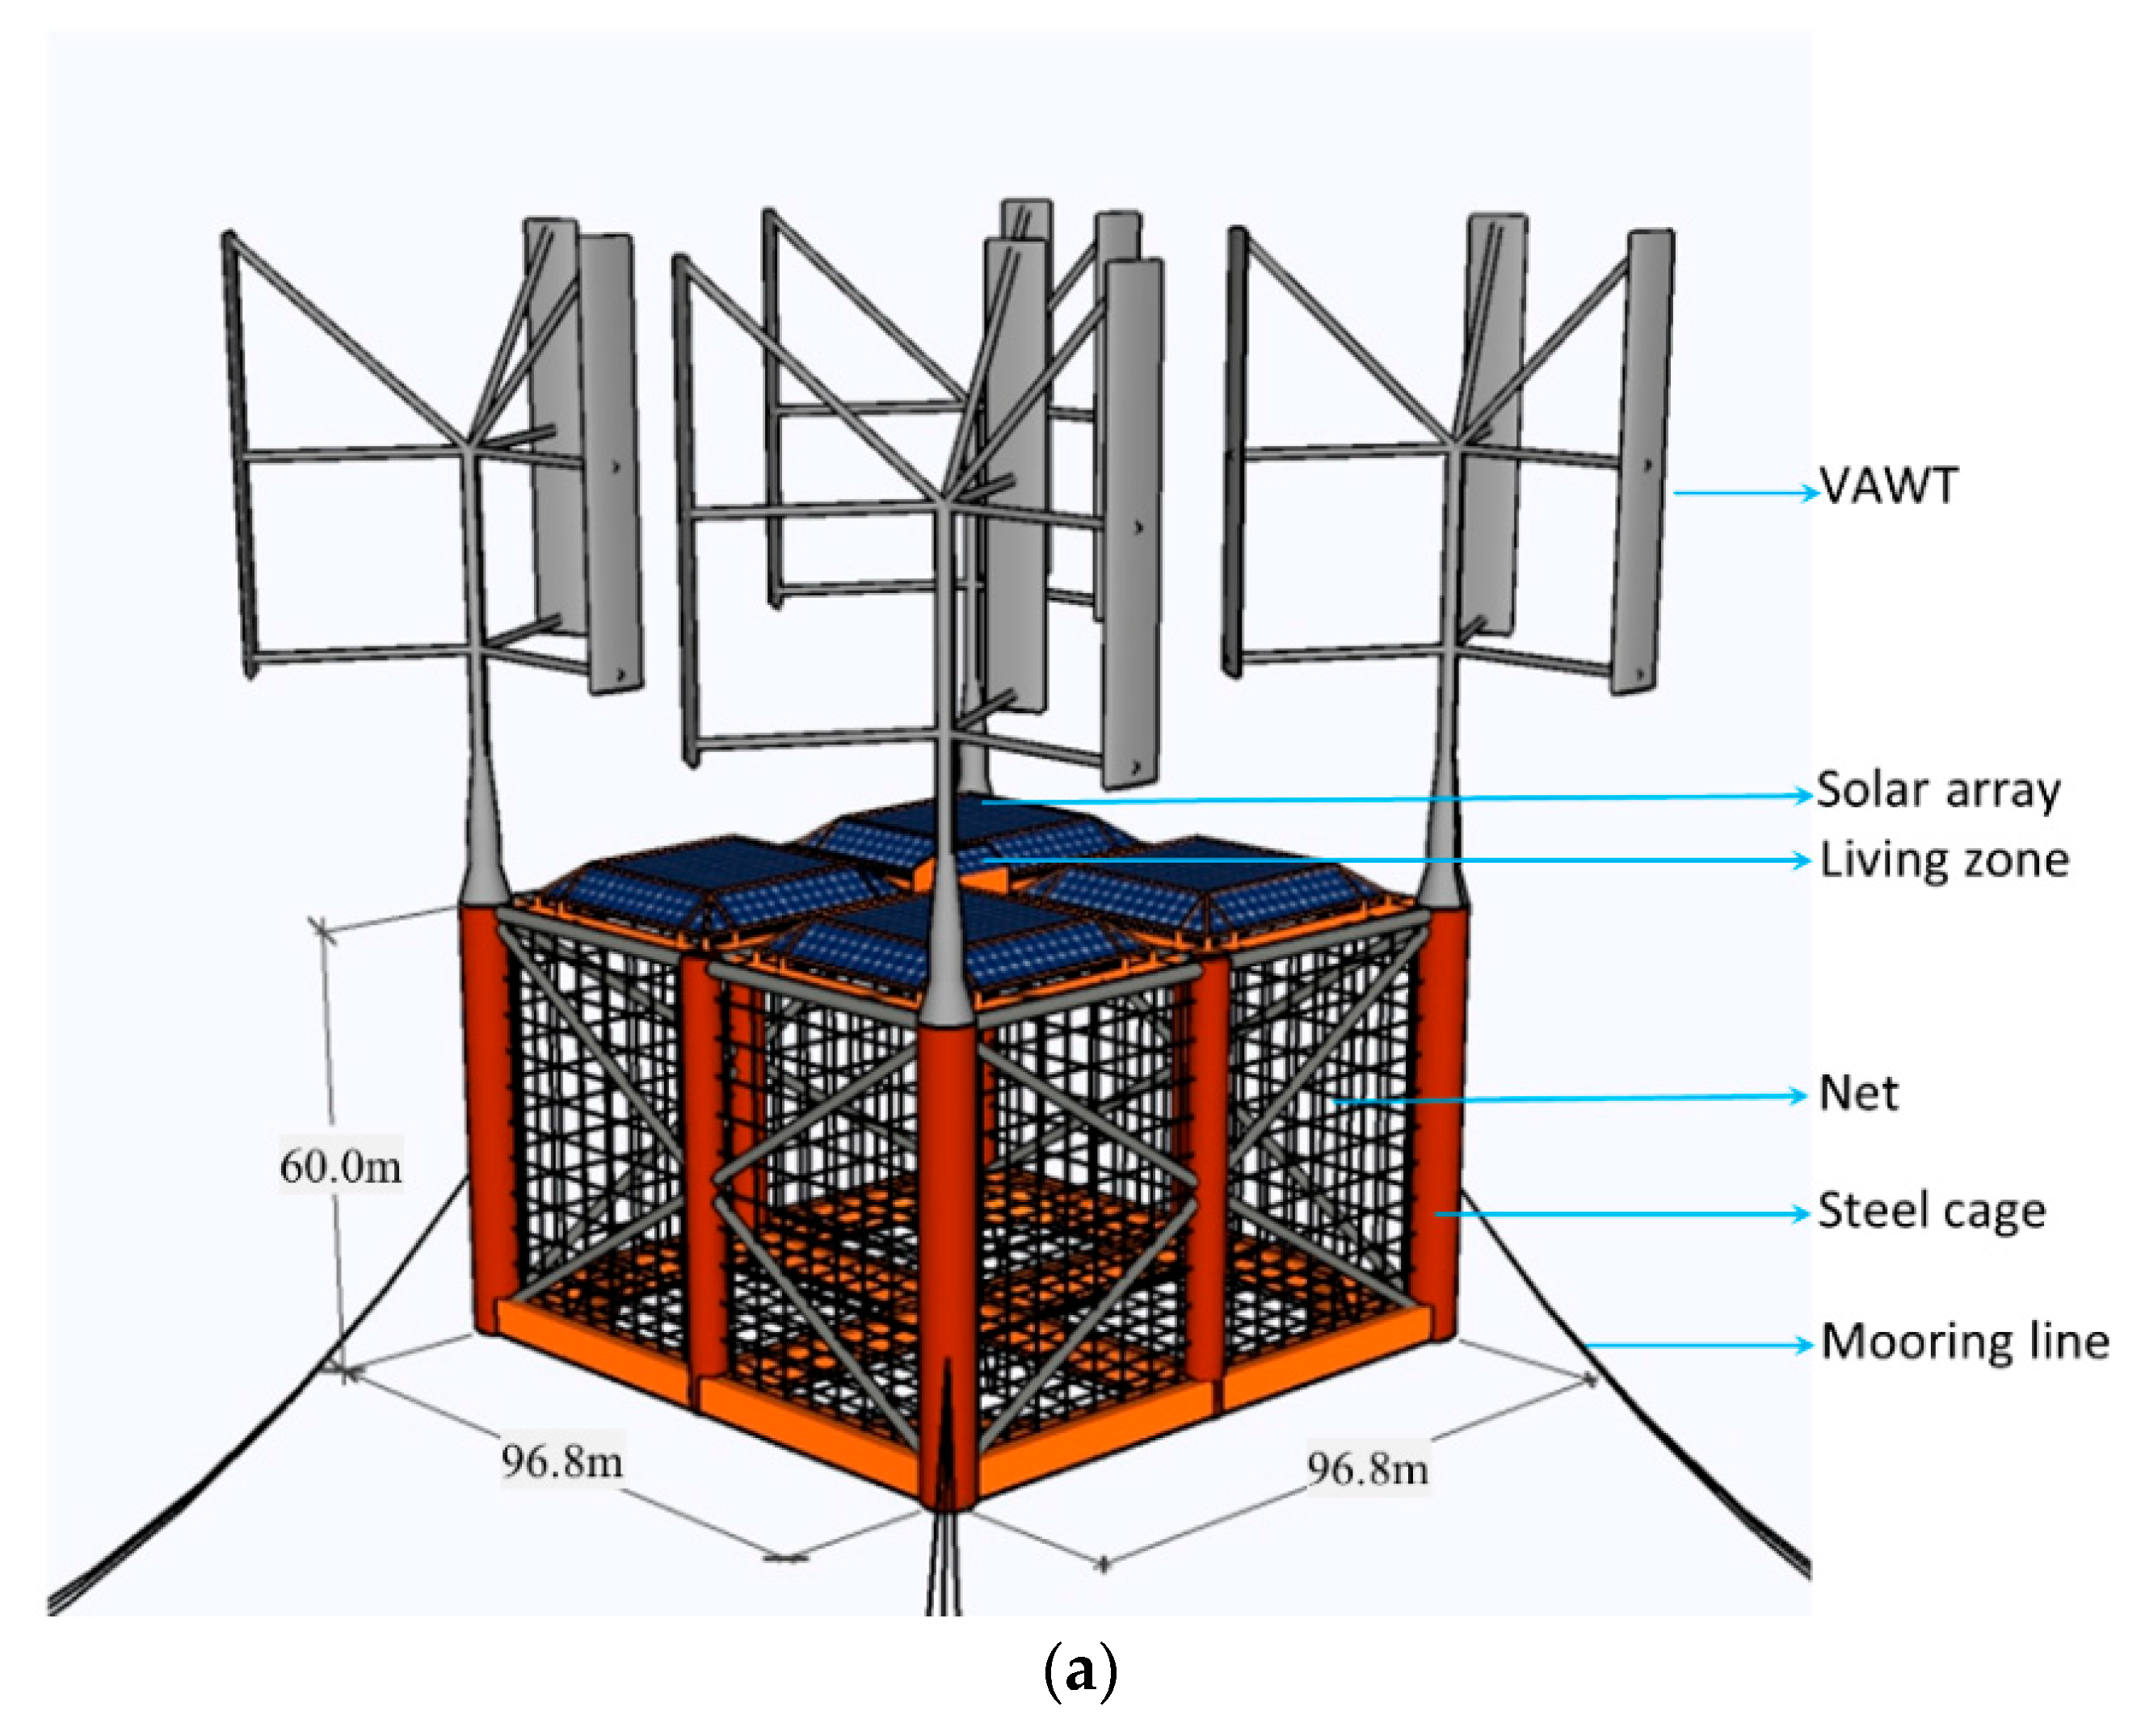
2. The WSA Concept
2.1. Steel Fishing Cage
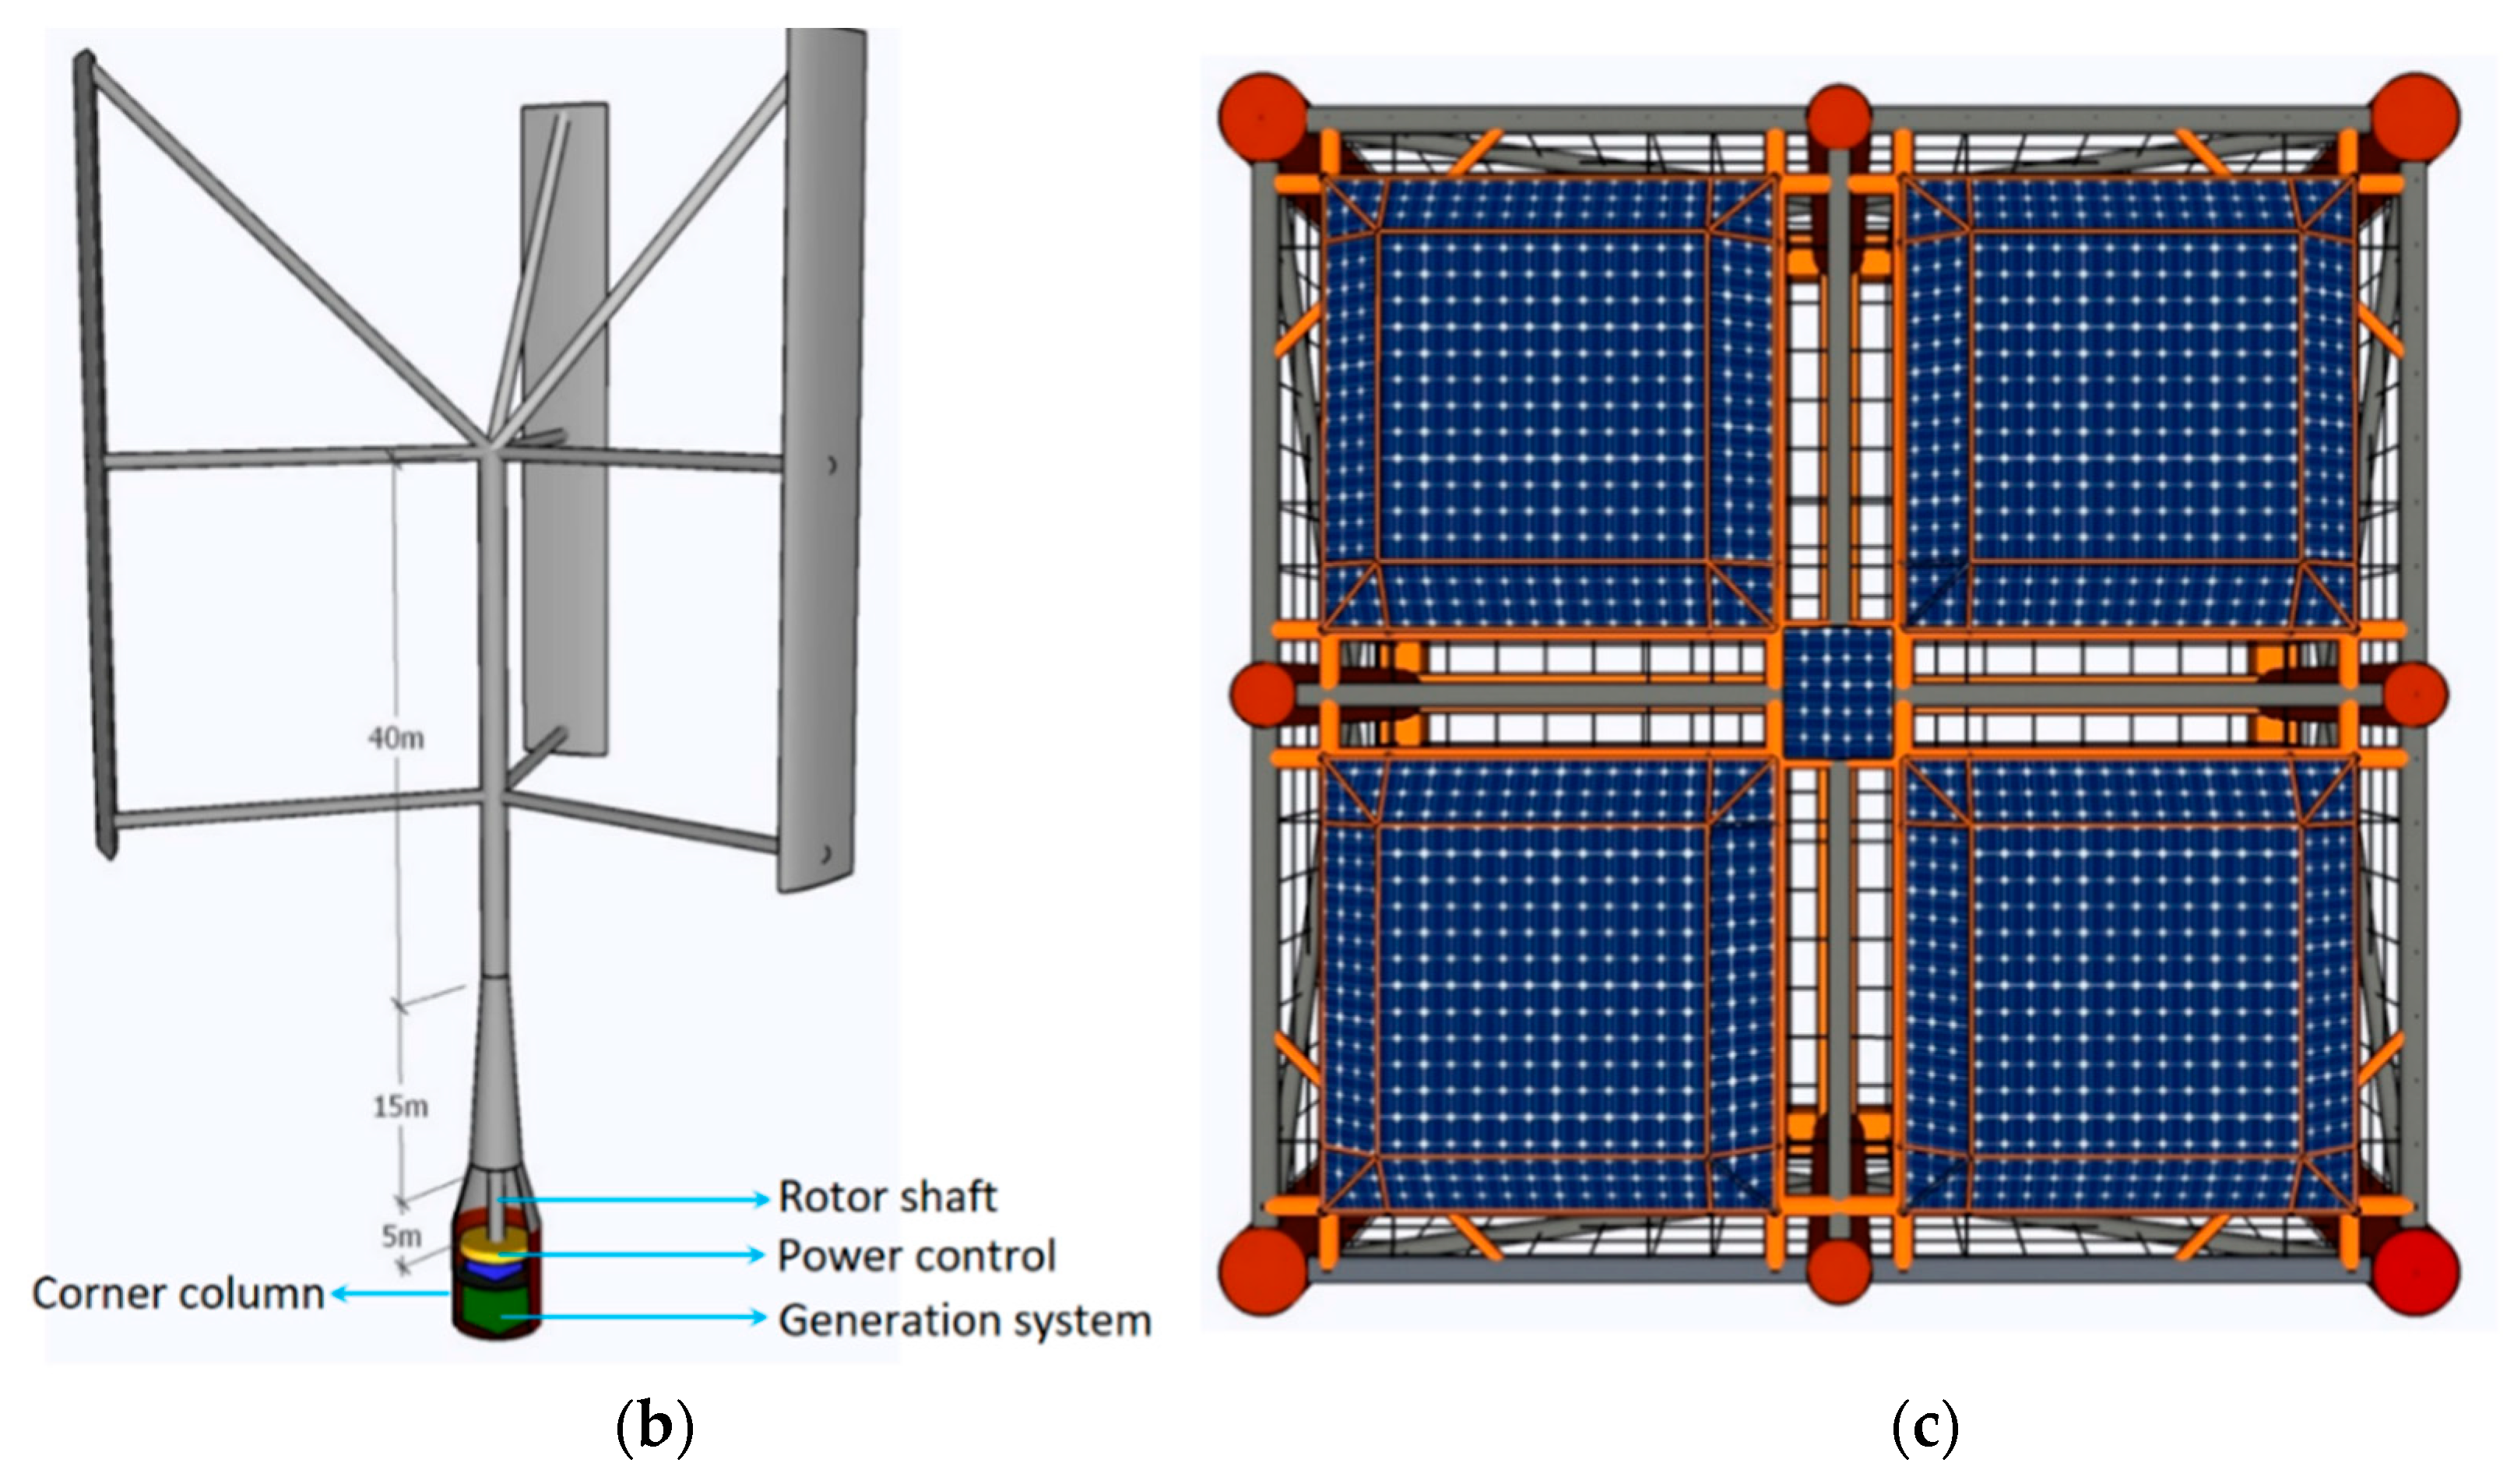
2.2. Wind–Solar Power System
2.3. Mooring System
- Tendon tension in polyester lines significantly shortens the natural period of motion and makes the floater more sensitive to wave-frequency loads;
- The water depth considered in the present study is 100–200 m in offshore continental shelves, where taut polyester lines are affected by tidal variations;
- At the same water depth, use of polyester lines incurs a higher cost than catenary chains in installation and maintenance.
2.4. Transport and Installation
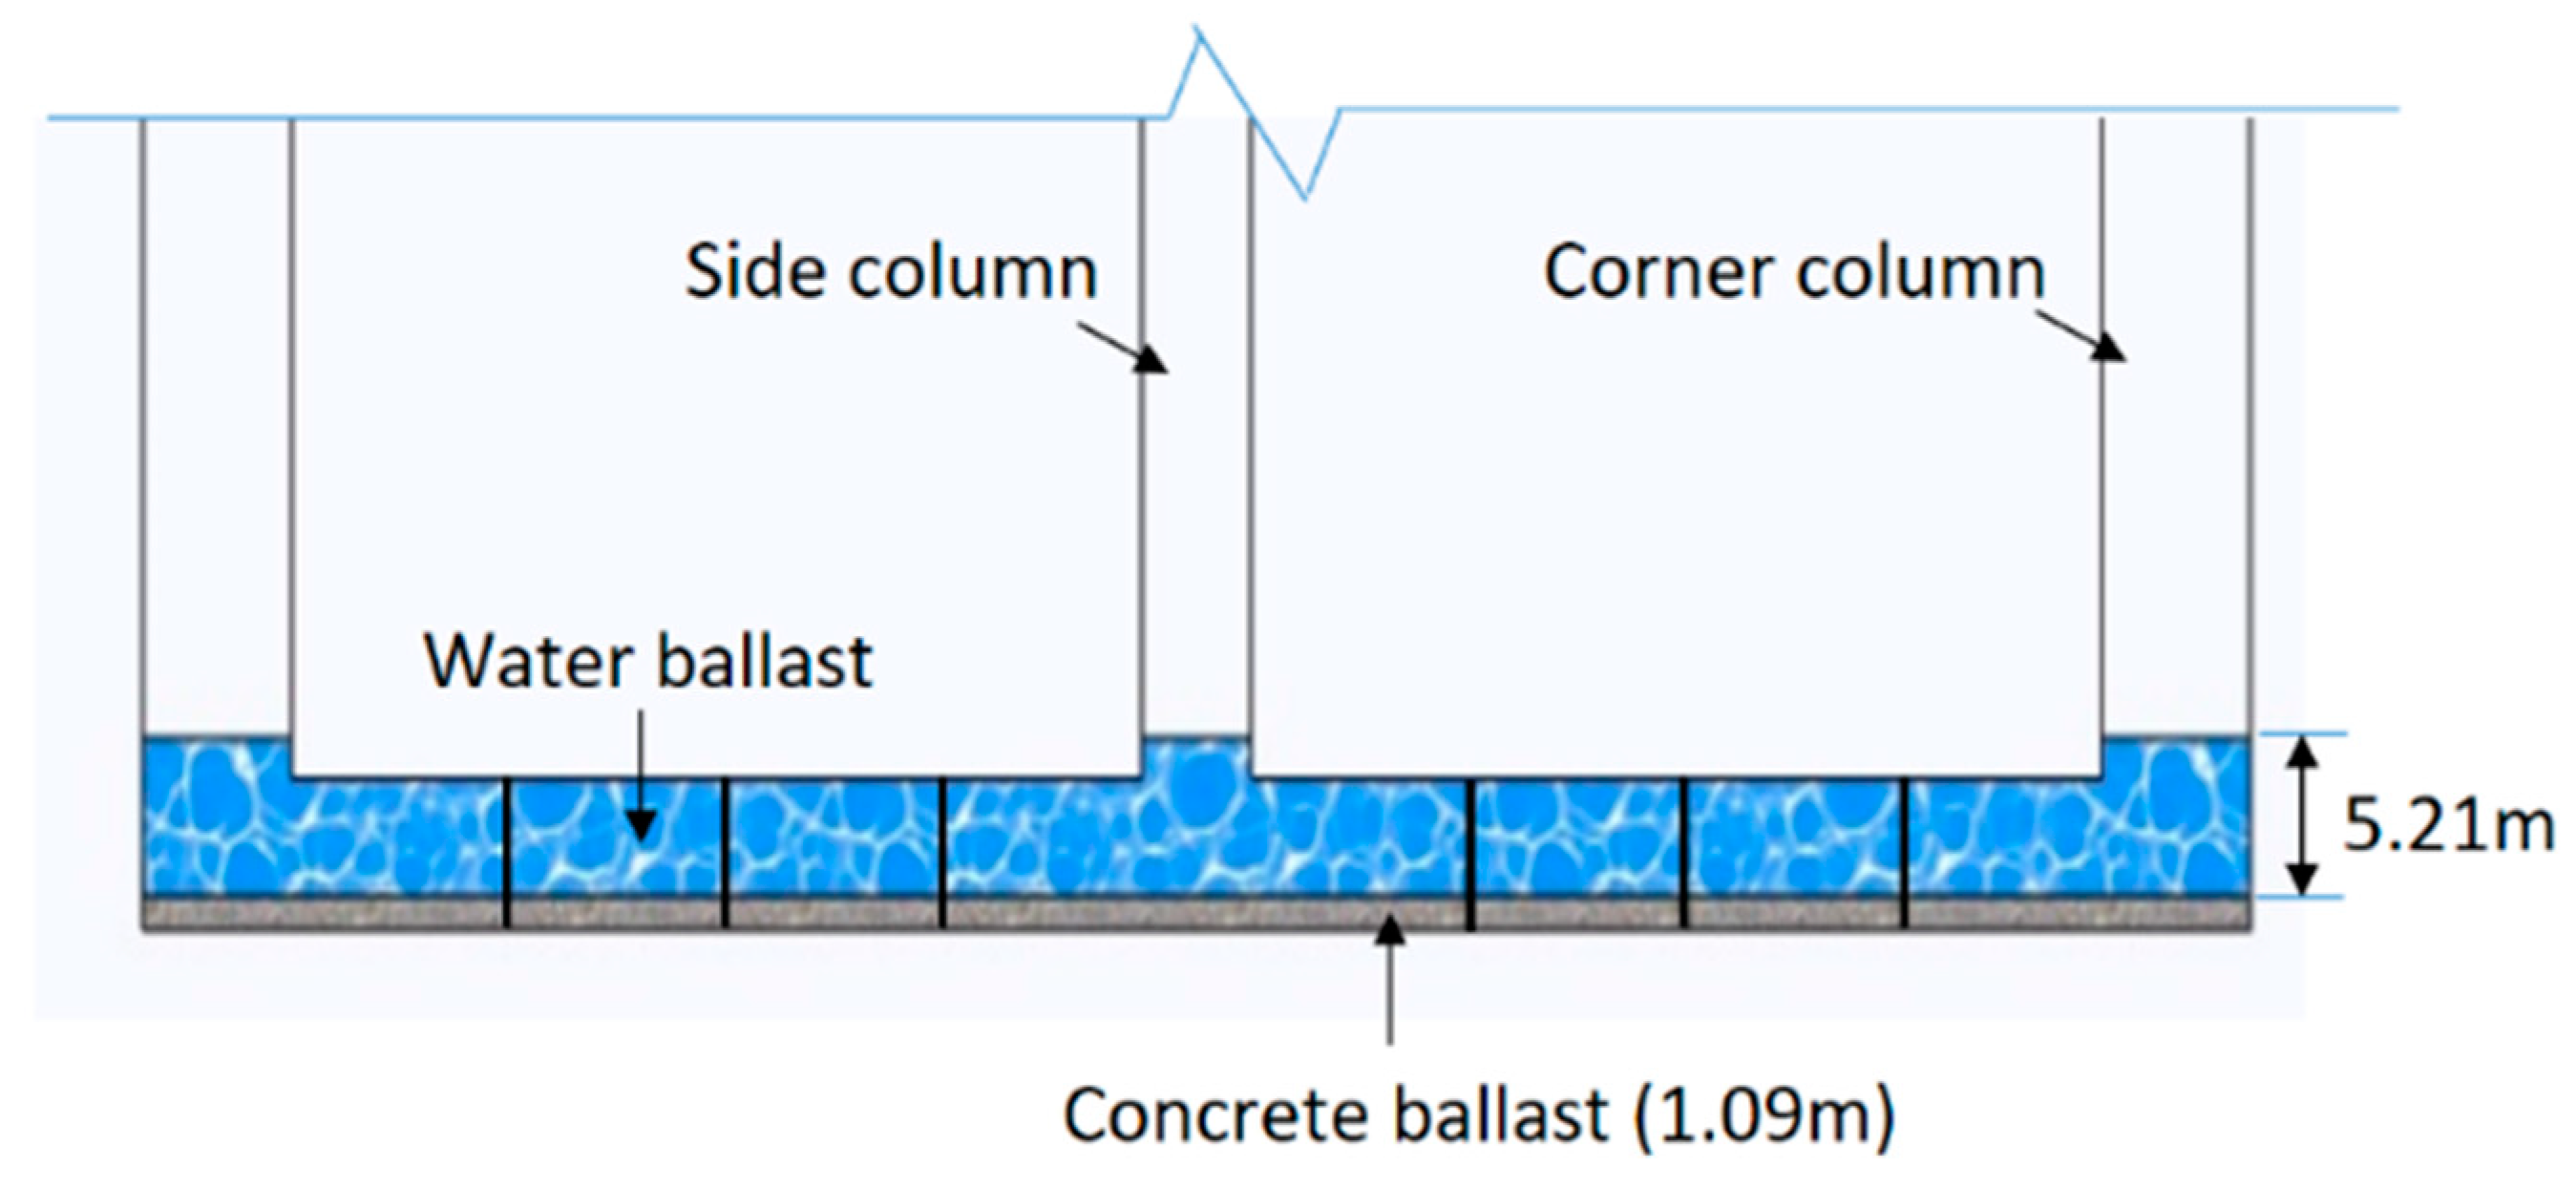
3. Hydrostatic Analysis of WSA
4. Hydrodynamic Analysis of WSA
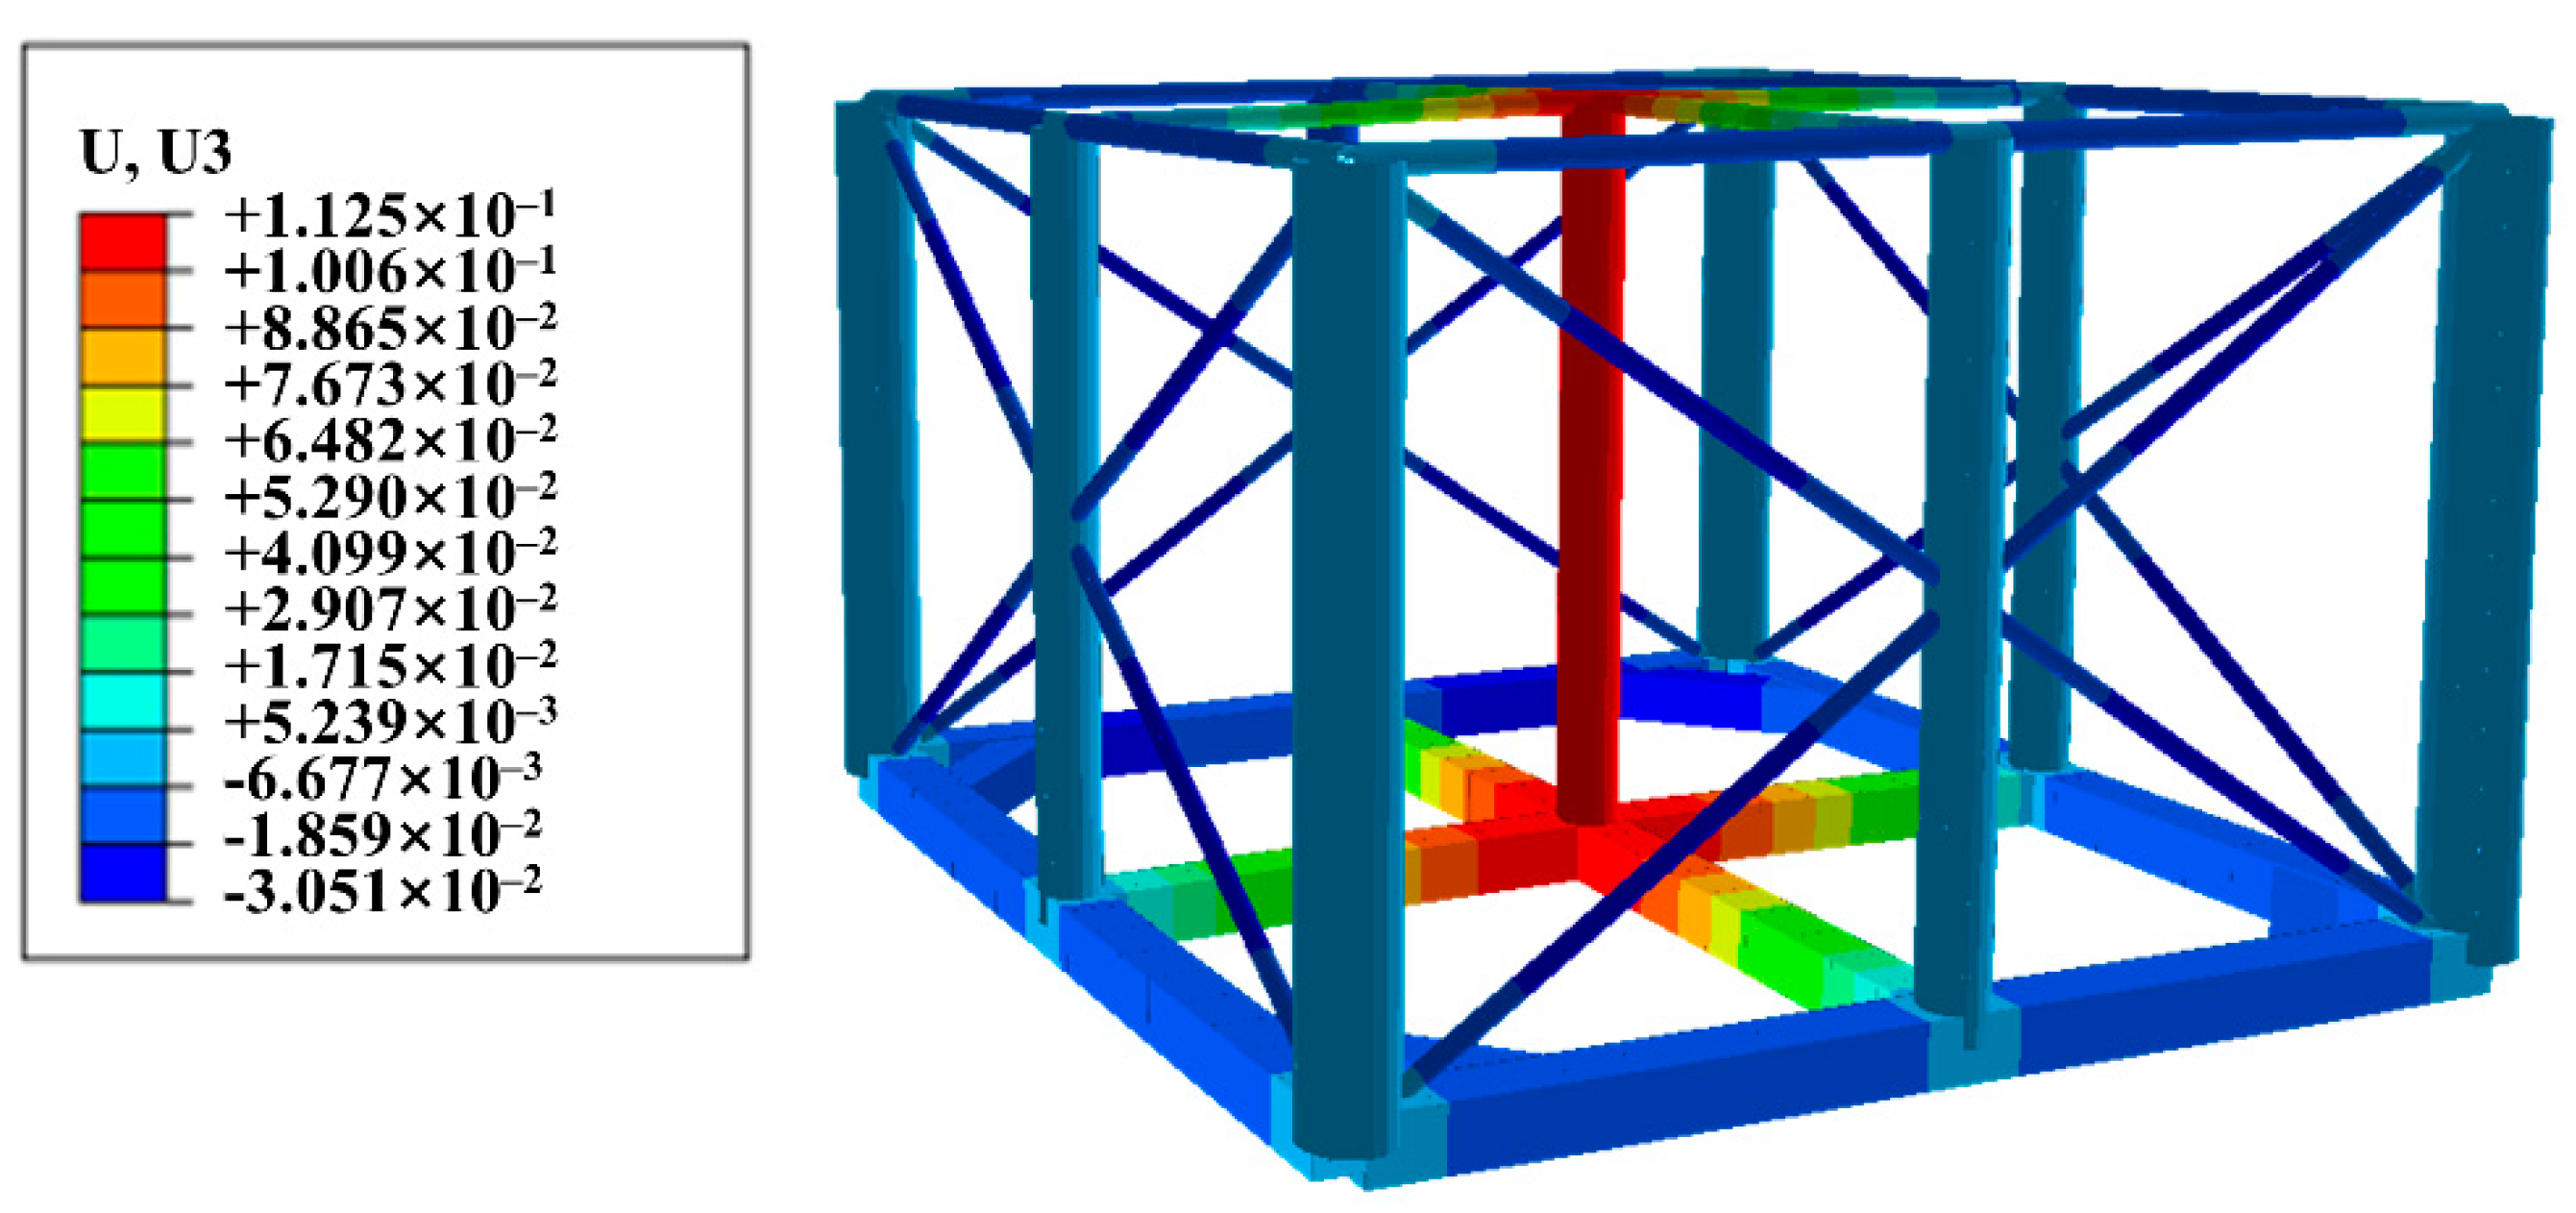
4.1. Hydrodynamic Modeling of Foundation
4.2. Response Amplitude Operators and Natural Periods of WSA
5. Stochastic Response of WSA
5.1. Governing Equation of Motions in Time Domain
5.2. Wind and Wave Statistics
5.3. Extreme Analysis in Survival Conditions
5.3.1. Wind–Wave–Current-Induced Motion Responses
5.3.2. Tension in Mooring Lines
6. Conclusions
Author Contributions
Funding
Conflicts of Interest
References
- Cahay, M.; Luquiau, E.; Smadja, C. Use of a vertical wind turbine in an offshore floating wind farm. In Proceedings of the Offshore Technology Conference, Houston, TX, USA, 2–5 May 2011. [Google Scholar]
- Bore, P.T.; Fossan, P.A. Ultimate-and Fatigue Limit State Analysis of a Rigid Offshore Aquaculture Structure. Master’s Thesis, NTNU, Taipei, Taiwan, 2015. [Google Scholar]
- Owano, N. Three Months Show Hywind Scotland Floating Wind Farm Exceeding Expectations. Available online: https://techxplore.com/news/2018-02-months-hywind-scotlandfarm-exceeding.html (accessed on 19 February 2018).
- Dabiri, J.O. Potential order-of-magnitude enhancement of wind farm power density via counter-rotating vertical-axis wind turbine arrays. J. Renew. Sustain. Energy 2011, 3, 043104. [Google Scholar] [CrossRef]
- Apelfröjd, S.; Eriksson, S.; Bernhoff, H. A review of research on large scale modern vertical axis wind turbines at Uppsala University. Energies 2016, 9, 570. [Google Scholar] [CrossRef]
- Paulsen, U.S.; Pedersen, T.F.; Madsen, H.A.; Enevoldsen, K.; Hattel, J.H. Deepwind—An innovative wind turbine concept for offshore. In Proceedings of the EWEA Annual Event 2011, Burssels, Belgium, 14–17 March 2011; European Wind Energy Association (EWEA): Burssels, Belgium, 2011. [Google Scholar]
- 10MW Aerogenerator X © Wind Power Limited & Grimshaw. Available online: http://vimeo.com/13654447 (accessed on 4 May 2015).
- Adam, F.; Myland, T.; Schuldt, B.; Großmann, J.; Dahlhaus, F. Evaluation of internal force superposition on a TLP for wind turbines. Renew. Energy 2014, 71, 271–275. [Google Scholar] [CrossRef]
- Roddier, D.; Cermelli, C.; Aubault, A.; Weinstein, A. WindFloat: A floating foundation for offshore wind turbines. J. Renew. Sustain. Energy 2010, 2, 033104. [Google Scholar] [CrossRef]
- Kvittem, M.I.; Bachynski, E.E.; Moan, T. Effects of hydrodynamic modelling in fully coupled simulations of a semi-submersible wind turbine. Energy Proced. 2012, 24, 351–362. [Google Scholar] [CrossRef]
- Karimirad, M.; Michailides, C. V-shaped semisubmersible offshore wind turbine: An alternative concept for offshore wind technology. Renew. Energy 2015, 83, 126–143. [Google Scholar] [CrossRef]
- Wen, T.; Wang, K.; Cheng, Z.; Ong, M. Spar-Type Vertical-Axis Wind Turbines in Moderate Water Depth: A Feasibility Study. Energies 2018, 11, 555. [Google Scholar] [CrossRef]
- Karimirad, M.; Moan, T. Wave-and wind-induced dynamic response of a spar-type offshore wind turbine. J. Waterw. Port Coast. Ocean Eng. 2011, 138, 9–20. [Google Scholar] [CrossRef]
- Zheng, X.; Lei, Y. Stochastic Response Analysis for a Floating Offshore Wind Turbine Integrated with a Steel Fish Farming Cage. Appl. Sci. 2018, 8, 1229. [Google Scholar] [CrossRef]
- Karimirad, M. Modeling aspects of a floating wind turbine for coupled wave–wind-induced dynamic analyses. Renew. Energy 2013, 53, 299–305. [Google Scholar] [CrossRef]
- Sethuraman, L.; Venugopal, V. Hydrodynamic response of a stepped-spar floating wind turbine: Numerical modelling and tank testing. Renew. Energy 2013, 52, 160–174. [Google Scholar] [CrossRef]
- Duan, F.; Hu, Z.; Niedzwecki, J.M. Model test investigation of a spar floating wind turbine. Mar. Struct. 2016, 49, 76–96. [Google Scholar] [CrossRef]
- Utsunomiya, T.; Sato, T.; Matsukuma, H.; Yago, K. Experimental validation for motion of a spar-type floating offshore wind turbine using 1/22.5 scale model. In Proceedings of the ASME 2009 28th International Conference on Ocean, Offshore and Arctic Engineering, Honolulu, HI, USA, 31 May–5 June 2009; American Society of Mechanical Engineers: New York, NY, USA, 2009; pp. 951–959. [Google Scholar]
- Yang, H.; Wei, Z.; Chengzhi, L. Optimal design and techno-economic analysis of a hybrid solar–wind power generation system. Appl. Energy 2009, 86, 163–169. [Google Scholar] [CrossRef]
- Zhou, W.; Lou, C.; Li, Z.; Lu, L.; Yang, H. Current status of research on optimum sizing of stand-alone hybrid solar–wind power generation systems. Appl. Energy 2010, 87, 380–389. [Google Scholar] [CrossRef]
- Yang, H.; Lu, L.; Zhou, W. A novel optimization sizing model for hybrid solar-wind power generation system. Solar Energy 2007, 81, 76–84. [Google Scholar] [CrossRef]
- Jonkman, J. Definition of the Floating System for Phase IV of OC3; NREL/TP-500-47535; National Renewable Energy Laboratory (NREL): Golden, CO, USA, 2010.
- Robertson, A.; Jonkman, J.; Masciola, M.; Song, H.; Goupee, A.; Coulling, A.; Luan, C. Definition of the Semisubmersible Floating System for Phase II of OC4; NREL/TP-5000-60601; National Renewable Energy Laboratory (NREL): Golden, CO, USA, 2014.
- Manual, O. Available online: http://www.Orcina.com/SoftwareProducts/OrcaFlex/Documentation (accessed on 21 November 2019).
- Tsukrov, I.; Drach, A.; Decew, J.; Swift, M.R.; Celikkol, B. Characterization of geometry and normal drag coefficients of copper nets. Ocean Eng. 2011, 38, 1979–1988. [Google Scholar] [CrossRef]
- Cheng, Z.; Wang, K.; Gao, Z.; Moan, T. A comparative study on dynamic responses of spar-type floating horizontal and vertical axis wind turbines. Wind Energy 2017, 20, 305–323. [Google Scholar] [CrossRef]
- Borg, M.; Collu, M. Frequency-domain characteristics of aerodynamic loads of offshore floating vertical axis wind turbines. Appl. Energy 2015, 155, 629–636. [Google Scholar] [CrossRef]
- Lin, J.; Xu, Y.L.; Xia, Y.; Li, C. Structural Analysis of Large-Scale Vertical-Axis Wind Turbines, Part I: Wind Load Simulation. Energies 2019, 12, 2573. [Google Scholar] [CrossRef]
- Cheng, Z.; Madsen, H.A.; Gao, Z.; Moan, T. Effect of the number of blades on the dynamics of floating straight-bladed vertical axis wind turbines. Renew. Energy 2017, 101, 1285–1298. [Google Scholar] [CrossRef]
- Goett, H.J.; Bullivant, W.K. Tests of NACA 0009, 0012, and 0018 Airfoils in the Full-Scale Tunnel; US Government Printing Office: Washington, DC, USA, 1938.
- DNV GL. Offshore Standard: Position Mooring; DNVGL-OS-E301; DNV GL: Høvik, Norway, 2015. [Google Scholar]
- Jeon, S.H.; Cho, Y.U.; Seo, M.W.; Cho, J.R.; Jeong, W.B. Dynamic response of floating substructure of spar-type offshore wind turbine with catenary mooring cables. Ocean Eng. 2013, 72, 356–364. [Google Scholar] [CrossRef]
- Herman, S.A. Offshore Wind Farms: Analysis of Transport and Installation Costs; Energy Research Centre of the Netherlands: Petten, The Netherlands, 2002. [Google Scholar]
- Ahn, D.; Shin, S.; Kim, S.; Kim, H. Comparative evaluation of different offshore wind turbine installation vessels for Korean west–south wind farm. Int. J. Nav. Archit. Ocean Eng. 2017, 9, 45–54. [Google Scholar] [CrossRef]
- Hibbitt, H.; Karlsson, B.; Sorensen, P. Abaqus Analysis User’s Manual Version 6.10; Dassault Systèmes Simulia Corp: Providence, RI, USA, 2011. [Google Scholar]
- WAMIT, Inc. WAMIT User Manual, version 7.0; WAMIT, Inc.: Chestnut Hill, MA, USA, 2013. [Google Scholar]
- AeroHydro, Inc. MultiSurf User Manual, version 8.0; AeroHydro, Inc.: Southwest Harbor, ME, USA, 2011. [Google Scholar]
- Barltrop, N.D.P.; Adams, A.J. Dynamics of Fixed Marine Structures, 3rd ed.; Butterworth-Heinemann Ltd.: Oxford, UK, 1991; pp. 310–319. ISBN 978-0-7506-1046-9. [Google Scholar]
- Cifuentes, C.; Kim, M.H. Numerical simulation of wake effect in nets under steady current. In Proceedings of the ASME 2015 34th International Conference on Ocean, Offshore and Arctic Engineering, Newfoundland, NL, Canada, 31 May–5 June 2015; American Society of Mechanical Engineers: New York, NY, USA, 2015. [Google Scholar]
- Jonkman, J.M.; Buhl, M.L., Jr. FAST User’s Guide; Technical Report No. NREL/EL-500-38230; National Renewable Energy Laboratory: Golden, CO, USA, 2005.
- Cummins, W.E. The Impulse Response Function and Ship Motions; David Taylor Model Basin: Washington, DC, USA, 1962. [Google Scholar]
- DNV. Recommended Practice: Environmental Conditions and Environmental Loads; DNV-RP-C205; Det Norske Veritas: Høvik, Oslo, Norway, 2007. [Google Scholar]
- Anagnostopoulou, C.; Kagemoto, H.; Sao, K.; Mizuno, A. Concept design and dynamic analyses of a floating vertical-axis wind turbine: Case study of power supply to offshore Greek islands. J. Ocean Eng. Mar.Energy 2016, 2, 85–104. [Google Scholar] [CrossRef]
- American Society of Civil Engineers. Minimum Design Loads for Buildings and Other Structures (ASCE/SEI 7-16); American Society of Civil Engineers: Reston, VA, USA, 2016. [Google Scholar]
- DNV GL. Design of Offshore Wind Turbine Structures; DNV-OS-J101; DNV GL: Høvik, Norway, 2013. [Google Scholar]
- European Centre for Medium-Range Weather Forecasts Public Dataset ERA Interim. Available online: http://apps.ecmwf.int/datasets/data/interim-full-daily/levtype=sfc/ (accessed on 21 November 2019).
- API, Recommended Practice for Planning, Designing and Constructing Fixed Offshore Platforms—Working Stress Design; American Petroleum Institute (API): Washington, DC, USA, 1993.
- IEC. IEC 61400-1, Wind Turbines-Part 1: Design Requirements, 3rd ed.; International Electrotechnical Commission: Geneva, Switzerland, 2005. [Google Scholar]
- Bitner-Gregersen, E.M.; Haver, S. Joint environmental model for reliability calculations. In Proceedings of the First International Offshore and Polar Engineering Conference, Edinburgh, UK, 11–16 August 1991; International Society of Offshore and Polar Engineers: Mountain View, CA, USA, 1991. [Google Scholar]
- Torsethaugen, K.; Haver, S. Simplified double peak spectral model for ocean waves. In Proceedings of the Fourteenth International Offshore and Polar Engineering Conference, Toulon, France, 23–28 May 2004; International Society of Offshore and Polar Engineers: Mountain View, CA, USA, 2004. [Google Scholar]
- Campanile, A.; Piscopo, V.; Scamardella, A. Mooring design and selection for floating offshore wind turbines on intermediate and deep water depths. Ocean Eng. 2018, 148, 349–360. [Google Scholar] [CrossRef]
- DNV GL. Coupled Analysis of Floating Wind Turbines; DNVGL-RP-0286; DNV GL: Høvik, Norway, 2019. [Google Scholar]


| Member | Section (m) | Quantity | Length (m) | Thickness (m) |
|---|---|---|---|---|
| Bottom ring pontoon | B × H = 4.5 × 5.0 | 8 | 45.0 | 0.028 |
| Bottom corner pontoon | B × H = 4.0 × 5.0 | 4 | 21.2 | 0.028 |
| Bottom cross pontoon | B × H = 4.0 × 5.0 | 4 | 45.0 | 0.028 |
| Corner column | D = 6.8 | 4 | 60.0 | 0.028 |
| Central column | D = 5.0 | 1 | 60.0 | 0.028 |
| Side column | D = 5.0 | 4 | 60.0 | 0.025 |
| Side brace | D = 1.5 | 16 | 54.1 | 0.015 |
| Top ring brace | D = 2.0 | 8 | 45.0 | 0.022 |
| Top cross brace | D = 1.8 | 4 | 45.0 | 0.020 |
| Top corner brace | D = 1.0 | 4 | 21.2 | 0.015 |
| VAWT | |
| Blade number | 3 |
| Blade height (m) | 60 |
| Chord length (m) | 3 |
| Aerofoil section | NACA-0018 |
| Rotor Radius (m) | 30 |
| Total height measured from SWL | 99 |
| Cut-in, rated wind, cut-out wind speed (m/s) | 5.0, 14.0, 23.0 |
| Rated rotational speed (rad/s) | 3.12 |
| Weight for each VAWT (t) | 350 |
| Total weight (t) | 1400 |
| Rated power for each VAWT (MW) | 3 |
| Total rated power (MW) | 12 |
| Solar Array | |
| Weight of support truss (kg/m2) | 0.023 |
| Weight of solar panels (kg/m2) | 0.033 |
| Area of each zone (m2) | 1900 |
| Total area (m2) | 7600 |
| Total rated power (MW) | 1.52 |
| Segment | Length (m) | Diameter (m) | Mass Density (kg/m) | Break Load (kN) | Characteristic Strength (kN) |
|---|---|---|---|---|---|
| Upper line | 135 | 0.115 | 82.0 | 3965 | 3766 |
| Lower line | 507 | 0.115 | 82.0 | 3965 | 3766 |
| Clump mass | 8 | 0.930 | 11,666 | - | - |
| Item | Value |
|---|---|
| Total mass (excluding ballasts) (kg) | 6.916 × 10⁶ |
| Dead concrete ballast (kg) | 8.560 × 10⁶ |
| Water ballast (kg) | 1.026 × 10⁷ |
| Towing displacement (m3) | 1.510 × 10⁷ |
| Operation displacement (m3) | 2.511 × 10⁷ |
| CG (m) | (0,0,−40.73) |
| CB (m) | (0,0,−36.23) |
| Transit draft (m) | 10 |
| Operation draft (m) | 51 |
| Volume net (m3) | 3.15 × 10⁵ |
| Motion | Natural Period (s) | Natural Frequency (Hz) | Equivalent Damping Ratio (%) |
|---|---|---|---|
| Surge/Sway (s) | 89.9 | 0.011 | 3.51 |
| Heave (s) | 25.4 | 0.039 | 2.59 |
| Pitch/Roll (s) | 23.2 | 0.043 | 2.00 |
| Yaw (s) | 55.4 | 0.018 | 3.88 |
| Tz (s) | 3.5 | 4.5 | 5.5 | 6.5 | 7.5 | 8.5 | 9.5 | 10.5 | 11.5 | Sum | |
|---|---|---|---|---|---|---|---|---|---|---|---|
| Hs (m) | |||||||||||
| 0.5 | 0 | 5 | 89 | 33 | 0 | 0 | 0 | 0 | 0 | 127 | |
| 1.5 | 31 | 4710 | 15,493 | 9563 | 2657 | 440 | 103 | 42 | 16 | 33,068 | |
| 2.5 | 0 | 156 | 6249 | 9195 | 2030 | 496 | 151 | 73 | 35 | 18,392 | |
| 3.5 | 0 | 0 | 48 | 3030 | 2270 | 276 | 82 | 40 | 4 | 5750 | |
| 4.5 | 0 | 0 | 0 | 10 | 661 | 231 | 29 | 9 | 4 | 950 | |
| 5.5 | 0 | 0 | 0 | 0 | 3 | 81 | 22 | 6 | 0 | 112 | |
| 6.5 | 0 | 0 | 0 | 0 | 0 | 8 | 29 | 4 | 0 | 41 | |
| Sum | 31 | 4871 | 21,899 | 21824 | 7621 | 1532 | 422 | 181 | 59 | 58,440 | |
| Load case | Spectrum | U10 (m/s) | Hs (m) | Tp (s) | Surface Current Speed (m/s) | Wind Turbine | |
|---|---|---|---|---|---|---|---|
| Wave | Wind | ||||||
| LC1 | PM | API | 23.72 | 8.62 | 15.34 | 0 | Idling |
| LC2 | PM | API | 23.72 | 8.62 | 15.34 | 2.05 | Idling |
| LC3 | DP | API | 23.72 | 8.62 | 25.00 | 0 | Idling |
| Response | Statistics | LC1 | LC2 | LC3 |
|---|---|---|---|---|
| Surge (m) | Max | 11.49 | 15.38 | 11.85 |
| Min | 2.55 | 7.64 | 2.67 | |
| Mean | 7.18 | 10.88 | 7.26 | |
| SD | 1.32 | 1.10 | 1.35 | |
| Skewness | −0.01 | 0.42 | 0.01 | |
| Kurtosis | 2.87 | 3.24 | 2.91 | |
| Heave (m) | Max | 2.89 | 2.75 | 3.55 |
| Min | −0.94 | −0.63 | −1.37 | |
| Mean | 0.99 | 1.01 | 0.96 | |
| SD | 0.51 | 0.46 | 0.75 | |
| Skewness | −0.03 | −0.01 | −0.05 | |
| Kurtosis | 3.19 | 3.09 | 2.90 | |
| Pitch (°) | Max | 2.48 | 2.35 | 4.98 |
| Min | −1.05 | −1.00 | −3.41 | |
| Mean | 0.70 | 0.65 | 0.69 | |
| SD | 0.50 | 0.49 | 1.48 | |
| Skewness | −0.10 | 0.08 | 0.02 | |
| Kurtosis | 2.94 | 2.97 | 2.40 |
| Response | Max | Min | Mean | SD | Skewness | Kurtosis |
|---|---|---|---|---|---|---|
| ax (m/s2) | 1.81 | −2.27 | 0.00 | 0.51 | −0.05 | 2.95 |
| ay (m/s2) | 0.42 | −0.46 | 0.00 | 0.12 | 0.00 | 2.83 |
| Stress (MPa) | 146.13 | 9.09 | 63.62 | 17.1 | 0.13 | 3.08 |
| Fairlead (kN) | Anchor (kN) | |||||||
|---|---|---|---|---|---|---|---|---|
| Max | Mean | SD | SD/Mean (%) | Max | Mean | SD | SD/Mean (%) | |
| Line1 | 2262 | 1854 | 69 | 3.72 | 1846 | 1465 | 75 | 5.12 |
| Line2 | 2190 | 1825 | 62 | 3.39 | 1760 | 1419 | 67 | 4.72 |
| Line3 | 2179 | 1815 | 57 | 3.14 | 1739 | 1402 | 62 | 4.42 |
| Line4 | 1683 | 1543 | 32 | 2.07 | 1218 | 1058 | 35 | 3.31 |
| Line5 | 1657 | 1514 | 32 | 2.11 | 1191 | 1026 | 36 | 3.51 |
| Line6 | 1667 | 1514 | 35 | 2.31 | 1205 | 1028 | 24 | 2.33 |
© 2020 by the authors. Licensee MDPI, Basel, Switzerland. This article is an open access article distributed under the terms and conditions of the Creative Commons Attribution (CC BY) license (http://creativecommons.org/licenses/by/4.0/).
Share and Cite
Zheng, X.; Zheng, H.; Lei, Y.; Li, Y.; Li, W. An Offshore Floating Wind–Solar–Aquaculture System: Concept Design and Extreme Response in Survival Conditions. Energies 2020, 13, 604. https://doi.org/10.3390/en13030604
Zheng X, Zheng H, Lei Y, Li Y, Li W. An Offshore Floating Wind–Solar–Aquaculture System: Concept Design and Extreme Response in Survival Conditions. Energies. 2020; 13(3):604. https://doi.org/10.3390/en13030604
Chicago/Turabian StyleZheng, Xiangyuan, Huadong Zheng, Yu Lei, Yi Li, and Wei Li. 2020. "An Offshore Floating Wind–Solar–Aquaculture System: Concept Design and Extreme Response in Survival Conditions" Energies 13, no. 3: 604. https://doi.org/10.3390/en13030604
APA StyleZheng, X., Zheng, H., Lei, Y., Li, Y., & Li, W. (2020). An Offshore Floating Wind–Solar–Aquaculture System: Concept Design and Extreme Response in Survival Conditions. Energies, 13(3), 604. https://doi.org/10.3390/en13030604