Abstract
In the present study, the effect of different kinds of impellers with different baffles or no baffle was investigated. Up-pumping pitched blade turbine (PBTU) and Rushton turbine (RT) were the two types of impellers tested. The reactor was equipped with different designs of baffles: full, half and surface baffles or no baffles. Single (PBTU or RT) and dual (PBTU/PBTU or RT/RT) use of impellers with full (FB), half (HB), surface (SB) and no baffle (NB) combinations formed two sets of 16 experiments. There was estimation of rate of hydrate formation, induction time, hydrate productivity, overall power consumption, split fraction and separation factor. In both single and dual impellers, the results showed that RT experiments are better compared to PBTU in rate of hydrate formation. The induction time is almost the same since we are deep in the equilibrium line while hydrate productivity values are higher in PBTU compared to RT experiments. As general view RT experiments consume more energy compared to PBTU experiments.
1. Introduction
Clathrates hydrates are defined as solid crystalline compounds which are formed by gas and water molecules [1,2]. Water molecules, with their cage-like structure, are able to embrace guest gas molecules such as methane, ethane, propane, isobutene, n-butane, nitrogen, carbon dioxide, hydrogen sulfide, among others, to form clathrates hydrate [2,3]. There are three distinct hydrate structures, on the basis of both type and number of cavities and the size of guest molecules. These are structure I (sI), structure II (sII) and structure H (sH) [4,5,6]. Hydrate formation is an exothermic crystallization procedure and is characterized by nucleation followed by crystal growth and agglomeration [7]. Methane hydrates are able to comprise between 150 and 180 v/v at standard temperature and pressure conditions and they provide distinct gas storage characteristics. The subject of gas hydrates has gained interest from researchers in a variety of fields [8]. While being only a topic of concern initially because of its impact on the oil and gas industry [9], recently it is becoming more promising, because of its evolved applications [10,11].
These applications include alternative energy resource [12,13], novel gas transportation [14], gas storage technology [15,16], separation technology [17,18] and carbon dioxide sequestration [19,20,21]. Furthermore, the latest growth in deep-water oil and gas production has resulted in expansion of hydrate formation studies. Due to this fact, pressure and temperature conditions in deep-water are favorable for hydrate crystals formation [22]. However, the expediency of using hydrates for industrial scopes has been a debatable topic in the field of engineering [23]. Some of the primarily problems are the slow formation, unreacted interstitial water as a large percentage of the hydrate mass, reliability of hydrate storage capacity and economy of process scale-up [24]. There are some advantages for the storage and transportation of natural gas in methane hydrates (NGH) over some of the conventional methane storage methods. As an example, natural gas liquefaction (LNG) or compression (CNG) are two of the non-pipeline methane storage methods. As some economic feasibility studies show, especially those done by Japanese industrial researcher, costs of NGH are less than those of LNG on the same scale. The studies conclude that for transporting gas amounts fewer than a million tons per year, NGH is better than LNG [25]. Additionally, as the latest studies based on total energy calculations for the three methods show, LNG method demands less energy, yet it is far more expensive than the storage and transportation of gas hydrates. When it comes to energy and economics, CNG is comparable to using gas hydrates. However, the technology available today is developed exclusively for small-scale applications [26].
Stirring reactors are widely used from many researchers in studies such as formation and dissociation of gas hydrates [27]. Among several other factors to make the storage and transportation of gas in hydrate form, hydrate formation rate has crucial importance. The faster formation of hydrates in a hydrate forming reactor can play important role on the economics of operation. Good mixing of hydrate forming components (gas and water) can accelerate the formation process. This can partly be achieved by correct selection of tank interiors. In this paper is discussed the design and evolving of a new continuous stirred-tank reactor (CSTR), with inner volume 5.7 L. The design was appropriate for practical engineering use, for quick and continuous production of hydrates. The scope of experimental process is to investigate the impact of flow conditions on methane–propane hydrate formation by using different types and numbers of impellers with different or no baffles.
2. Materials and Methods
2.1. Reactor Design
A novel apparatus of internal volume of 5.7 L has been designed and built to carry out studies on the scale up of gas hydrate formation. A schematic diagram of it is shown in Figure 1. The reactor has been designed to maximize interfacial area between reactants, thus minimizing mass transfer barriers and thermal effects that negatively affect conversion of reactants into hydrate. Gas is supplied by gas bottles through a pressure-reducing valve that provides adjustment of the pressure to the gas injection line. Mixing is supplied by a servomotor type of High Inertia (permanent-magnet synchronous motor Siemens model SIMOTICS S-1FL6). The high-pressure cylindrical AISI 316L stainless steel vessel has an internal diameter of 150 mm and an internal length of 312 mm. It has been designed for pressure values up to 150 bars and provided with a safety valve. In order to avoid friction heat due to rotational speed of impellers, cooling water is circulated around the shaft of the motor. The flow rate of refrigerated cooling bath (WCL-P12) is 12 L/min. The cooling medium is distillated water. Figure 1 shows the methane–propane hydrate formation reactor with the control unit and cooling bath.
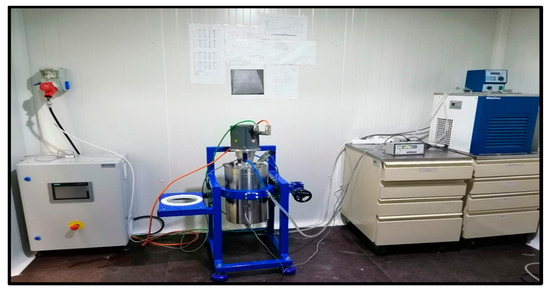
Figure 1.
Methane–propane hydrate formation reactor connected with control unit (left) and cooling bath (right).
The temperature of the refrigerated cooling bath was measured by a thermocouple inside of the bath. Two AISI 316 L stainless steel flanges are used to seal the reactor. One flange has appropriate ports for access to the interior. The five ports (3 on flange and 2 on the body of the reactor) are used for supplying gas and measuring temperature and pressure. The temperature sensors are mineral insulated type TW/T (Threaded Type Thermowells) with accuracy (±0.2 %) and measure the temperature inside in the middle part of the vessel. The Piezoresistive pressure sensors (Keller Series 21 Y) gives digital output with accuracy ±0.25 FS%. The gas inlet line is equipped with a gas pressure regulator with accuracy 0.6. Gas is supplied by gas bottles through a pressure-reducing valve that provides adjustment of the pressure to the gas injection line. Voltage signals from pressure transducers and temperature sensors collected by a PLC unit (software) for data acquisition on a personal computer. Torque measurements are also taken by PLC unit. The shaft and baffle are made by steel AISI 316L and AISI 304 equivalently, while the impellers are made by acrylonitrile butadiene styrene (ABS) plastic. Figure 2 shows the cross-sectional design of our reactor.
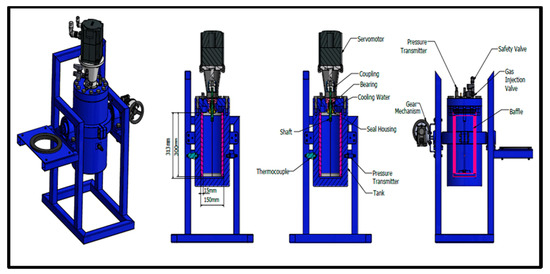
Figure 2.
Cross-sectional design of reactor.
2.2. Experimental Process
Gas (methane (95%)-propane (5%)) mixture is supplied by gas bottles through a pressure-reducing valve that provides adjustment of the pressure to the gas injection line. The purity origin of chemicals was from 94.995% (CH4) and 4.995% (C3H8)—Hatgrup Company, Kocaeli, Turkey. The volume of water is 2.65 L for single impellers and 3.8 L for dual impellers, respectively. The room temperature and tank temperature which already has the water in it, was 10 °C and after feeding with the gas until 27 to 28 bars, we put the room temperature to −5 °C until the temperature of our reactor reached 2 °C (during this period there is also dissolution of the gas (pressure decreases) due to decrease of temperature until pressure is stabilized). The rotation process starts when the tank temperature is 2 °C and the pressure is 24.5 bar (is stabilized), while we also increased the temperature of the cold room from −5 to 0 °C (hence, to stabilize the tank temperature in 2 °C, we do not want to form hydrates before rotation). The rotational period and our measurements were taken for a period of 3 h (maximum period of our measurements) after the induction time (first nuclei of gas hydrates). In occasions of hydrate dissociation before passing the 3 h, for our measurements we took the value of gas consumed (when there is start of stabilization period, before dissociation of gas hydrates). At the end of each hydrate formation experiment, when stabilization of hydrate formation starts, the composition of free gas was determined by taking gas samples in sampling tubes aiming to quantify the fractionation of gas components. Gas composition analyses were carried out at Petroleum Research Center Gas Analysis Laboratory by using Agilent 6890 series GC.
Figure 3 shows analytically the dimensions of reactor, impeller and baffles and the different designs (different baffles) of reactor with single and dual Rushton turbine (RT) impellers. First up-row from left to right: single impeller with no baffle, single impeller with full baffle (15 cm submerge in the water), single impeller with half baffle (7.5 cm submerge in the water) and single impeller with surface baffle (3.75 cm submerge in the water). The distance between the two impellers in the dual ones are 7.5 cm. The height of liquid is the same with the diameter of reactor, 15 cm in the single impeller and 22.5 cm in the dual impellers. The width of baffles is 1 cm while the internal diameter of reactor is 15 cm. The sparger has 1 cm height and is used for better gas–liquid contact for mass transfer and reaction. The bottom of clearance (distance between bottom of reactor and impeller) is 5 cm.
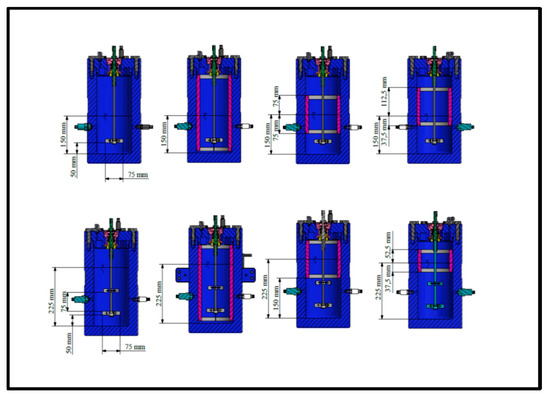
Figure 3.
Dimensions of reactor, baffles and single and dual Rushton turbine (RT) impellers.
2.3. Interpretation of Raw Data
The main objective of this study was to investigate the effect of different impeller–baffle configurations on hydrate formation kinetics. Therefore, a tool must be devised to extract the kinetic data from raw experimental data. Application of real gas law (PV = znRT) for each data point with known pressure, temperature and free gas volume gives the change in number of moles of free gas with time together compressibility (z) factor by using Lee and Kesler’s (1975) fortran program (in this program you can calculate the number of moles and compressibility factor (z) for every component if you know pressure, temperature and volume) [28]. A sample plot of change in free gas number of moles is given in Figure 4 for CH4-C3H8-SI-RT-FB.
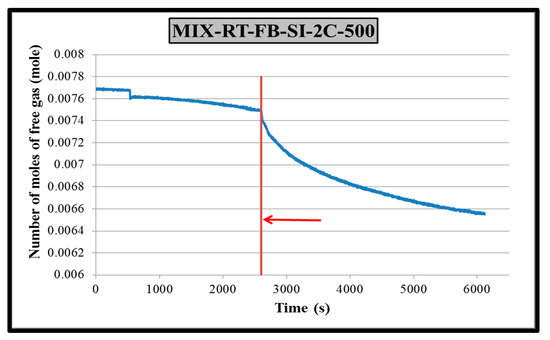
Figure 4.
Change in number of moles of free gas in CH4-C3H8-RT-FB-SI-2C experiment.
Figure 5 is plotted with the same data as Figure 4 but covering only hydrate formation period. A third-order polynomial fit of experimental data result with Equation (1).
where: n = number of moles of free gas, mol and t = time, s.
n = −2.93 × 10⁻¹⁴ t3 + 2.21 × 10⁻¹⁰t 2 − 6.56 × 10⁻⁷ t + 7.39 × 10⁻³
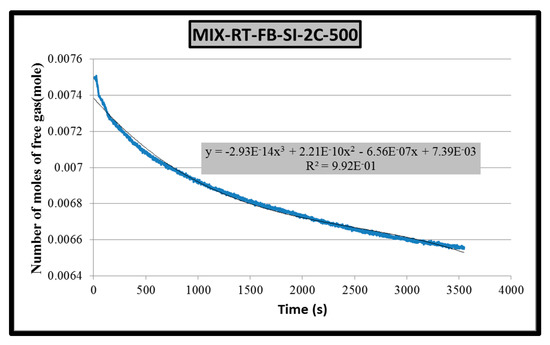
Figure 5.
Gas consumption rate equation (2 °C).
The derivative of Equation (1) results with the gas consumption rate (Equation (2)) which can be considered as the hydrate formation rate.
where: dn/dt = gas consumption rate, mol/s and t = time, s.
dn/dt = 3 × 2.93 × 10−14 t2 + 2 × 2.21 × 10−10 t − 6.56 × 10⁻⁷
Comparison of gas consumption rates of different experiments will be done by utilizing gas consumption rate equations (Equation (2) is an example) with four different time values, namely 1, 600, 1200 and 1800 s. Table 1 presents the gas consumption rates of experiment CH4-C3H8-SI-RT-FB, as an example.

Table 1.
Gas consumption rates of experiment CH4-SI-RT-FB.
2.4. Overall Power Consumption
Power consumption was calculated based on the torque measured every second based on the following equation:
where Tq is the torque in N-m and N is the rotational speed in rps and power consumption is in Watt.
Pc = Tq × 2πN
The power consumption at every second over the duration of hydrate formation for each experiment was summed to obtain overall power consumption during the experiment. The duration for the calculation of overall power consumption is the sum of the induction time of a given experiment and the hydrate formation duration of the experiment with shortest duration.
2.5. Hydrate Productivity
Hydrate productivity is defined by the formula
where, Vwater is the volume of water (l) in the reactor, R30 is the rate of hydrate growth (mol × s−1) calculated by fitting the gas uptake due to hydrate growth versus time for the first 30 min after the induction time.
NR30 = R30/Vwater(mol × L−1 × s−1)
2.6. Split Fraction
Split fraction (S.Fr) given in Equations (5) and (6) are used to quantify the partition of hydrate forming gases in free gas and solid hydrate phases,
The split fraction of methane is calculated as follows:
where nCH4Feed is the number of moles of methane in feed gas and nCH4H is the number of moles of methane in hydrate phase at the end of the experiment.
S.Fr.CH4 = (nCH4H)/(nCH4Feed)
Similarly, the split fraction (S.Fr.) of propane is calculated as follows:
where nC3H8Feed is the number of moles of propane in feed gas and nC3H8H is the number of moles of propane in hydrate phase at the end of the experiment.
S.Fr.C3H8 = (nC3H8H)/(nC3H8Feed)
2.7. Separation Factor
Natural gas hydrates are frequently used to separate gas components of given gas mixtures owing to the fact that those separated components either consumed more into the hydrate structure than the other components of the mixture, or they do not go into the hydrate structure at all. In this study, the mixture that is used to form hydrates are both hydrate formers, but it is known from literature that propane is consumed more compared to methane. Since the studied gas is rich in methane, it was decided to analyze how propane is separated from the mixture depending on the experimental conditions. Equation (7) is utilized to calculate the separation factor of propane (S.FC3H8) [29].
where nCH4gas is the number of moles of methane in the gas phase at the end of hydrate formation, nC3H8gas is the number of moles of propane in the gas phase at the end of the hydrate formation, nC3H8H is the number of moles of propane in the hydrate phase.
S.FC3H8 = (nC3H8H × nCH4gas)/(nCH4H × nC3H8gas)
3. Results and Discussions
Table 2 summarizes the results of single and dual impeller methane–propane mixture experiments. In single experiments except in one experiment (Rushton turbine–half baffle), hydrate formation started almost immediately after the start of stirring (very short induction times). RT impellers last shorter (arrive in shorter time in the start of hydrate stabilization) compared to experiments with PBTU. Split fraction values of methane are relatively low (between 0.099 and 0.133) indicating that a higher percentage of methane in the original gas still remains in free gas phase. Split fraction values of propane are much higher compared to the split fraction values of methane, as expected. Final parameter to be discussed in Table 2 is the separation factor of propane. Depending on experimental conditions, propane separated from the mixture with a factor between 37 to 64 compared to methane.
Table 2.
Summary of results of single and dual impeller, methane–propane mixture experiments.
In dual experiments, the duration of hydrate formation was always shorter than 3 h in all experiments. The effect of baffles for a given impeller type is opposite for dual impellers of PBTU and RT. The duration of hydrate formation decreases in the order of FB, HB, SB and NB for PBTU/PBTU but in opposite direction for RT/RT. Split fraction values of methane are again relatively low (between 0.115 and 0.223) but higher in dual impeller experiments compared to single impeller ones (Figure 6).
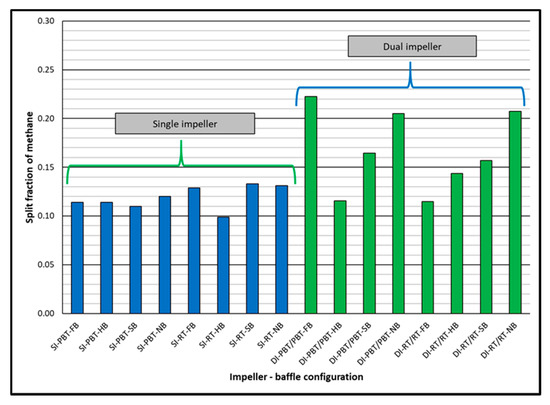
Figure 6.
Split fraction of methane for single and dual impeller experiments (experimental temperature 2 °C).
Split fraction values of propane are much higher compared to the split fraction values of methane, as expected. Again, higher split fractions of propane were observed in dual impeller experiments compared to single impeller experiments (Figure 7). Depending on experimental conditions, propane separated from the mixture with a factor between 22 to 72 compared to methane. Comparison of separation factors of propane for single and dual impeller experiments did not show a distinct trend (Figure 8).
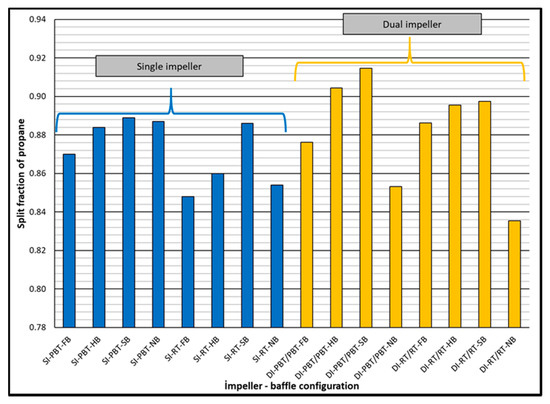
Figure 7.
Split fraction of propane for single and dual impeller experiments (experimental temperature 2 °C).
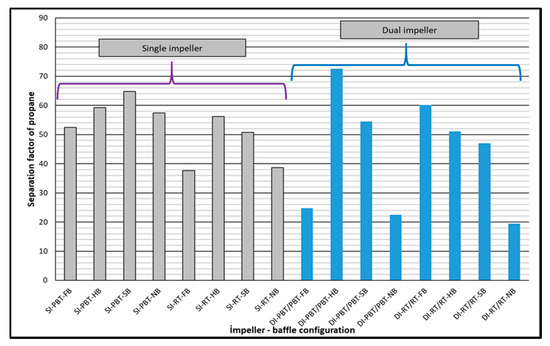
Figure 8.
Separation factor of propane for single and dual impeller experiments (experimental temperature 2 °C).
Rate of hydrate formation of mixture by using single dual impellers are presented in Figure 9 and Figure 10, respectively. The results are given for 1, 600, 1200 and 1800 s. In single experiments, the common characteristic of hydrate formation rate changes is the continuous decline of rate by time for a given experiment. Initial hydrate formation rates for RT experiments are generally higher than PBTU experiments for the same type of baffle. These outcomes show that in radial flow there is better interaction between gas and liquid compared to mixed flow. Better pumping capacity, uniform shear field and good contact ability can be suspected to be the reason of this outcome. On the other hand, the decline rate of hydrate formation is higher for RT compared to PBTU. This fact takes place due to the fact that in RT experiments there is initially high rate of hydrate formation which leads to increase the temperature of the system (exothermic reaction), hence our system cannot form any other gas hydrates. It should be mentioned that for our experiments PBTU or PBT are the same since all experiments are in mixed flow, they follow upward trending.
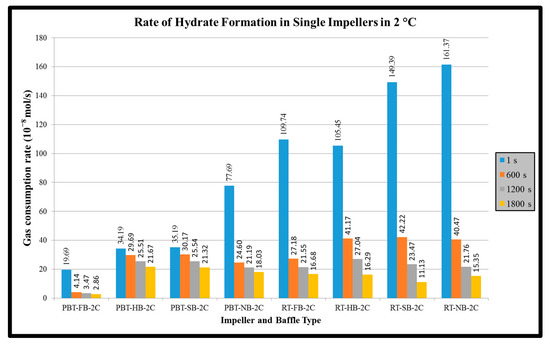
Figure 9.
Rate of hydrate formation of mixture gas with dual impeller (experimental temperature 2 °C).
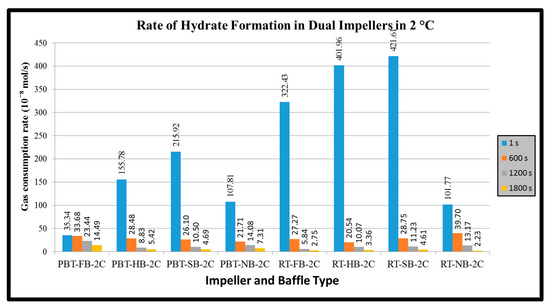
Figure 10.
Rate of hydrate formation of mixture gas with dual impeller (experimental temperature 2 °C).
In dual experiments the initial hydrate formation of RT/RT experiments with full, half and surface baffles were comparatively high among all other hydrate formation experiments of this study. There exists very sharp decline in hydrate formation rate within first 600 s. The main reason of such a sharp decline is attributed to the higher amount of hydrate formation which could restrict the mass transfer between gas and liquid phases if the solid hydrate is not removed efficiently from the gas–liquid interface. Increase in temperature due to exothermic nature of hydrate formation, change in the composition of hydrate forming gas due to different partition of components in free gas and hydrate phases are other reasons to be mentioned (see Appendix A for graphs of all single and dual experiments).
The baffles provide axial flow and eliminate the central vortex in a stirred tank. When full baffles are used, it is expected to observe the axial motion of the reactor contents beginning from the bottom of the tank. When shortened baffles such as half and surface baffles are used, however, the tangential flow would be dominant at the bottom of the tank. The axial motion would begin where or whereabouts of the start of the baffles. When there are no baffles in the system, the tangential flow is dominant everywhere, and a central vortex would form. The central vortex could be useful in incorporating gas if the vortex reaches the impeller; however, excessive entrance of the gas would have a significant effect on the hydrodynamics in the tank and the gas entrance through the vortex can become an undesired situation. Based on these, it is seen here that in single impeller experiments when full baffles are used, there is no sufficient gas entrance to the system compared to other baffles and no baffle experiments for both impellers. When no baffles are used, the hydrodynamics completely change and the central vortex for our specific conditions behave positively. In dual impeller experiments, the outcomes are not the same. The no baffle and full baffle experiments have lower values compared to half and surface baffles for both RT and PBTU impellers. Showing that in a specific system, a small amount of central vortex can play a positive role in hydrate formation for both radial and mixed flow.
Another parameter that was calculated is hydrate productivity. In single experiments, the hydrate productivity results follow the opposite way of rate of hydrate formation. PBTU experiment has higher values compared to RT experiments. The highest value of hydrate productivity occurs in PBTU with full baffle experiment (10.78 × 10⁻⁸ × s−1 × L−1) while the lowest value of hydrate productivity takes place in RT with surface baffle experiment (4.2 × 10⁻⁸ × s−1 × L−1). The same behavior happens in dual experiments. The highest value of hydrate productivity occurs in PBTU/PBTU with full baffle experiment (3.81 × 10⁻⁸ × s−1 × L−1) while the lowest value of hydrate productivity takes place in RT/RT with no baffle experiment (0.58 × 10⁻⁸ × s−1 × L−1). It is obvious that in dual experiment or RT/RT with no baffle the hydrate formation occurs only for the first 30 min of the process. Figure 11 and Figure 12 present the hydrate productivity for single and dual impellers, respectively.
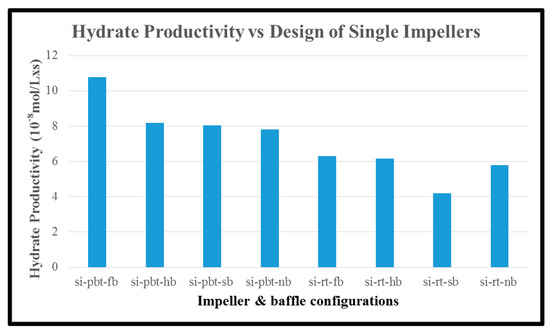
Figure 11.
Hydrate productivity of single impeller experiments.
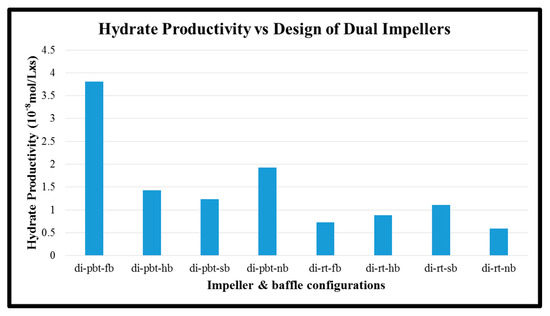
Figure 12.
Hydrate productivity of dual impeller experiments.
The last parameter that is calculated is the power consumption until the start of stabilization of hydrate formation (time that we take our samples to be measured in Gas Chromatography). In single impeller experiments (Figure 13), RT impellers consume more energy with the exception of no baffle where PBTU experiment has highest value compared to RT experiment. On the other hand, in dual experiments (Figure 14) RT/RT impellers have higher values compared to PBTU/PBTU ones in all baffle and no baffle experiments. It should be noticed that RT in single or RT/RT in dual experiments have higher values of power consumption although the total period of measurements is less compared to PBTU in single and PBTU/PBTU in dual experiments, respectively, something which is confirmed by the literature.
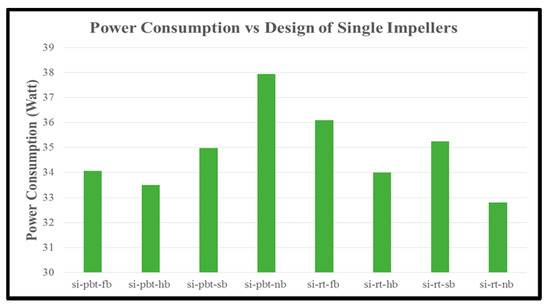
Figure 13.
Power consumption of single impeller experiments.
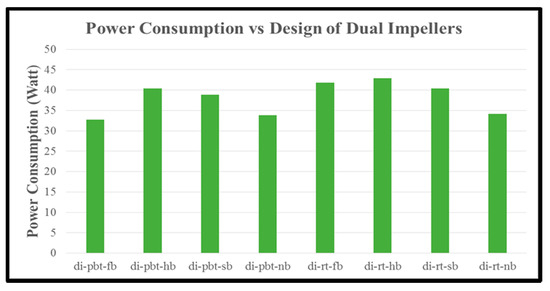
Figure 14.
Power consumption of dual impeller experiments.
4. Conclusions
This study mainly aimed to promote hydrate formation by investigating the effects of impeller baffle configurations. Under the light of the analysis of the experimental study, the following conclusions were drawn:
Single impeller experiments with methane showed that Rushton turbine (RT) impeller has better performance than up-pumping pitched blade turbine (PBTU) impeller, for all kinds of baffles showing better interaction between the gas and the liquid phases for radial flow. Better pumping capacity, uniform shear field and good contact ability can be suspected to be the reason of this outcome.
The produced gas consumption data, from the reactor systems used in this study, fit well to a third order quadratic equation as function of time.
The initial hydrate formation rate is generally higher with the use of Rushton (RT) Turbine as the impeller, but the decline rate of hydrate formation is also high compared to up-pumping pitched blade turbine (PBTU).
The higher decline rate of hydrate formation with higher initial hydrate formation is attributed to the restricted mass transfer between gas and water phases when higher amount of higher is formed at the gas–water interface initially. This actually shows the importance of the necessity the immediate and better removal of the solid hydrate particles from the gas–water interface.
Another important item for the higher decline in hydrate formation is the exothermic nature of hydrate formation. The generated heat by hydrate formation must be removed as efficiently as possible to keep the driving force for hydrate formation at higher values.
Use of dual impellers, produced similar results of single impeller.
Author Contributions
Conceptualization, S.N.L.; methodology, S.N.L.; software, S.N.L.; validation S.N.L. and M.P.; formal analysis, S.N.L.; investigation, S.N.L.; resources, S.N.L.; data curation, S.N.L.; writing—original draft preparation, S.N.L.; writing—review and editing, S.N.L.; visualization, S.N.L.; supervision, M.P.; project administration, M.P.; funding acquisition, S.N.L. All authors have read and agreed to the published version of the manuscript.
Funding
This research was received no external funding.
Conflicts of Interest
The authors declare no conflict of interest.
Appendix A

Figure A1.
Number of moles of free gas vs. time for four single PBT impeller experiments until the start of stabilization of hydrate formation.
Figure A1.
Number of moles of free gas vs. time for four single PBT impeller experiments until the start of stabilization of hydrate formation.


Figure A2.
Number of moles of free gas vs. time for four single RT impeller experiments until the start of stabilization of hydrate formation.
Figure A2.
Number of moles of free gas vs. time for four single RT impeller experiments until the start of stabilization of hydrate formation.


Figure A3.
Number of moles of free gas vs. time for four dual pbt/pbt impeller experiments until the start of stabilization of hydrate formation.
Figure A3.
Number of moles of free gas vs. time for four dual pbt/pbt impeller experiments until the start of stabilization of hydrate formation.


Figure A4.
Number of moles of free gas vs. time for four dual rt/rt impeller experiments until the start of stabilization of hydrate formation.
Figure A4.
Number of moles of free gas vs. time for four dual rt/rt impeller experiments until the start of stabilization of hydrate formation.

References
- Sloan, E.D., Jr. Clathrate Hydrates of Natural Gases, 2nd ed.; CRC Press: Boca Raton, FL, USA, 1998. [Google Scholar]
- Handa, Y. Calorimetric determination of the composition, enthalpies of dissociation and heat capacities in the range of 80–270 K for clathrates hydrates of Xenon and Kripton. J. Chem. Therm. 1986, 18, 891–903. [Google Scholar] [CrossRef]
- Makogon, I.U.R.F.; Cieslewicz, W. Hydrates of Natural Gas; Penn Well Books Tulsa: Oklahoma, OK, USA, 1981. [Google Scholar]
- Ripmeester, J.A.; Tse, J.S.; Ratcliffe, C.I.; Powell, B.M. A new clathratehydrate structure. Nature 1987, 325, 135–136. [Google Scholar] [CrossRef]
- Sum, A.K.; Burruss, R.C.; Sloan, E.D. Measurement of clathrate hydrates via Raman spectrocopy. J. Phys. Chem. B 1997, 101, 7371–7377. [Google Scholar] [CrossRef]
- Mao, W.L.; Goncharov, A.F.; Struzhkin, V.V.; Guo, Q.; Hu, J.; Shu, J.; Hemley, R.J.; Somayazulu, M.; Zhao, Y. Hydrogen clusters in clathrate hydrate. Science 2002, 297, 2247–2249. [Google Scholar] [CrossRef] [PubMed]
- Kumar, R.; Linga, P.; Moudrakovski, I.; Ripmeester, J.A.; Englezos, P. Structure and kinetics of gas hydrates from methane/ethane/propane mixtures relevant to the design of natural gas hydrate storage and transport facilities. AIChE J. 2008, 54, 2132–2144. [Google Scholar] [CrossRef]
- Kvenvolden, K. Natural gas hydrate: Background and history of discovery. In Natural Gas Hydrate; Max, M., Ed.; Springer: Dordrecht, The Netherlands, 2003; pp. 9–16. [Google Scholar]
- Carson, D.B.; Katz, D.L. Natural gas hydrates. Trans. AIME 1942, 146, 150–158. [Google Scholar] [CrossRef]
- Shahnazar, S.; Hasan, N. Gas hydrate formation condition: Review on experimental and modeling approaches. Fluid Phase Equilibria 2014, 379, 72–85. [Google Scholar] [CrossRef]
- Ansari, F.; Soofivand, F.; Salavati-Niasari, M. Utilizing maleic acid as a novel fuel for synthesis of PbFe12O19 nanoceramics via sol–gel auto-combustion route. Mater. Charact. 2015, 103, 11–17. [Google Scholar] [CrossRef]
- Englezos, P.; Lee, J.D. Gas hydrates: A cleaner source of energy and opportunity for innovative technologies. Korean J. Chem. Eng. 2005, 22, 671–681. [Google Scholar] [CrossRef]
- Klauda, J.B.; Sandler, S.I. Global distribution of methane hydrate in ocean sediment. Energy Fuels 2005, 19, 459–470. [Google Scholar] [CrossRef]
- Sun, Z.G.; Wang, R.; Ma, R.; Guo, K.; Fan, S. Natural gas storage in hydrates with the presence of promoters. Energy Convers. Manag. 2003, 44, 2733–2742. [Google Scholar] [CrossRef]
- Masoudi, R.; Tohidi, B. Gas hydrate production technology for natural gas storage and transportation and CO2 sequestration. In Proceedings of the SPE Middle East Oil and Gas Show and Conference, Manama, Bahrain, 12–15 March 2005. [Google Scholar]
- Ogata, K.; Hashimoto, S.; Sugahara, T.; Moritoki, M.; Sato, H.; Ohgaki, K. Storage capacity of hydrogen in tetrahydrofuran hydrate. Chem. Eng. Sci. 2008, 63, 5714–5718. [Google Scholar] [CrossRef]
- Nagata, T.; Tajima, H.; Yamasaki, A.; Kiyono, F.; Abe, Y. An analysis of gas separation processes of HFC-134a from gaseous mixtures with nitrogen—Comparison of two types of gas separation methods, liquefaction and hydrate-based methods, in terms of the equilibrium recovery ratio. Sep. Purif. Technol. 2009, 64, 351–356. [Google Scholar] [CrossRef]
- Eslamimanesh, A.; Mohammadi, A.H.; Richon, D.; Naidoo, P.; Ramjugernath, D. Application of gas hydrate formation in separation processes: A review of experimental studies. J. Chem. Thermodyn. 2012, 46, 62–71. [Google Scholar] [CrossRef]
- Rajnauth, J.J.; Barrufet, M.; Falcone, G. Potential industry applications using gas hydrate technology. In Proceedings of the Trinidad and Tobago Energy Resources Conference, Port of Spain, Trinidad and Tobago, 27–30 June 2010. [Google Scholar]
- Li, X.S.; Xia, Z.M.; Chen, Z.Y.; Wu, H.J. Precombustion capture of carbon dioxide and hydrogen with a one-stage hydrate/membrane process in the presence of tetra-n-butylammonium bromide (TBAB). Energy Fuels 2011, 25, 1302–1309. [Google Scholar] [CrossRef]
- Kang, S.P.; Lee, J.; Seo, Y. Pre-combustion capture of CO2 by gas hydrate formation in silica gel pore structure. Chem. Eng. J. 2013, 218, 126–132. [Google Scholar] [CrossRef]
- Mehta, A.P.; Hebert, P.B.; Cadena, R.; Weatherman, J.P. Fulfilling the promise of low-dosage hydrate inhibitors: Journey from academic curiosity to successful field implementation. In Proceedings of the Offshore Technology Conference, Houston, TX, USA, 6–9 May 2003. [Google Scholar]
- Lang, X.; Fan, S.; Wang, Y. Intensification of methane and hydrogen storage in clathrates hydrate and future prospect. J. Nat. Gas. Chem. 2010, 19, 203–209. [Google Scholar] [CrossRef]
- Rossi, F.; Filipponi, M.; Castellani, B. Investigation on a novel rector for gas hydrate production. Appl. Energy 2012, 99, 167–172. [Google Scholar] [CrossRef]
- Kanda, H. Economic study on natural gas transportation with natural gas hydrate (NGH) pellets. In Proceedings of the 23rd World Gas Conference, Amsterdam, The Netherlands, 5–9 June 2006. [Google Scholar]
- Rossi, F.; Cotana, F.; Castellani, B.; Filipponi, M. Nuovo reattore sperimentale per la produzione di gas idrati. In Proceedings of the X National Congress CIRIAF, Perugia, Italy, 9–10 April 2010. [Google Scholar]
- Hao, W.; Wang, J.; Fan, S.; Wenbin, H. Study on methane hydration process in a semi-continuous stirred tank reactor. Energy Convers. Manag. 2007, 48, 954–960. [Google Scholar] [CrossRef]
- Lee, B.I.; Kesler, M.G. A generalized thermodynamic correlation based on three parameter corresponding states. AIChE J. 1975, 21, 510–527. [Google Scholar]
- Linga, P.; Kumar, R.; Lee, J.D.; Ripmeester, J.; Englezos, P. A new apparatus to enhance the rate of gas hydrate formation: Application to capture of carbon dioxide. Int. J. Greenh. Gas Control. 2010, 4, 630–637. [Google Scholar] [CrossRef]


Publisher’s Note: MDPI stays neutral with regard to jurisdictional claims in published maps and institutional affiliations. |
© 2020 by the authors. Licensee MDPI, Basel, Switzerland. This article is an open access article distributed under the terms and conditions of the Creative Commons Attribution (CC BY) license (http://creativecommons.org/licenses/by/4.0/).