Article

The Effect of Aggressive Driving on Vehicle Parameters

Department of Automotive Engineering and Transport, Faculty of Mechatronics and Mechanical Engineering, Kielce University of Technology, 25-314 Kielce, Poland
*
Author to whom correspondence should be addressed.
Energies 2020, 13(24), 6675; https://doi.org/10.3390/en13246675
Submission received: 2 November 2020 / Revised: 12 December 2020 / Accepted: 14 December 2020 / Published: 17 December 2020
(This article belongs to the Special Issue Advances in Fluid Power Systems)

Abstract

:
Driver behavior is one of the most relevant factors affecting road safety. Many traffic situations require a driver to be able to recognize possible danger. In numerous works, aggressive driving is understood as unsafe and as a hazard entailing the risk of potential crashes. However, traffic safety is not the only thing affected by a vehicle operator’s driving style. A driver’s behavior also impacts the operating costs of a vehicle and the emission of environmental air pollutants. This is confirmed by numerous works devoted to the examination of the effect of driving style on fuel economy and air pollution. The objective of this study was to investigate the influence of aggressive driving on fuel consumption and emission of air pollutants. The simulation was carried out based on real velocity profiles collected in real-world tests under urban and motorway driving conditions. The results of simulations confirm that an aggressive driving style causes a significant increase in both fuel consumption and emission of air pollutants. This is particularly apparent in urban test cycles, where an aggressive driving style results in higher average fuel consumption and in pollutant emissions as much as 30% to 40% above the average compared to calm driving.

1. Introduction

A driver’s experience, skills, powers of observation, and ability to recognize potential hazards allow a driver to avoid possible traffic incidents. Driver behavior has been a focus of investigations since the late 1940s; the earliest research described the relationship between a driver’s personality and road safety [1]. Driving style, according to [2], can be characterized by three aspects:
  • The individual manner of driving, differing among individuals;
  • A regular way of driving, reflecting regular behavior while driving;
  • A reflection of conscious choices made by a driver.
Many authors differentiate drivers based on driving style. Drivers are classified based on vehicle kinematic parameters, including acceleration, speed, lane crossing, steering angle, and positions of the accelerator and brake pedals [3,4,5,6]. Methods based on visual features are also used to differentiate driving styles. Some researchers monitored and analyzed the driver’s head position, facial expression, ocular state (e.g., how long the driver’s eyes are open or closed, and their eye blink rate), and mouth using cameras or smartphones [7,8,9]. Previous studies have also been devoted to the physical or mental factors that impact a driver’s style and cause unusual driving behavior. Examples of these studies can be found in [10,11,12], among others.
Most classifications of driver behavior distinguish the aggressive driving style among other types. Aggressive driving refers to speeding, rapid acceleration, late braking, frequent lane changes, tailgating, and driving through red lights [13,14]. Such factors influence road safety. Many works have shown the relationship between aggressive driving and the risk of traffic hazards [15,16]. Aggressive driving also influences vehicle parameters such as fuel and energy consumption, and air-pollutant emissions. The results presented in studies [17,18,19] confirmed the increase in fuel consumption and air-pollutant emissions during aggressive driving.
In one study [17], the authors distinguished four types of drivers: aggressive, conservative, professional, and beginner. The driver classification was based on 23 personal factors, including gender, age, experience, and acceleration and deceleration values at low and high speeds during real-world tests in urban conditions. The impact of driver behavior on fuel consumption and air-pollutant emissions was then estimated. A similar method was presented [18], in which city bus drivers were tested in urban, suburban, and motorway driving conditions. The driver type was classified using two methods, the first based on speed profile characteristics such as vehicle speed, acceleration, standard deviation of speed, and longitudinal jerk; and the second based on characteristics of vehicle operation such as number, average, and standard deviations of accelerator pedal depression, steering wheel angle, and time of gear shift. The second part of the study showed the impact of driving style on fuel consumption, using a model-based analysis method and a statistical analysis method, based on real driving data.
Research [19] reported the extended car-following model with respect to the driver’s bounded rationality. The test was conducted for two different traffic situations. The results of numerical tests were used to explore the impact of the driver’s bounded rationality on air-pollutant emissions and fuel consumption. The driver’s bounded rationality has positive effects on driving behavior, and reduces total fuel consumption and CO, HC, and NOx emissions.
According to another study [20], fuel consumption can vary from 78.5% to 137.3% for gasoline vehicles, and from 116.3% to 128.3% for diesel vehicles, comparing aggressive driving to calm driving. Results [21] demonstrated that aggressive driving influences fuel consumption regardless of the road grade. During aggressive driving in urban areas, the air-pollutant emissions were as much as 40% higher than during calm driving [22,23].
Hybrid electric vehicles (HEVs) are perceived as an alternative to conventional-drive vehicles. A hybrid powertrain system combines conventional-drive components with electric-drive elements [24,25]. The electric drive alone may be engaged when idling or driving at low speed. This solution can significantly lower air-pollutant emissions and fuel consumption, especially in urban areas, where traffic congestion is common. Hybrid powertrains can employ regenerative braking, in which kinetic energy generated during braking is converted into electrical energy that is stored in the battery pack until needed. In this process, the electric traction motor works as a generator to recover energy that would otherwise be lost to the brake discs in the form of heat. Hybrid-drive vehicles provide a driving range comparable to that of conventional-drive vehicles, but without the additional infrastructure typical of conventional-drive vehicles. Numerous studies have shown that the use of hybrid electric vehicles reduces fuel consumption and emissions. Supporting examples can be found in [26,27,28], among others.
The literature features many definitions and methods to describe an aggressive driving style. In the observation method, driver characteristics are developed based on the observation of a driver’s behavior by researchers, who determine what behavior they consider is aggressive. For example, in one study [29], the behaviors used to distinguish an aggressive driver were short honking, cutting in front of another vehicle while passing, and passing one or more vehicles by driving on the shoulder and then cutting in front of the vehicles. The results demonstrated a relationship among aggressive driving, congestion, and different time periods of driving. Increases in congestion contribute to more aggressive driving, while aggressive driving diminishes during the weekend and non-rush hours.
Research on aggressive driving behavior was also described [30], presenting an observational study of aggressive driving during certain traffic events. The tests were conducted using a driving simulator. Another study [31] presented the impact of aggressive and nonaggressive driving behavior on crash injuries in traffic accidents. The model indicated that many key indicators characteristic of aggressive drivers correlated with a wide variety of factors related to the crash, including severity of driver injury, vehicle type, driver profile, spatial and temporal characteristics, roadway attributes, and traffic volume.
Another method to identify an aggressive driver is through a questionnaire designed to identify the respondent’s aggressive road behavior, including verbal and physical aggression, and violations of highway codes [32,33]. According to [34], violations of traffic regulations (speeding, not stopping at red lights, driving while under the influence of alcohol) are perceived as more aggressive than racing, voicing insults, cutting off other drivers, flashing headlights, shouting, tailgating, and making rude gestures.
Another method of identifying a driving style is based on vehicle-motion parameters. Motion sensors, such as accelerometers and gyroscopes, are used to record a vehicle’s motion parameters, allowing for the collection of data, including the vehicle’s speed; its lateral, longitudinal, and vertical accelerations; and its instantaneous positions [35]. In many studies, a driving style is determined by the speed profile and the lateral and longitudinal acceleration values. For example, one study [36] applied an online approach to monitoring a vehicle’s running state and identifying aggressive driving under normal driving conditions using kinematic parameters collected by a recorder mounted in the vehicle. A value of longitudinal acceleration above or below 3.5 m/s2 was adopted as the indicator of aggressive driving. Another study [37] presented a method for discovering unsafe driving behavior using acceleration analysis. The definition of the proper range of kinematic parameters was based on recorded readings of speeds and acceleration rates. Speed and acceleration values not within the range of the aforesaid parameters were considered as unsafe driving behavior.
According to [38], aggressive drivers can be identified based on their vehicle’s longitudinal jerk (the change rate of acceleration with respect to time). The authors reported that jerk analysis seems to perform well in identifying aggressive drivers. Issues related to defining aggressive driver behavior based on vehicle motion parameters have also been described [39,40].
Compared to the previously presented studies, in which the research was based on multiple measurement runs for many drivers, in our study, one driver was involved. The driver navigated the same test route twice, the first time driving calmly and the second time driving aggressively. The method of driving was not imposed—the driver chose what they considered to be either calm or aggressive driving. To assess how the driver would subjectively change their driving behavior, the driver was not limited by any quantitative parameters. The method of driving, and its possible change, resulted only from the willingness of the driver and the traffic situations.
In this study, we aimed to examine the impact of aggressive driving on fuel consumption and air-pollutant emissions. The analysis was conducted based on velocity profiles collected in real-world tests in urban and motorway driving conditions. Collected speed profiles were used in simulation tests. The presented tests are preliminary tests to determine the types of driver behavior based on vehicle motion parameters collected in real-world tests.

2. Materials and Methods

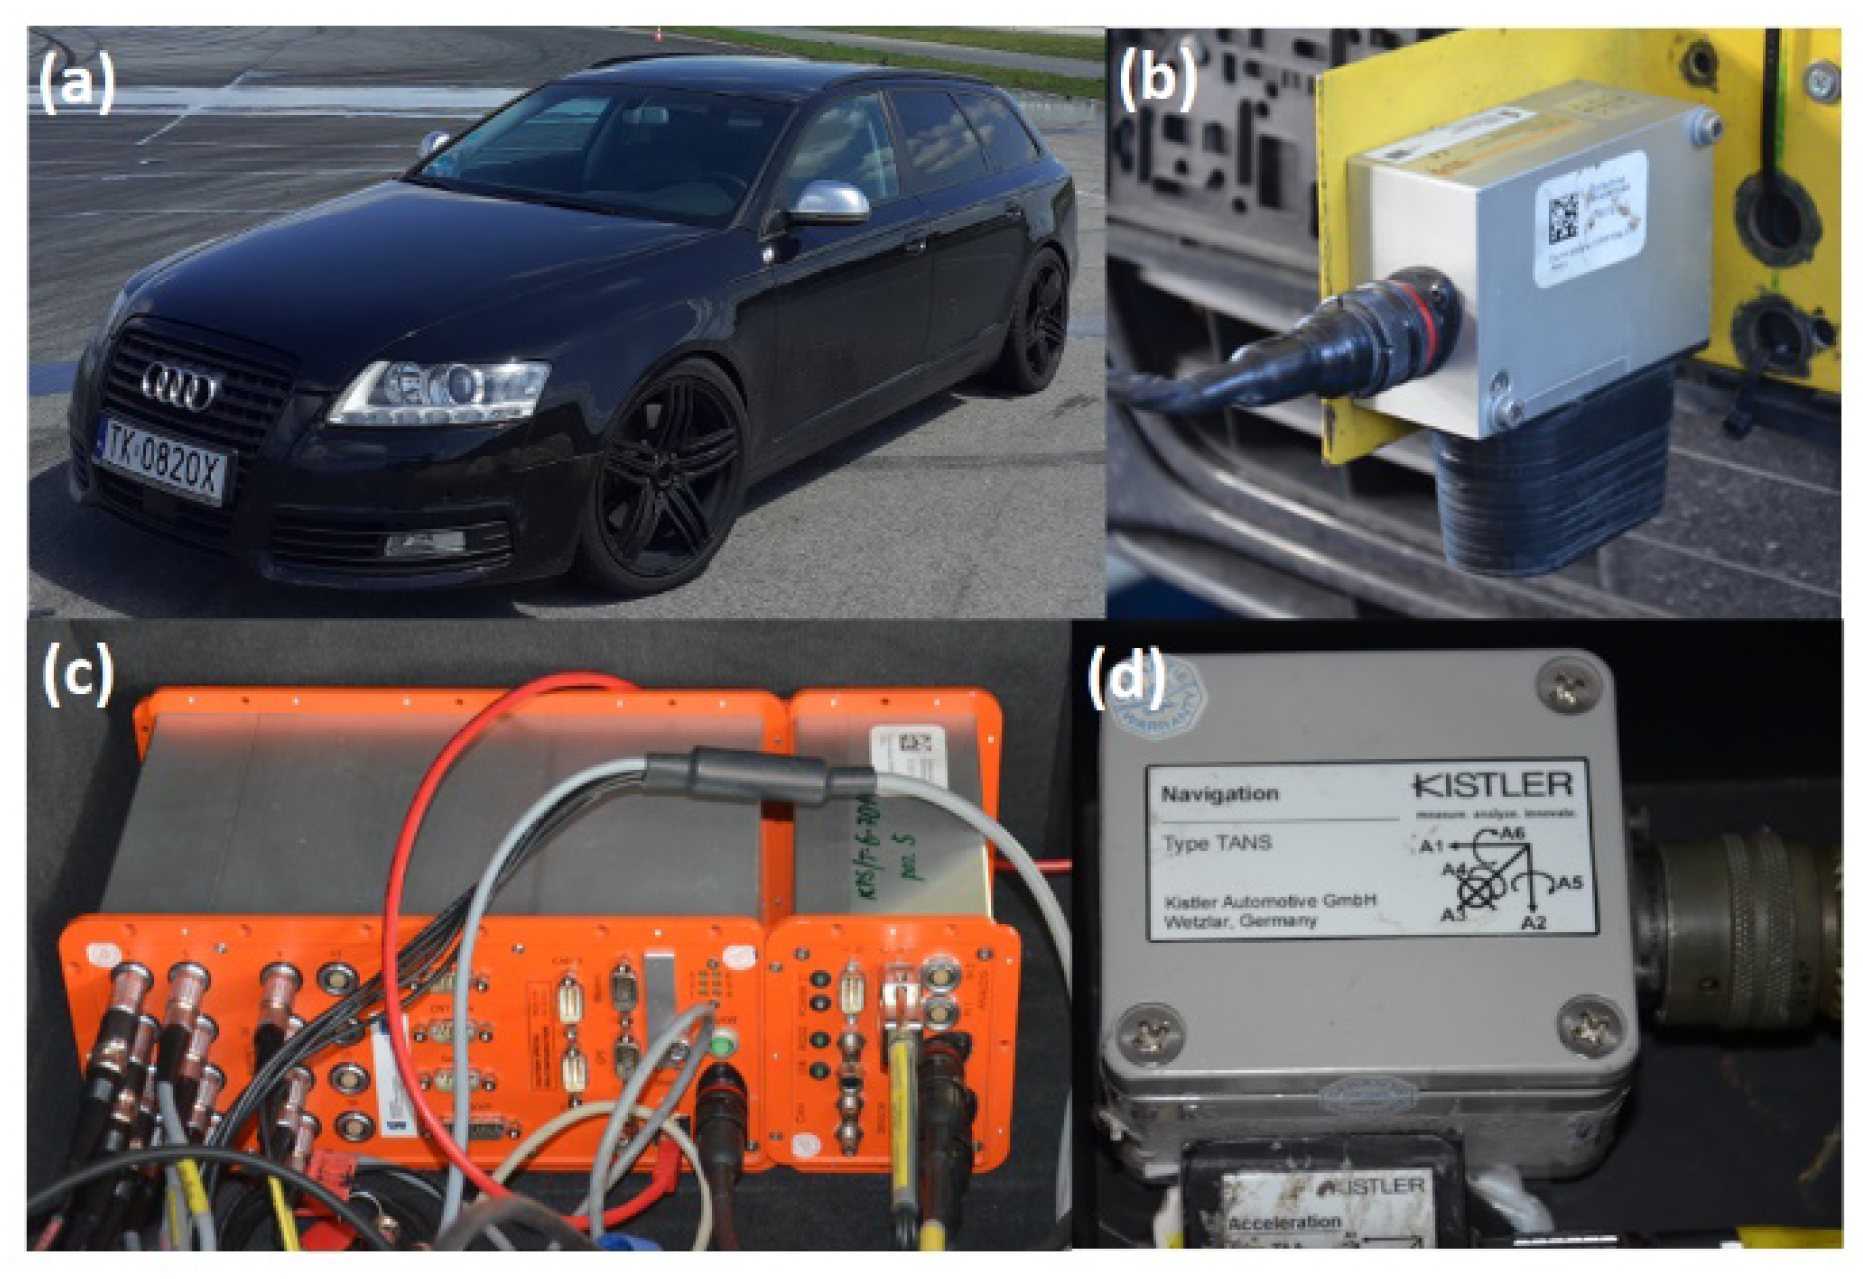
2.1. Data Collection

The test vehicle was an Audi A6 passenger vehicle (A6, Audi, Ingolstadt, Germany) (Figure 1a). During the experiment, the mass of the car was 1920 kg; according to the manufacturer, the gross vehicle weight is 2475 kg. The vehicle was powered by a 92 kW diesel engine with a capacity of 2967 cm3.
The vehicle movement parameters were collected using measurement equipment consisting of:
  • An S-350 Aqua Datron® optoelectronic sensor for measuring longitudinal speed (Figure 1b);
  • A uEEP-12 Datron® Data Acquisition Station (Figure 1c) with ARMS® data acquisition and analysis software; and
  • A three-axis linear acceleration sensor (TAA Datron® and Navigation Sensor Modules), combining a solid-state, three-axis gyro with a three-axis linear accelerometer TANS Datron® for measuring longitudinal and lateral accelerations (Figure 1d).
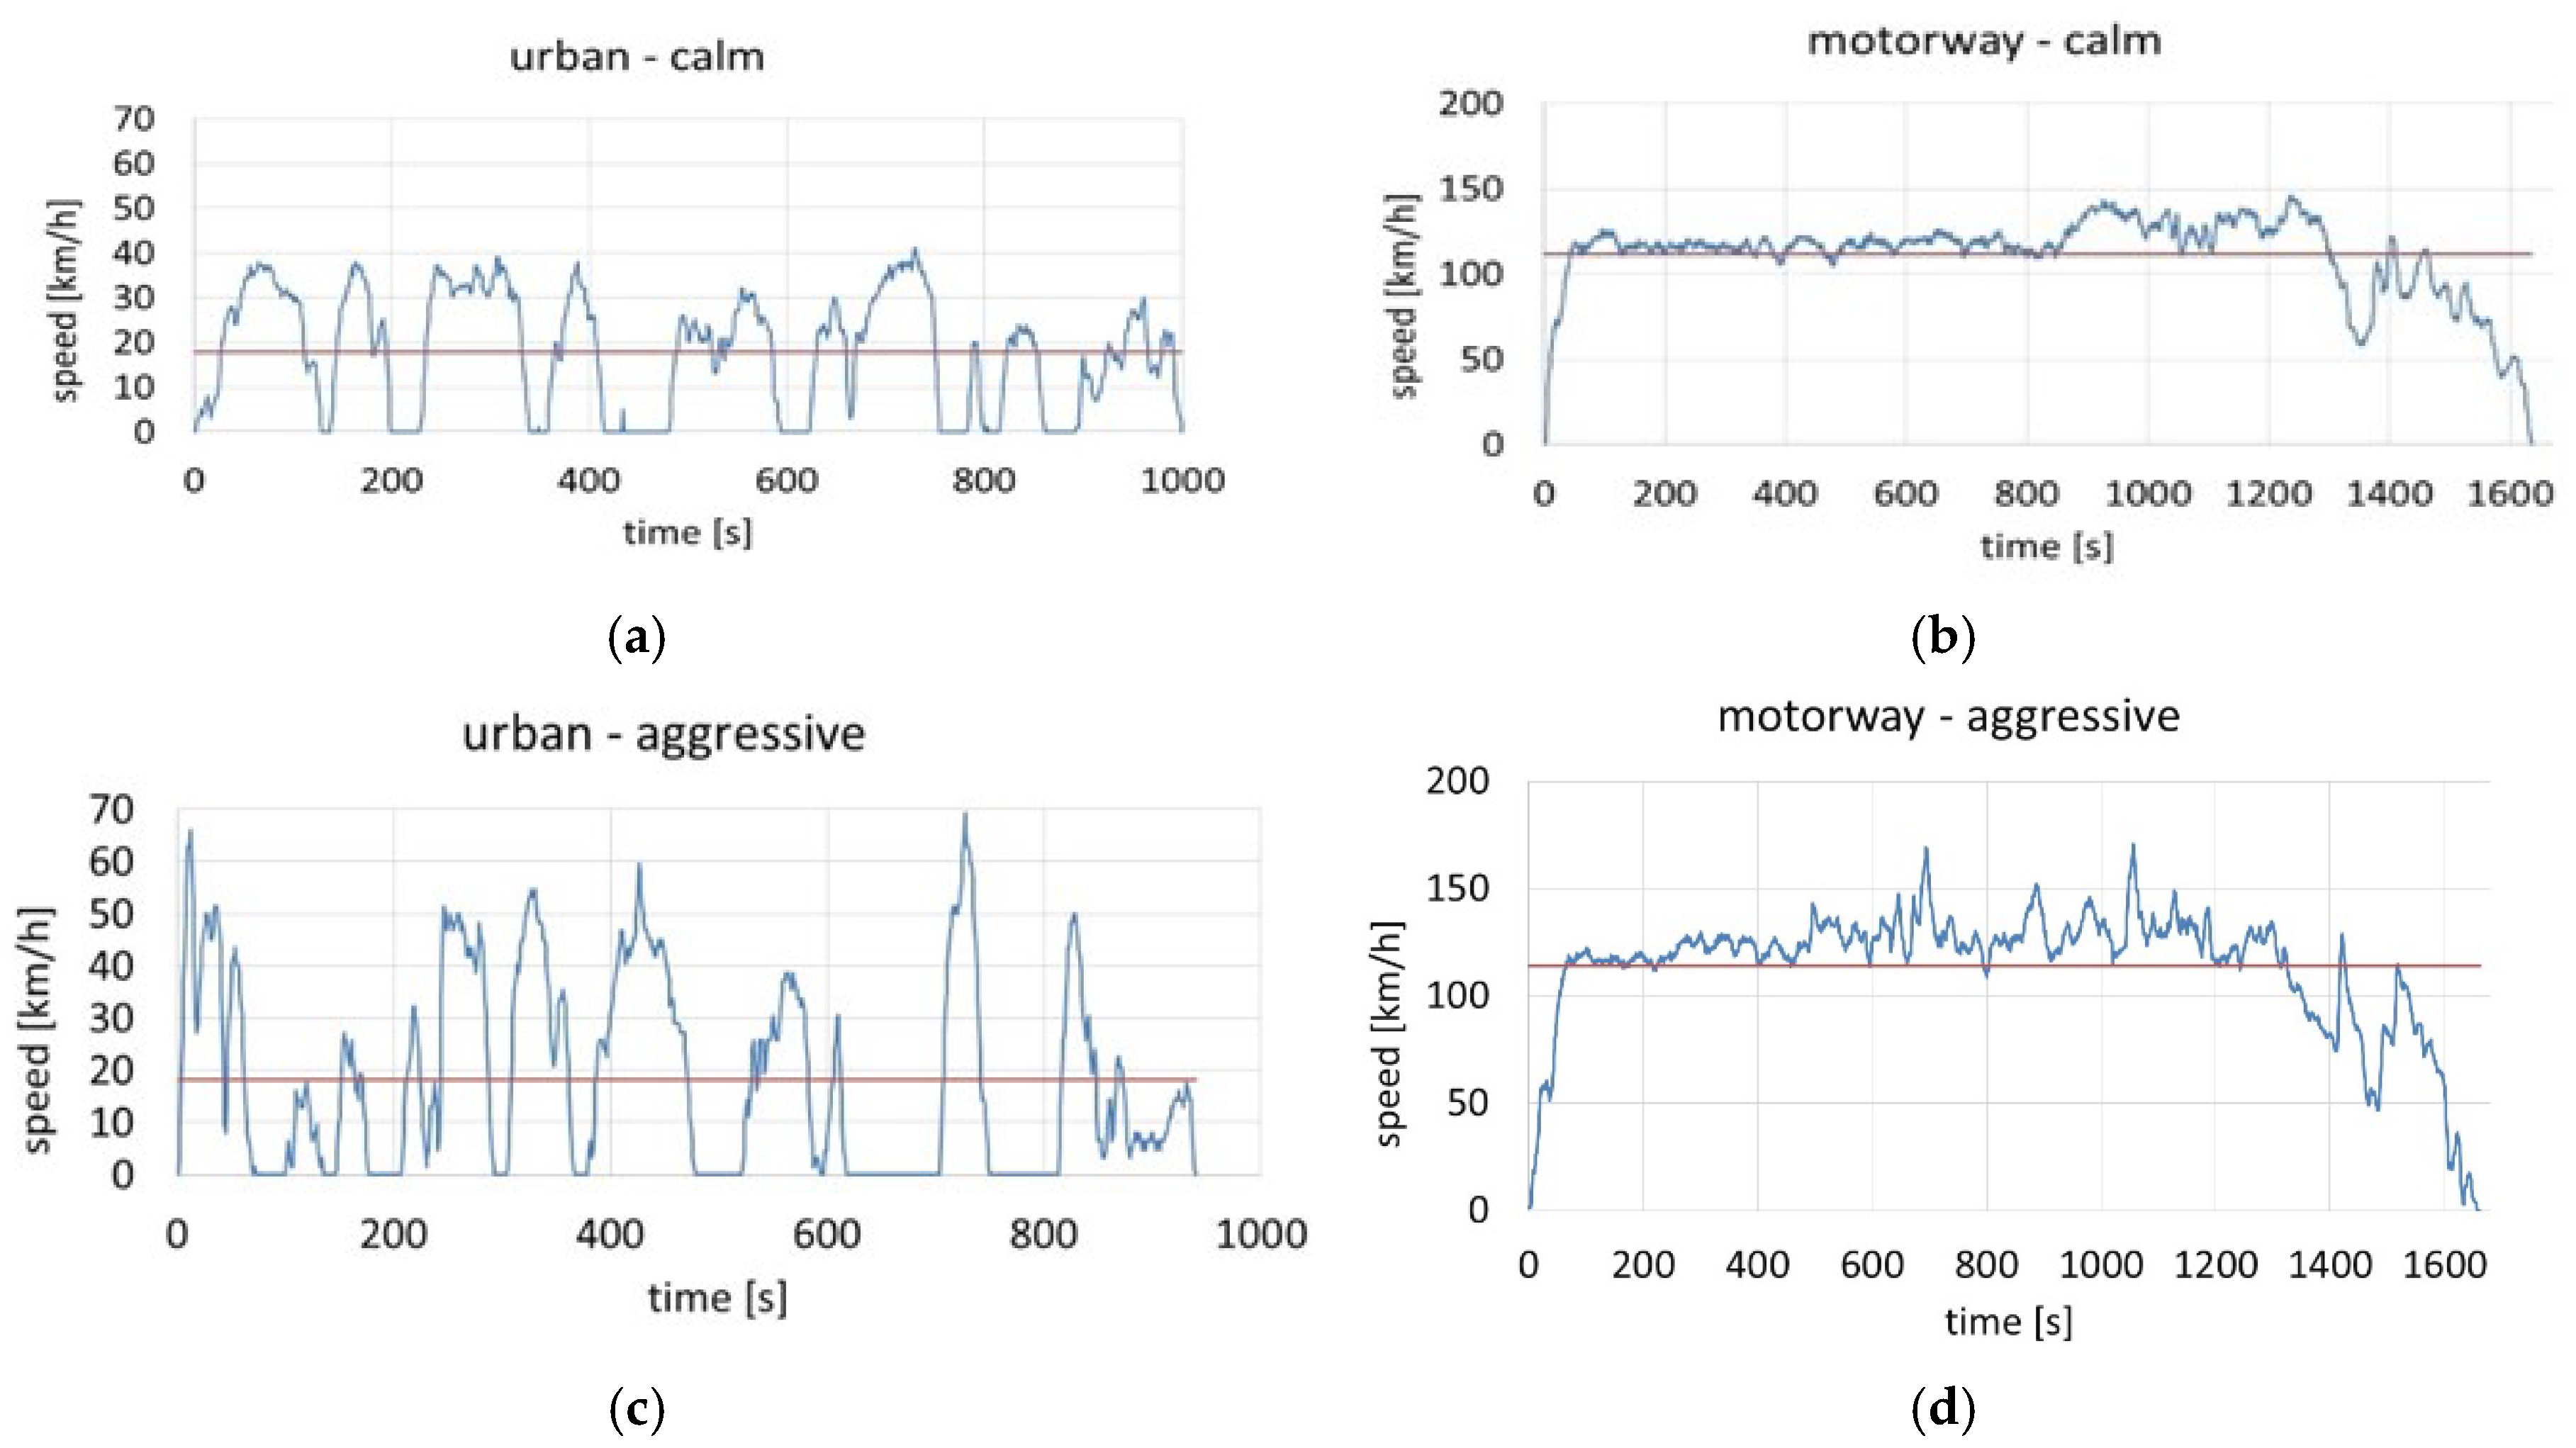
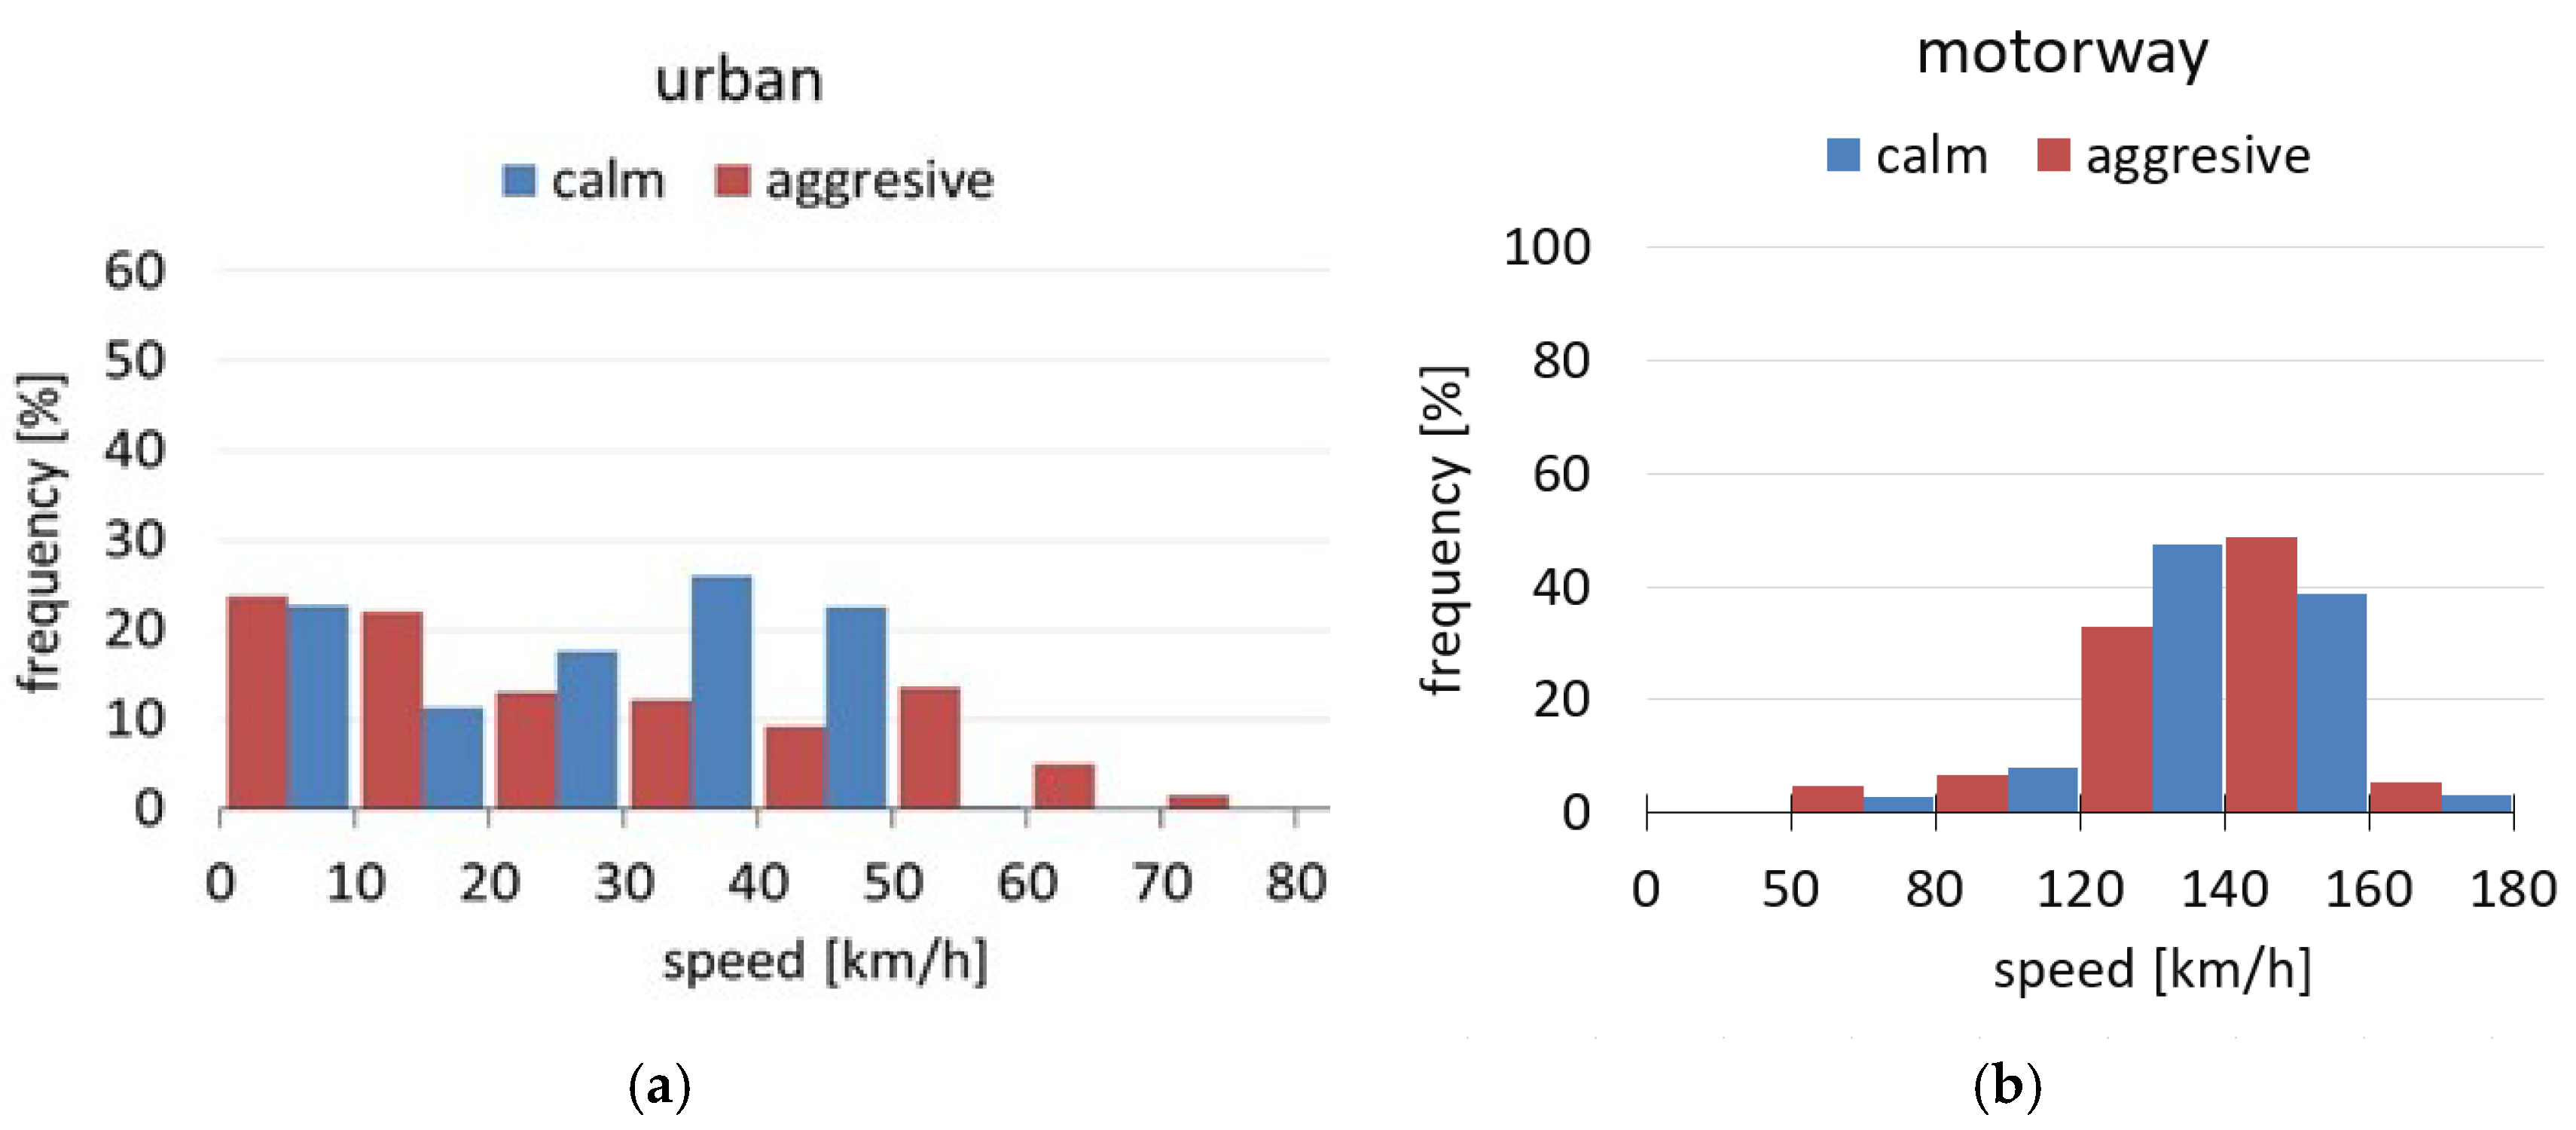
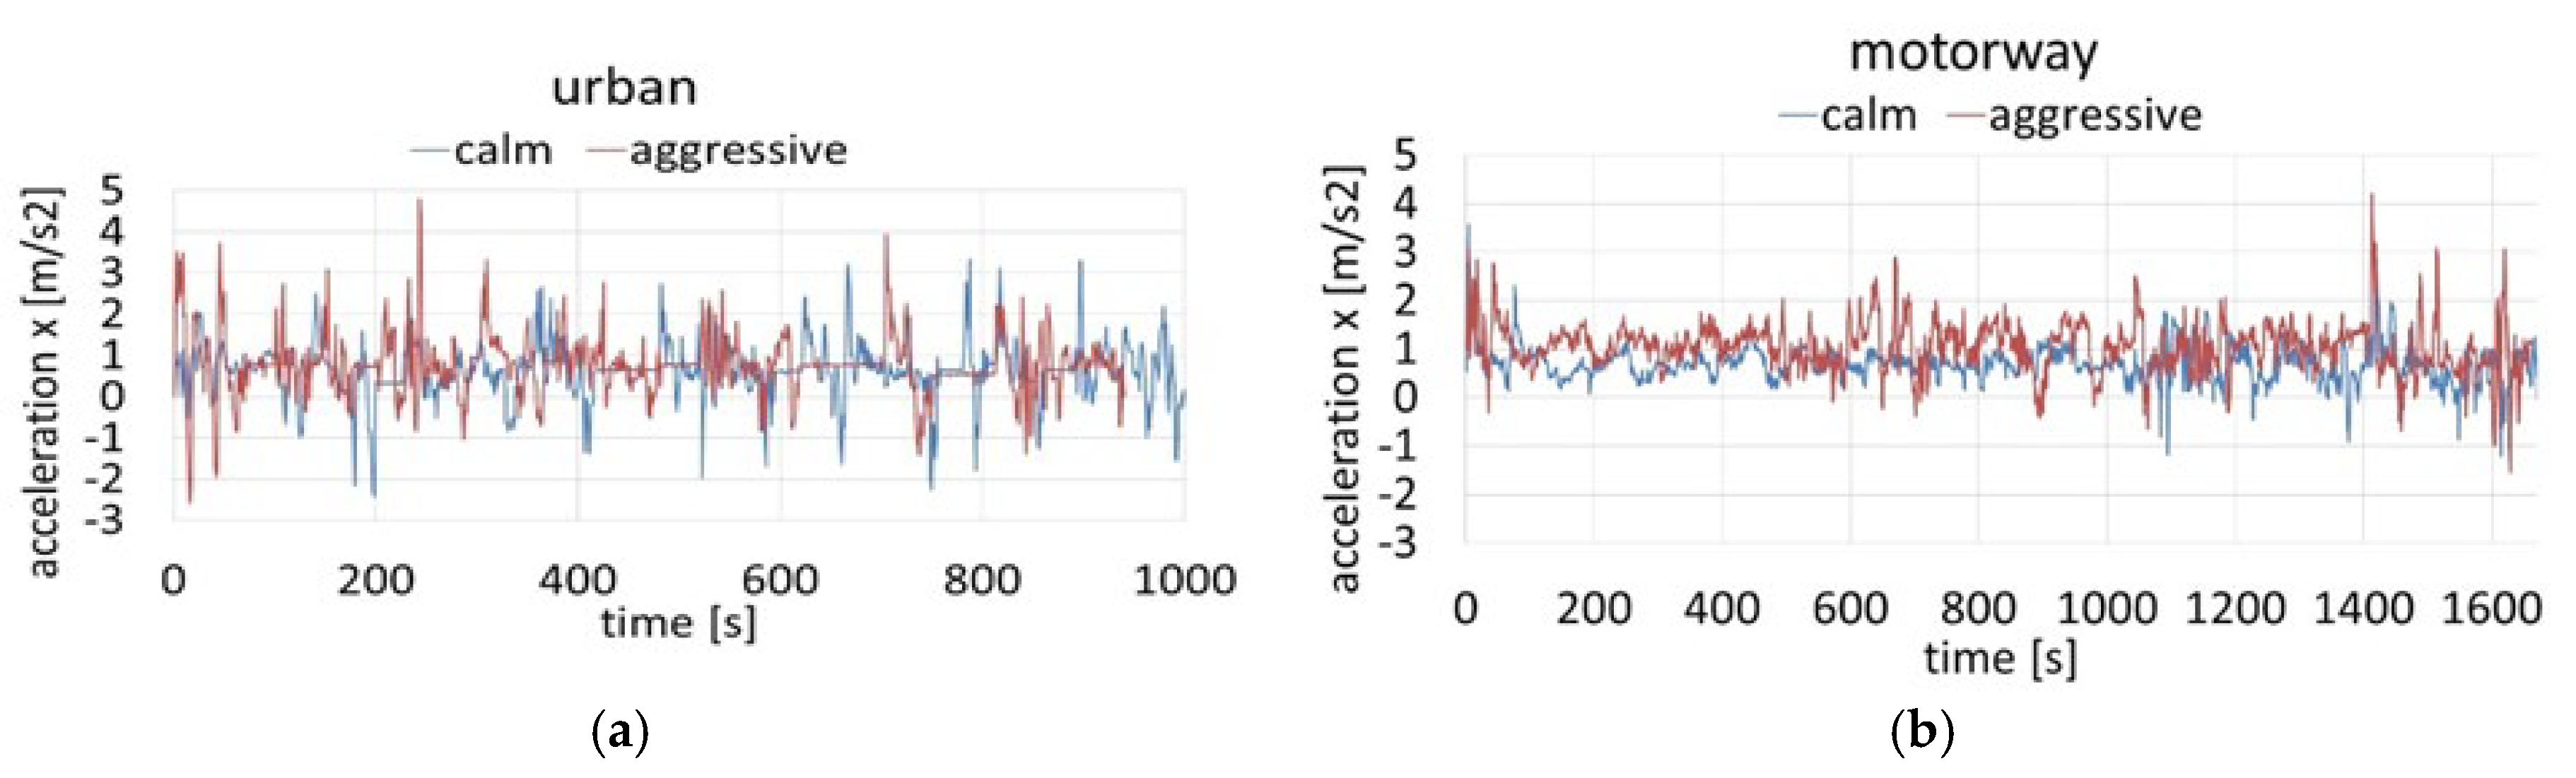
The equipment allowed for the collection of the following comprehensive vehicle-movement data: drive time, distance traveled, instantaneous speed, instantaneous acceleration, and instantaneous localization. Movement parameters were recorded during test drives on a motorway and in urban traffic in Kraków, Poland.
As mentioned above, the driver was given no requirements or instructions on how to drive. What might be either calm or aggressive driving was left to the discretion of the driver. The driving tactic they adopted resulted from their individual experience and subjective assessment. The recorded velocity and acceleration profiles in both runs were then used in computer simulations. The impact of driving style on fuel consumption and air-pollutant emissions were assessed based on the simulation results.

2.2. Test Cycles

The test cycles, based on the real-world vehicle movement parameters, were conducted during test drives on a working day under two driving conditions: motorway and urban area. Driver behavior was also considered. The tests were conducted for aggressive and calm driving styles. The speed profiles recorded during real driving tests on a motorway and in urban driving conditions are shown in Figure 2.
A calm driving style is understood as unhurried and patient driving behavior, moderate acceleration, anticipatory braking, and obedience of speed limits and traffic signs. An aggressive driving style is characterized by abrupt movements of the pedals and steering wheel, quick gear changes and acceleration, braking at the last possible moment, and frequent lane changes. Figure 3 shows the percentage distribution of velocity in examined test cycles.
As shown in Figure 3, during the motorway test, cycles reflecting aggressive driving at speeds in excess of the speed limit constituted more than 40% of the total driving. In the urban test cycle, 23% of the total driving was in excess of the speed limit. The longitudinal acceleration profiles of the test cycles are presented in Figure 4.
The average speed and acceleration values obtained for motorway driving conditions were similar, regardless of whether the driving behavior was calm or aggressive. The aggressive driving style on the motorway included speeding, frequent lane changes, abrupt braking, and rapid acceleration. Figure 3 shows the percentage distribution of acceleration during the test routes. Calm driving consisted of slight fluctuations in longitudinal acceleration values. In calm driving, the longitudinal acceleration values that ranged from −1 to 1 m/s2-constituted 86% of the total acceleration values (Figure 5). Aggressive driving behavior on the test route was characterized by a maximum longitudinal acceleration of 4.21 m/s2 and a maximum longitudinal deceleration of 1.51 m/s2. The longitudinal acceleration values that ranged from −1 to 1 m/s2 constituted 44% of the total acceleration values for aggressive driving.
Driving in the urban area included obeying the corresponding speed limits, and frequent acceleration and braking. The short distance between traffic lights prevented the driver from maintaining a constant speed. Aggressive driving was identified by sudden movements when accelerating from a stop, abrupt braking when traffic lights changed, speeding, and crossing through an intersection against the red light. The test cycle for calm driving estimated the longitudinal acceleration values at −2.42–3.35 m/s2. In aggressive driving, the longitudinal acceleration showed a wider range (−2.58 to 4.78m/s2).

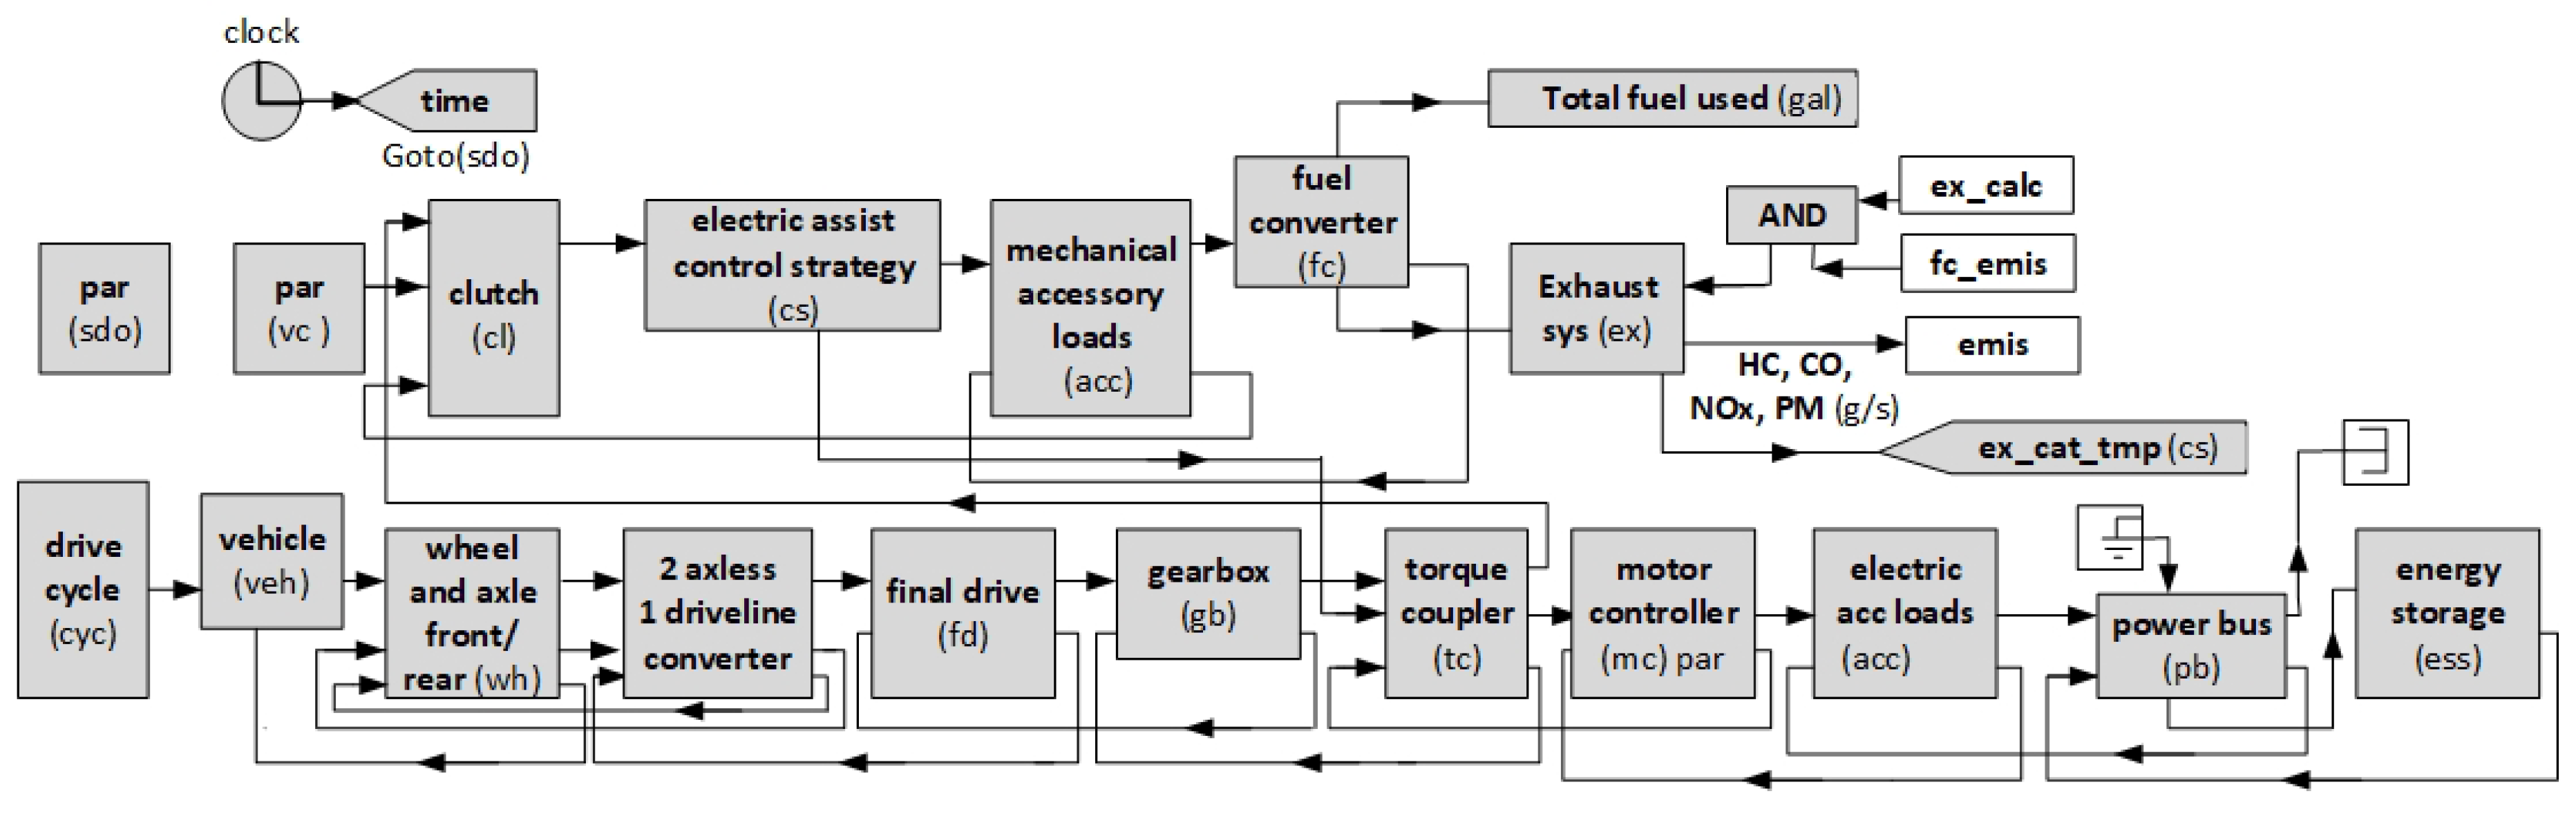
2.3. Simulation Test

The simulation tests were conducted using the ADVISOR (ADvanced Vehicle SImulatOR) (2003, National Renewable Energy Laboratory, Golden, CO, USA) program, which is widely employed to simulate vehicles of various drive configurations, including conventional, hybrid, electric, and hydrogen-cell drive. ADVISOR operates as part of MATLAB/Simulink (2015a, MathWorks, Natick, MA, USA) software. The vehicle model is built by selecting parameters from a complex database that contains various vehicle types and drive systems, as well as the particular elements of a given drive. In creating a vehicle model, the user can implement models of new vehicles and their components, then select a drive cycle. Using the assumed drive unit configuration and specified drive cycle, the program estimates the energy consumption and performance of the analyzed drive train. Figure 6 shows a parallel hybrid vehicle model developed in ADVISOR (2015a, MathWorks, Natick, MA, USA).
The vehicle models available in ADVISOR were modified, and passenger car models with conventional and parallel hybrid electric (HEV) drive were developed. Two types of engine were considered: diesel and gasoline-powered internal combustion engines. The front area of the analyzed vehicles was 2.66 m2, the rolling resistance coefficient was 0.009, and the aerodynamic resistance coefficient was 0.44. For all simulation cases, the curb weight was 1200 kg plus a load of 150 kg. For the hybrid vehicle, the weight was further increased by the battery weight. The selected parameters of the vehicles used in the simulation are presented in Table 1.
In the case of hybrid electric vehicles, the simulation was conducted for various capacities of energy storage. The battery’s initial state of charge before any trip was 70%.

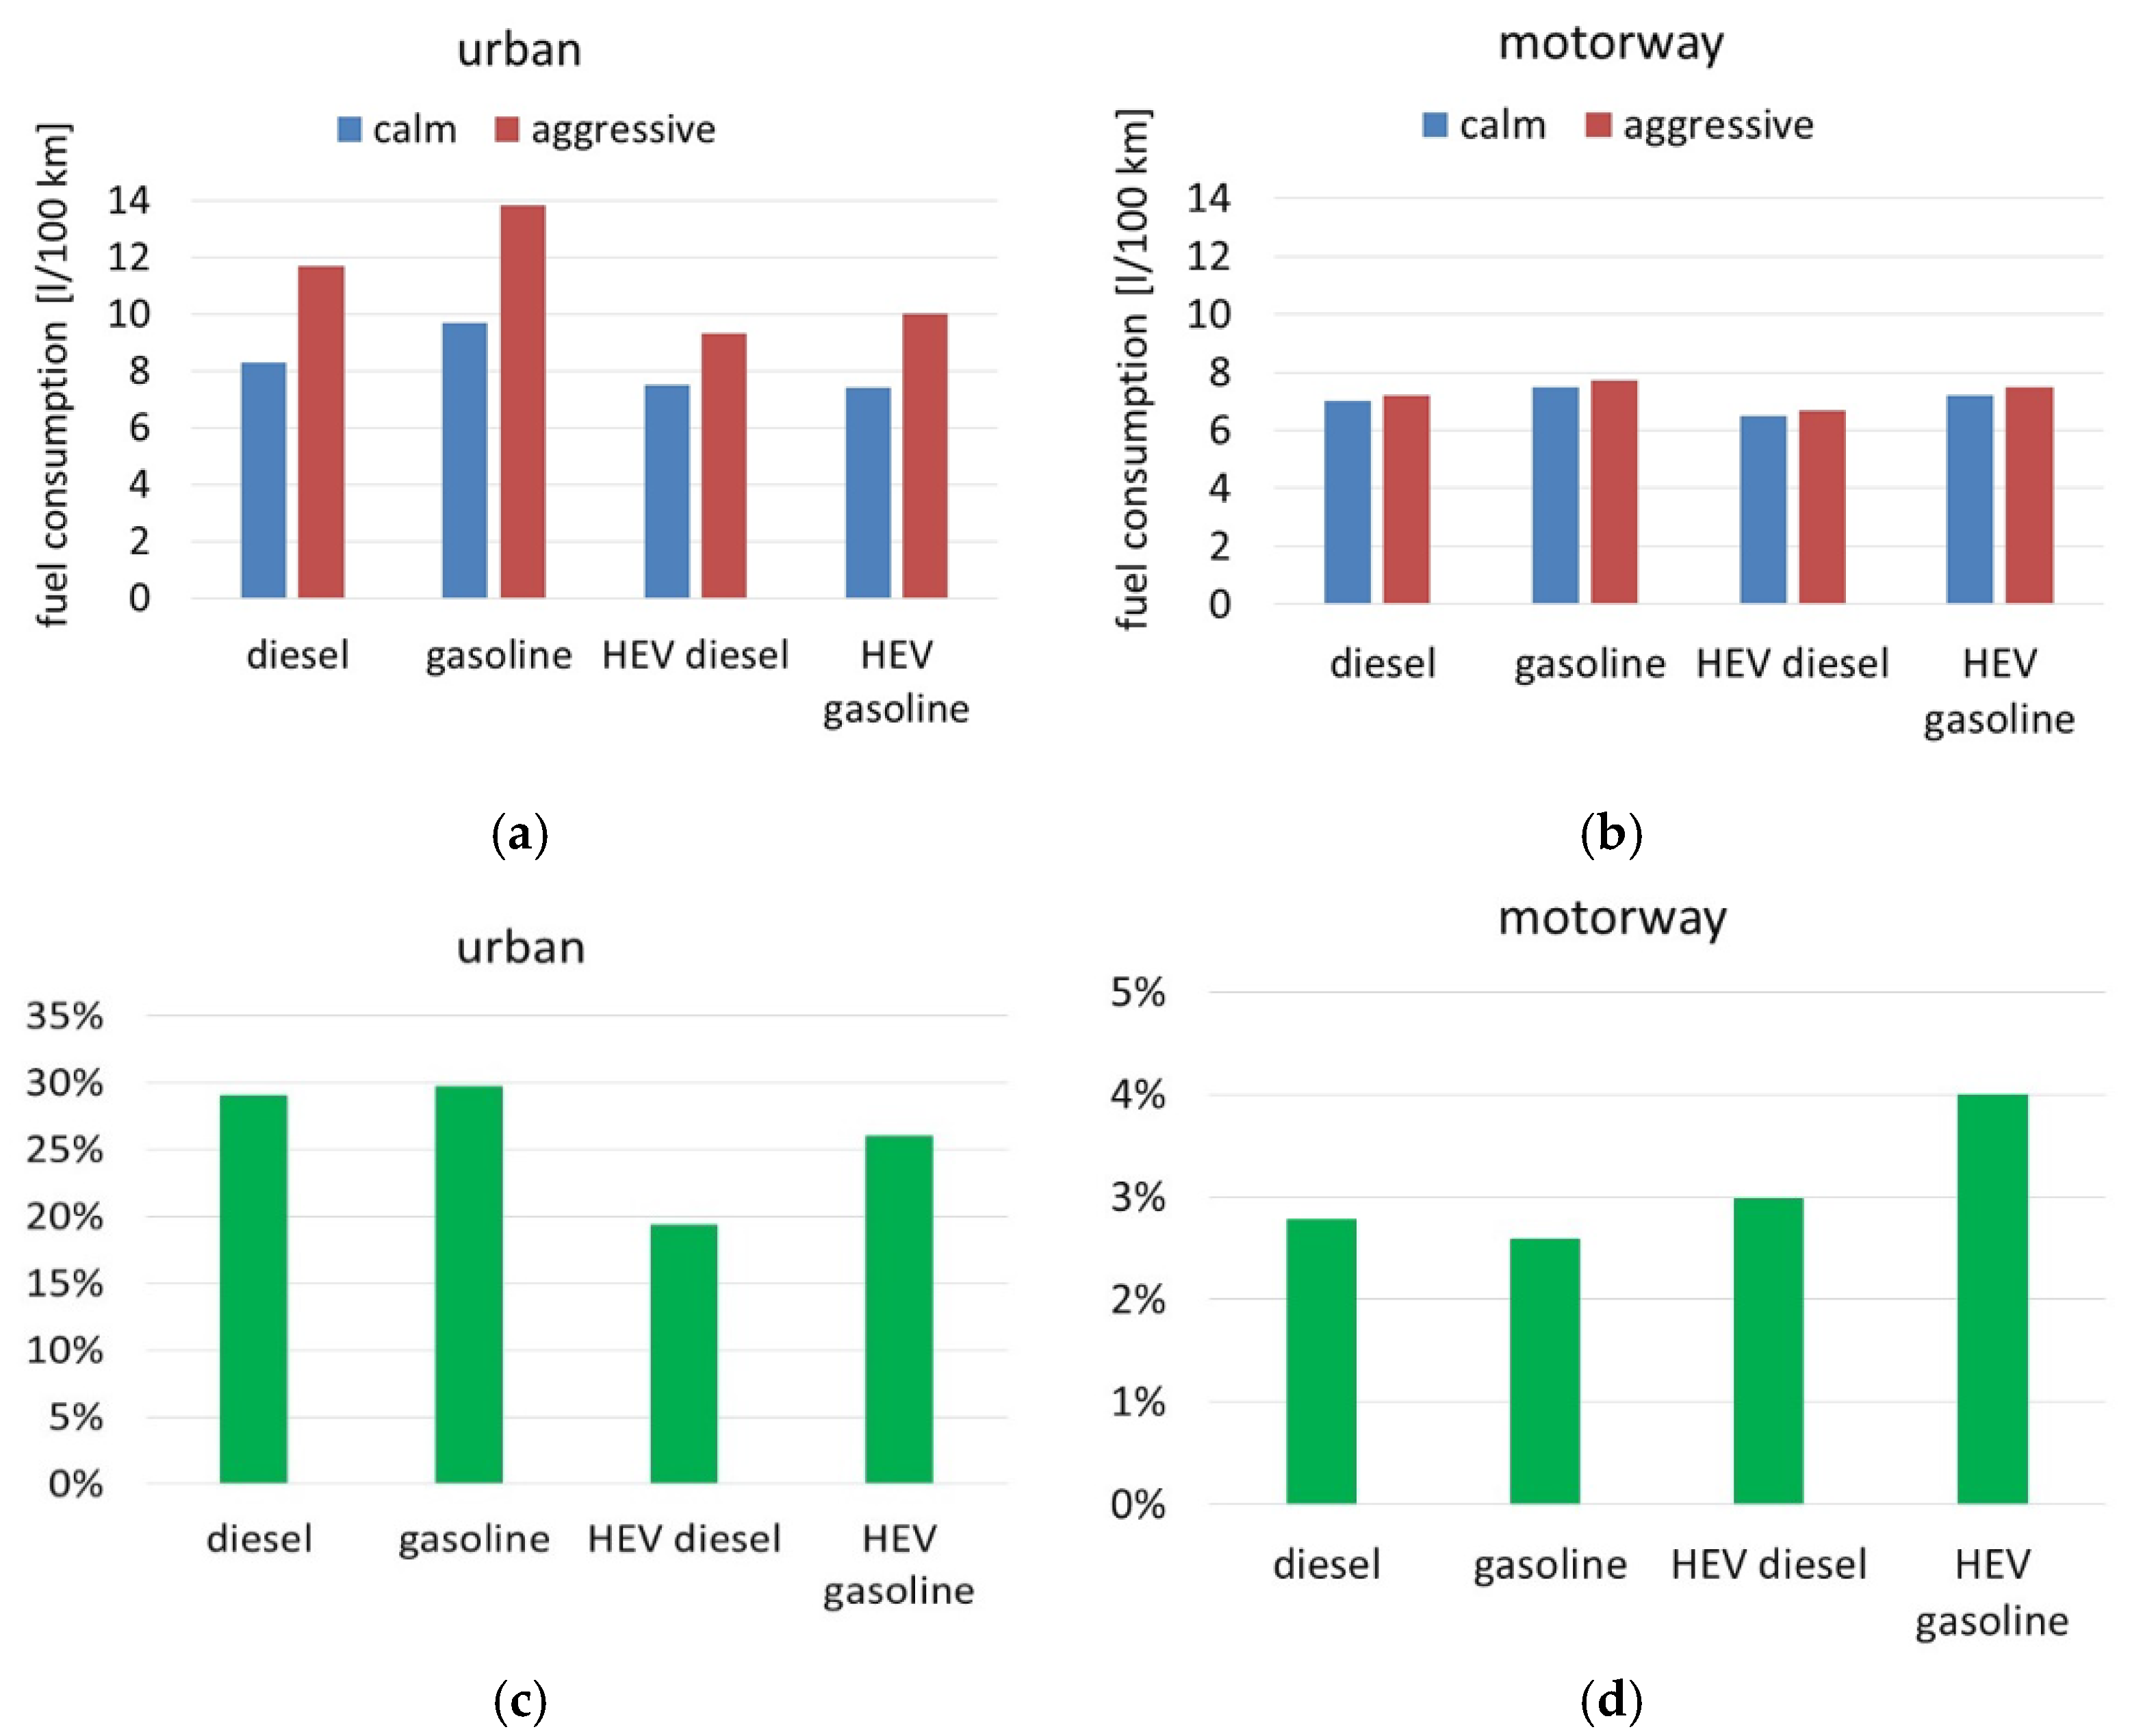
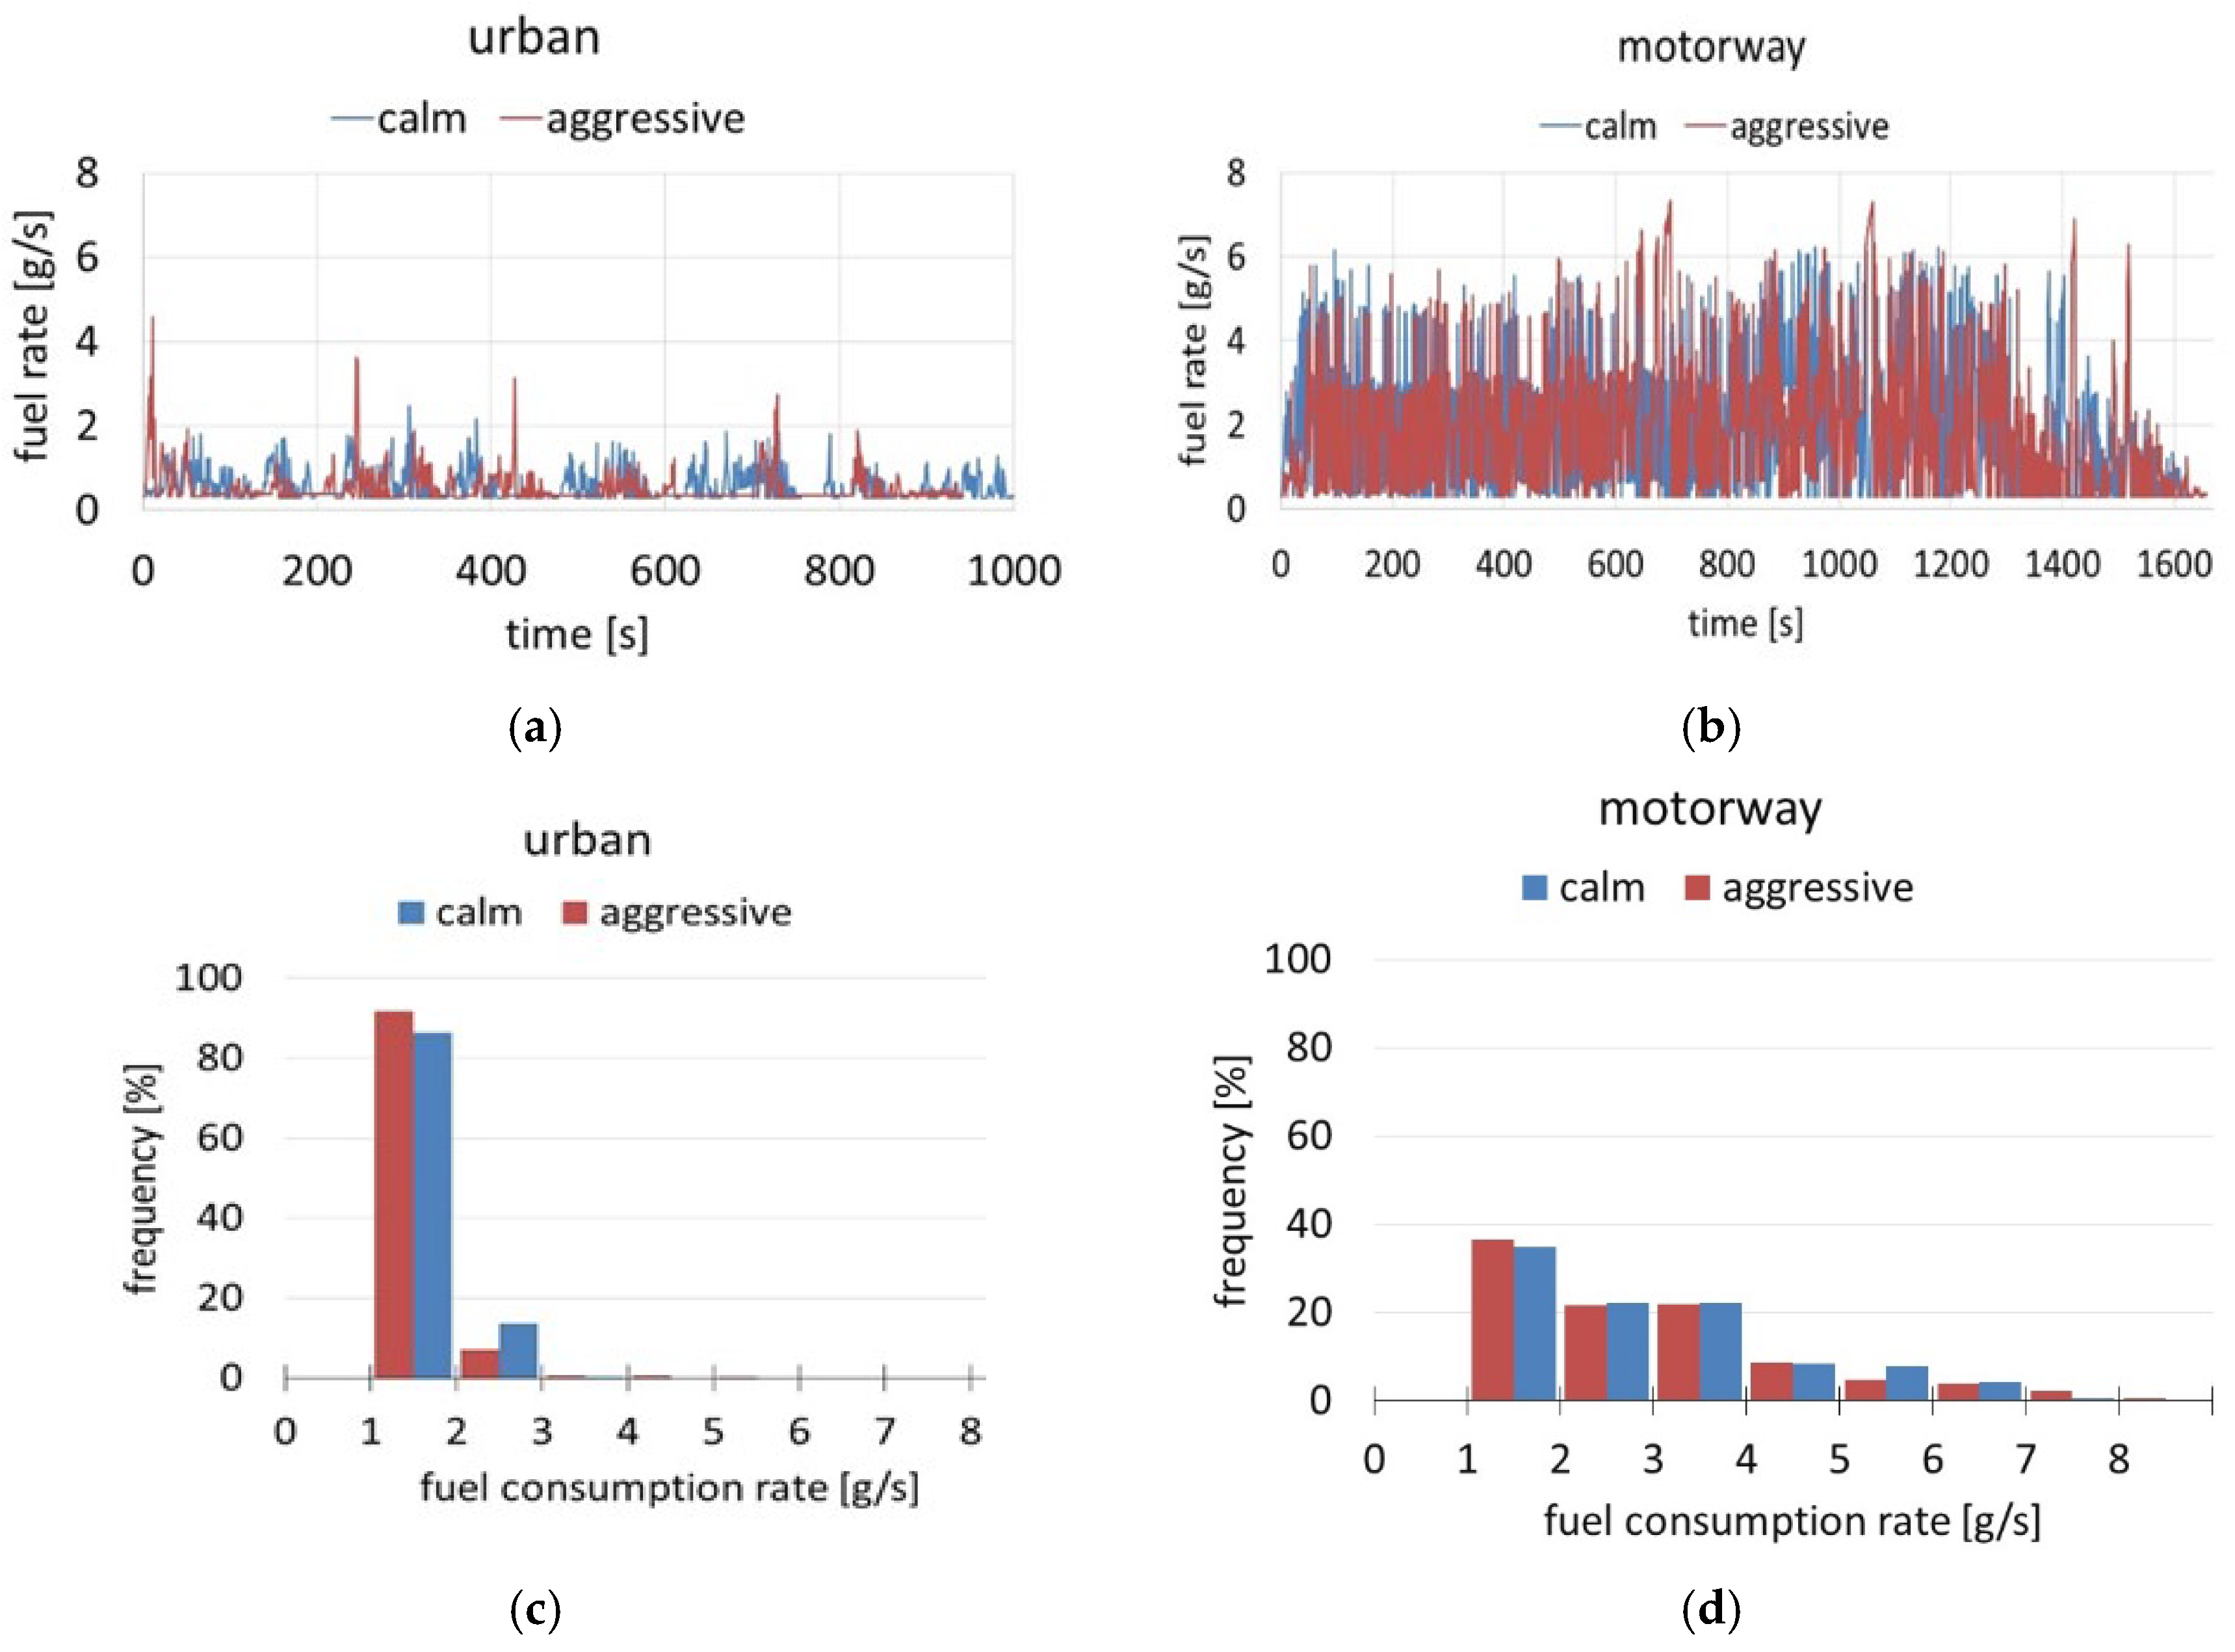
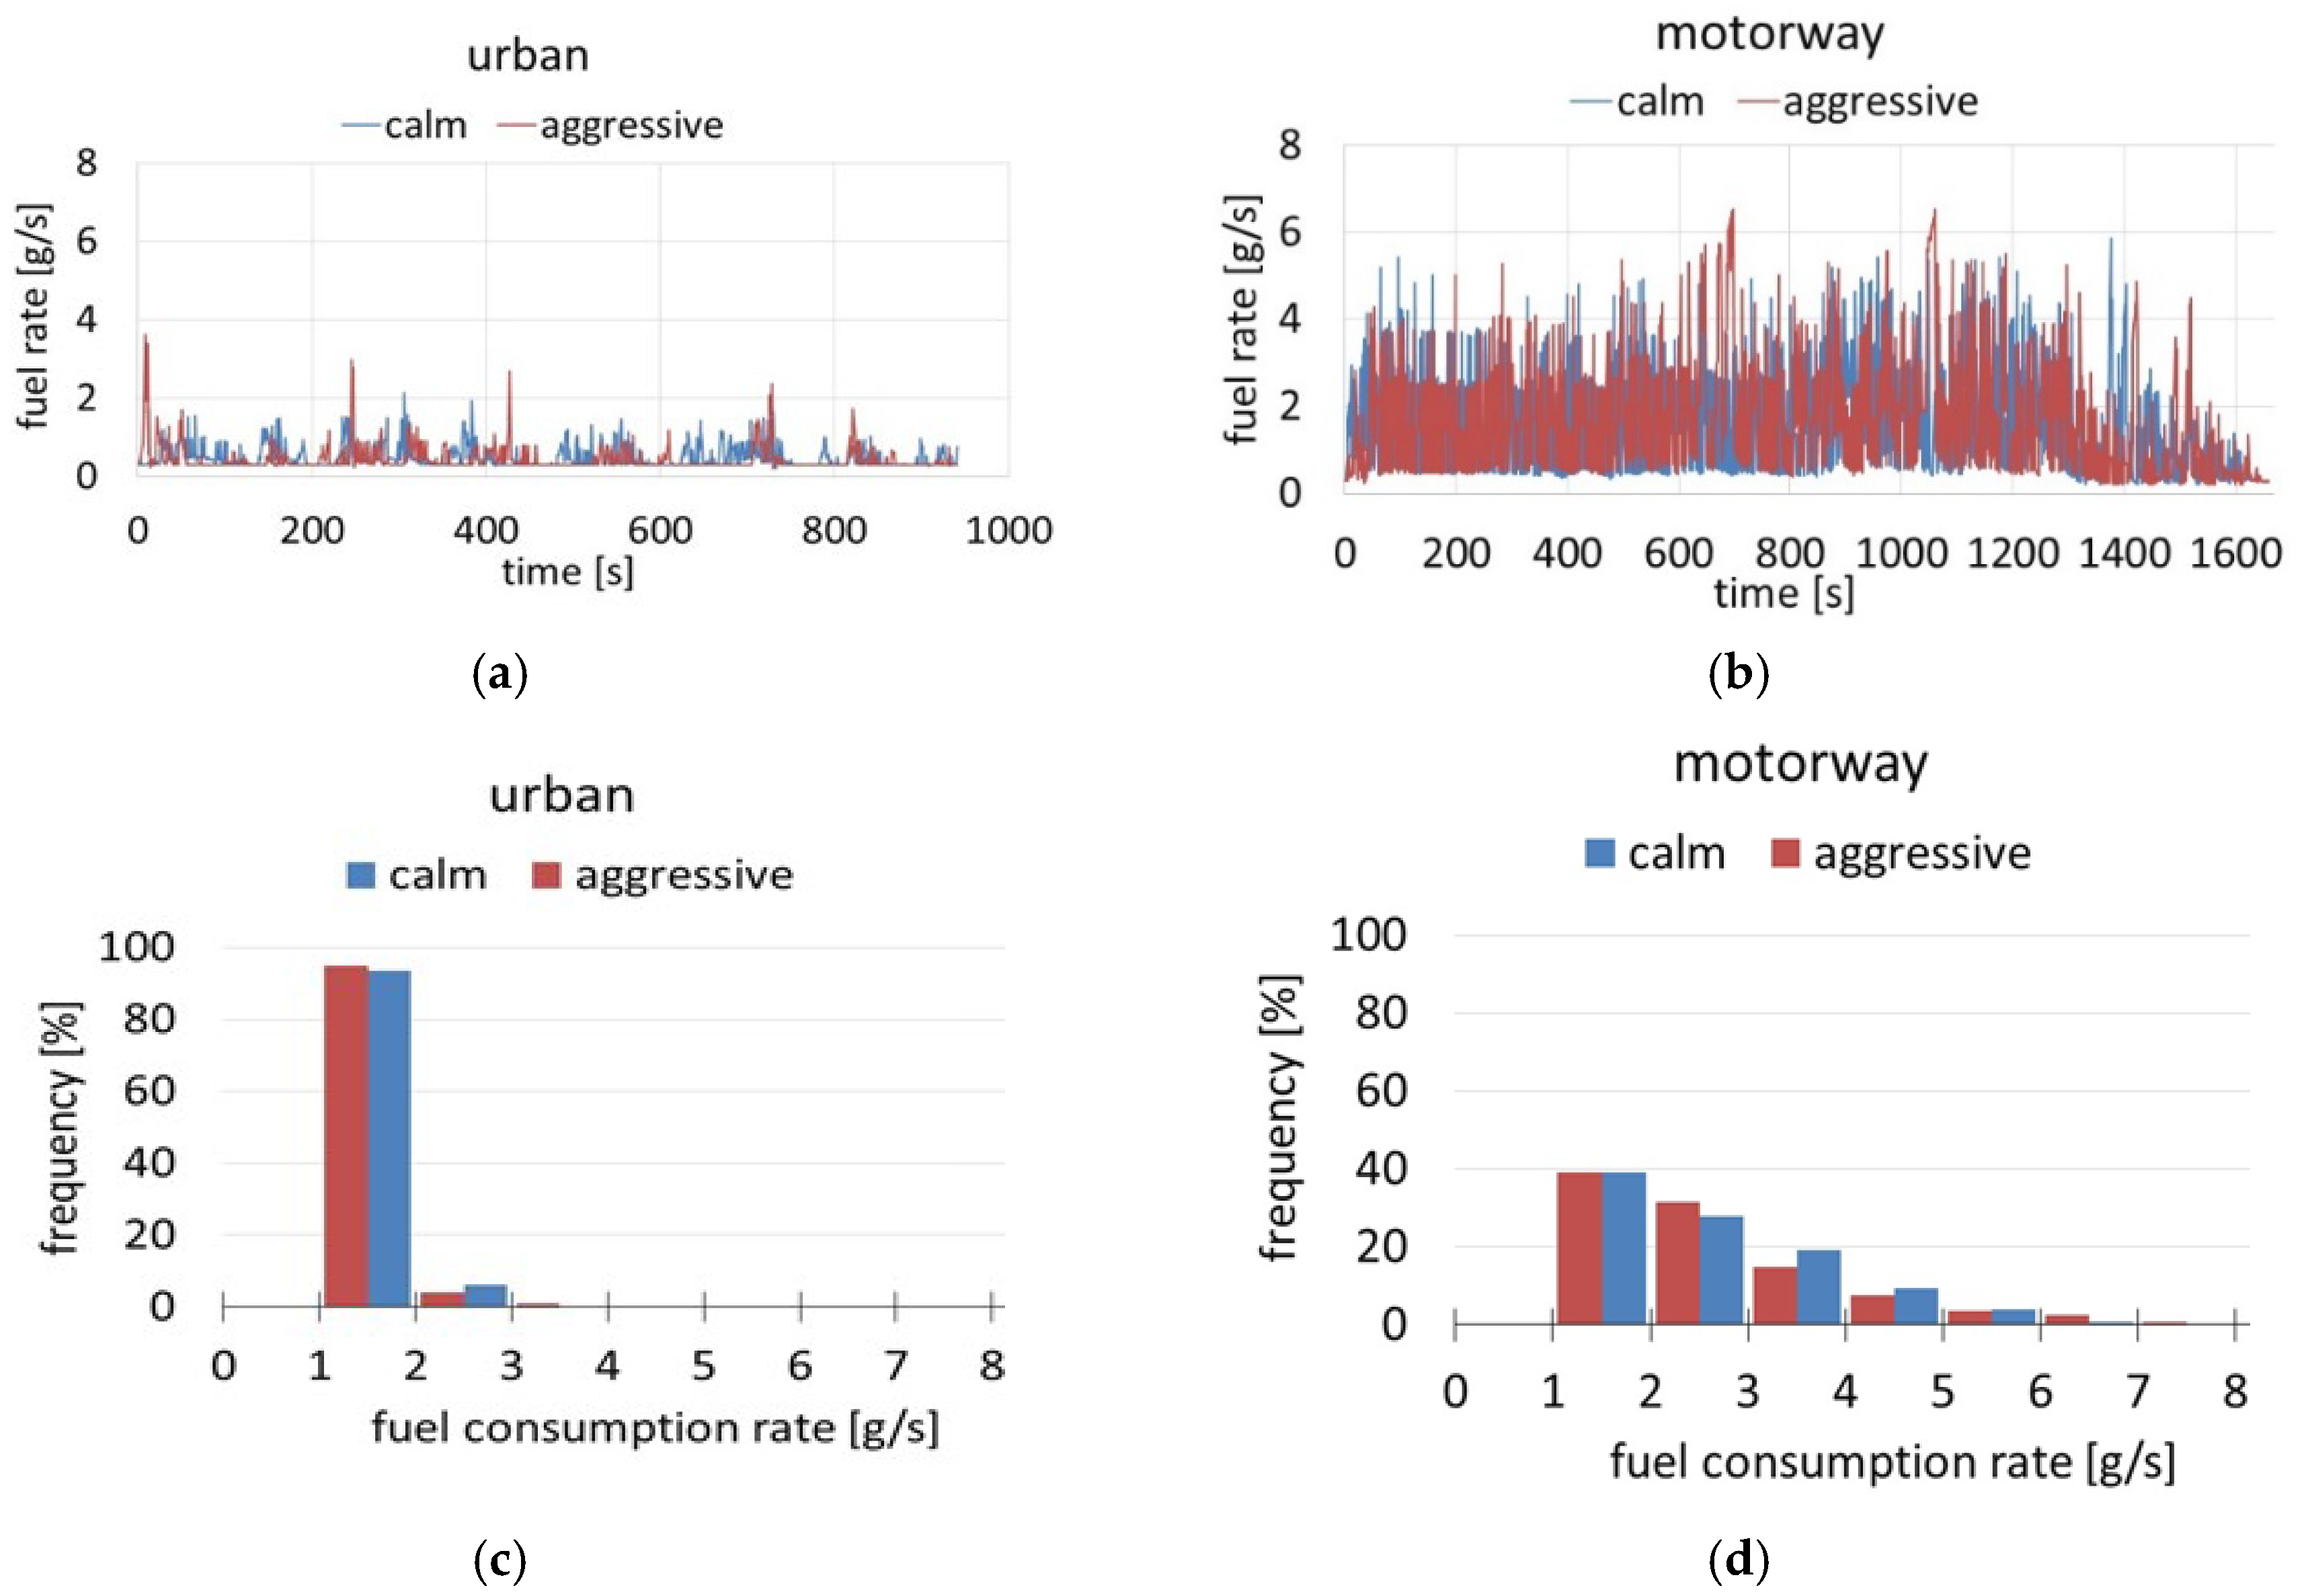
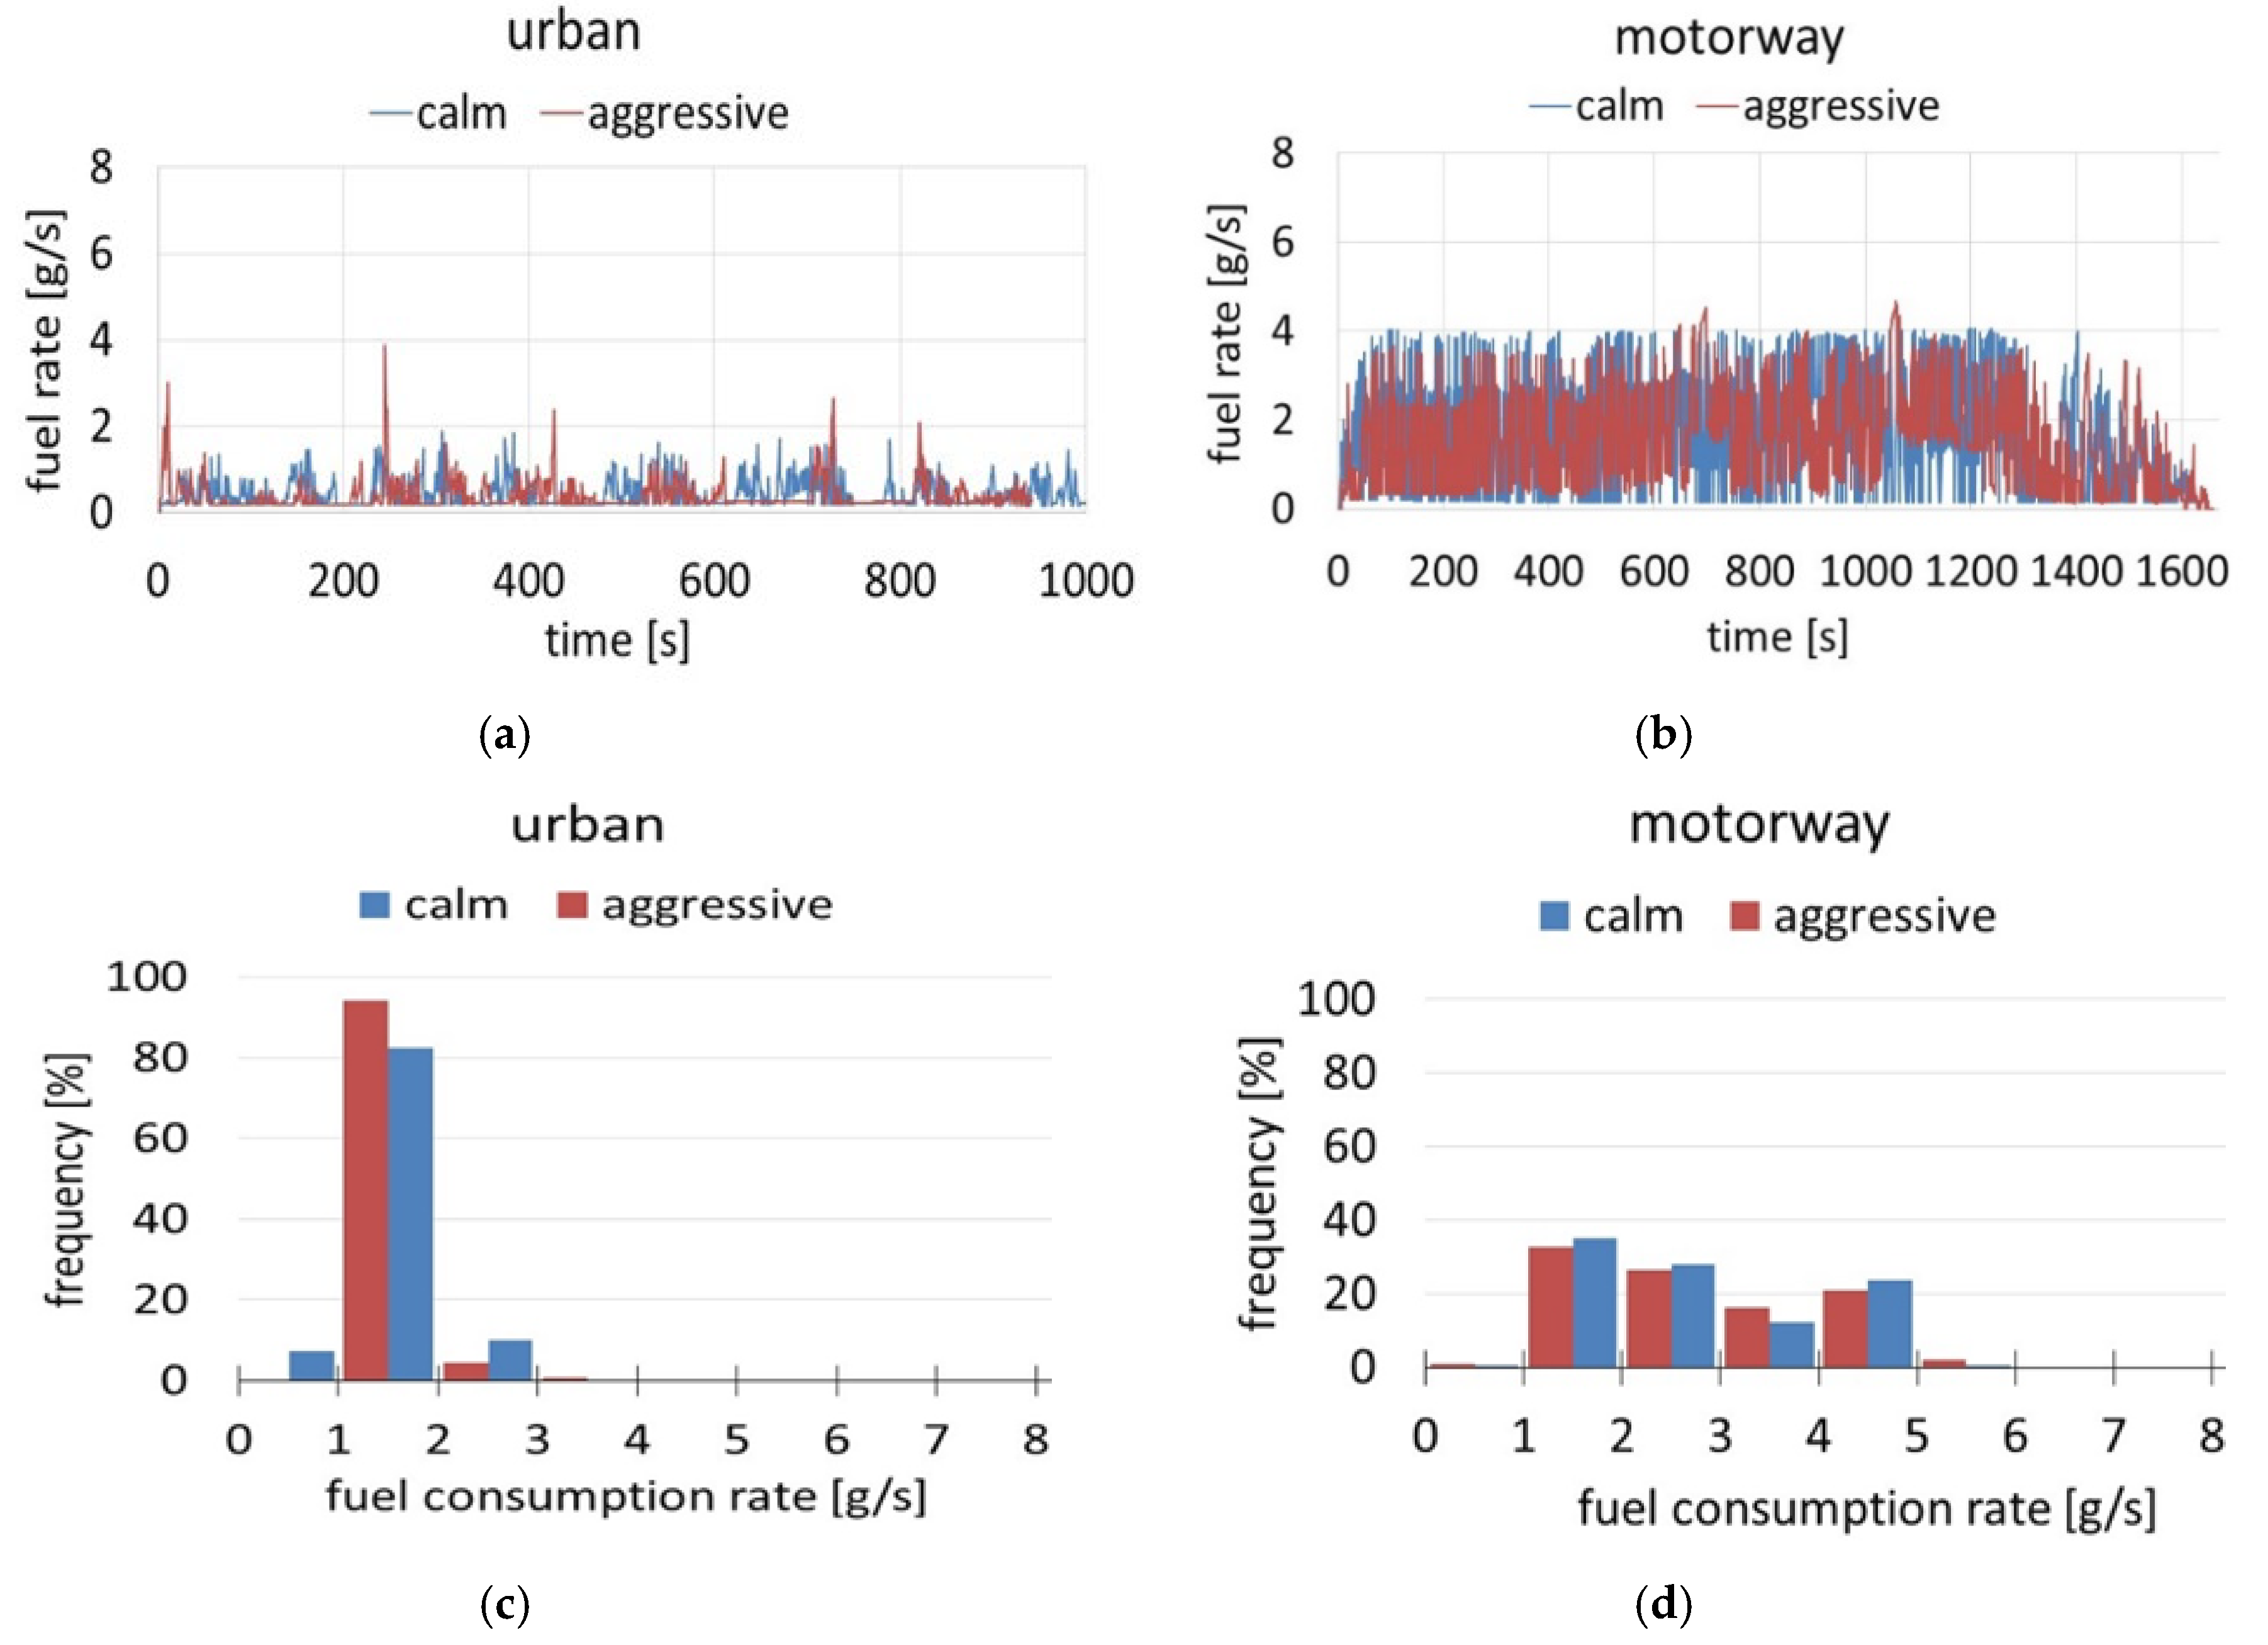
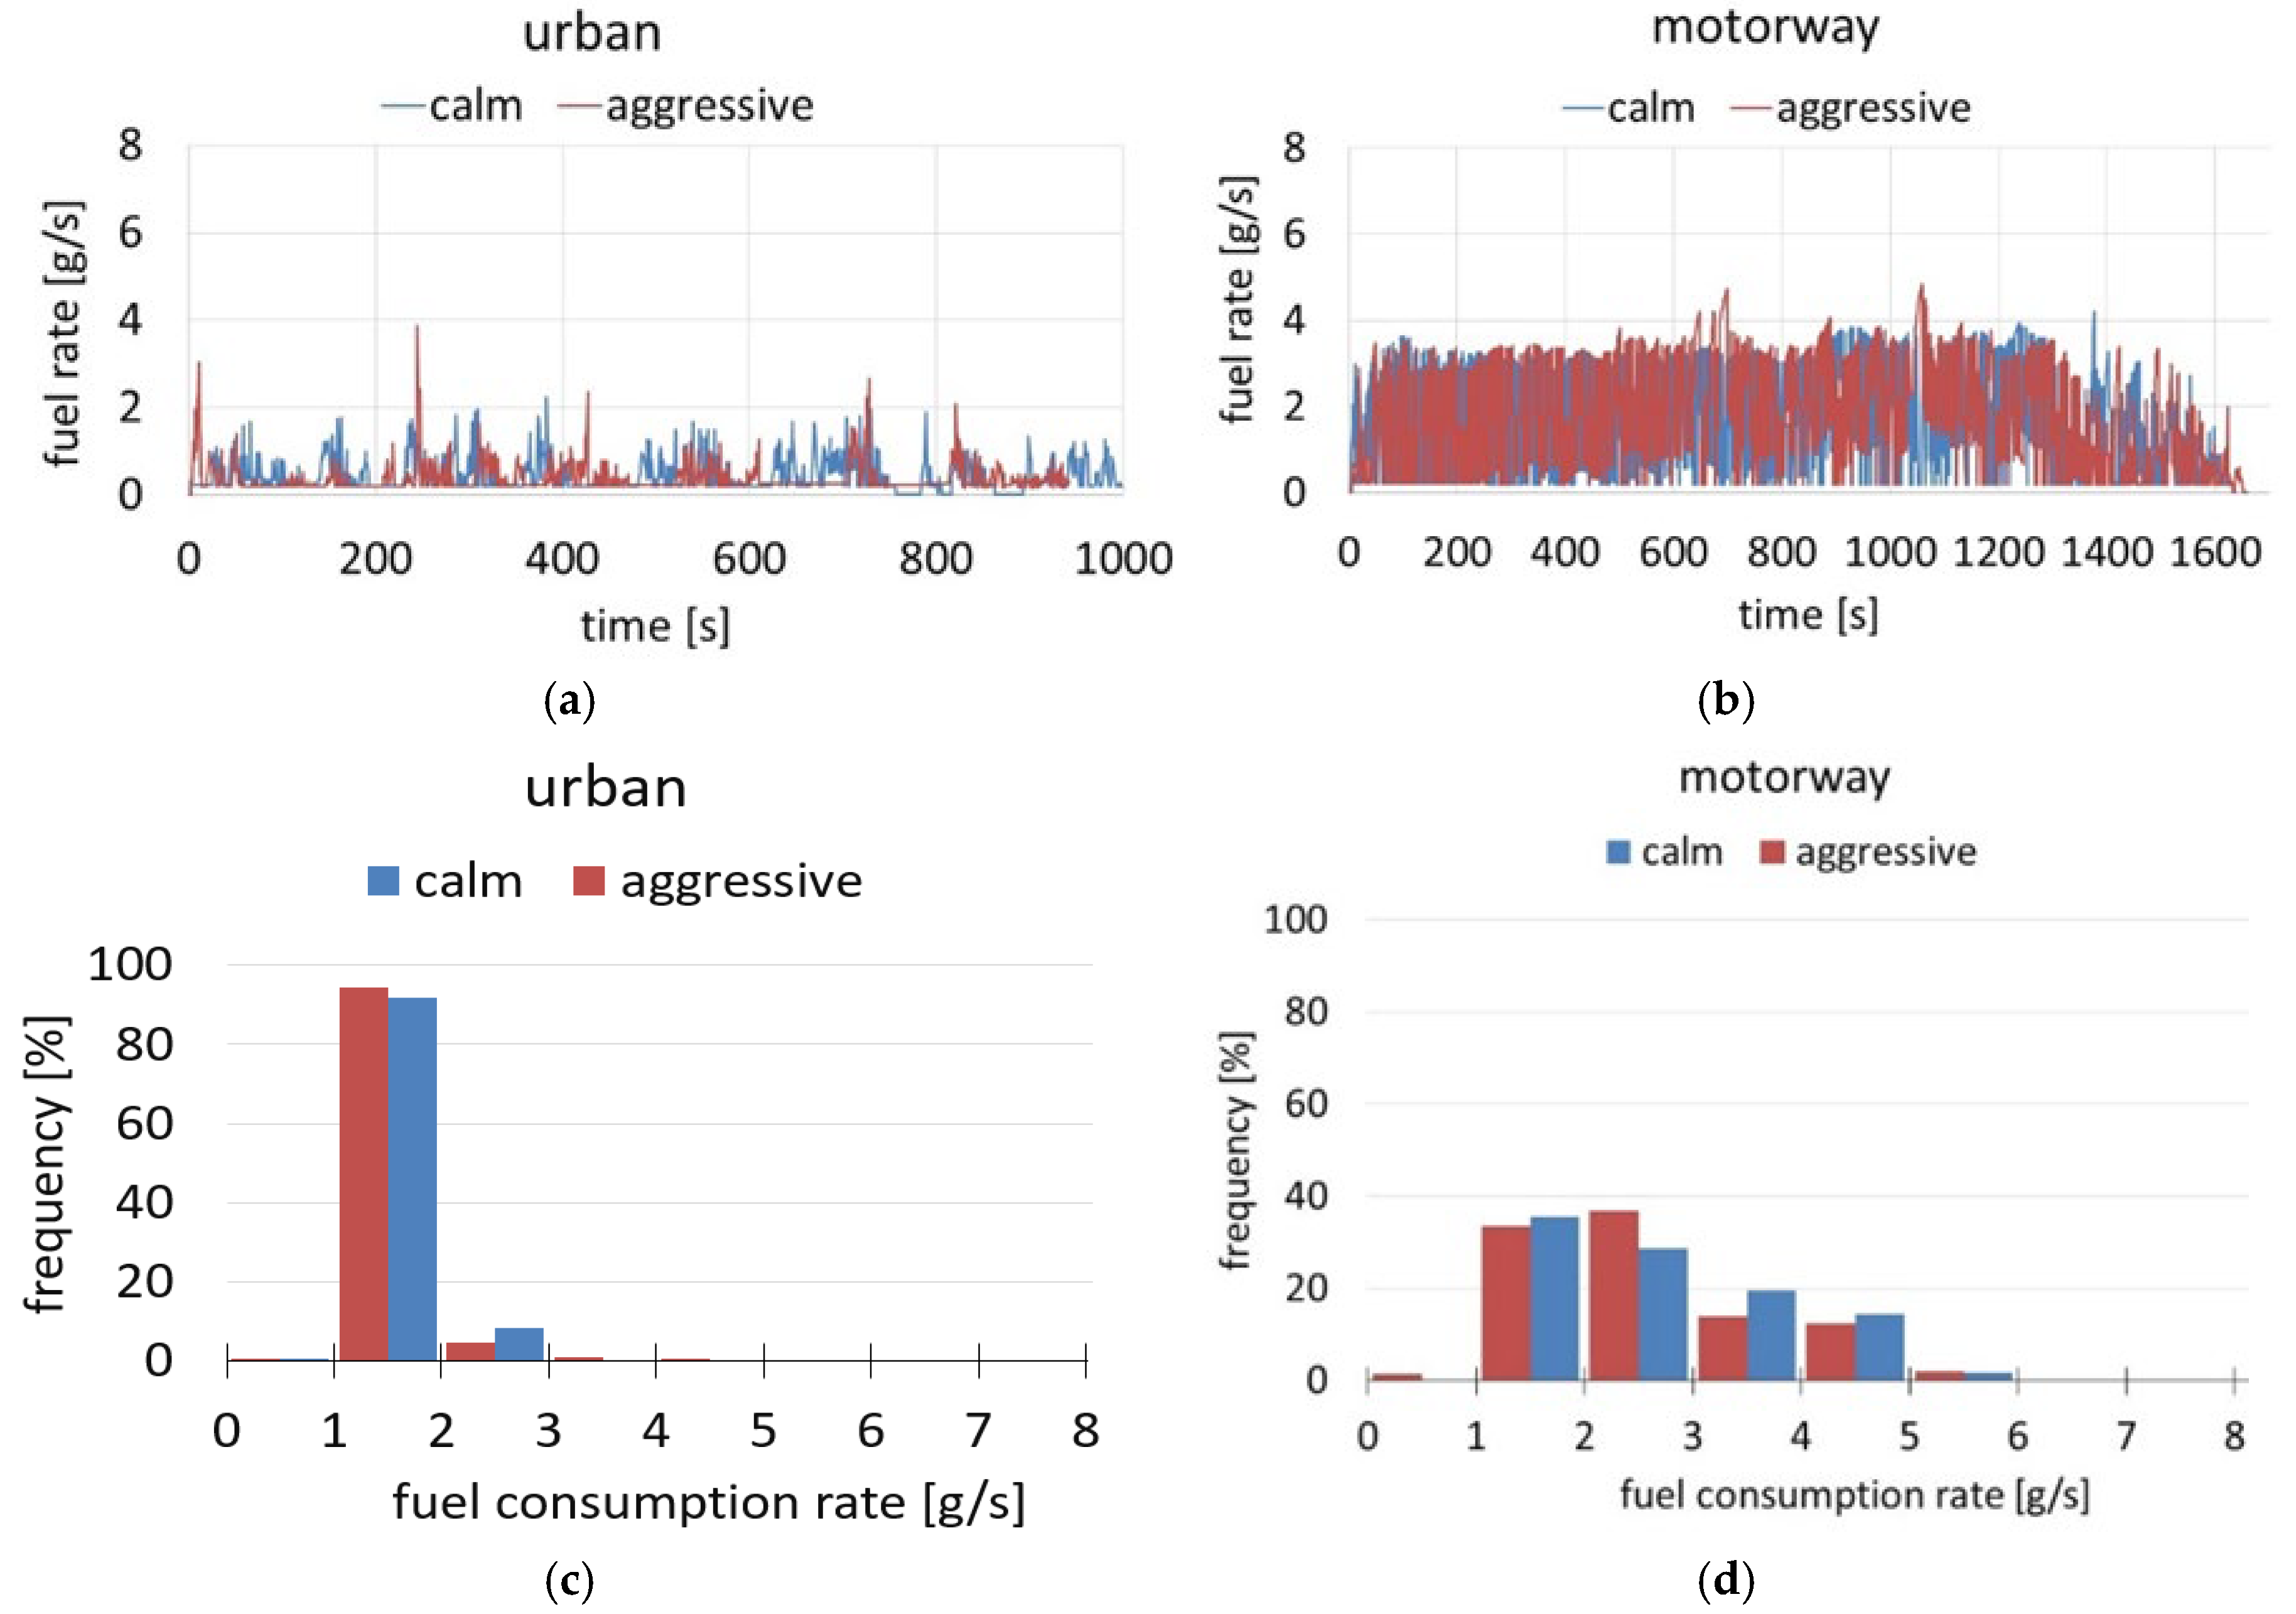
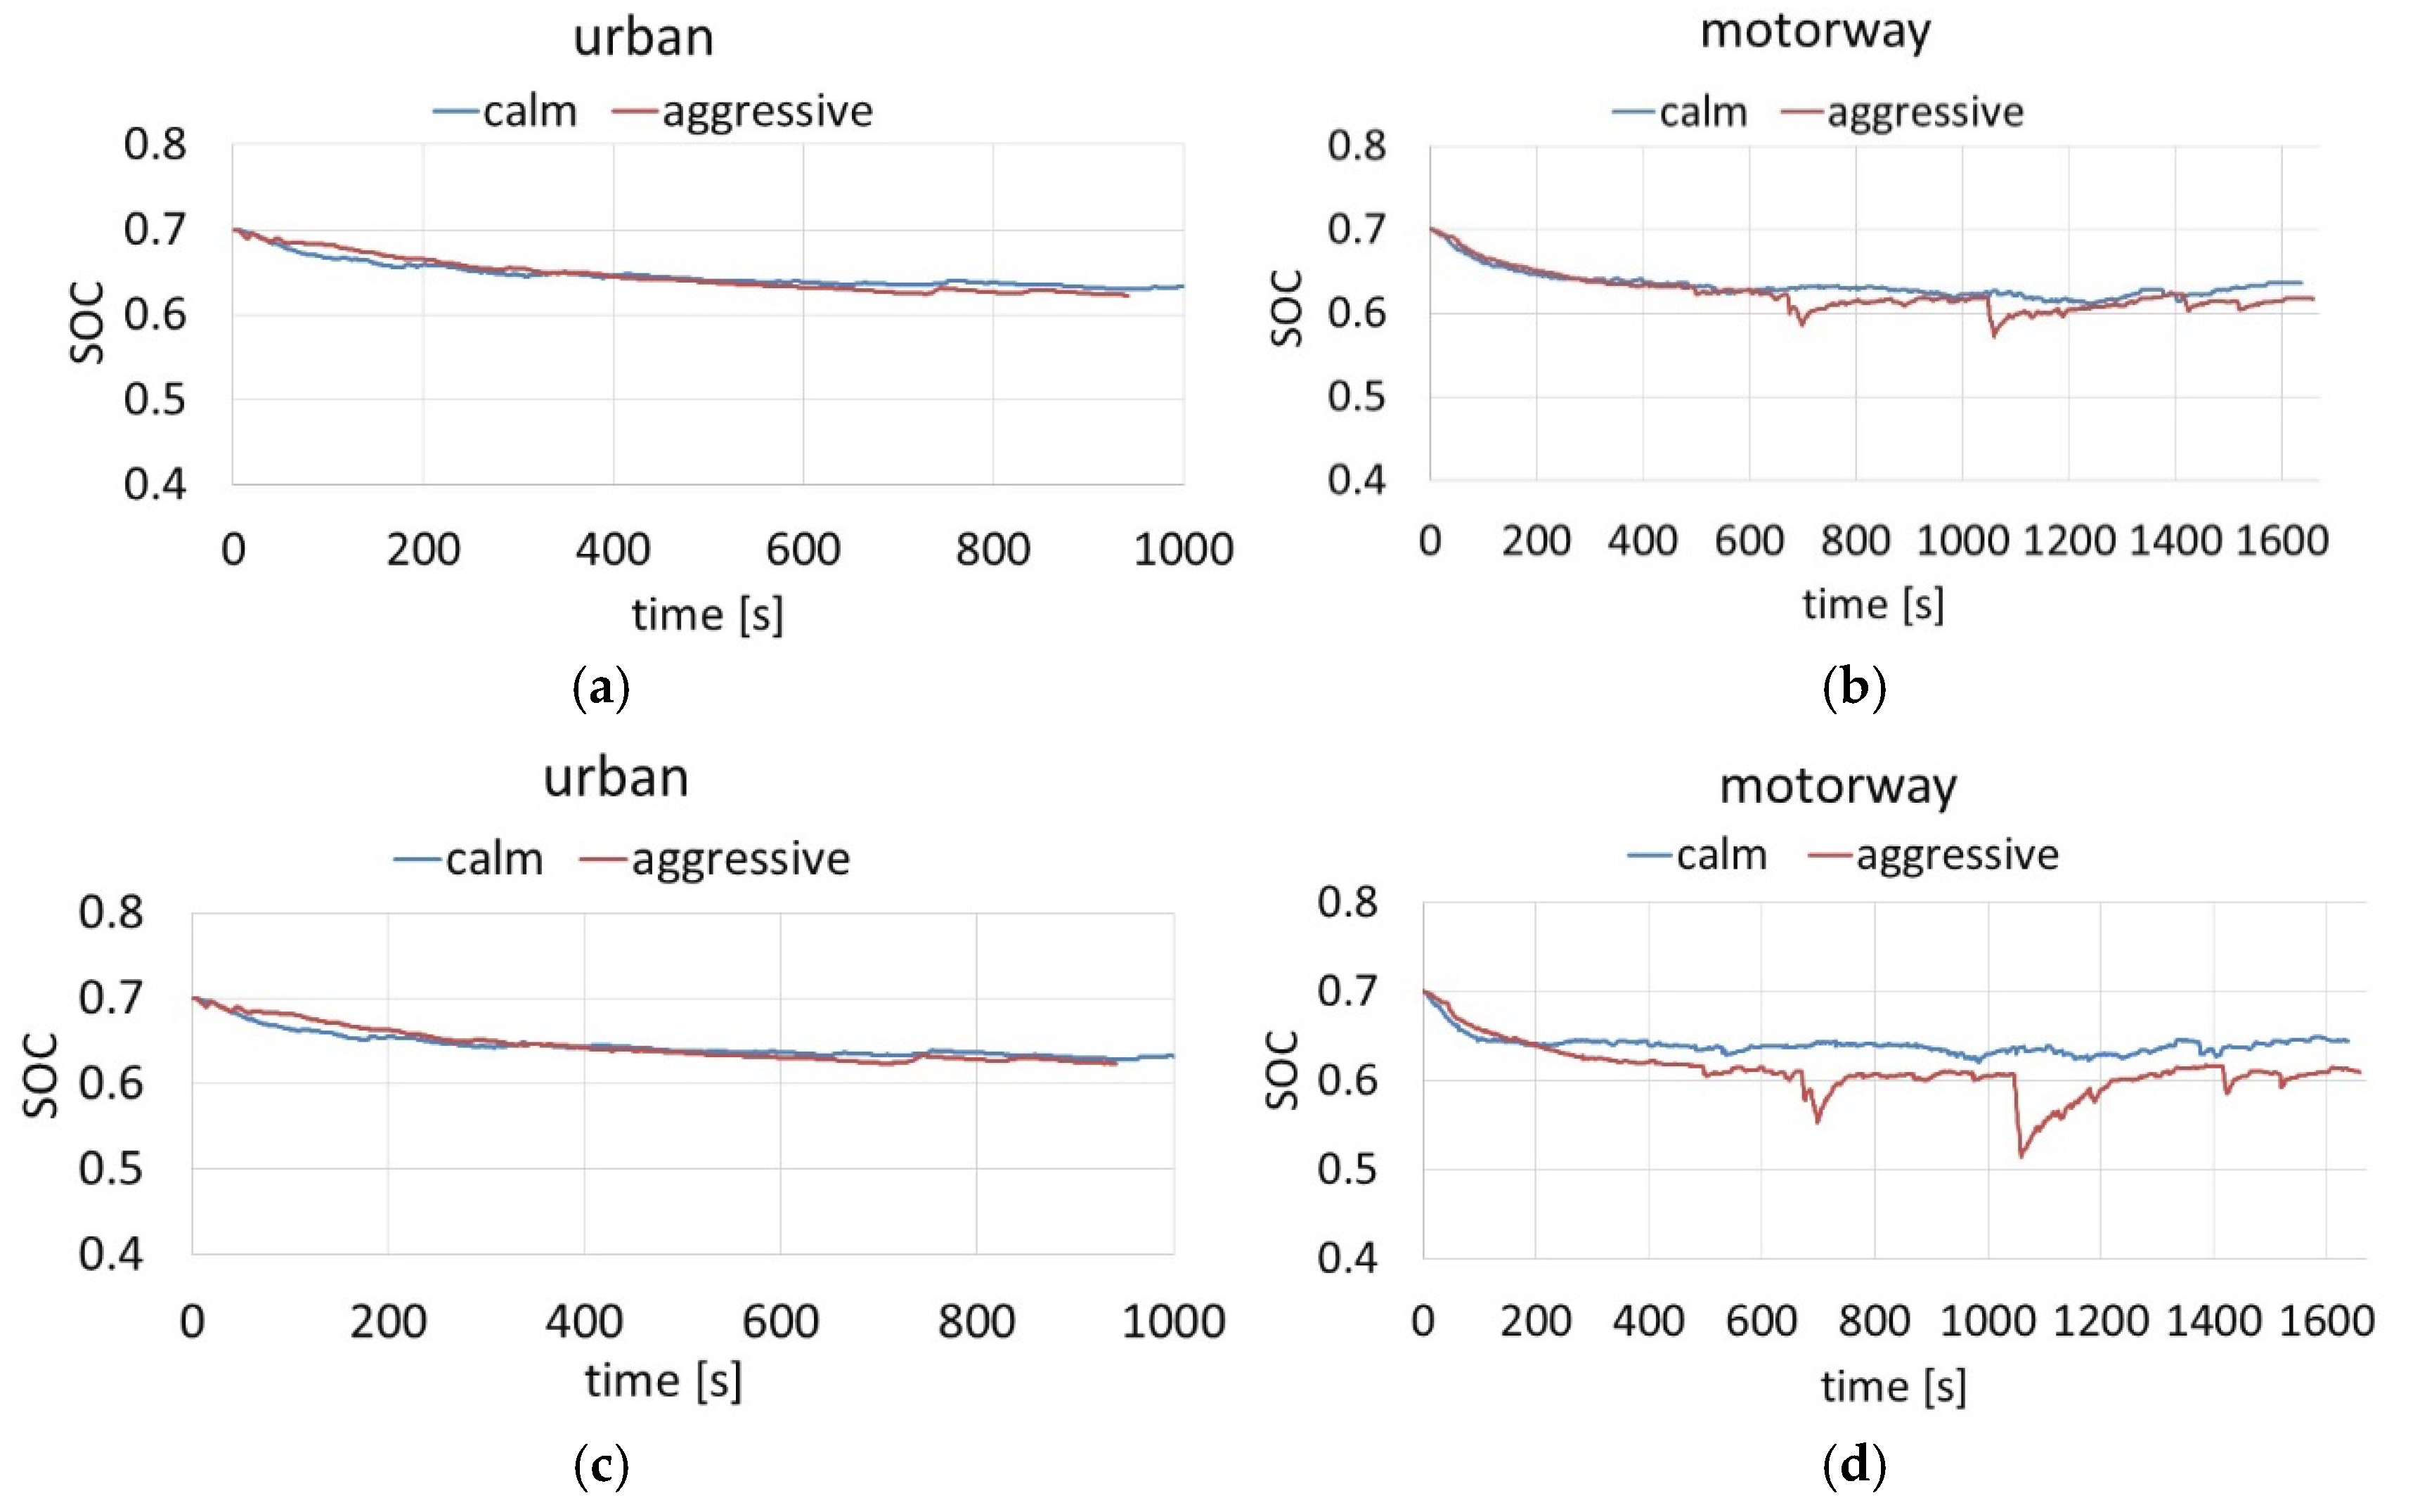
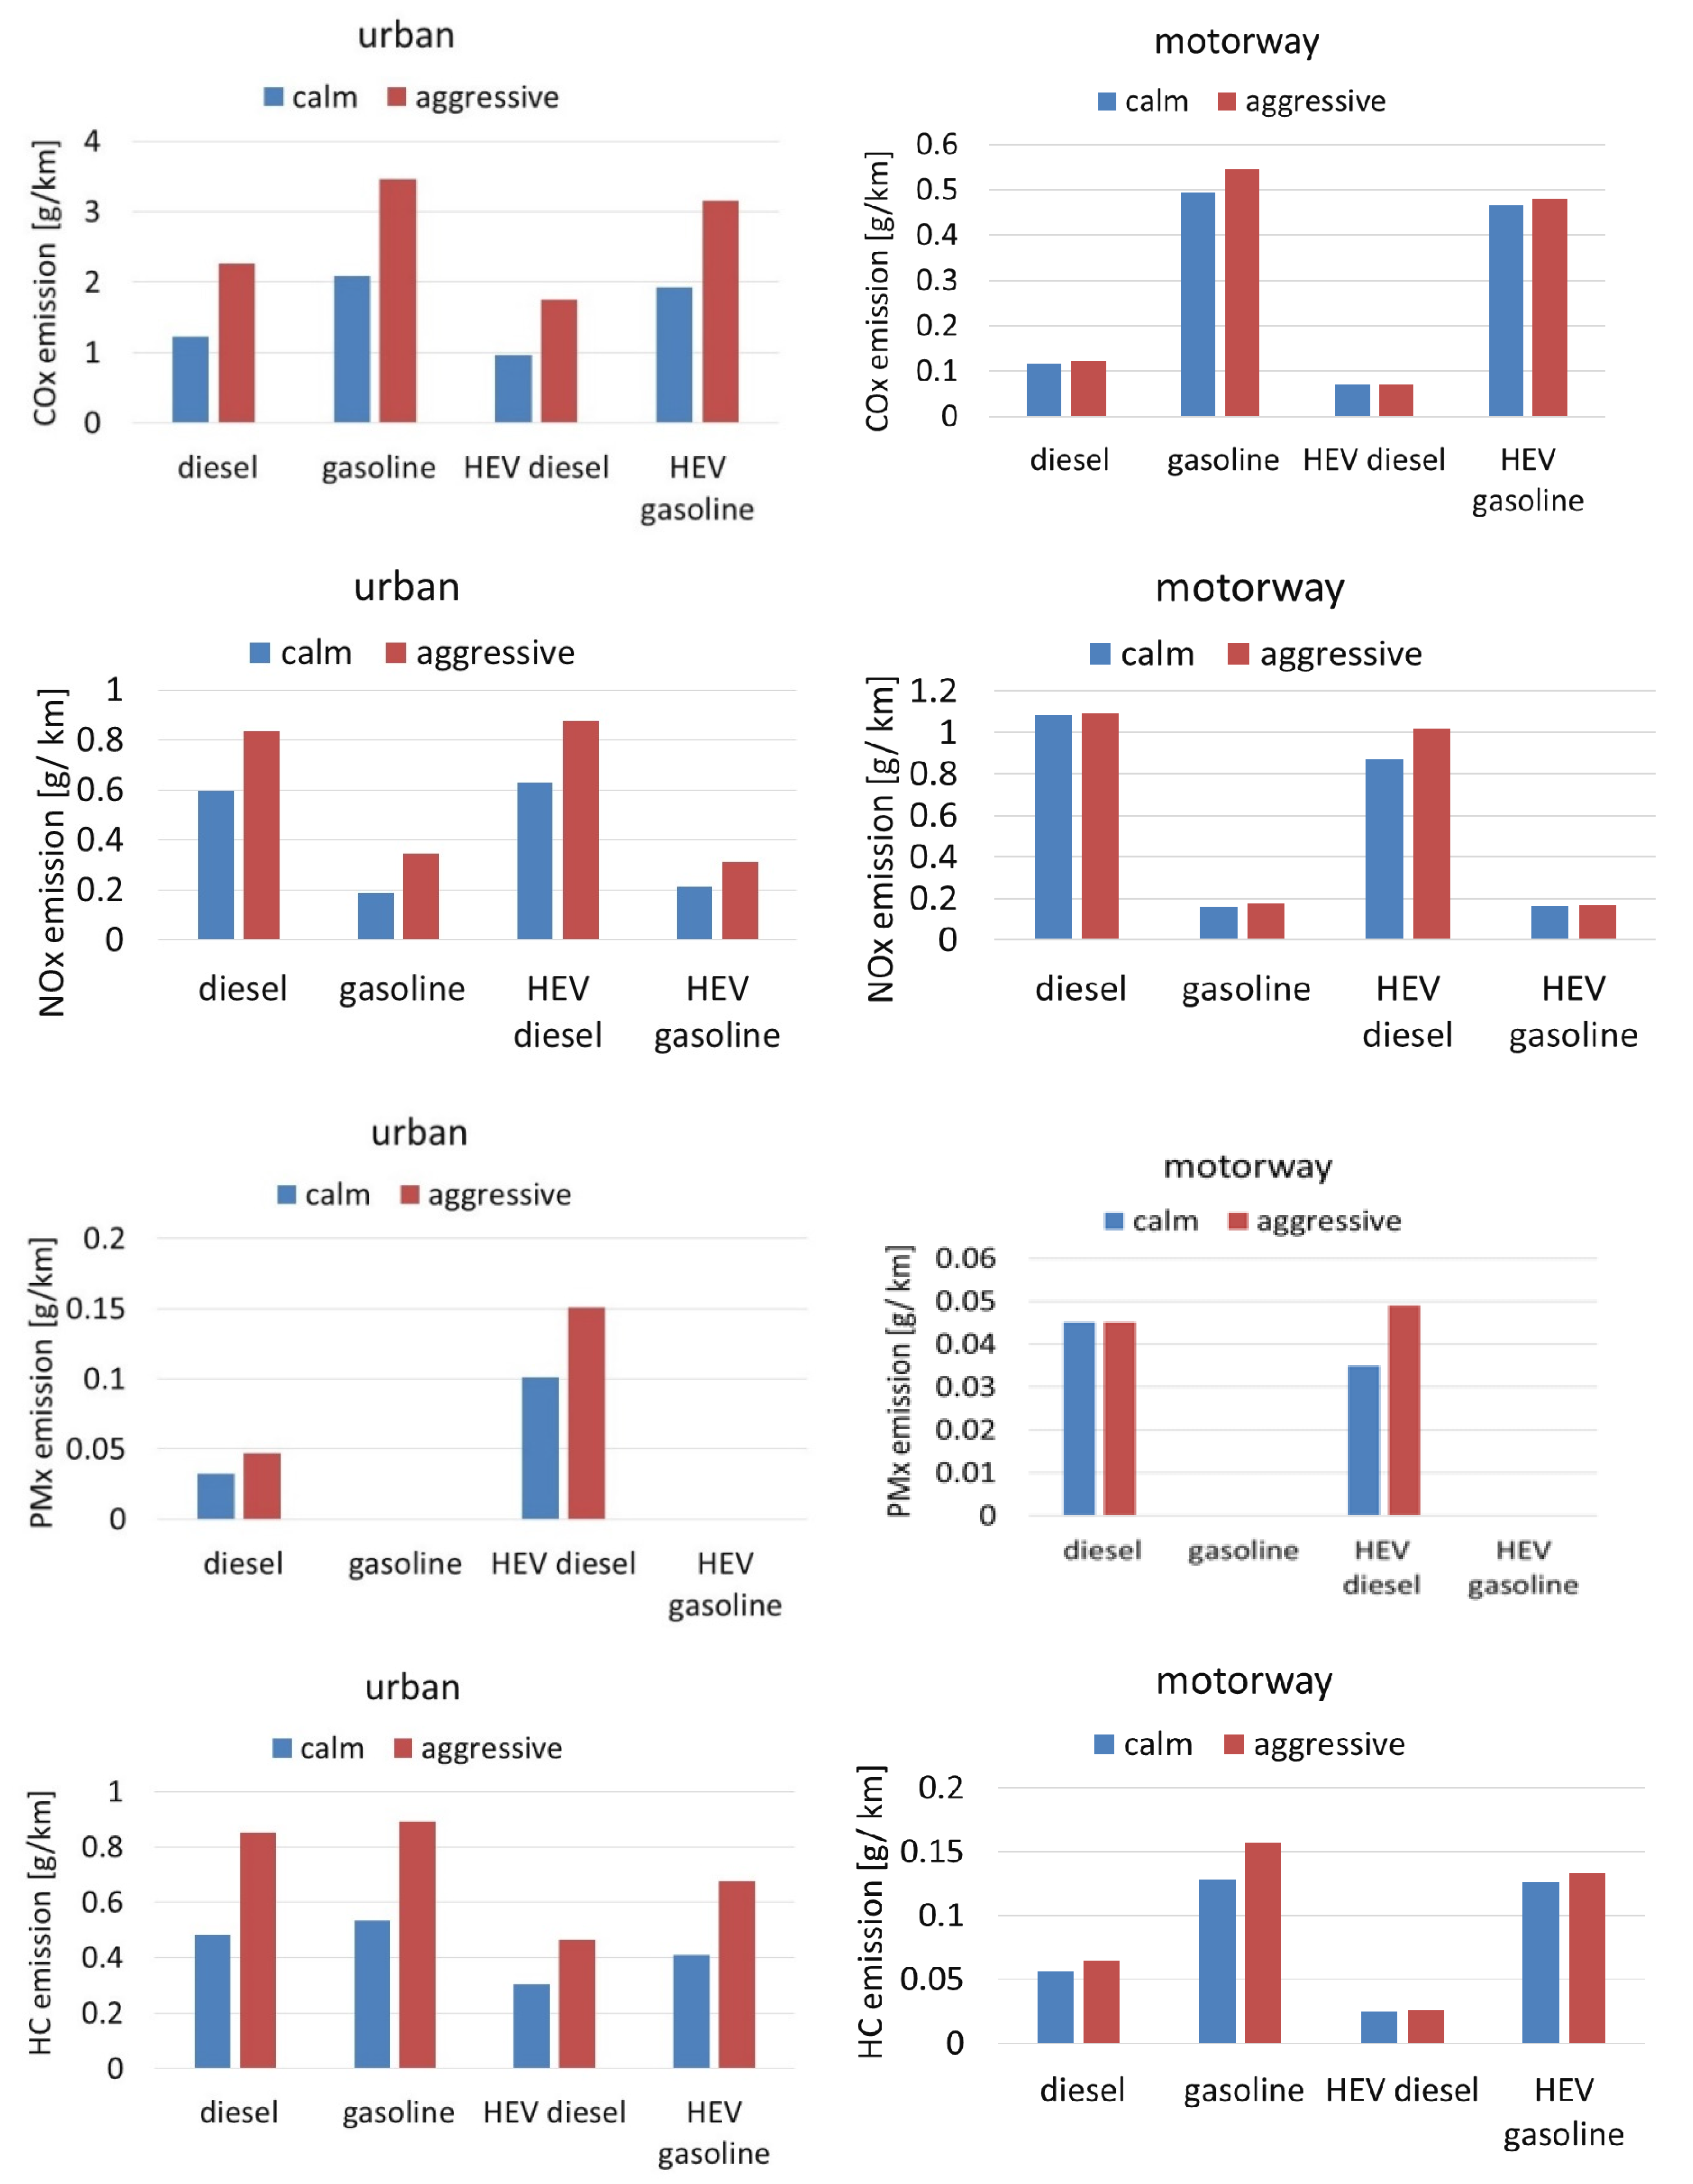
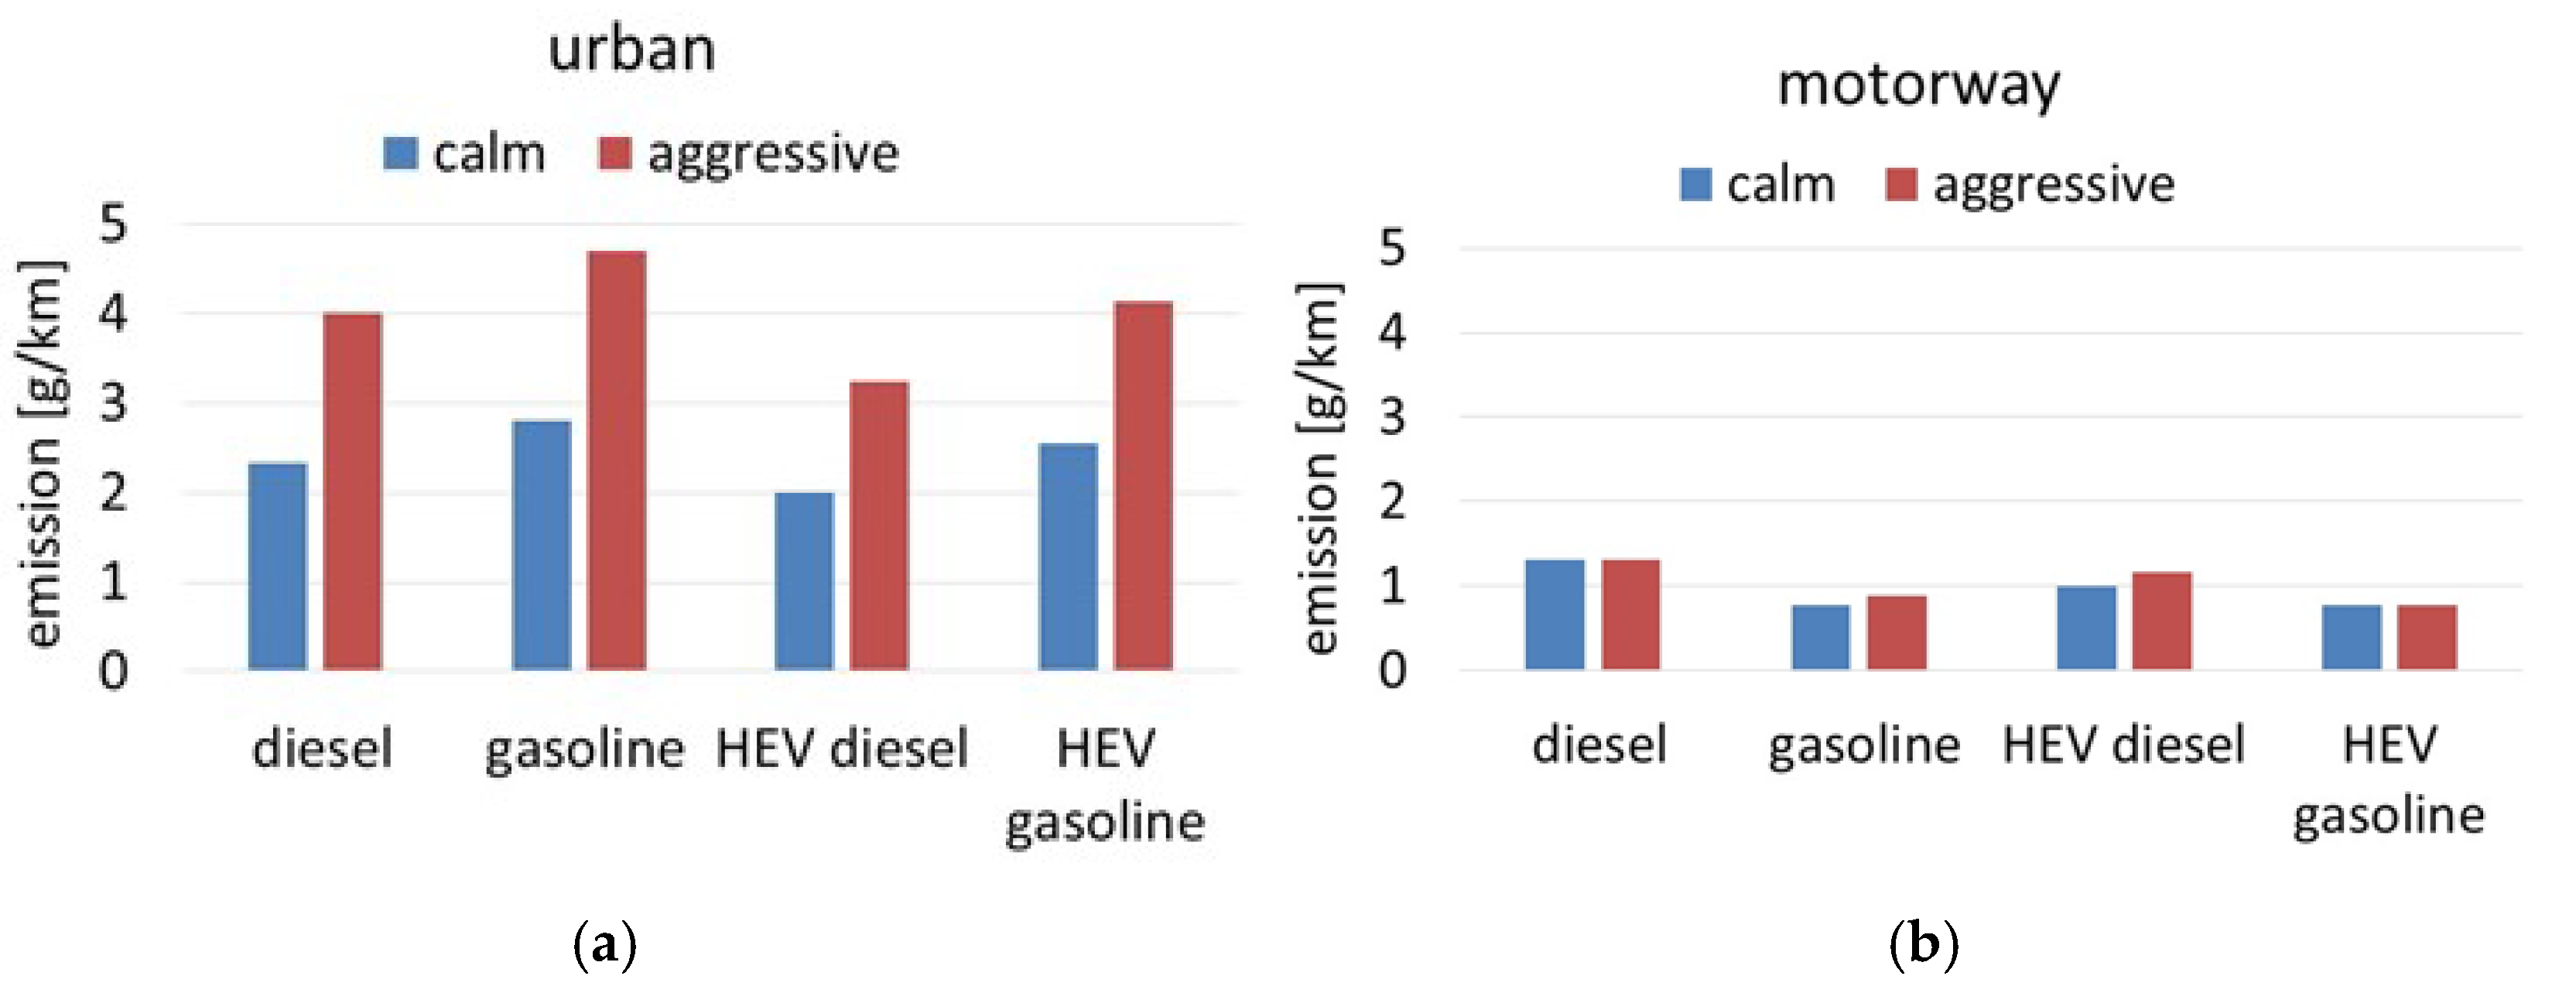
3. Simulation Results

The results of the experiment showed that driving style has a major effect on fuel economy. The simulation results showed that aggressive driving has an incremental impact on average fuel consumption in urban driving conditions. Figure 7 shows the effect of driving style on average fuel consumption and percentage differences for various route types.
In urban conditions, aggressive driving of both conventional and hybrid-drive vehicles demonstrated an average fuel consumption approximately 30% higher than for calm driving. In motorway driving conditions, calm driving resulted in a 3% reduction in fuel consumption.
The hybrid vehicle containing a gasoline engine experienced higher fuel consumption during aggressive driving compared to calm driving. Consumption was 26% higher in urban testing and 4% higher in motorway testing. The hybrid vehicle equipped with a diesel engine also showed higher fuel consumption during aggressive driving, with 19% higher average fuel consumption in urban testing and 3% higher average fuel consumption in motorway testing.
The hybrid vehicles showed an average fuel consumption in the urban tests of 10–28% less than diesel- and gasoline-powered vehicles. However, in the motorway tests, these differences were smaller, amounting to 3–7%. Figure 8 and Figure 9 show the instantaneous fuel consumption and its percentage distribution for conventional-drive vehicles during the tests.
In the instantaneous fuel-consumption profiles presented in Figure 6, fuel-consumption profiles differ for aggressive and calm driving styles. Rapid accelerations during aggressive driving caused a visible rise in fuel consumption. The rise in fuel consumption is particularly evident in the instantaneous fuel-consumption profiles of aggressive driving during urban testing. In some instances, the fuel-consumption rate showed peaks in excess of 4 g/s. Motorway tests resulted in a wider range of instantaneous fuel consumption compared to tests in the urban area, in an estimated range of 0.2–7.33 g/s for conventional vehicles and 0–4.86 g/s for hybrids. This is due to the high-speed operation of the engine. Figure 10 and Figure 11 show the instantaneous fuel consumption and its percentage distribution for hybrid-drive vehicles during the tests.
Hybrid-drive vehicles provide an option to switch off their combustion engine when it is not needed. This ability may reduce fuel consumption and pollutant emissions. However, during routes requiring higher energy demand, the internal combustion engine works to meet the traction requirements and directs part of the energy supply to recharge the batteries. Figure 12 presents the battery state of charge (SOC) of the hybrid-drive vehicles for both test cycles.
State of charge is the level of charge of an electrochemical battery in relation to its capacity. The units of SOC are expressed in percentage points: 0% = empty; 100% = fully charged. In the present study, the initial battery state of charge was 70%. Rapid acceleration during aggressive driving imposed a relatively high energy demand. As shown in Figure 12, the battery energy level decreased significantly in sudden acceleration movements.
The hybrid powered by the gasoline engine showed a minor change in SOC during the urban test cycles (1%). Larger temporary drops in the battery SOC were recorded during the motorway driving cycles (up to as much as 13%). The SOCs of HEV gasoline and HEV diesel batteries were almost identical during calm driving, whereas during aggressive driving, the energy level of the HEV diesel battery dropped by as much as 19%. Neither the gasoline nor the diesel hybrid showed rapid decreases in battery energy level during calm driving. However, more aggressive driving produced sudden temporary drops, related mainly to rapid acceleration.
Figure 13 shows the effect of driving style on average emissions of carbon oxides (COx), nitrogen oxides (NOx), particulate matter (PMx), and hydrocarbons (HC) for various route types. The results presented in Figure 13 show that aggressive driving in urban conditions causes a notable increase in the emission of pollutants.
In urban conditions, aggressive driving contributed significantly to an increase in emissions. Compared to calm driving, during aggressive driving, the examined vehicles noted higher COx emissions (39–46%), NOx emissions (29–41%), HC emissions (39–43%), and PMx emissions (approximately 33%) (Table 2). The driving style had a lesser impact on air-pollutant emissions in motorway driving conditions. Compared to calm driving, aggressive driving produced 3–9% higher COx emissions, 2–14% higher NOx emissions, 5–18% HC higher emissions, and 30% higher PMx emissions. Figure 14 shows the effect of driving style on total pollutant emissions for various route types.
Calm driving in the urban area resulted in a reduction in average emissions of 40–42% for conventional-drive vehicles and 38% for hybrids. The pollutant-emission values estimated for tests conducted on the motorway did not differ widely from the emissions estimates for the urban tests. The results showed that for aggressive driving, average pollutant emissions were 2–14% higher than during calm driving. Hybrids were shown to have pollutant emissions lower than those of conventional-drive vehicles. In urban tests, the conventional-drive vehicles recorded emissions that were 9–14% higher than those of the hybrids. In motorway driving conditions, the conventional-drive vehicles showed average pollutant emissions that were 2–13% higher than those for hybrids.

4. Conclusions

The literature features many definitions of aggressive driving; however, there is no standard definition. Typically, aggressive driving is defined as behavior that includes verbal and physical aggression, abrupt maneuvers, and violations of highway codes. In the presented study, the aggressive driving style was understood to be a subjective feeling for the driver. The driver decided what maneuvers and behavior were to be considered as aggressive and dangerous. The calm and aggressive driving speed profiles recorded during the real-world tests served as input data for the simulation tests of fuel consumption and emissions. The aim of this study was to investigate the influence of aggressive driving style on fuel consumption and emissions of hybrid and conventional passenger vehicles with drive systems.
The presented results demonstrated that aggressive driving caused a significant increase in fuel consumption and pollutant emissions. This was particularly evident for urban driving conditions, during which the average fuel consumption for aggressive driving was up to 30% higher than during calm driving. Notably, the driver, thanks to the onboard computer, was aware of the increases in instantaneous fuel consumption during aggressive driving.
Similarly, compared to calm driving, aggressive driving caused an increase in average pollutant emissions of approximately 40%. Driving calmly in an urban area could reduce air-pollutant emissions by 40–42% for conventional-drive vehicles and 38% for hybrids. In motorway tests, the differences in fuel consumption and pollutant emission were not as significant as they are in the urban area. The results showed that aggressive driving resulted in higher average fuel consumption of up to 4%, with 14% higher average pollutant emissions.
During aggressive urban driving, the increase in COx emission was as high as 46%, and during motorway driving, the increase was up to 9%. Similarly, compared to calm driving, the NOx emissions for aggressive driving were 46% higher than in urban driving, and up to 14% higher than in motorway driving. During aggressive driving in urban driving conditions, the HC and PMx emissions were 35–43% and 33% higher, respectively.
Replacing the conventional-drive vehicles with hybrids resulted in a considerable reduction in fuel consumption and pollutant emissions. The presented analysis indicated that hybrid-drive vehicles record lower emissions, and their use could improve fuel economy in both urban and motorway driving conditions.
This paper presented a preliminary analysis of driving-style research as part of a research project examining driver behavior. In subsequent studies, a larger group of drivers will be tested in different traffic conditions and in different vehicles. The classification of driver behavior allows for the determination of aggressive driving, which, if lessened, may result in a reduction in vehicle operating costs and harmful exhaust emissions.

Author Contributions

Conceptualization, E.M.S. and R.J.; methodology, E.M.S. and R.J.; software, E.M.S.; validation, E.M.S. and R.J.; formal analysis, E.M.S. and R.J.; investigation, E.M.S.; resources, E.M.S. and R.J.; data curation, E.M.S.; writing—original draft preparation, E.M.S. and R.J.; writing—review and editing, E.M.S. and R.J.; visualization, E.M.S. and R.J.; supervision, E.M.S. and R.J.; project administration, E.M.S. and R.J.; funding acquisition, E.M.S. and R.J. Both authors have read and agreed to the published version of the manuscript.

Funding

The research was carried out as part of the Innovative system research project supporting the motor vehicle insurance risk assessment dedicated to UBI (Usage Based Insurance) No. POIR.04.01.04 00 0004/19 00 financed by the National Centre for Research and Development.

Conflicts of Interest

The authors declare no conflict of interest.

References

  1. Tillmann, W.A.; Hobbs, G.E. The accident-prone automobile driver. Am. J. Psychiatry 2006, 106, 321–331. [Google Scholar] [CrossRef] [PubMed]
  2. Sagberg, F.; Bianchi Piccinini, G.F.; Engström, J.A. Review of Research on Driving Styles and Road Safety. Hum. Factors 2015, 57, 1248–1275. [Google Scholar] [CrossRef] [PubMed]
  3. Deng, Z.; Chu, D.; Wu, C.; He, Y.; Cui, J. Curve safe speed model considering driving style based on driver behaviour questionnaire. Transp. Res. Part F Traffic Psychol. Behav. 2019, 65, 536–547. [Google Scholar] [CrossRef]
  4. Shahverdy, M.; Fathy, M.; Berangi, R.; Sabokrou, M. Driver behavior detection and classification using deep convolutional neural networks. Expert Syst. Appl. 2020, 149, 113240. [Google Scholar] [CrossRef]
  5. Constantinescu, Z.; Marinoiu, C.; Vladoiu, M. Driving Style Analysis Using Data Mining Techniques. Int. J. Comput. Commun. Control 2010, 5, 654–663. [Google Scholar] [CrossRef]
  6. Li, G.; Li, S.E.; Cheng, B.; Green, P. Estimation of driving style in naturalistic highway traffic using maneuver transition probabilities. Transp. Res. Part C Emerg. Technol. 2017, 74, 113–125. [Google Scholar] [CrossRef]
  7. Cyganek, B.; Gruszczyński, S. Hybrid computer vision system for drivers’ eye recognition and fatigue monitoring. Neurocomputing 2014, 126, 78–94. [Google Scholar] [CrossRef]
  8. Li, G.; Wang, Y.; Zhu, F.; Sui, X.; Wang, N.; Qu, X.; Green, P. Drivers’ visual scanning behavior at signalized and unsignalized intersections: A naturalistic driving study in China. J. Saf. Res. 2019, 71, 219–229. [Google Scholar] [CrossRef]
  9. Lee, B.; Chung, W. Driver Alertness Monitoring Using Fusion of Facial Features and Bio-Signals. IEEE Sens. J. 2012, 12, 2416–2422. [Google Scholar] [CrossRef]
  10. Przepiorka, A.M.; Hill, T.; Blachnio, A.P.; Sullman, M.J.M.; Taylor, J.E.; Mamcarz, P. Psychometric properties of the Driving Behaviour Scale (DBS) among Polish drivers. Transp. Res. Part F Traffic Psychol. Behav. 2020, 73, 29–37. [Google Scholar] [CrossRef]
  11. Tement, S.; Plohl, N.; Horvat, M.; Musil, B.; Jakus, G.; Sodnik, J. Driving demands, stress reactivity and driving behavior: An interactional approach. Transp. Res. Part F Traffic Psychol. Behav. 2020, 69, 80–90. [Google Scholar] [CrossRef]
  12. Hyodo, S.; Yoshii, T.; Satoshi, M.; Hirotoshi, S. An analysis of the impact of driving time on the driver’s behavior using probe car data. Transp. Res. Procedia 2017, 21, 169–179. [Google Scholar] [CrossRef]
  13. Kovaceva, J.; Isaksson-Hellman, I.; Murgovski, N. Identification of aggressive driving from naturalistic data in car-following situations. J. Saf. Res. 2020, 73, 225–234. [Google Scholar] [CrossRef] [PubMed]
  14. Măirean, C.; Havârneanu, C.-E. The relationship between drivers’ illusion of superiority, aggressive driving, and self-reported risky driving behaviors. Transp. Res. Part F Traffic Psychol. Behav. 2018, 55, 167–174. [Google Scholar] [CrossRef]
  15. Havârneanu, C.E.; Jilavu, A.R.; Havârneanu, G.M. Digit Ratios as Correlates of Accident Involvement and Aggressive Driving—A Pilot Study. Procedia Soc. Behav. Sci. 2014, 127, 575–580. [Google Scholar] [CrossRef] [Green Version]
  16. Eboli, L.; Mazzulla, G.; Pungillo, G. How to define the accident risk level of car drivers by combining objective and subjective measures of driving style. Transp. Res. Part F Traffic Psychol. Behav. 2017, 49, 29–38. [Google Scholar] [CrossRef]
  17. Zheng, F.; Li, J.; van Zuylen, H.; Lu, C. Influence of driver characteristics on emissions and fuel consumption. Transp. Res. Procedia 2017, 27, 624–631. [Google Scholar] [CrossRef]
  18. Ma, H.; Xie, H.; Huang, D.; Xiong, S. Effects of driving style on the fuel consumption of city buses under different road conditions and vehicle masses. Transp. Res. Part D Transp. Environ. 2015, 41, 205–216. [Google Scholar] [CrossRef]
  19. Tang, T.-Q.; Huang, H.-J.; Shang, H.-Y. Influences of the driver’s bounded rationality on micro driving behavior, fuel consumption and emissions. Transp. Res. Part D Transp. Environ. 2015, 41, 423–432. [Google Scholar] [CrossRef]
  20. Tzirakis, E.; Zannikos, F.; Stournas, S. Impact of driving style on fuel consumption and exhaust emissions: Defensive and aggressive driving style. In Proceedings of the 10th International Conference on Environmental Science and Technology, Kos Island, Greece, 5–7 September 2007; pp. 1497–1504. [Google Scholar]
  21. Faria, M.V.; Duarte, G.O.; Varella, R.A.; Farias, T.L.; Baptista, P.C. How do road grade, road type and driving aggressiveness impact vehicle fuel consumption? Assessing potential fuel savings in Lisbon, Portugal. Transp. Res. Part D Transp. Environ. 2019, 72, 148–161. [Google Scholar] [CrossRef]
  22. González, N.; Kindelán, J.C.; Zapata, F. Influence of driving style on fuel consumption and Emissions in diesel-powered passenger car. In Proceedings of the 18th International Symposium Transport and Air Pollution, TAP 2010, Dübendorf, Switzerland, 18–19 May 2010; pp. 1–6. [Google Scholar]
  23. Szumska, E.; Jurecki, R.; Pawełczyk, M. Evaluation of the use of hybrid electric powertrain system in urban traffic conditions. Eksploat. I Niezawodn. Maint. Reliab. 2020, 22, 154–160. [Google Scholar] [CrossRef]
  24. Bayindir, Ç.K.; Gözüküçük, M.A.; Teke, A. A comprehensive overview of hybrid electric vehicle: Powertrain configurations, powertrain control techniques and electronic control units. Energy Convers. Manag. 2011, 52, 1305–1313. [Google Scholar] [CrossRef]
  25. Ehsani, M.; Gao, Y.; Longo, S.; Ebrahimi, K. Modern Electric, Hybrid Electric, and Fuel Cell Vehicles; CRC Press: Boca Raton, FL, USA, 2018. [Google Scholar] [CrossRef]
  26. Wang, Y.; Hao, C.; Ge, Y.; Hao, L.; Tan, J.; Wang, X.; Zhang, P.; Wang, Y.; Tian, W.; Lin, Z.; et al. Fuel consumption and emission performance from light-duty conventional/hybrid-electric vehicles over different cycles and real driving tests. Fuel 2020, 278, 118340. [Google Scholar] [CrossRef]
  27. Hiermann, G.; Hartl, R.F.; Puchinger, J.; Vidal, T. Routing a mix of conventional, plug-in hybrid, and electric vehicles. Eur. J. Oper. Res. 2019, 272, 235–248. [Google Scholar] [CrossRef] [Green Version]
  28. Zahabi, S.A.H.; Miranda-Moreno, L.; Barla, P.; Vincent, B. Fuel economy of hybrid-electric versus conventional gasoline vehicles in real-world conditions: A case study of cold cities in Quebec, Canada. Transp. Res. Part D Transp. Environ. 2014, 32, 184–192. [Google Scholar] [CrossRef]
  29. Shinar, D.; Compton, R. Aggressive driving: An observational study of driver, vehicle, and situational variables. Accid. Anal. Prev. 2004, 36, 429–437. [Google Scholar] [CrossRef]
  30. Abou-Zeid, M.; Kaysi, I.; Al-Naghi, H. Measuring aggressive driving behaviour using a driving simulator: An exploratory study. In Proceedings of the 3rd International Conference on Road Safety and Simulation, Indianapolis, IN, USA, 14–16 September 2011; pp. 1–19. [Google Scholar]
  31. Islam, M.; Mannering, F. A temporal analysis of driver-injury severities in crashes involving aggressive and non-aggressive driving. Anal. Methods Accid. Res. 2020, 27, 100128. [Google Scholar] [CrossRef]
  32. Webster, G.D.; DeWall, C.N.; Pond, R.S., Jr.; Deckman, T.; Jonason, P.K.; Le, B.M.; Smith, C.V. The brief aggression questionnaire: Psychometric and behavioral evidence for an efficient measure of trait aggression. Aggress. Behav. 2014, 40, 120–139. [Google Scholar] [CrossRef]
  33. Konopka, K.; Rajchert, J.; Dominiak-Kochanek, M. The Influence of Aggression-Evoking Cues on Aggressive Cognitions in Males and Females: Different Procedures—Similar Effects. Curr. Psychol. 2020, 39, 128–141. [Google Scholar] [CrossRef] [Green Version]
  34. Alonso, F.; Esteban, C.; Montoro, L.; Serge, A. Conceptualization of aggressive driving behaviors through a Perception of aggressive driving scale (PAD). Transp. Res. Part F Traffic Psychol. Behav. 2019, 60, 415–426. [Google Scholar] [CrossRef]
  35. Lin, N.; Zong, C.; Tomizuka, M.; Song, P.; Zhang, X.; Li, G. An Overview on Study of Identification of Driver Behavior Characteristics for Automotive Control. Math. Probl. Eng. 2014, 569109. [Google Scholar] [CrossRef]
  36. Ma, Y.; Tang, K.; Chen, S.; Khattak, A.J.; Pan, P. On-line aggressive driving identification based on in-vehicle kinematic parameters under naturalistic driving conditions. Transp. Res. Part. C Emerg. Technol. 2020, 114, 554–571. [Google Scholar] [CrossRef]
  37. Eboli, L.; Mazzulla, G.; Pungillo, G. Combining speed and acceleration to define car users’ safe or unsafe driving behaviour. Transp. Res. Part. C Emerg. Technol. 2016, 68, 113–125. [Google Scholar] [CrossRef]
  38. Feng, F.; Bao, S.; Sayer, J.R.; Flannagan, C.; Manser, M.; Wunderlich, R. Can vehicle longitudinal jerk be used to identify aggressive drivers? An examination using naturalistic driving data. Accid. Anal. Prev. 2017, 104, 25–136. [Google Scholar] [CrossRef] [PubMed]
  39. Miles, D.E.; Johnson, G.L. Aggressive driving behaviors: Are there psychological and attitudinal predictors? Transp. Res. Part. F Traffic Psychol. Behav. 2003, 6, 147–161. [Google Scholar] [CrossRef]
  40. Krahé, B. Predictors of women’s aggressive driving behavior. Aggress. Behav. Off. J. Int. Soc. Res. Aggress. 2005, 31, 537–546. [Google Scholar] [CrossRef]
Figure 1. Measurement equipment used in real-world conditions test: (a) test vehicle, (b) optoelectronic sensor, (c) data acquisition system, and (d) three-axis linear acceleration sensor.
Energies 13 06675 g001
Figure 2. Velocity profiles of test cycles on a motorway and in urban driving condition (red line marks the average speed). (a) urban calm driving; (b) motorway calm driving; (c) urban aggressive driving (d) motorway aggressive driving.
Energies 13 06675 g002
Figure 3. Percentage distribution of velocity during the test cycles. (a) urban driving; (b) motorway driving.
Energies 13 06675 g003
Figure 4. Longitudinal acceleration profiles of the test cycles. (a) urban driving; (b) motorway driving.
Energies 13 06675 g004
Figure 5. Percentage distribution of longitudinal acceleration profiles over the test cycles. (a) urban driving; (b) motorway driving.
Energies 13 06675 g005
Figure 6. Model of parallel hybrid vehicle in ADVISOR.
Energies 13 06675 g006
Figure 7. Average fuel consumption during test cycles (a) in urban conditions, (b) in motorway, and percentage difference (c) urban test cycles, (d) motorway test cycles.
Energies 13 06675 g007
Figure 8. Instantaneous fuel consumption (a) in urban conditions, (b) in motorway, and its percentage distribution for the gasoline vehicle in (c) urban test cycles, (d) motorway test cycles.
Energies 13 06675 g008
Figure 9. Instantaneous fuel consumption (a) in urban conditions, (b) in motorway, and its percentage distribution for the diesel vehicle in (c) in urban conditions, (d) in motorway.
Energies 13 06675 g009
Figure 10. Fuel consumption rate estimated for HEV gasoline (a) in urban conditions, (b) in motorway; for HEV diesel (c) in urban conditions; (d) in motorway.
Energies 13 06675 g010
Figure 11. Fuel consumption rate estimated for HEV gasoline (a) in urban conditions, (b) in motorway; for HEV diesel (c) in urban conditions; (d) in motorway.
Energies 13 06675 g011
Figure 12. State of charge (SOC) estimated for HEV gasoline (a) in urban conditions, (b) in motorway; for HEV diesel (c) in urban conditions; (d) in motorway.
Energies 13 06675 g012
Figure 13. Emissions during the test cycles.
Energies 13 06675 g013
Figure 14. Total average emissions during the test cycles in (a) urban conditions; (b) motorway.
Energies 13 06675 g014
Table 1. Parameters of vehicles used in simulation tests.
ConventionalHybrid
DieselGasolineHEV DieselHEV Gasoline
Engine power (kW)95956565
Electric machine power (kW)7575
Battery capacity (kWh)4.64.6
Weight (kg)6464
Table 2. Percentage increase in air-pollutant emissions caused by the aggressive driving style.
UrbanMotorway
COxNOxPMxHCCOxNOxPMxHC
Diesel43%46%29%32%13%3%0%0%
Gasoline40%40%46%18%9%10%
HEV diesel35%45%28%33%4%0%14%29%
HEV gasoline39%39%31%5%3%2%
Publisher’s Note: MDPI stays neutral with regard to jurisdictional claims in published maps and institutional affiliations.

