Article

Humidity-Sensitive, Demand-Controlled Ventilation Applied to Multiunit Residential Building—Performance and Energy Consumption in Dfb Continental Climate

Faculty of Building Services, Hydro and Environmental Engineering, Warsaw University of Technology, Nowowiejska 20, 00-653 Warsaw, Poland
*
Author to whom correspondence should be addressed.
Energies 2020, 13(24), 6669; https://doi.org/10.3390/en13246669
Submission received: 16 November 2020 / Revised: 4 December 2020 / Accepted: 8 December 2020 / Published: 17 December 2020
(This article belongs to the Section G: Energy and Buildings)

Abstract

:
Humidity-sensitive, demand-controlled ventilation systems have been in use for many years in regions with oceanic climates. Some attempts have been made to apply this technology in Poland, which has a continental climate. This article evaluates the performance and energy consumption of such a system when applied in an eight-floor, multiunit, residential building, i.e., the virtual reference building described by the National Energy Conservation Agency (NAPE), Poland. Simulations using the computer program CONTAM were performed for the whole heating season based upon the climate in Warsaw. Besides passive stack ventilation, that served as a reference, two ventilation systems were studied: one standard and one “hybrid” system with additional roof fans. This study confirmed that the application of humidity-sensitive, demand-controlled ventilation in multiunit residential buildings in a continental climate (Dfb) led to significant energy savings (up to 11.64 kWh/m2 of primary energy). However, the operation of the system on higher floors was found to be ineffective. Ensuring consistent operation of the system on all floors required supplementary fans. The introduction of a hybrid mode reduced carbon dioxide concentrations by approximately 32% in the units located in the upper part of the building. The energetic effect in such cases depends strongly on the electricity source. In the case of the national energy grid, savings of primary energy would be relatively low, i.e., 1.07 kWh/m2, but in the case of locally produced renewable energy, the energy savings would be equal to 5.18 kWh/m2.

1. Introduction

Multiunit residential buildings (MURBs) dominate the housing sector in many cities in Europe [1], Asia [2], and North America [3]. Occupant comfort can be influenced by environmental outdoor and indoor conditions, building characteristics, and occupant-related activities. However, thermal parameters and indoor air quality (IAQ) are regarded as the most important factors for overall comfort in MURBs [4].
Older buildings were initially equipped with natural ventilation systems; in Europe, this was most often passive stack ventilation. However, the low initial cost of these systems leads to high operational costs. Different values of pressure observed on various floors result in significant differences in ventilation intensity [5]. Usually, units on the ground floor have much higher air change rates than units located on the highest floor. Moreover, on the highest floor, quite often, reverse flows in ventilation ducts are observed. As grilles leading to exhaust ducts are located in so-called wet rooms, such as toilets, bathrooms, and kitchens [6], reverse flows disperse moisture and odors in the whole unit. Because airflows are strongly dependent on changing weather conditions, rather than on users’ needs, residents often complain about indoor air quality. In order to save energy and increase comfort, smarter solutions are required.
Smart ventilation uses controls to ventilate more intensively when doing so will not consume more energy, or when increased ventilation is required to improve IAQ. The fundamental goal of this concept is to reduce energy use and costs related to ventilation while maintaining or improving IAQ [7]. Systems responding to variable ventilation needs are called demand-controlled ventilation (DCV). In public or office buildings, this control strategy usually supports balanced mechanical ventilation. However, in residential buildings, the DCV concept is applied to natural or hybrid ventilation [8]. The systems usually use trickle vents integrated into façades or window systems, exhaust grilles, and fans supporting naturally driven airflows. The design of the trickle vents should consider many criteria: airflow characteristics, ease to control, actuation, thermal insulation, water tightness, and many others [9]. Mijakowski and Sowa described an intervention study in a kindergarten [10], whereby initially, a room with a volume of 138.8 m3, occupied by 20 children and two teachers, was ventilated naturally, i.e., no trickle vents were installed in the windows. It was found that subsequently installing four humidity-sensitive, demand-controlled trickle vents did not solve the problem of low indoor air quality. The average ventilation rate increased from 0.2 to 0.3 h−1, which was still only about one-tenth of the required value. The study indicated that any control strategy is ineffective in the absence of forces effectively driving air flows.
Besides occupancy, the most common DCV control strategies are sensitive to [11]:
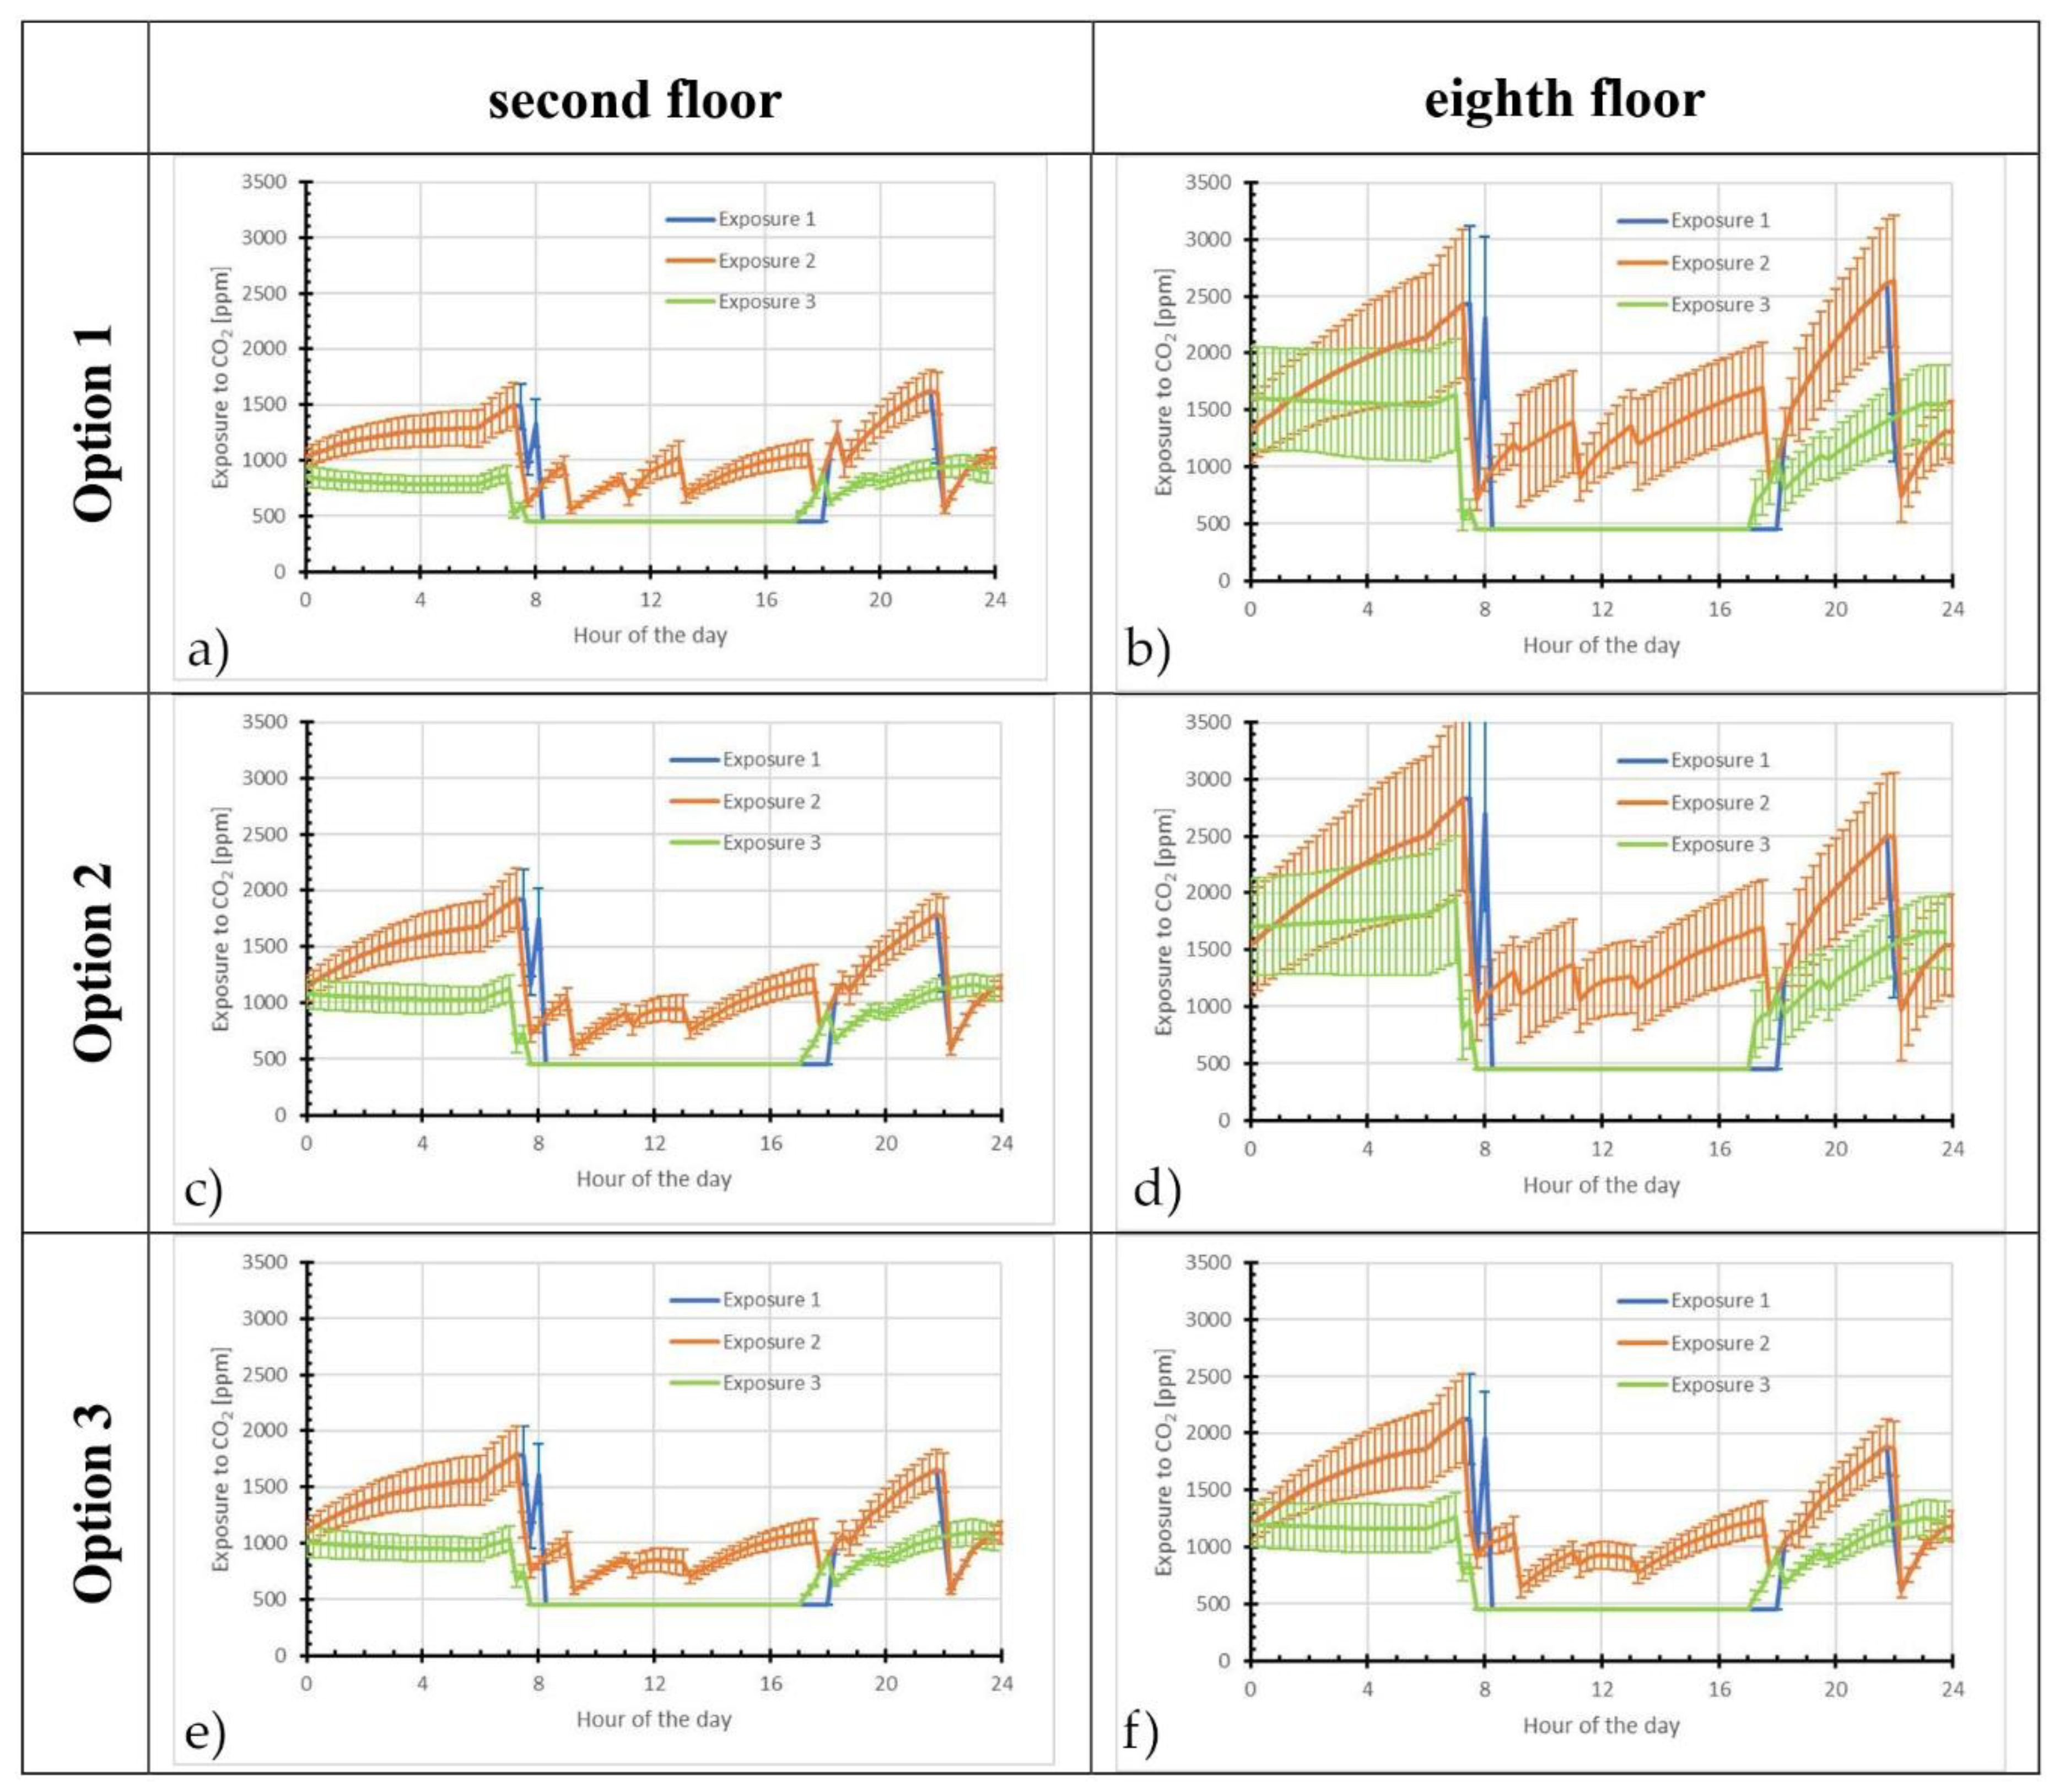
  • carbon dioxide (as an indicator of human bioeffluents)
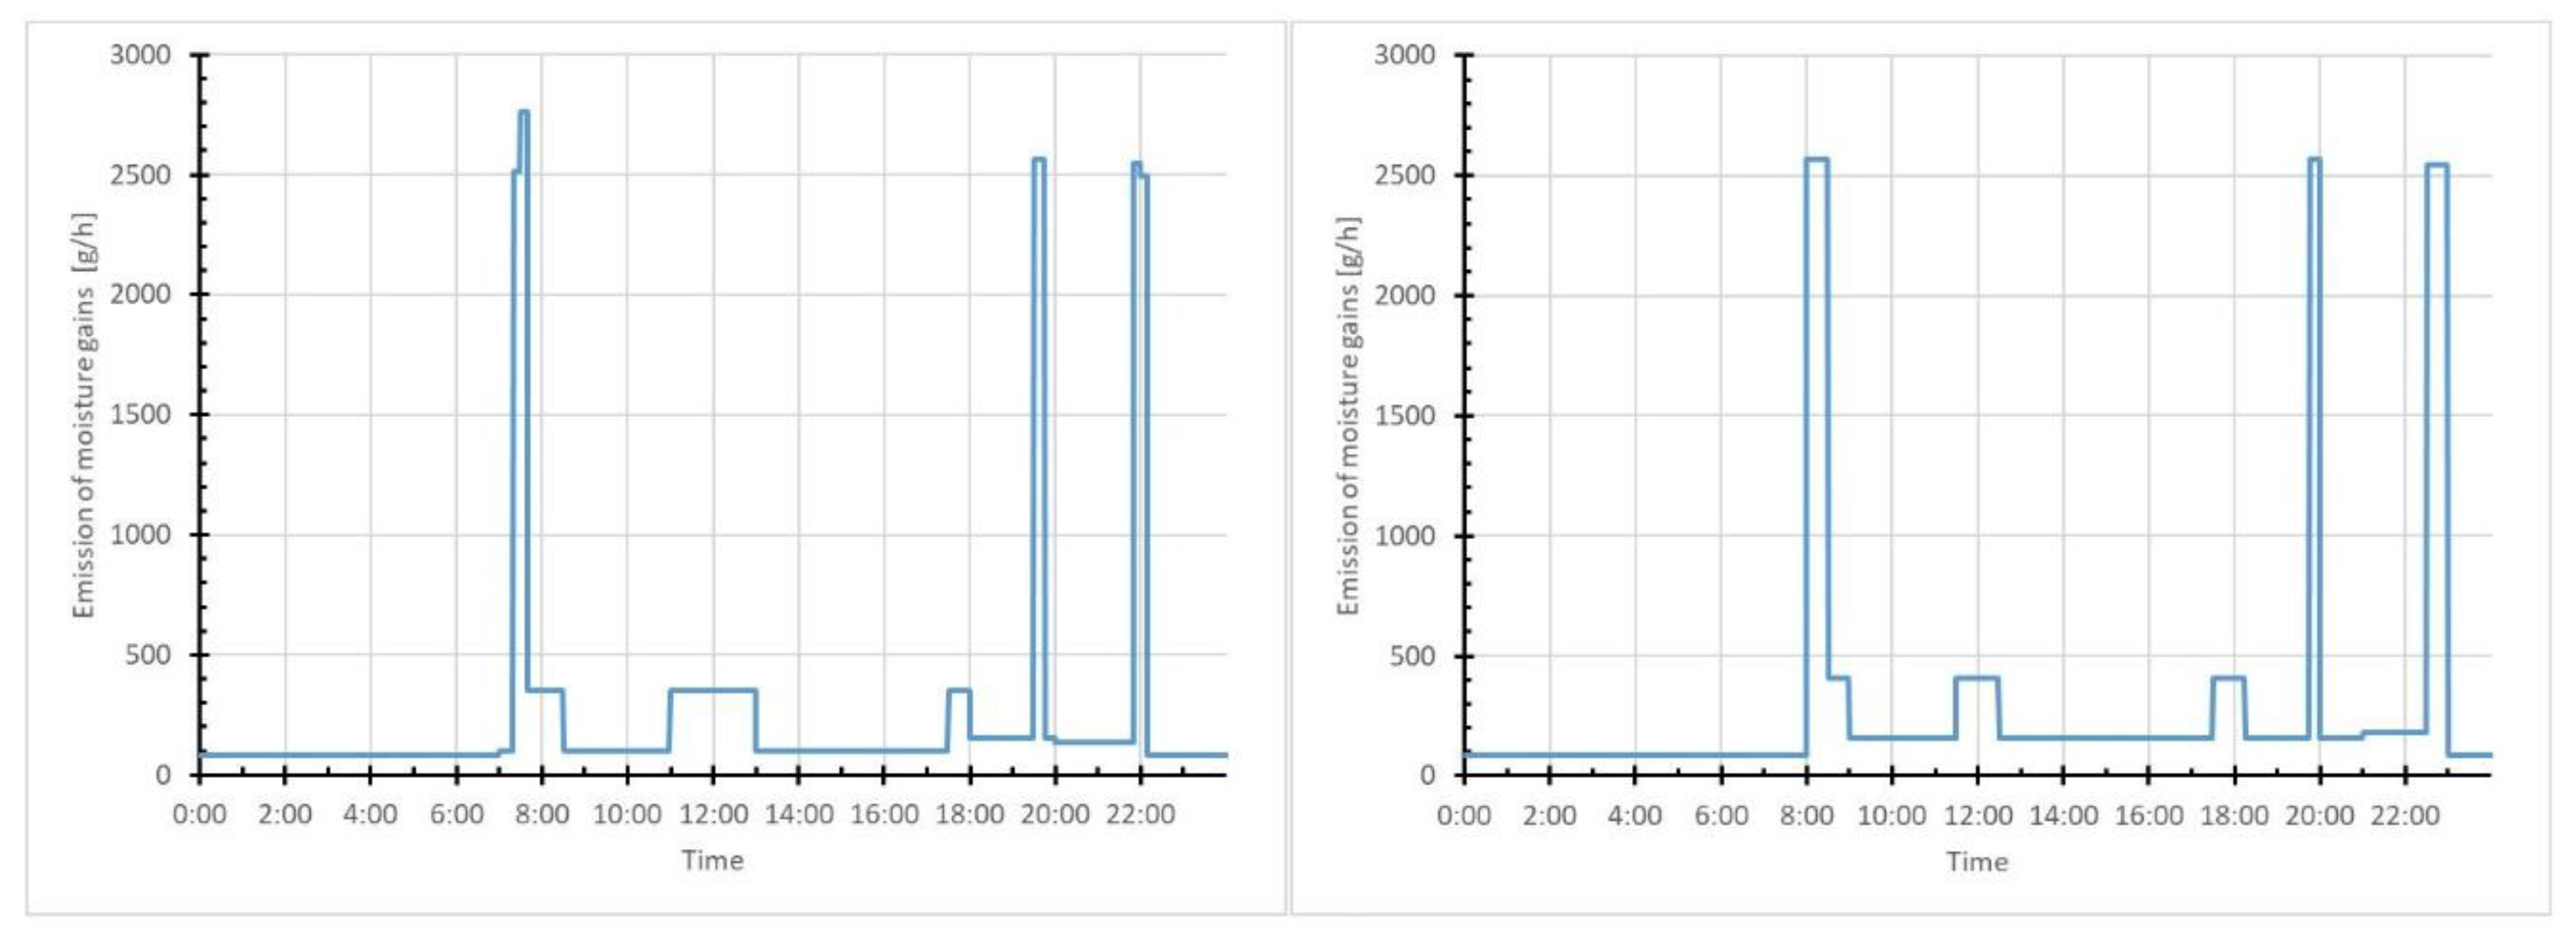
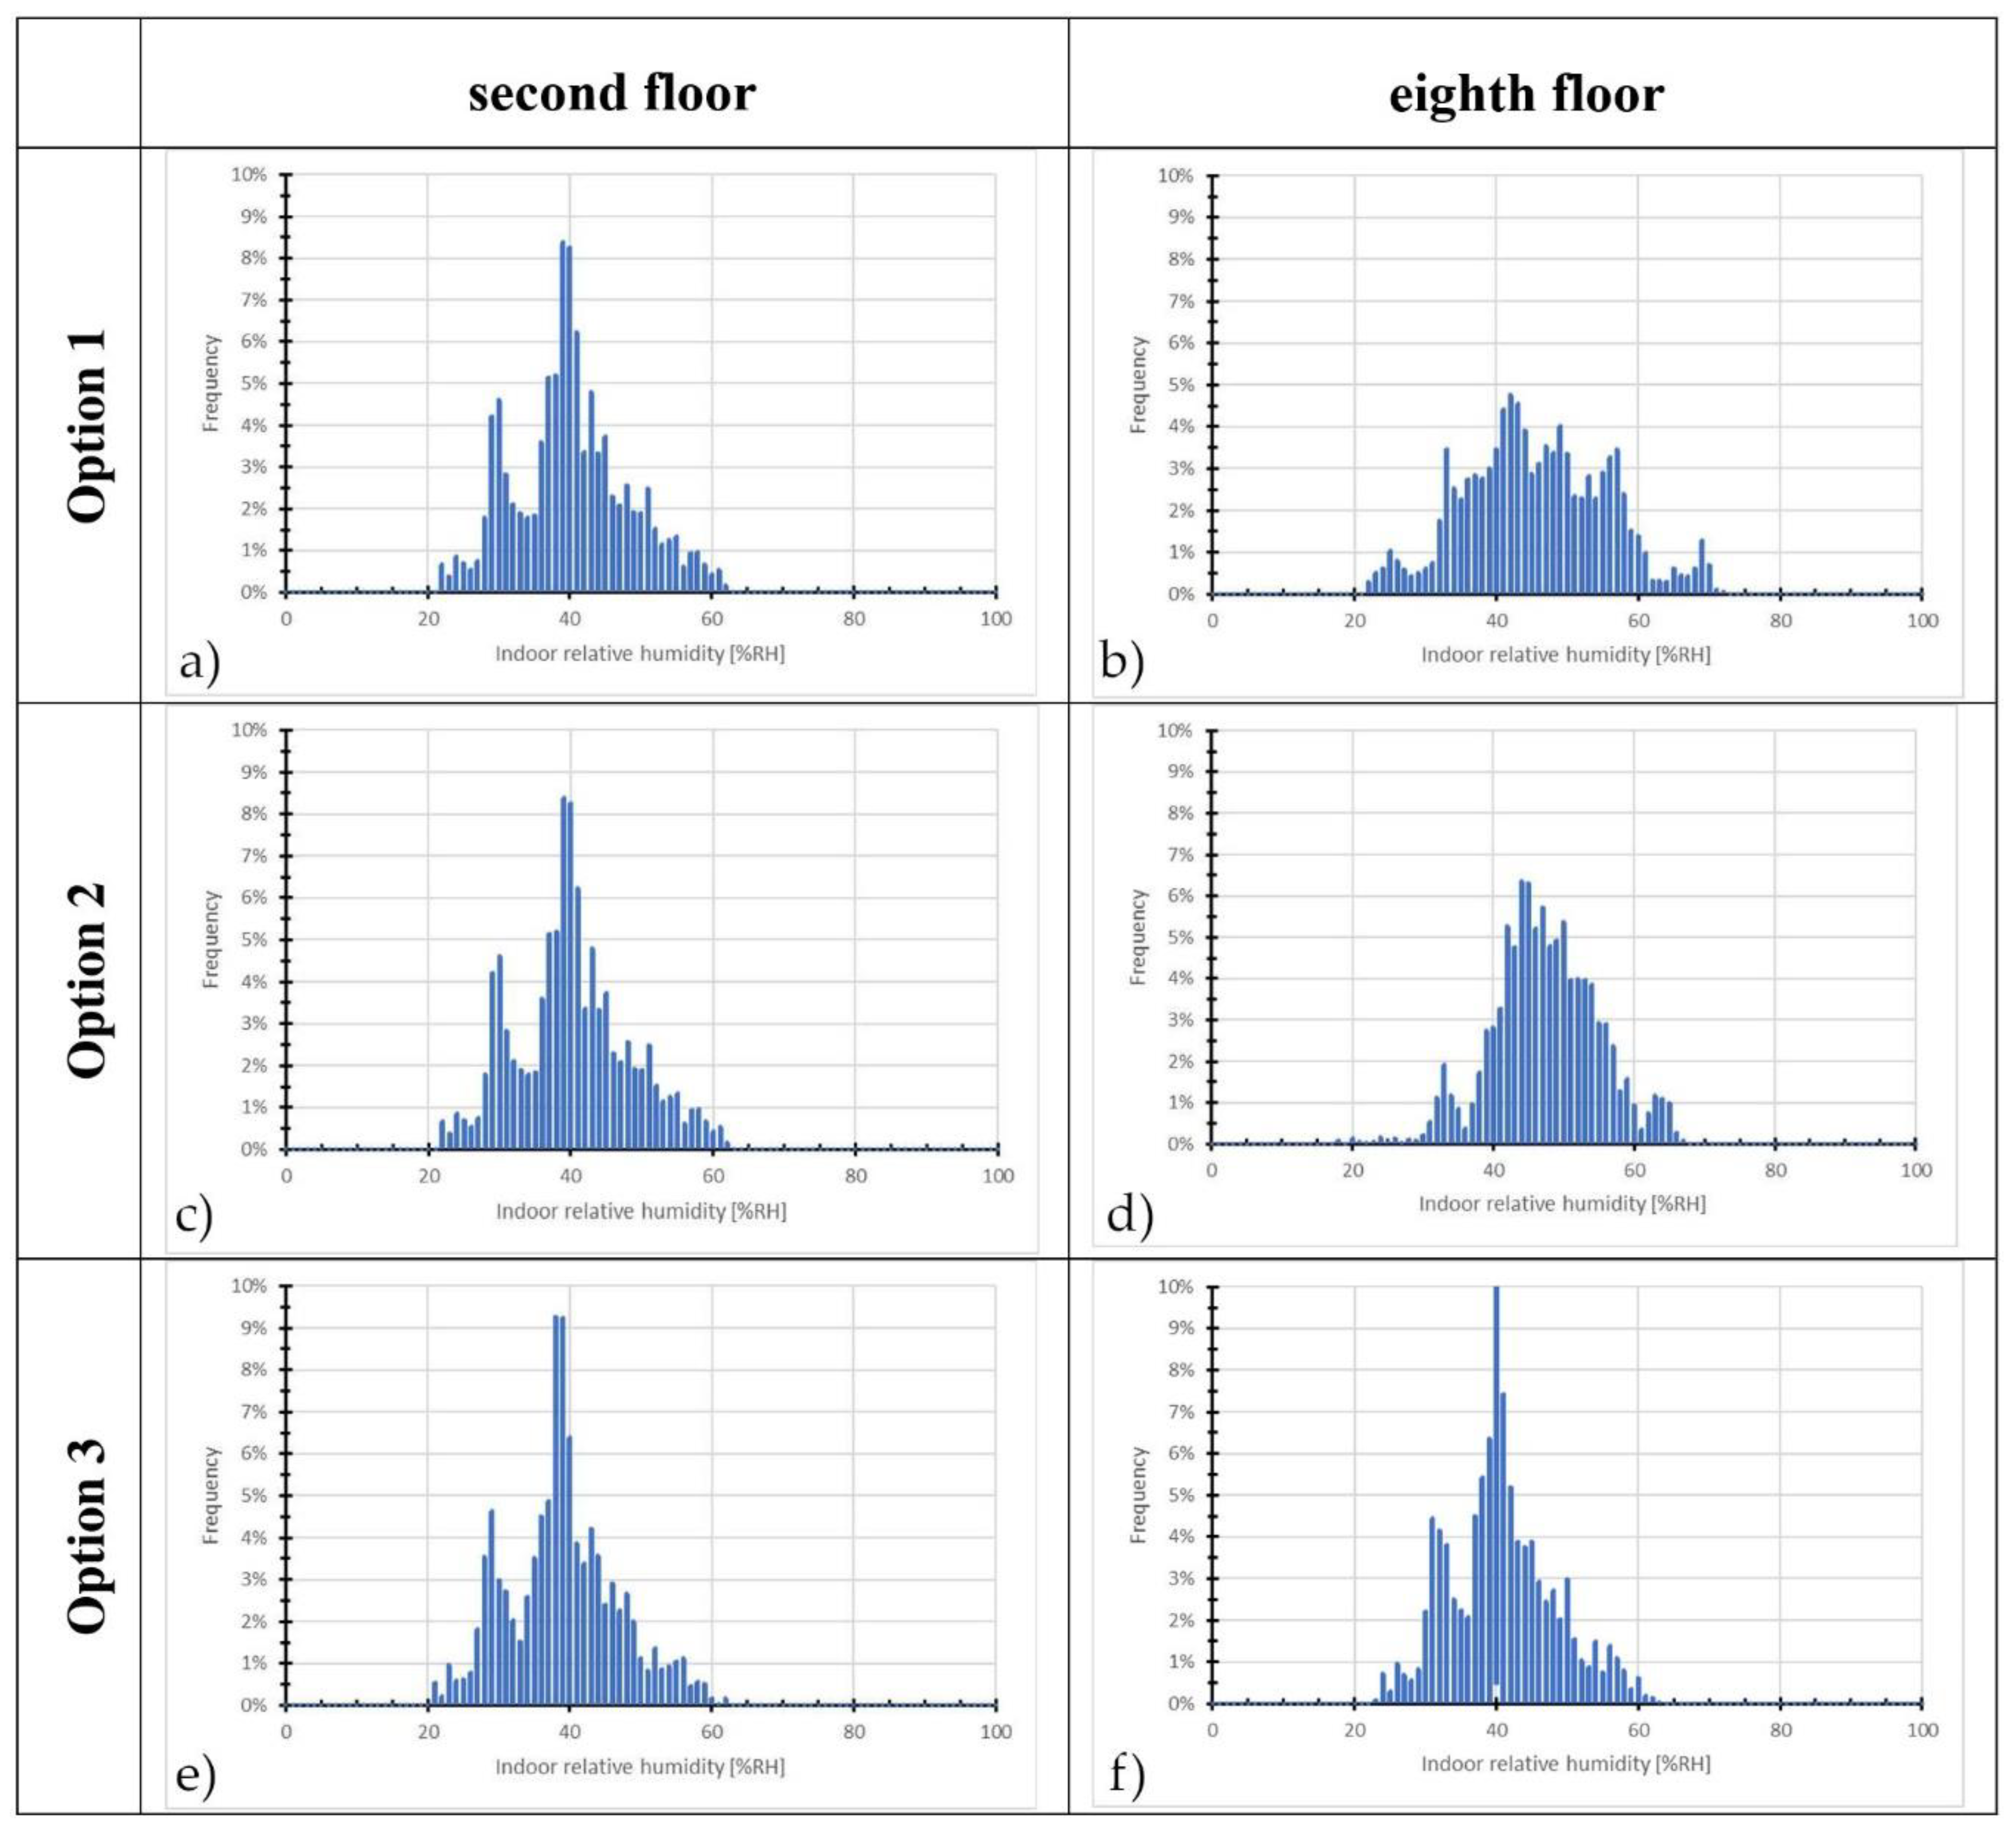
  • humidity (as an indicator of human respiration and activities like cooking, bathing, etc.)
  • particles (e.g., as an indicator of smoking)
  • Total Volatile Organic Compounds (TVOC, as an indicator of emissions from building materials and different processes).
These strategies differ in their adaptability to various occupancies on both temporal and spatial scales. The proportional relationship between energy use and occupancy [12], regarded as being optimal in public buildings, is more complicated in residential buildings. Processes such as combustion, cooking, washing, or bathing also require ventilation. Controlling humidity is a promising strategy.
According to epidemiological studies, dampness related risk factors are associated with a number of human respiratory diseases. Dampness in residential buildings is connected with a 50% increase in asthma and substantial increases in other respiratory health outcomes. These findings suggest that 21% of current asthma cases in the United States may be a consequence of residential dampness and mold [13].
As many old buildings are still awaiting revitalization, solutions for the modernization of inhabited buildings are in demand. Applied systems usually use existing ventilation ducts, and changes are limited to the installation of smart inlets and exhaust elements, or the use of chimney caps or fans in ventilation ducts [14].
One suitable ventilation system for simple retrofitting is humidity-based, demand-controlled ventilation. The trickle vents used in such systems have variable characteristics which are influenced by the relative humidity. Typically, in the range of 30–70% RH, airflow is a linear function of indoor relative humidity when tested with a constant pressure drop. The performance of the exhaust grills also depends on the relative humidity. If needed, exhaust fans equipped with pressure sensors can be mounted on the roof above the exhaust ducts.
Humidity-based DCV systems have been in use in France for more than 35 years. Woloszyn et al. [15] presented a study on humidity-sensitive, demand-controlled ventilation, concluding that energy savings were mainly related to reducing the mean ventilation rate when the building was not being used. In the tested case, after the application of humidity-sensitive, demand-controlled ventilation, the average ventilation rate was reduced by 30–40% compared to the reference; as a result, energy savings of 12–17% were observed.
Variants of the system were tested in MURBs in several demonstration projects in various European countries [9]. Long-term monitoring campaigns [16,17] allow observations to be made of a significant phenomenon which is inherent to humidity-controlled ventilation: its statistical seasonal behavior. The humidity-controlled ventilation saved energy on heat losses, from 30% to 55% in the measured dwellings, giving a lower average airflow in winter than in summer. The monitoring campaigns also demonstrated that the instantaneous airflow could be very high when needed with this system, even in winter, where the average airflow is low. An additional advantage of demand-controlled ventilation is the reduction in fan usage due to the statistically confirmed low airflow induced by the system. In France, humidity-sensitive ventilation has become a reference system, including in low-energy residential buildings [18].
However, humidity-sensitive grilles need periodical cleaning; otherwise, dust accumulates, covering the grille flaps and decreasing the airflow, especially for the low openings [19]. After nine years of operation, the estimated average drift of hygroscopic devices was below ±1.5% RH, i.e., lower than the declared accuracy of the electronic humidity sensors used to collect the data (±1.8% RH) [20].
Recently, several attempts have been made to apply humidity-sensitive, demand-controlled ventilation systems to Polish multiunit residential buildings as part of wider modernization efforts. Unfortunately, in Polish conditions, the system often does not yield the expected gains. A literature review indicated that most studies on this technology were conducted in moderate climates. Moreover, the performance of such systems is typically tested only in single-family buildings or low rise MURBs.
This article aims to fill this gap and analyze the performance of humidity-sensitive, demand-controlled ventilation systems, applying the National Energy Conservation Agency (NAPE) guidelines. The present analysis will be based on computer simulations performed in a virtual reference building with a defined usage pattern. Additionally, this article seeks to address the following questions:
  • How does the system operate in continental climates (subtype Dfb)?
  • What are the potential energy savings?
  • Does the system improve air quality?
  • Is the system able to reduce differences in ventilation intensity on different floors?
  • Is the system able to eliminate reverse flows in ventilation ducts?

2. Modeling of Humidity-Based, Demand-Controlled Natural and Hybrid Ventilation

The design of humidity-based, demand-controlled hybrid ventilation systems presents many challenges. If the system is analyzed in a residential or office building with many rooms, the applied model must allow the researcher to perform multizone simulations. Both natural and mechanical forces driving airflows have to be considered, as the system is hybrid in nature. The use of humidity-based, demand-controlled strategies requires simultaneous humidity ratio calculations in each building zone and airflow calculations between zones. Moreover, modeling has to take into account the behavior of control elements.
To obtain precise results, detailed modeling is required of the material moisture buffering properties in contact with the indoor air. During the development of the Humi-Mur model, it was shown that neglecting hysteresis in the description of the sorption–desorption process leads to significant inaccuracies [21]. Nevertheless, much simpler models, like the simplified two-parameter method, similar to the Thermal Response Factors (TRF) method, can give quite good results [22].
The body of knowledge gained thanks to many research programs shows that the modeling of IAQs should include a description of human activities which are stochastic in nature [23]. Users influence the indoor environment in several ways, which may be divided into three groups: migration between microenvironments, the emission of pollutants (including water vapors), and changes in natural and mechanical ventilation characteristics (e.g., through opening windows). Actual behavior depends on several factors, many of which are very subjective, and most of which are interrelated.
Usually, in multizone airflow analyses, stochastic factors are taken into account by [24]:
  • generating input time series with data that is stochastic in nature,
  • describing disturbances as Gaussian distributions and applying Stochastic Differential Equation (SDE) theory,
  • and generating multiple sets of input data and applying a Monte Carlo simulation.
An example of the application of the Monte-Carlo method to a sensitivity analysis while modeling the performance of DCV with four different demand control strategies was presented in [25,26]. The authors found that a control strategy for exhaust grilles based on relative humidity was more sensitive to input data than a strategy for the central exhaust fan based on occupancy detection affecting, or on a strategy based on CO2 measurements as a means of controlling trickle fans supplying air to rooms.
Generalized mathematical models can describe the most straightforward cases. Necessary dependencies for natural ventilation systems can be found, for example, in [27]. Calculations of combined natural and mechanical ventilation systems were described in the technical reports of the RESHYVET project [28]. Renewable energy technologies integrated with hybrid ventilation in residential buildings were listed and described by Antvorskov [29]. The list covered such technical solutions as a solar chimneys, wind turbines, wind cowls, and windcatchers. A more complex approach is the dimensionless design approach [30].
In practice, when modeling multiunit buildings, researchers usually use computer programs based on multizone, macroscale models. A literature review indicated that many different computer programs have been used for that purpose. Jeong and Haghighat [31] confirmed that modeling hybrid ventilated buildings using the ESP-r simulation package is possible, and that the thermal and airflow results are available and have practical value. However, they observed limitations related to the modeling of complicated building systems or of CO2-based control systems. A study by Zhai et al. [32] analyzed the impact of natural and hybrid ventilation models on whole-building energy consumption using EnergyPlus. The simulation results were very accurate only for one building out of the three that were modeled; the other two buildings were far less promising. The authors discussed the imperfections of the EnergyPlus network model for use with natural and hybrid ventilation. On the other hand, many articles (e.g., [33,34]) have demonstrated the potential of EnergyPlus to model mechanical DCV systems. Hesaraki and Holmberg used an IDA ICE 4 simulation software to analyze the impact of demand-controlled ventilation installed in new residential buildings on indoor air quality and energy use [35]. In that study, the energy demands for heating, and electricity consumption for the ventilation fan, were decreased by 20% and 30%, respectively.
Simulations of a humidity-controlled ventilation system can also be conducted using Clim2000 [36]. Additionally, Savin and Laverge [37] claimed that other programs, such as SIREN (developed by CSTB, France) and WUFI® Plus (developed by Fraunhofer IBP, Germany), are reliable in assessments of demand-controlled ventilation.
In several published papers, analyses of the performance of humidity-based ventilation systems were based on simulations performed using the multizone airflow simulation package, CONTAM (developed by NIST, USA) [38,39]. The literature documents the validity of this indoor air simulation tool compared to, e.g., tracer gas measurements [40,41,42]. CONTAM has been used in many studies devoted to demand-controlled ventilation controlled by indoor contaminants (e.g., [43]). Applying mass balance equations that incorporate water vapor sources and sinks allows CONTAM to predict water vapor concentrations in each zone [44], even though water vapor is not commonly regarded as an indoor contaminant. However, when simulating fast transport mechanisms, such as high air change rates, sorption, and chemical reactions, the solvers typically used by CONTAM may have difficulty accurately predicting transient contaminant concentrations or humidity ratios. Solver CVODE adjusts its time steps to control errors, does not require a defined time step, and can predict pollutant dynamics on time scales shorter than one second [45].
CONTAM, which is under constant development, is now able to couple multizone airflow and contaminant transport analyses with energy simulation computer programs such as EnergyPlus [46] and TRNSYS [47]. The airflow results obtained from CONTAM can be used as the input data for the energy model of any building. Such an approach was presented by Sowa and Mijakowski [48]; those authors performed airflow analyses using CONTAM (calculations with a 1-min time step, exported data with a 15-min time step), while hourly calculations of energy consumption were performed using the 6R1C energy model [49]. The model, developed at the Warsaw University of Technology, is based on the simple hourly method described in ISO FDIS 13790:2008 [50]. An essential modification involves dividing airflows between outdoor and indoor into controlled airflows and uncontrolled infiltration/exfiltration. Similarly to 5R1C, it is possible to add the heat energy streams to three nodes, i.e., the building construction interior, the internal surface of building construction, and indoor air. The developed model successfully passed verification with BESTEST [51].
Emmerich [52] reported the simulated performance of natural, hybrid, and mechanical ventilation systems in a virtual office building located in various American towns with different climates. The analyses were performed using coupled thermal/airflow modeling provided by the CONTAMR multizone modeling program. In the demanding climates of Boston, Minneapolis, and Miami, the natural ventilation performance was unacceptable. Mechanical ventilation provided more steady control, as anticipated. In all climates, the hybrid system offered benefits, i.e., significant savings in auxiliary electricity use, lower cooling loads, or both. However, hybrid ventilation often resulted in higher heating loads.
The sensitivity of hybrid ventilation systems to variations in some of the most significant parameters was presented by Pinto et al. [53]. That study used computer simulations in CONTAM and experimental data of the air permeability of the building envelope and ventilation device performance characteristics.

3. Materials and Methods

3.1. NAPE Recommendation Scheme for Ventilation Systems

The National Energy Conservation Agency (NAPE) recommendations for ventilation systems were developed in cooperation with the Warsaw University of Technology [54]. The general principles of the concept can be applied to different types of buildings. However, only the scheme for residential buildings is sufficiently mature at the moment. The recommended procedure is designed as a comparative study of the seasonal primary energy consumption and air volume. The energy balance calculated for the heating season considers heating and auxiliary energy associated with ventilation. The air volume for whole buildings is presented as simple statistics (minimal, maximal, and average value). Two types of virtual buildings can serve as the reference: an eight-floor, multiunit residential building and a two-floor, single-family building. Simulations are performed for reference usage patterns and in standardized weather conditions. One of the reference ventilation systems (i.e., passive stack ventilation) and some investigated systems present considerable differences in performance over time and between similar units located on different floors. Therefore, a detailed analysis of airflows must be performed before any recommendations can be made.
While defining the NAPE scheme, the capabilities of various computer programs were tested. As the reference ventilation system was passive stack ventilation, it was necessary to use programs reflecting the variable operation of this type of ventilation in as much detail as possible. After careful analysis and testing, the CONTAM (v 2.4, NIST, Gaithersburg, MD, USA) program was selected. The software was successfully used to model the performance of a variety of natural, hybrid, and mechanical ventilation systems.

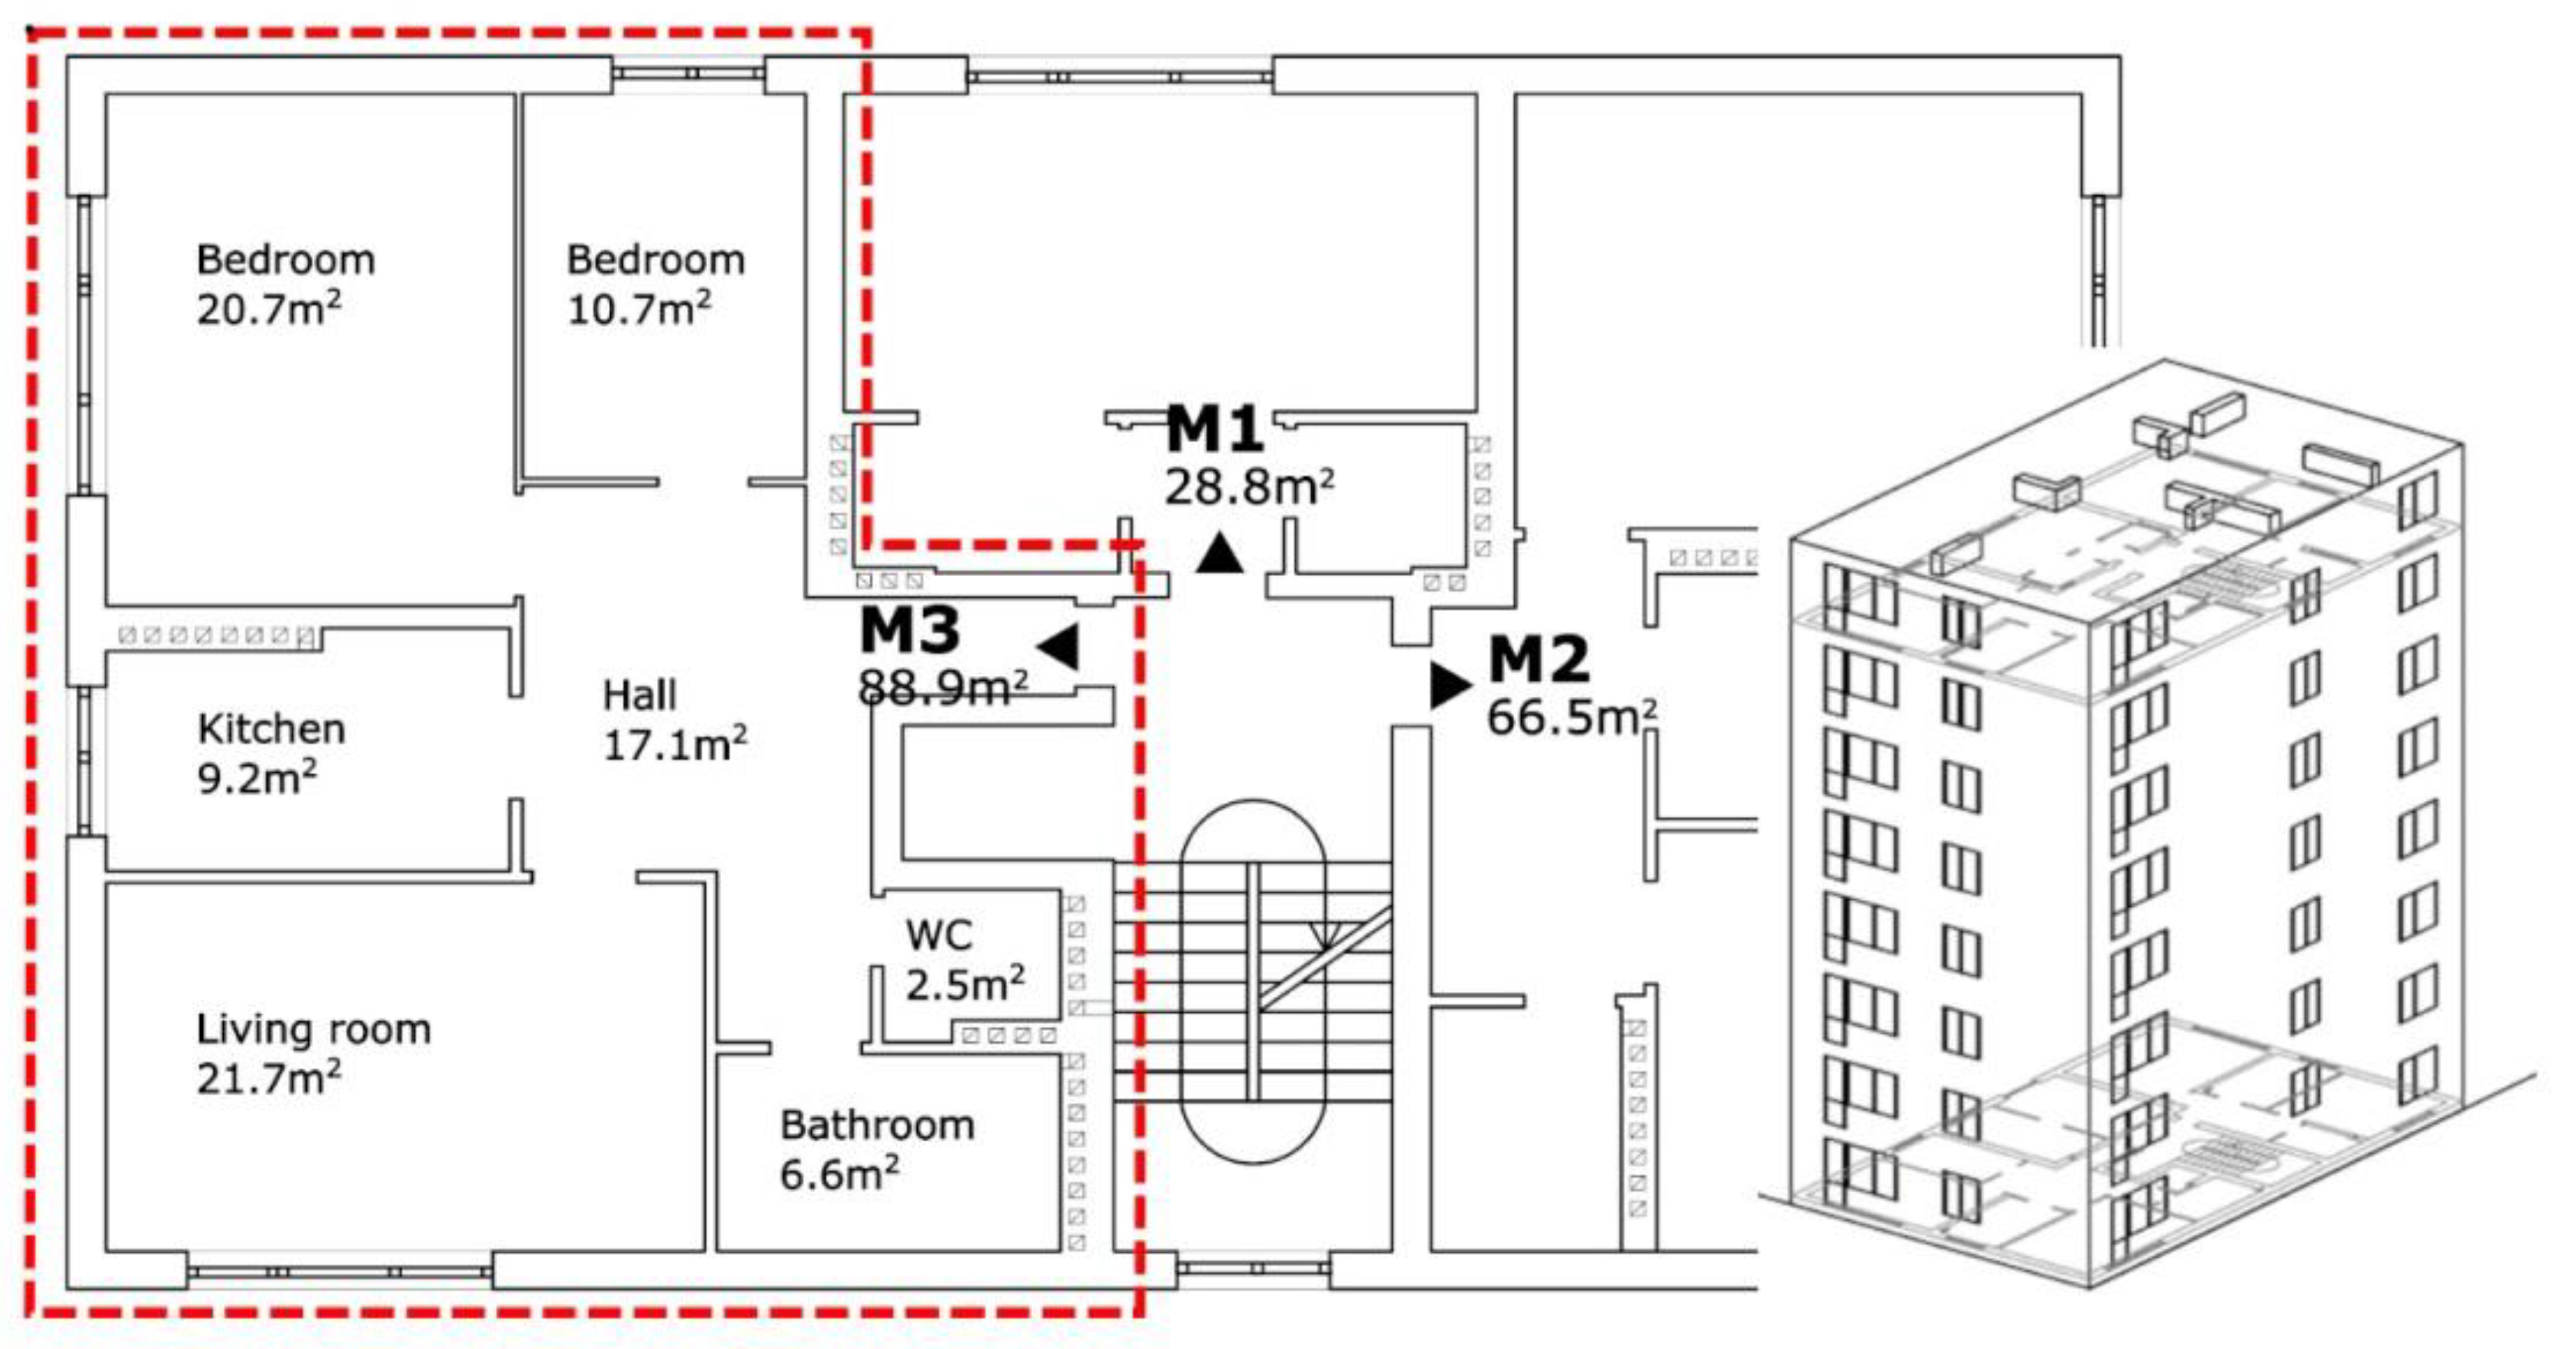
3.2. The NAPE Eight-Floor Virtual Reference Building

This study describes the simulations performed for a virtual multiunit residential building (Figure 1), according to the following assumptions:
  • an eight-floor building with a basement,
  • three small apartments, M1, M2, and M3, on each floor (and assumptions regarding the use of the apartments),
  • a flat roof,
  • thermal parameters of building partitions (minimum requirements according to Polish building codes and related ministerial ordinance [55] for newly erected buildings), central hydronic heating with convection heaters,
  • heat source—district heating network.
The building had a usable area of Af = 1634 m2. The area was divided into 23 units that were occupied by 47 persons. The building’s envelope surface was Ae = 2028.5 m2 that, together with the total volume of the building Ve = 5865 m3, gave a shape ratio of Ae/Ve = 0.35.
In each unit type, a time pattern of the emission of moisture related to the presence and activities (cooking, washing dishes, shower) of occupants was defined. The walls and ceiling had gypsum plaster that was taken into account in the modeling of the moisture buffering.
The NAPE reference building could be analyzed with two different reference ventilation systems: mechanical exhaust ventilation and passive stack ventilation. Mechanical exhaust ventilation meets the minimal requirements of the Polish ventilation standards [56]. Air is exhausted from so-called wet rooms, i.e.,
  • kitchens (70 m3/h when equipped with gas cooker),
  • bathrooms with or without a toilet (50 m3/h), and
  • separate toilets (30 m3/h).
In such a system, the air supply is through trickle vents which provide 30 m3/h of air when tested with a 10 Pa pressure difference.
According to Polish regulations, passive stack ventilation should ensure identical airflows to mechanical exhaust ventilation. In practice, air change rates driven by natural forces are not verified by any calculations. The model applied in the NAPE reference building assumed that air was supplied to the units through trickle vents installed in each window. These trickle vents fulfilled the Polish ventilation standards [56] and supplied 50 m3/h in test conditions at a 10 Pa pressure difference. Exhaust grills connected to individual stacks with a 14 × 14 cm cross-section were located in all wet rooms. Outlets of the stacks were placed above the roof.
According to the Polish ventilation standards, the following airflows should be exhausted: unit M1—100 m3/h, unit M2—80 m3/h, and unit M3—130 m3/h. For all units, the required airflow was 2380 m3/h.
In a further analysis of the simulation results, special attention will be paid to unit M3. The unit has a floor area of approximately 88.9 m2 and is virtually used by two adults and a child. The space is divided into a living room and two bedrooms, a kitchen, bathroom, separate toilet, and a hall. Schedules of occupancy define in which room each person is present on typical workdays and on the weekends. One adult and the child are out of the home during the day on workdays. Figure 2 presents a pattern of moisture emissions for a workday and a weekend.

3.3. Investigated Ventilation Options
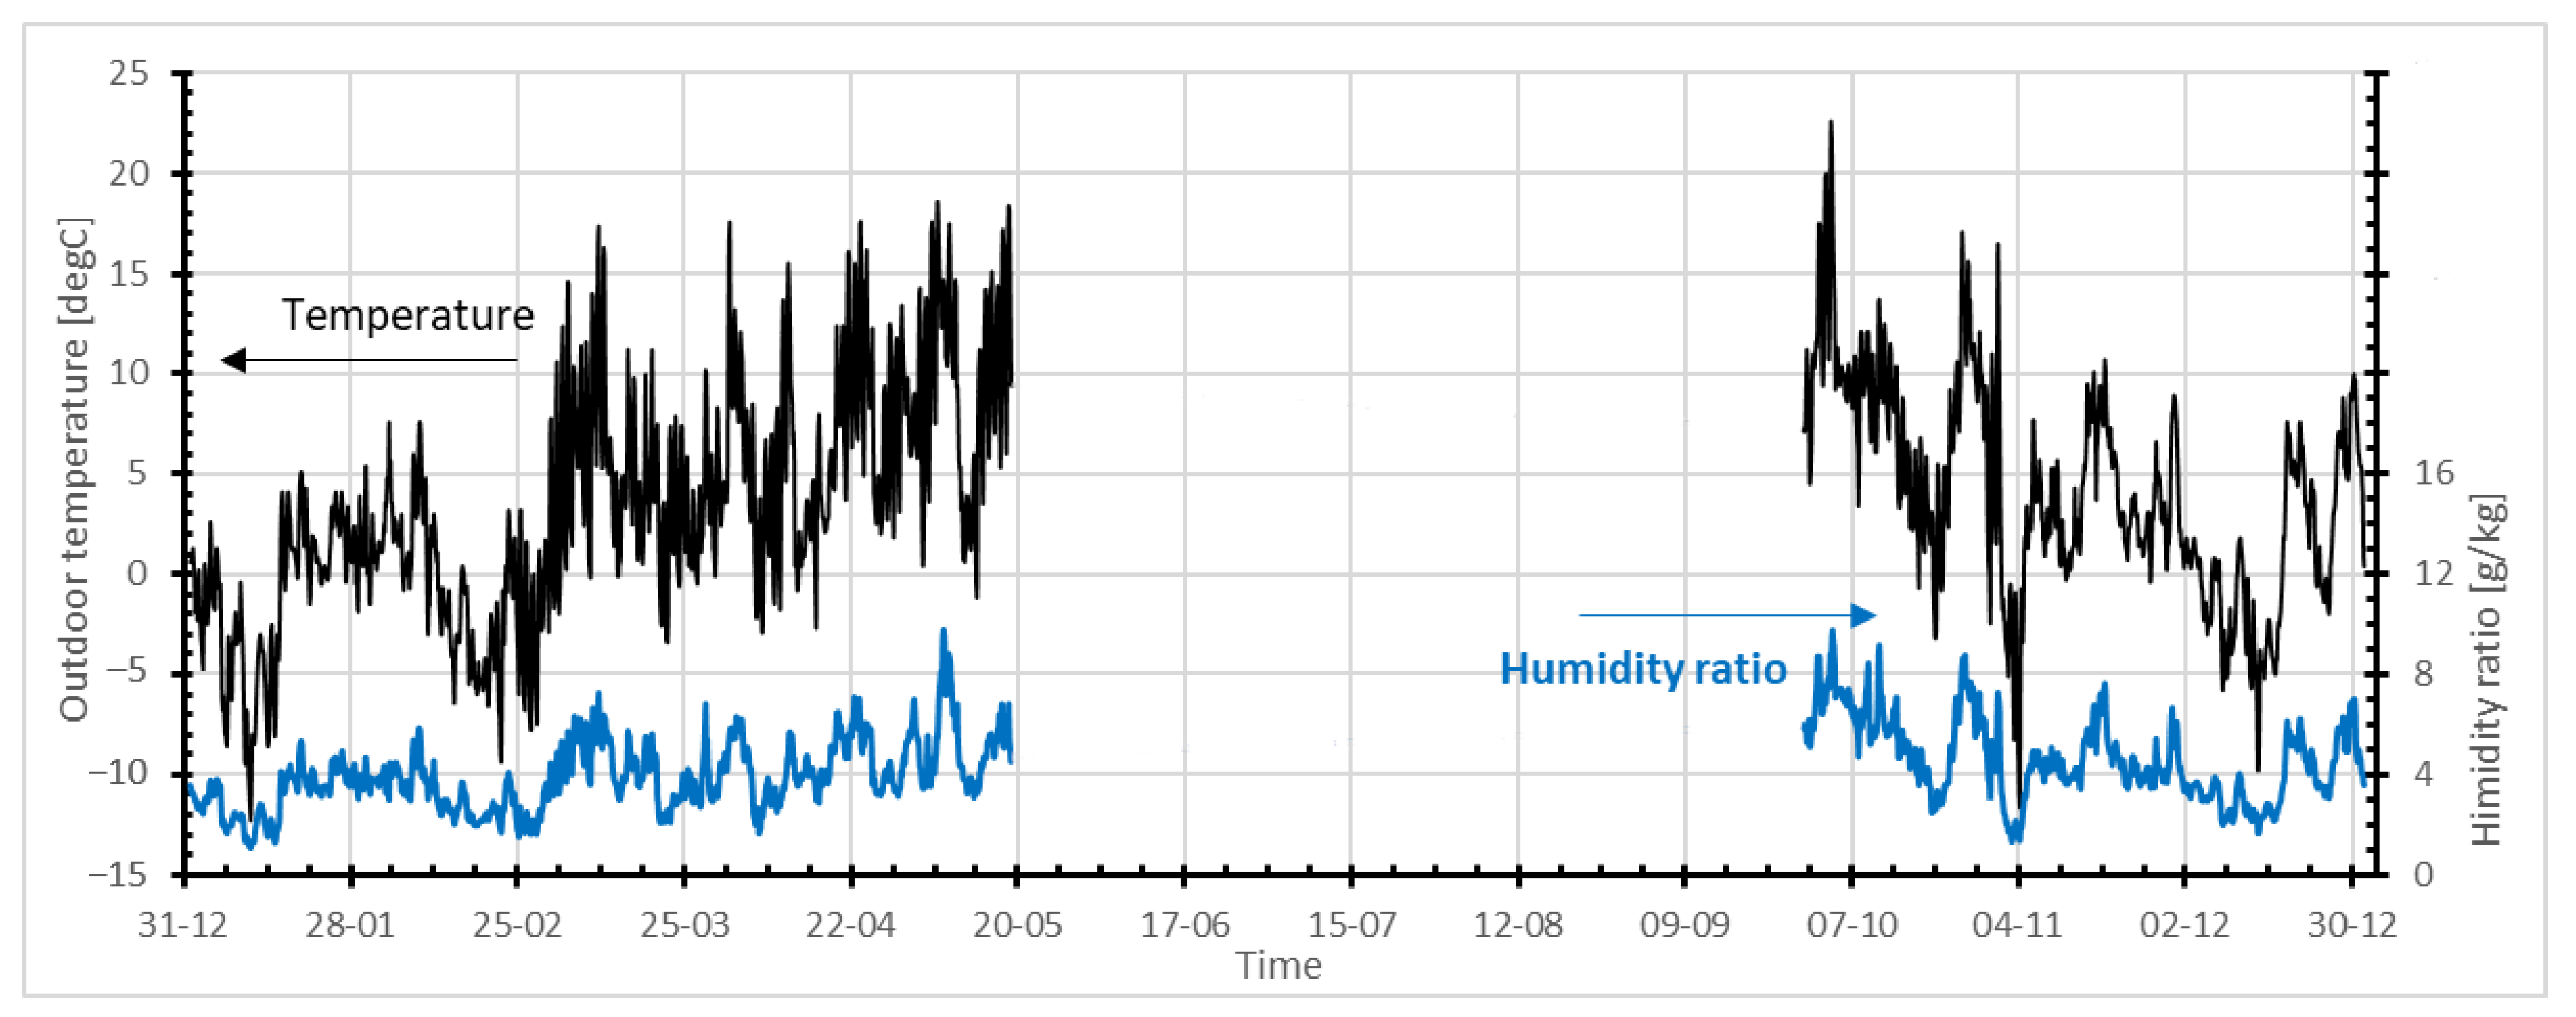
Option 1 is a reference passive stack ventilation, as described above.
Option 2 is passive stack ventilation equipped with humidity-sensitive trickle vents and exhaust grilles. As described earlier, indoor relative humidity affects the characteristics of these elements. Additionally, exhaust grills installed in bathrooms and toilets are equipped with occupancy sensors that open a control damper when users are in the space. The damper is subsequently controlled by humidity once the space has been empty for 20 min.
Option 3 comprises trickle vents and exhaust grilles with identical characteristics to Option 2, but with exhaust fans mounted on the roof above the individual exhaust ducts supporting airflows induced by natural forces when needed. They are equipped with pressure sensors that control fan speed.

3.4. Climatic Data

The virtual building was located in Warsaw, Poland. The vast majority of studies on humidity-driven DCV systems were performed in countries (France, Belgium, Netherlands) with temperate maritime climates, according to the definition of the European Environmental Agency (EEA), or Cfb, i.e., oceanic/marine west coast climates, according to the Köppen-Geiger climate classification system. This study was conducted in a temperate transitional climate (EEA classification). The Köppen-Geiger classification regards Warsaw as a town with warm summer continental or hemiboreal climate, or a Dfb climate. According to Eurostat, the average value of heating degree-days for Poland is 3315; France represents approximately 70% of that value, and Belgium and the Netherlands around 80%.
Having access to long-term metrological data, researchers can produce their own untypical meteorological years (UMY), i.e., variations in the Weather Year for Energy Calculations 2 (WYEC2) reference year calculated with nonstandard weighting indices. In such a situation, different weather parameters are more or less important during the selection of typical months [57]. It is possible to develop a specific UMY to model natural or hybrid ventilation systems. However, the need to compare results between studies encourages scientists to instead use measured meteorological data or standardized ISO or WYEC2 typical years. All analyses in the present study were performed using a typical meteorological year for Warsaw Airport Okęcie (52°10′ N; 020°58′ E), as published by the Polish Ministry of Infrastructure (https://archiwum.miir.gov.pl/media/51889/wmo123750iso.txt). This file complies with rules described in EN ISO 15927-4 [58]. According to this meteorological year, the ambient temperature in Warsaw ranged from −12 °C to +34 °C, while the spread of daily average temperatures was from −7 °C to +24 °C (Figure 3).
Calculations of the energy consumption of residential buildings are usually performed for the heating season. During summer, when buildings are not heated, ventilation is provided by opening windows, without any consequences for energy consumption. According to Polish tradition, the heating season lasts when the daily average temperature is below +12 °C. From the weather file used, the dates for the start and end of the heating season were 29 September and 18 May.

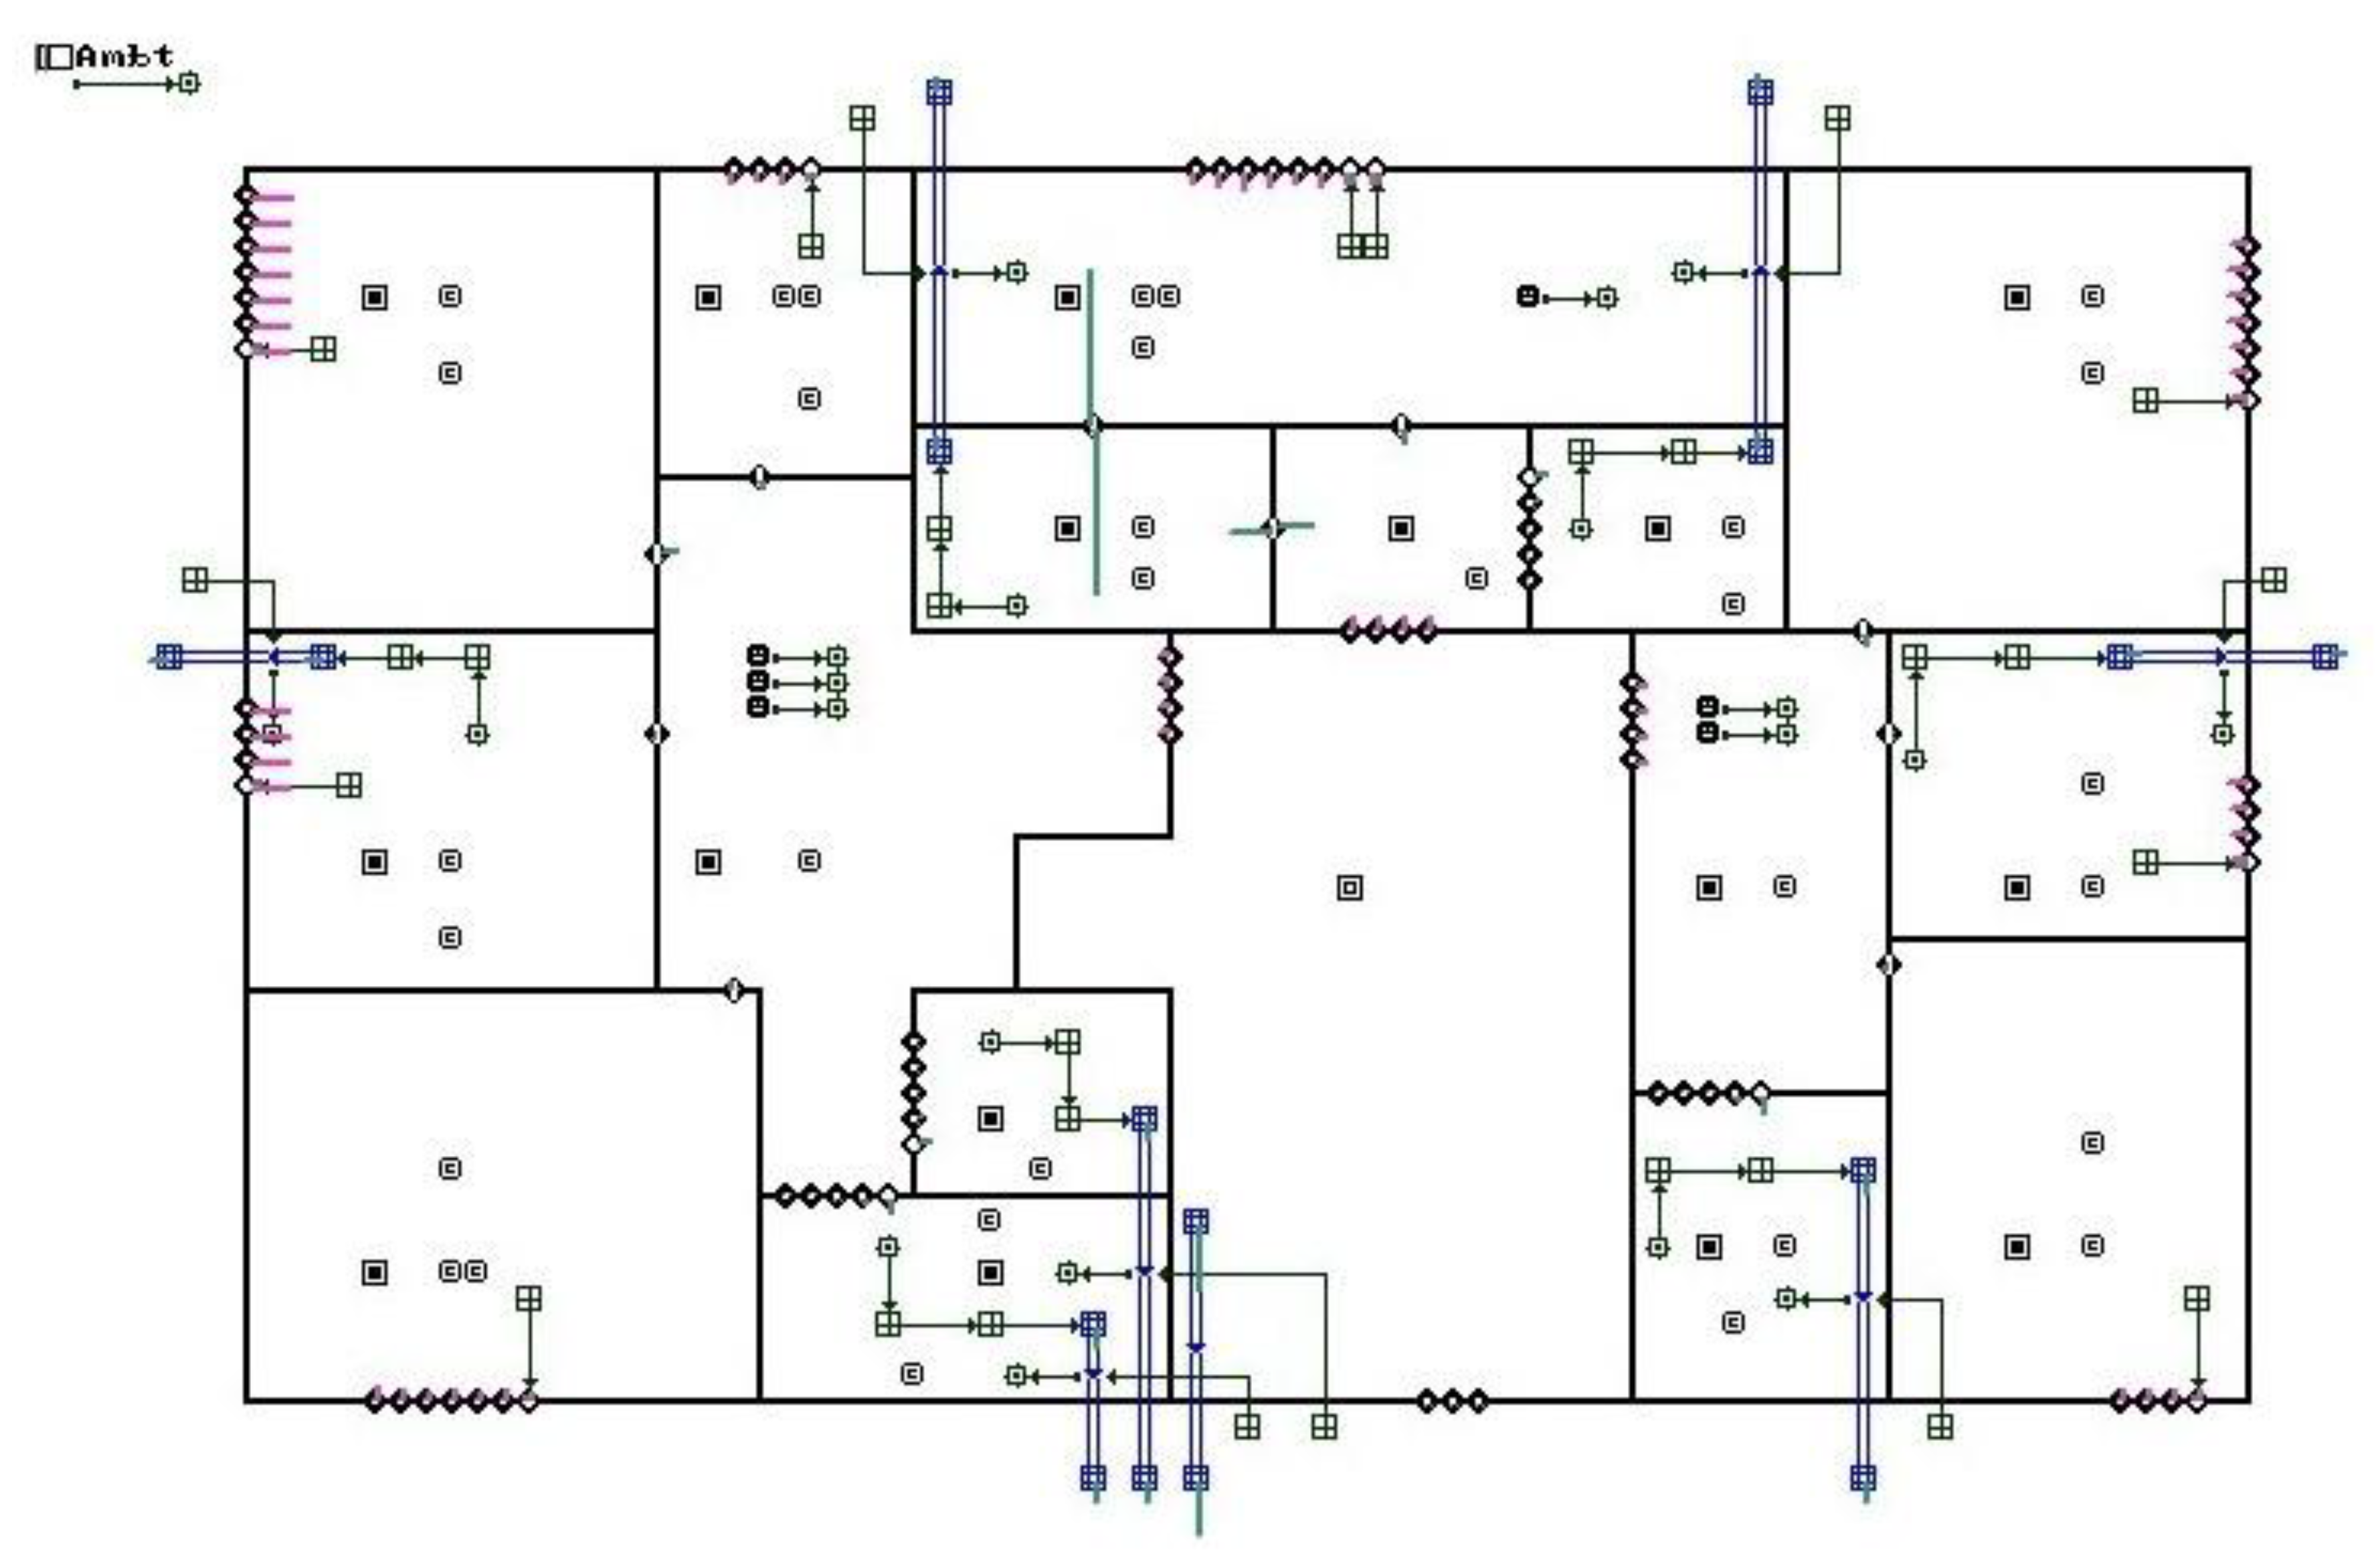
3.5. CONTAM Model of the Analyzed Building

The performance of the considered ventilation systems was analyzed using the CONTAM computer program. The building and ventilation system was modeled as 97 zones, 715 flow paths, 56 ducts, and 126 junctions/terminals. Additionally, in humidity-based, demand-controlled hybrid ventilation systems, the model incorporated control elements to connect relative humidity with air vents, exhaust grills, and exhaust fans characteristics. A real control network is more complicated than what can be presented on a sketchpad, as some nodes represent subnetworks. Figure 4 presents the sketchpad (CONTAM) of the eighth floor of the analyzed building for Option 3.
CONTAM describes most airflow elements using the empirical (power-law) equation. The volumetric flow rate, Q [m3/s], is proportional to the pressure drop, ΔP [Pa], across the opening raised to the nth power. Coefficients C and n, used in the modeling applied in this article, are presented in Table 1.
Q = C ( Δ P ) n ,
The CONTAM simulations used a 1-min time step, while the results were stored with a 15-min time step. The effect of moisture buffering was modeled based upon boundary layer diffusion elements.

4. Results and Discussion

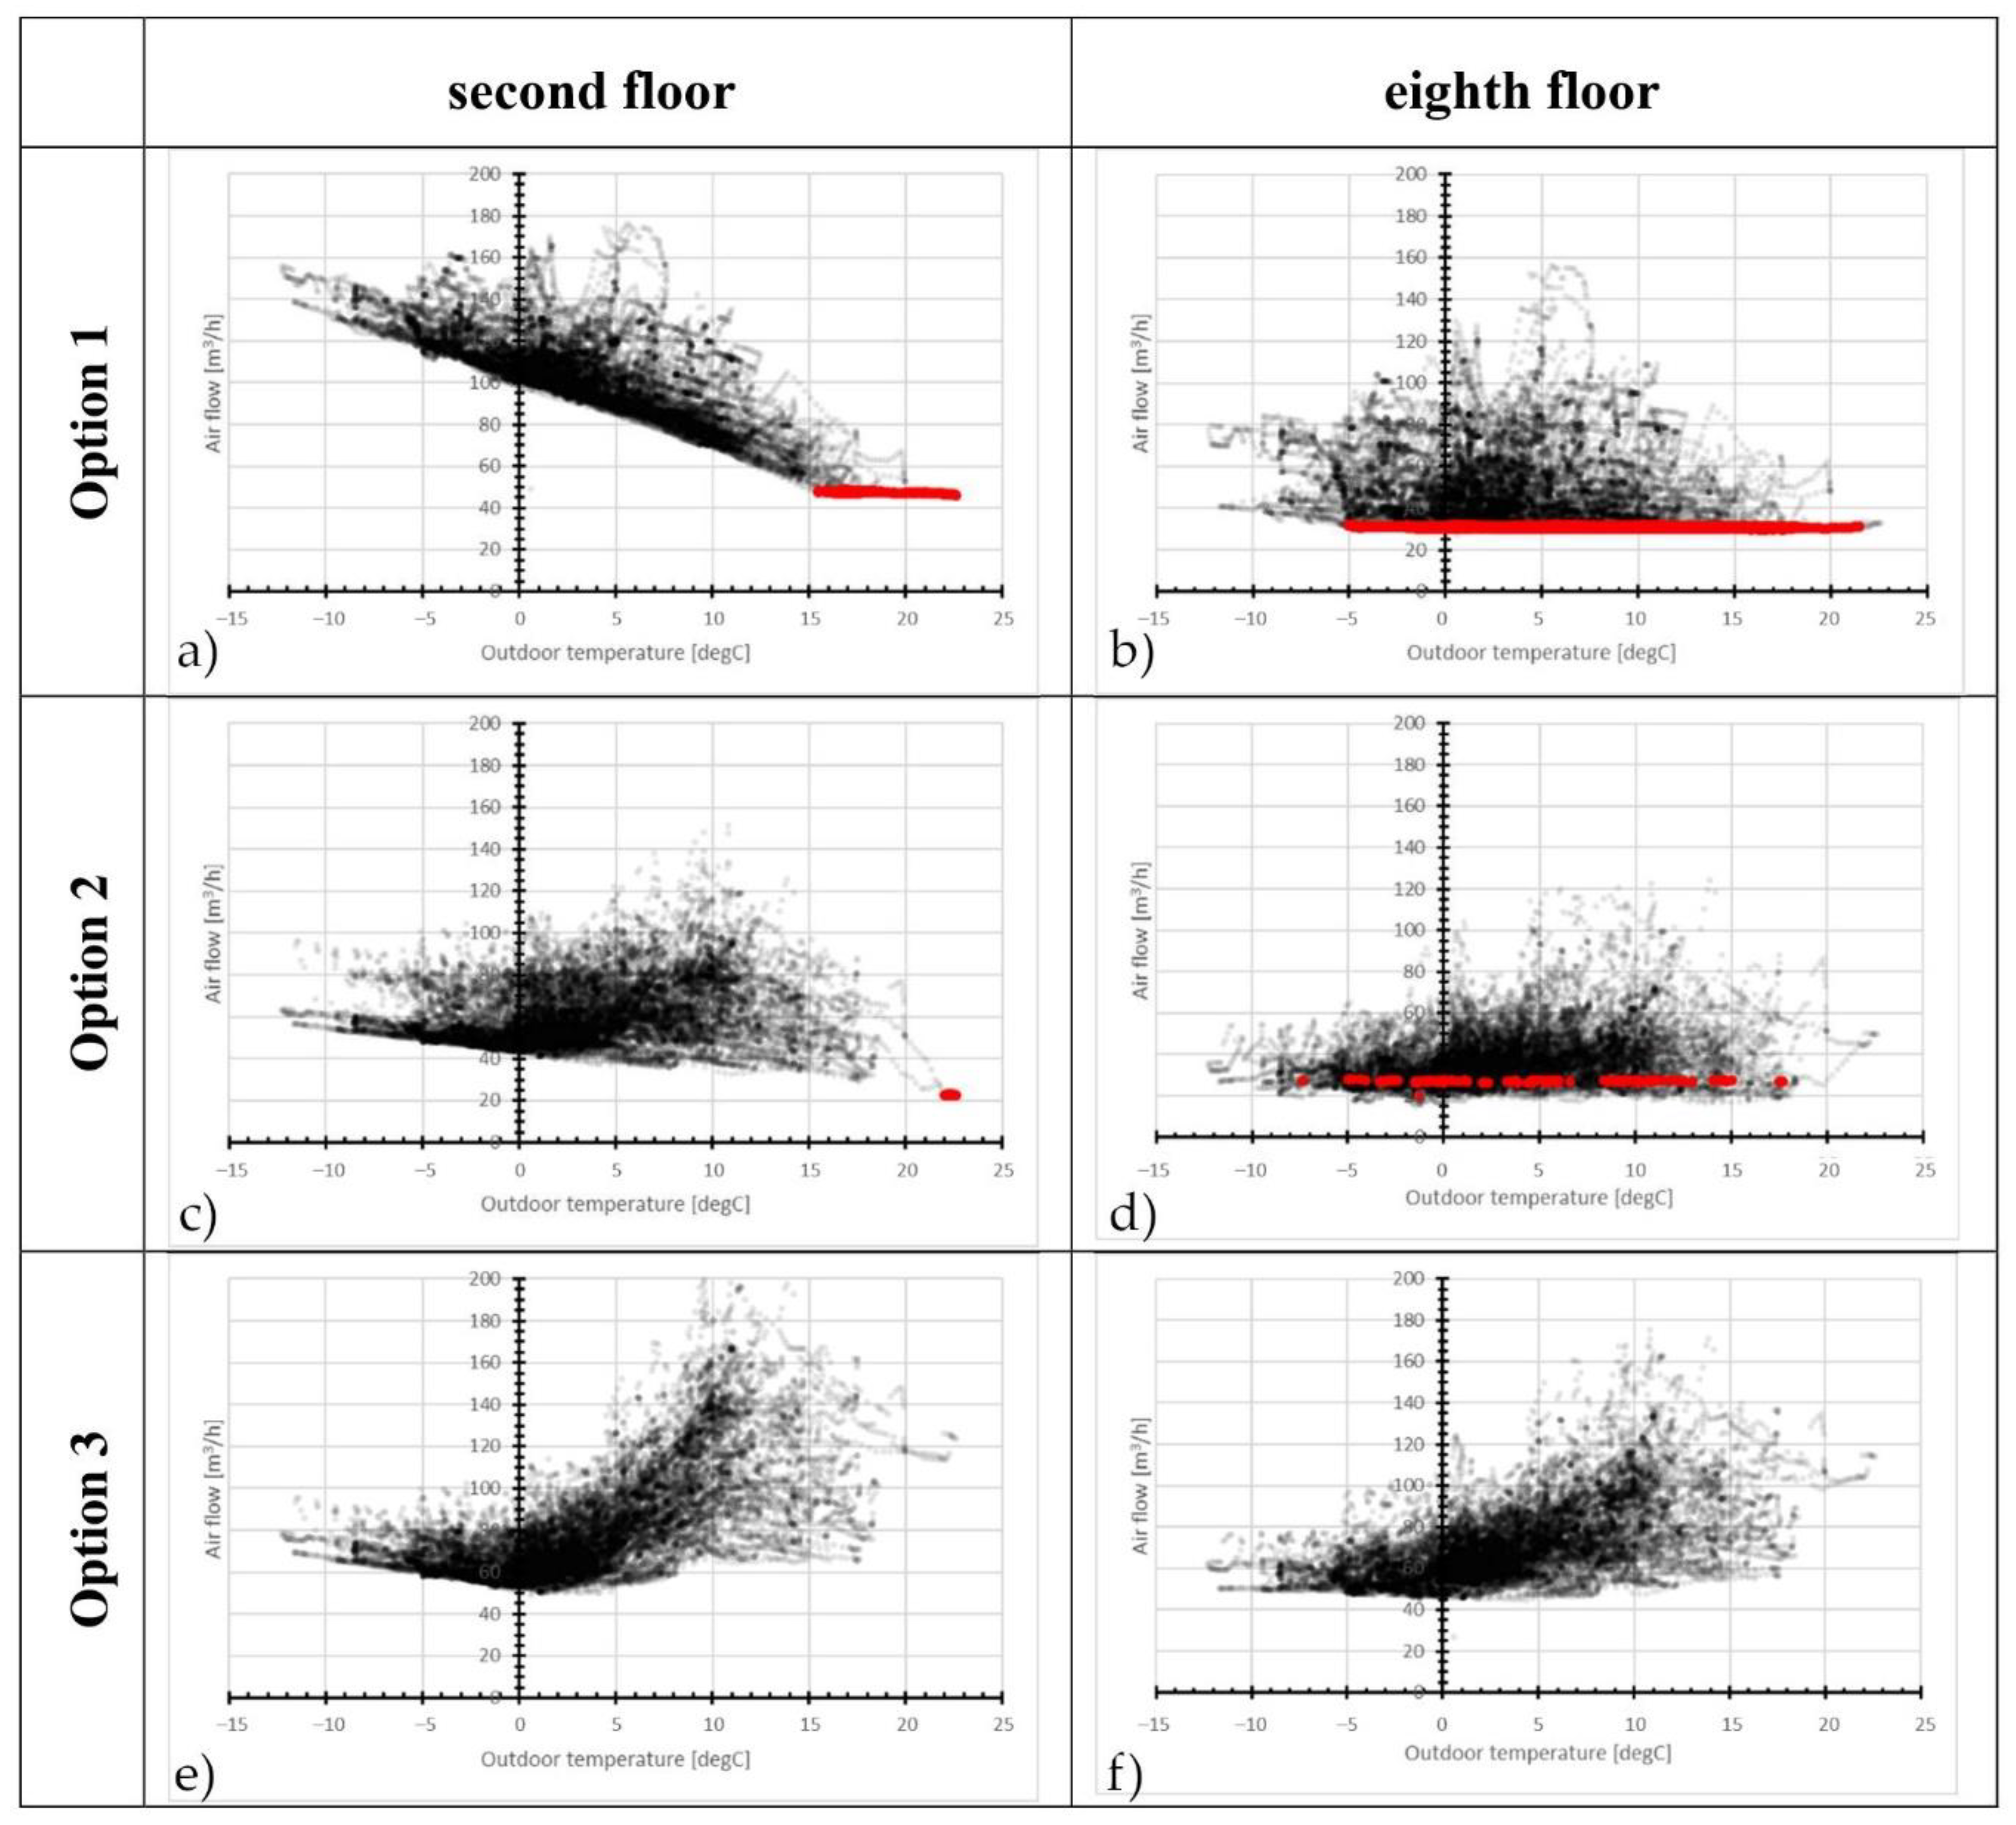
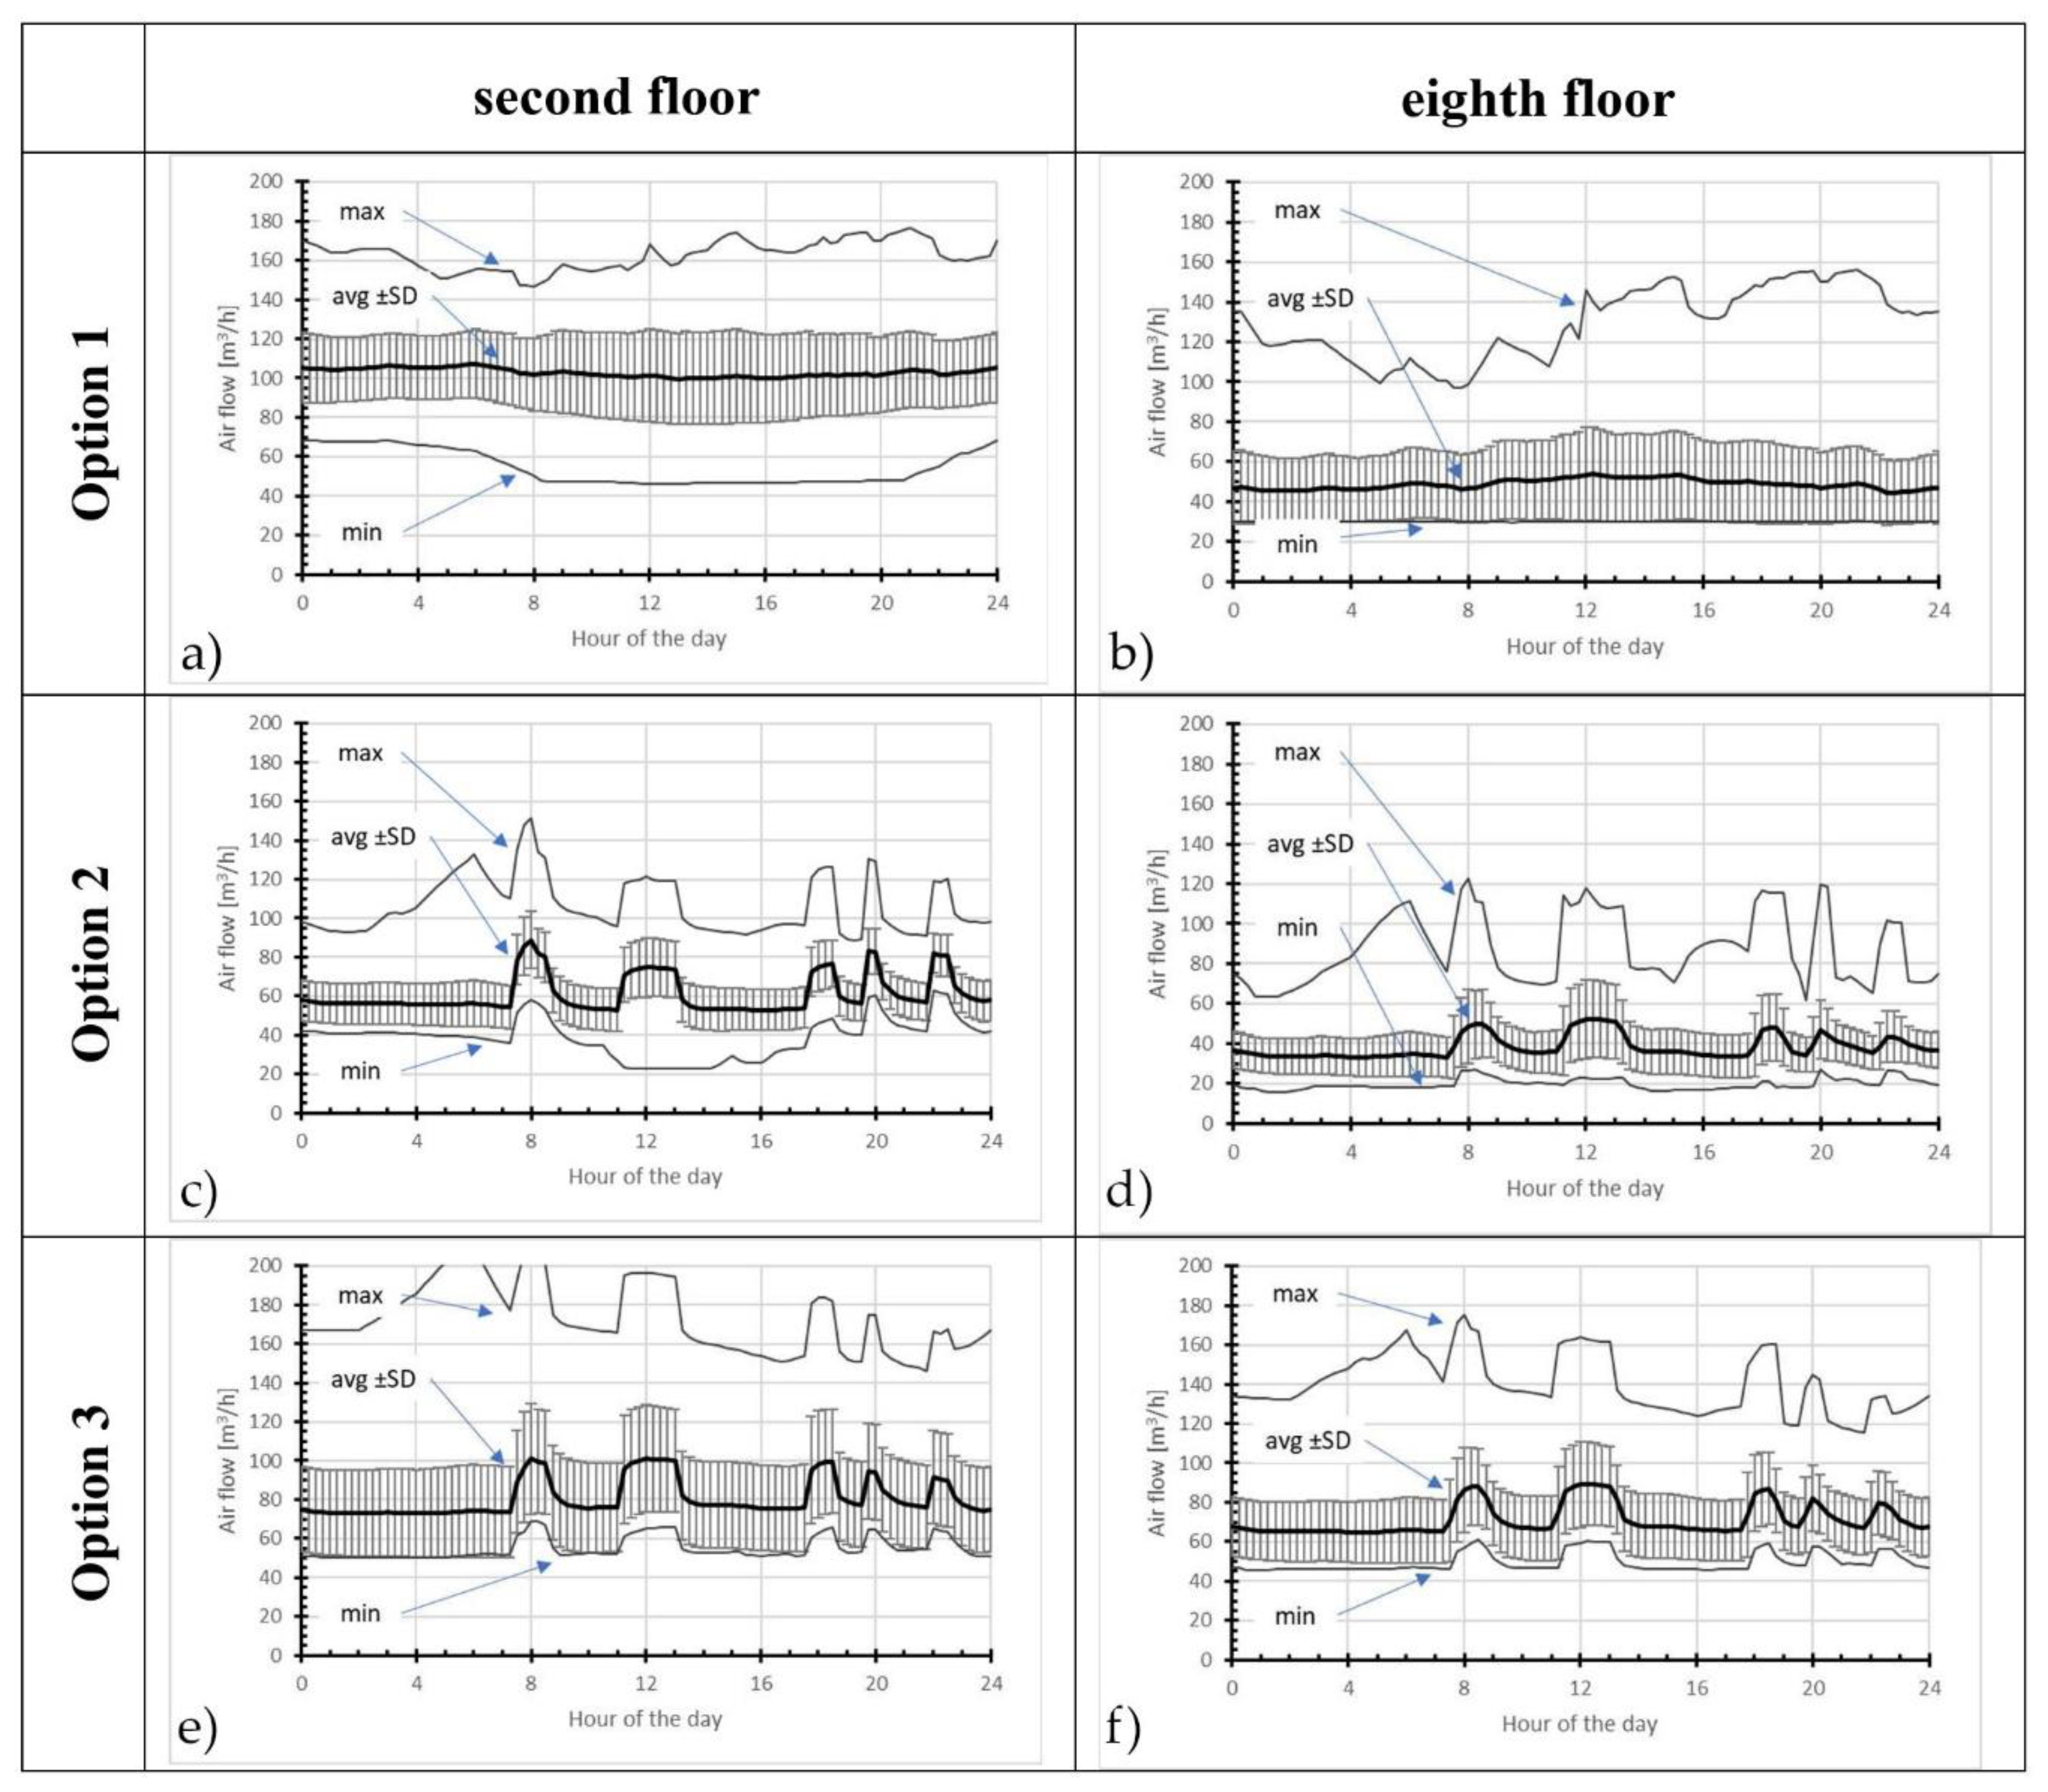
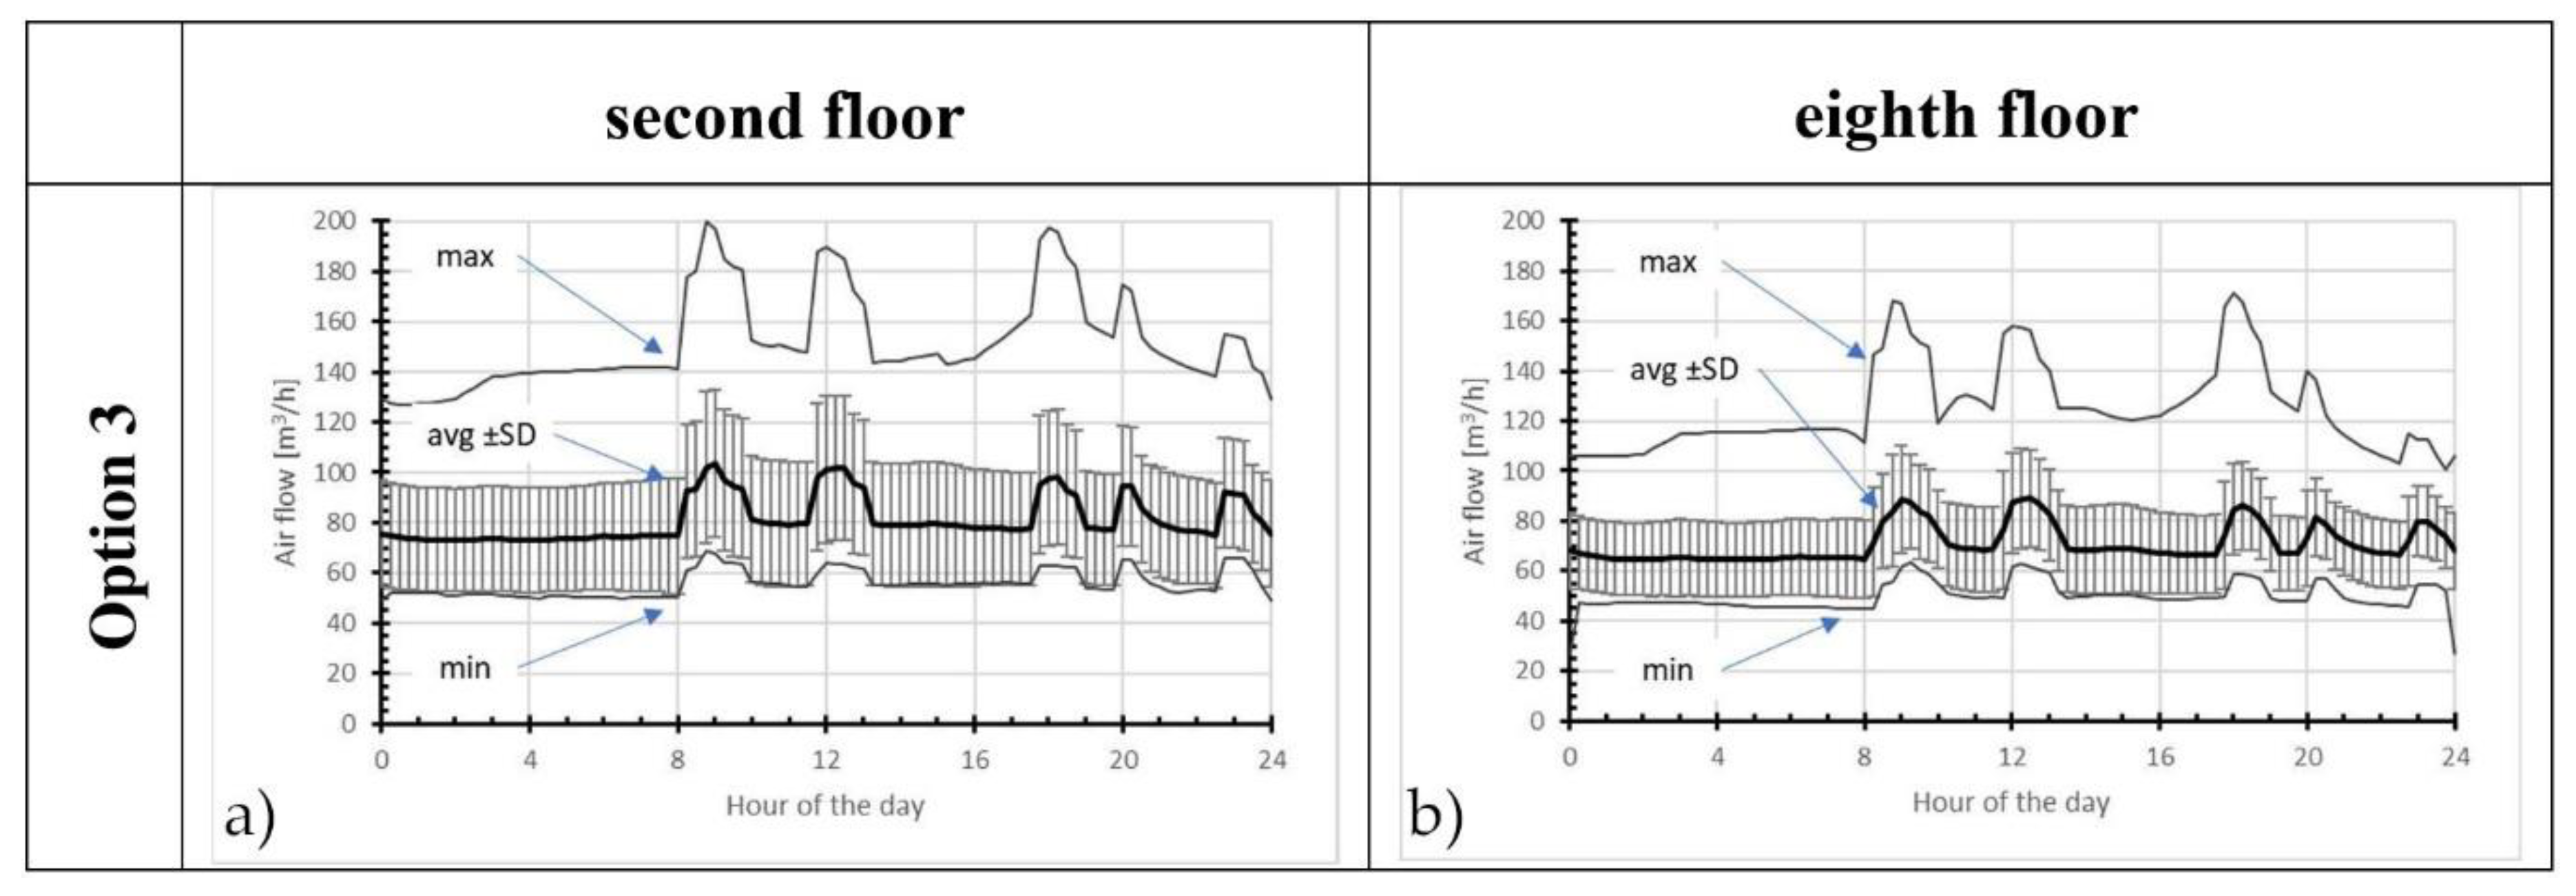
4.1. Airflow Simulations

Detailed simulations during the heating season provided a massive set of results with which to compare the behavior of the analyzed ventilation systems for the whole building and for units located on different floors. Fundamental differences were observed between ventilation options and floors. For a given option and floor, the differences in ventilation performance between M1, M2, and M3 units were tiny. Therefore, the present discussion will concentrate on the most significant M3 unit. As the layouts of the units on the ground floor differed slightly from those on higher floors, detailed comparisons will be presented for units located on the second and eighth floors. The energy and air quality analysis presented in the following subsections also contains results for the whole building, taking into consideration all 23 units.
The relationship between the air flow rate and the outdoor temperature for the considered ventilation options is presented in Figure 5. The most significant difference between the second and eighth floors can be observed for passive stack ventilation. Second-floor performance was strongly dependent on temperature, and for very low temperatures (<−3 °C), exceeded the requirements of the Polish ventilation standards. On the eight-floor, airflows were much lower, and the impact of outdoor air temperature could be observed for very low outdoor temperatures (<−5 °C). Moreover, quite often, reverse flows in ventilation ducts were observed (red dots in Figure 5). Air supply to the toilet or kitchen would disperse odors in the whole unit. Due to the small pressure values caused by thermal buoyancy, the effect caused by wind was greater than for the unit located on the second floor. Occasional reverse airflows were also observed on the second floor, but only for outdoor air temperatures higher than 15 °C.
For Option 2, air flows were smaller than for Option 1, and never reached the required 130 m3/h. The differences between the second and eighth floors were significantly lower. The dependence of air flows on outdoor temperature was hardly noticeable, even on the second floor. As warmer outdoor air has a higher moisture content than cold air, humidity-sensitive trickle vents and exhaust grilles remained open, increasing airflow rates.
For Option 3, the air flow on the second floor was slightly higher than on the eight floor. An increase of airflow in a period of mild weather was observed, and the required 130 m3/h was reached quite often. Reverse airflows did not occur.
Figure 6 presents the airflows through unit M3 observed during workdays. For Option 1, the average air flows did not depend on the time of day. The average value for the second floor (approximately 110 m3/h) was only slightly lower than the required 130 m3/h. On the eighth floor, the average air flows were only 50 m3/h (38% of the requirement). The plotted lines showing average values +/− standard deviation and the maximum values indicated considerable variation in the intensity of ventilation depending on the weather.
In Options 2 and 3, there were periodic changes in the intensity of the ventilation, following the assumed time variation of moisture gains. The average values of the airflows observed in Option 2 were much lower than those in Option 1. The hybrid mode system (option 3) increased the average airflow in comparison with Option 2, but decreased it compared to Option 1. Moreover, differences in ventilation performance between the second and the eighth floors decreased.
For the ventilation systems which were sensitive to humidity (i.e., Options 2 and 3), airflows through the units were slightly different for workdays and weekends; this was due to the different shapes of moisture emissions. Figure 7 presents the variability of daily airflows observed in unit M3 during weekends for hybrid ventilation (Option 3).
Figure 8 presents histograms of relative humidity that is a control signal affecting ventilation performance in options 2 and 3. The graphs contain data simulated for halls that correspond to “spatially averaged” humidity. Distributions of relative humidity for three options for unit M3 on the second floor are very similar. Simulated values lie between 20% and 60%, with the most common values below 40%.
As the unit M3 located on the eighth floor was less intensively ventilated, the simulated relative humidity was higher. For passive stack ventilation (option 1), the frequency of occurrence of relative humidity >50% was much higher than in the unit on the second floor. The maximum values of relative humidity exceeded 70%.
The application of humidity-sensitive trickle vents and exhaust grilles reduced the differences between the second and the eighth floors. For hybrid mode (option 3), relative humidity histograms for the second and the eighth floors were very similar.

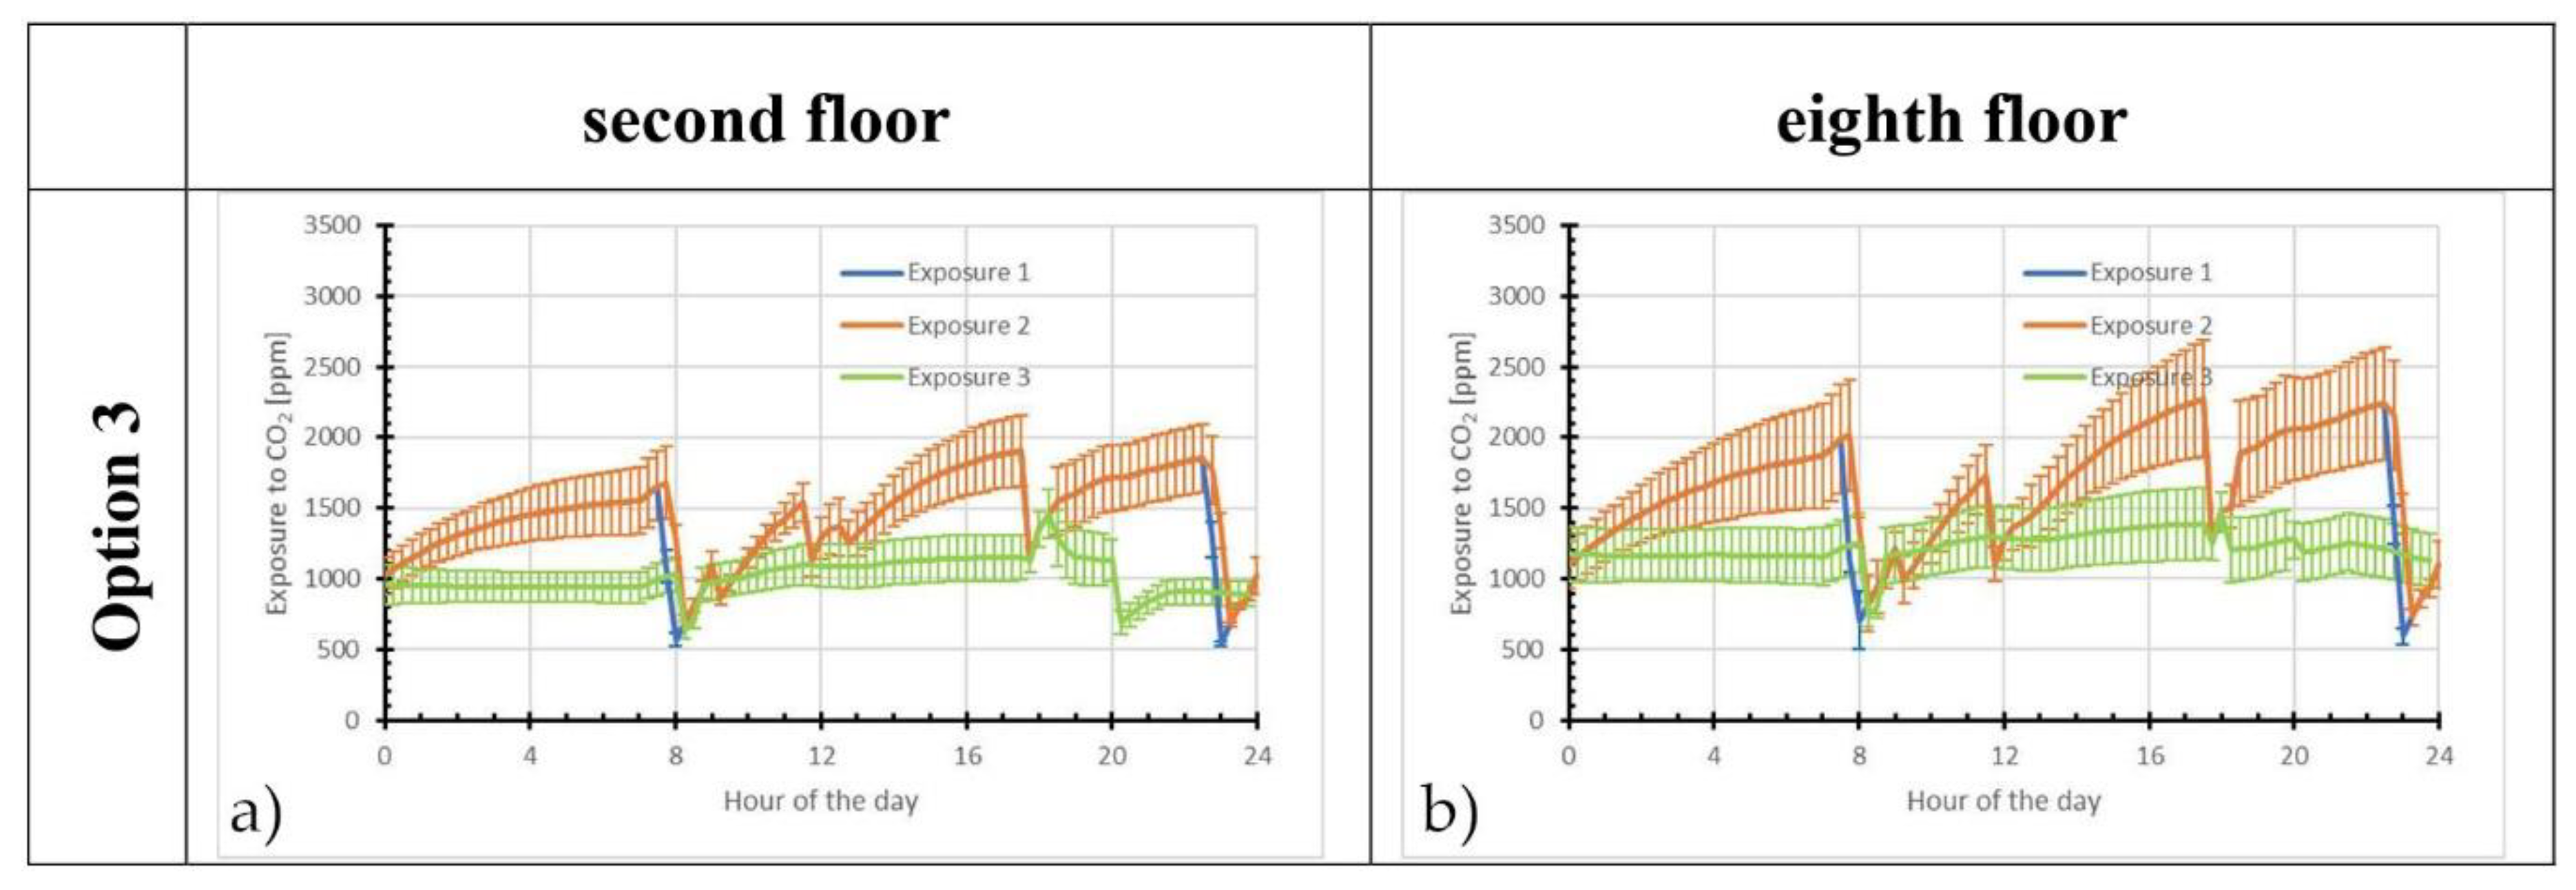
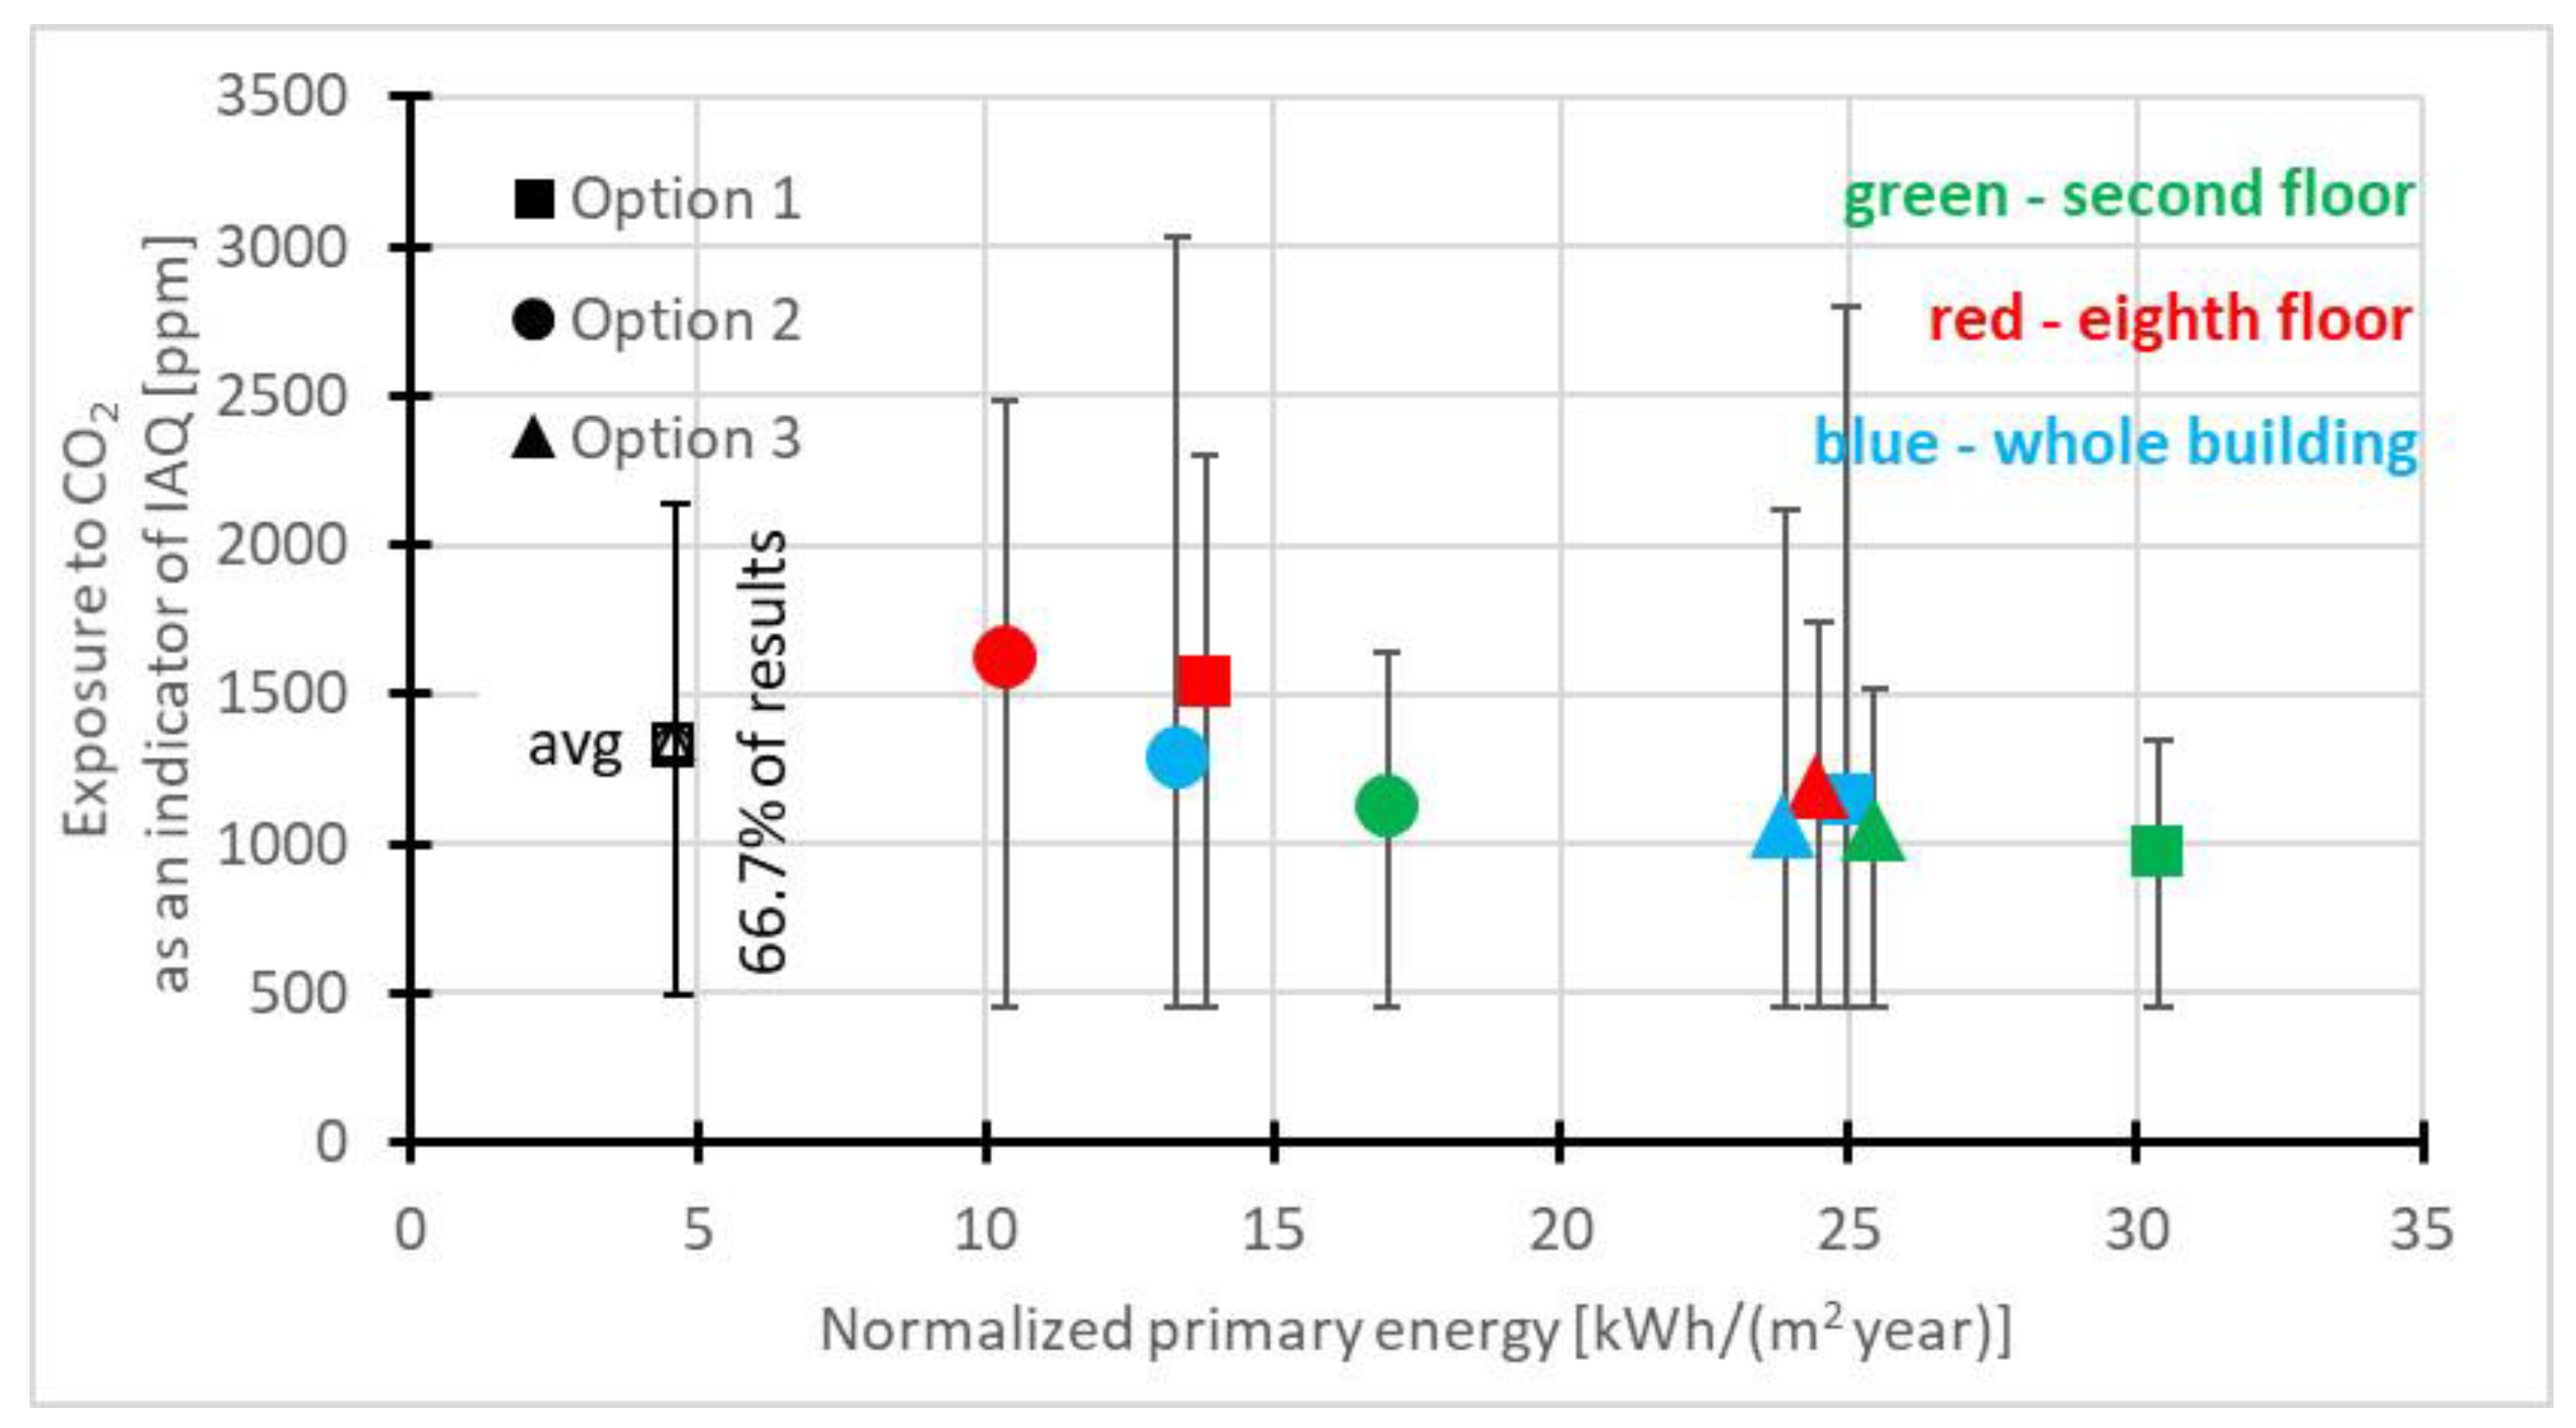
4.2. Indoor Air Quality Analysis

CONTAM allows users to simulate the presence of occupants within a building. It is possible to simulate occupant movements throughout the building and to determine each occupant’s contaminant exposure by integrating the contaminant concentrations to which the occupant is exposed [39]. Carbon dioxide is commonly used as a simplified indicator of IAQ. Unfortunately, this often done without fully taking into account the links between indoor CO2 and ventilation [59]. Nevertheless, this method was adopted in the present study. Figure 9 compares daily fluctuations of CO2 concentrations on workdays in units M3 located on the second and the eighth floor for three considered ventilation systems.
Due to the more stable work of ventilation, the variability of the exposure is smaller for unit M3 on the second floor. The identical time pattern of using the apartment on the eighth floor leads to much higher exposure to CO2. It is caused by the worse performance of ventilation (regardless of the analyzed option). Figure 10 shows the analogous weekend CO2 concentration for hybrid ventilation.
Average CO2 concentrations for three ventilation systems applied in the NAPE reference building are compared in the Table 2. The average CO2 level in the entire building for the reference variant was 1146 ppm, while in unit M3 on the second and the eighth floors, it was 974 ppm and 1540 ppm, respectively. These values indicated quite large differences in the performance of passive stack ventilation on floors two and eight.
The introduction of humidity sensitive air trickle vents and exhaust grilles led to an increase in CO2 levels. In the entire building, the average CO2 level was 15.5% higher. For units M3, located on the second and eighth floors, the increase was 15.71% and 5.39%, respectively. In unit M3 located on the eighth floor, the average CO2 concentration was 1623 ppm, which could be considered unacceptable for approximately 30% of the occupants of the unit.
The use of humidity-sensitive, hybrid ventilation would mean that the average exposure values for the M3 apartment on both floors and the entire building would be similar. The M3 apartment on the eighth floor would still have a slightly higher concentration of CO2 than its counterpart on the second floor, but the difference would be the smallest among the options considered.

4.3. Energy Consumption Related to Ventilation

In simple ventilation systems used in residential buildings, energy is used to heat the cold air supplied to the rooms and to induce forced using fans. In the analyzed humidity-sensitive, demand-controlled ventilation systems, it is impossible to recover heat from the exhaust air to heat the supplied air, which means that energy consumption is quite significant.
When analyzing primary energy, it is essential to consider the source of the energy. The NAPE reference building is supplied with heat from the municipal heating network (heat is produced in cogeneration), and is connected to the national power grid. Poland’s primary energy factor for district heat produced by cogeneration from hard coal or natural gas is 0.8, while electricity supplied by the national electricity network is multiplied by 3.0. Table 3 presents the differences in the energy demands of the analyzed optional ventilation system.
The introduction of humidity-sensitive air inlets and air exhaust grilles reduces the difference in ventilation operation on individual floors. However, a periodic increase in ventilation intensity caused by high levels of moisture emissions can be observed. Desirable limitations of airflow in winter are observed on the lowest floors. The airflow increases slightly during transitional periods. Consequently, the energy needed to heat the ventilation air is reduced by as much as 47%. The level of exposure of residents to CO2 is higher than in Option 1, which means that reducing energy consumption is accompanied by reduced air quality.
Replacing the natural ventilation system with hybrid ventilation by introducing roof fans supporting airflow reduces the ventilation operation differences on individual floors. The average value of the air stream is higher than in Option 2, but still lower than required. One benefit of the use of hybrid ventilation is the improvement of indoor air quality; average CO2 concentrations in the entire building are approximately 600–650 ppm above outside air concentrations. The energy needed to heat the ventilation air is 21% lower than in the ineffective reference system. However, this necessitates the consumption of additional electricity to drive the fans. For the entire building, the consumption is 2245 kWh/year (1.37 kWh/(m2 year)). If electricity from the national energy grid is used, this corresponds to 6735 kWh/year of primary energy (4.11 kWh/(m2 year)). However, in the case of local energy production from renewable sources, this energy could be neglected in the balance.

5. Conclusions

The performance of the reference passive stack ventilation in multifamily, medium-high buildings in a continental climate Dfb was shown to be highly unsatisfactory. In winter, the apartments on the lowest floor were excessively ventilated, which led increased energy consumption to heat the ventilation air. At the same time, the apartments on the top floors were not adequately ventilated. The ventilation airflows were small, and often, reverse airflows in the ventilation ducts were observed. As a result of differences in the intensity of the ventilation in individual units, the exposure of residents to CO2, an indicator of air quality, varied significantly. Therefore, in Polish conditions, any system worth recommending has to overcome these obstacles and provide energy savings at the same time.
The obtained results indicated that the application of humidity sensitive, demand-controlled ventilation using just natural driving forces significantly reduced energy consumption in residential buildings, but that the air quality was even worse.
The application of humidity-sensitive hybrid ventilation caused energy demand, air flows, and air quality to be almost equal in all units. The system responded positively regarding almost all of the parameters assessed in this article. Unfortunately, the energy used by supplementary fans can reduce gains from lower heat ventilation loss.
The final energetic effect depended strongly on the electricity source. In cases using the national energy grid, the energy savings compared with the reference passive stack system would be relatively low, i.e., 1.07 kWh/m2. However, the utilization of locally produced, renewable energy could increase these savings to 5.18 kWh/m2.
Figure 11 summarizes the results, presenting a comparison of exposure to CO2 concentrations vs. normalized primary energy.

Author Contributions

Conceptualization, J.S. and M.M.; Funding acquisition, J.S.; Investigation, J.S. and M.M.; Methodology, J.S. and M.M.; Software, M.M.; Visualization, M.M.; Writing—original draft, J.S.; Writing—review & editing, J.S. and M.M. All authors have read and agreed to the published version of the manuscript.

Funding

This paper was co-financed under the research grant of the Warsaw University of Technology supporting the scientific activity in the discipline of Environmental Engineering, Mining and Energy.

Conflicts of Interest

The authors declare no conflict of interest.

References

  1. EU Buildings Factsheets. Available online: https://ec.europa.eu/energy/eu-buildings-factsheets_en (accessed on 30 November 2020).
  2. Housing in Singapore. Available online: https://www.teoalida.com/world/singapore/ (accessed on 30 November 2020).
  3. Evolution of Housing in Canada, 1957 to 2014. Available online: https://www150.statcan.gc.ca/n1/pub/11-630-x/11-630-x2015007-eng.htm (accessed on 30 November 2020).
  4. Andargie, M.S.; Touchie, M.; O’Brien, W. A review of factors affecting occupant comfort in multi-unit residential buildings. Build. Environ. 2019, 160, 106182. [Google Scholar] [CrossRef]
  5. Allard, F.; Ghiaus, C. Natural ventilation in the urban environment. In Building Ventilation: The State of the Art; Santamouris, M., Wouters, P., Eds.; Earthscan: London, UK; Sterling, VA, USA, 2006; pp. 1–35. [Google Scholar]
  6. Borsboom, W.; De Gids, W.; Logue, J.; Sherman, M.; Wargocki, P. Residential Ventilation and Health; AIVC Technical Note 68; INIVE EEIG: Brussels, Belgium, 2016. [Google Scholar]
  7. Guyot, G.; Sherman, M.H.; Walker, I.S. Smart ventilation energy and indoor air quality performance in residential buildings: A review. Energy Build. 2018, 165, 416–430. [Google Scholar] [CrossRef] [Green Version]
  8. Dorer, V.; Pfeiffer, A.; Weber, A. Parameters for the Design of Demand Controlled Hybrid Ventilation Systems for Residential Buildings; AIVC Technical Note 59; INIVE EEIG: Brussels, Belgium, 2005. [Google Scholar]
  9. Biler, A.; Unlu Tavil, A.; Su, Y.; Khan, N. A review of performance specifications and studies of trickle vents. Buildings 2018, 8, 152. [Google Scholar] [CrossRef] [Green Version]
  10. Mijakowski, M.; Sowa, J. An attempt to improve indoor environment by installing humidity-sensitive air inlets in a naturally ventilated kindergarten building. Build. Environ. 2017, 111, 180–191. [Google Scholar] [CrossRef]
  11. Fisk, W.J.; De Almeida, A.T. Sensor-based demand-controlled ventilation: A review. Energy Build. 1998, 29, 35–45. [Google Scholar] [CrossRef] [Green Version]
  12. Ouf, M.M.; O’Brien, W.; Gunay, B. On quantifying building performance adaptability to variable occupancy. Build. Environ. 2019, 155, 257–267. [Google Scholar] [CrossRef]
  13. WHO. WHO Guidelines for Indoor Air Quality: Dampness and Mould; Heseltine, E., Rosen, J., Eds.; WHO Regional Office Europe: Copenhagen, Denmark, 2009. [Google Scholar]
  14. Awbi, H. Energy efficient ventilation for retrofit buildings. In Proceedings of the 48th AiCARR International Conference on Energy Performance of Existing Buildings, Baveno-Lago Maggiore, Italy, 22–23 September 2011. [Google Scholar]
  15. Woloszyn, M.; Kalamees, T.; Abadie, M.O.; Steeman, M.; Kalagasidis, A.S. The effect of combining a relative-humidity-sensitive ventilation system with the moisture-buffering capacity of materials on indoor climate and energy efficiency of buildings. Build. Environ. 2009, 44, 515–524. [Google Scholar] [CrossRef]
  16. Savin, J.L.; Berthin, S.; Jardinier, M. Assessment of improvements brought by humidity sensitive and hybrid ventilation/HR-Vent project. In Proceedings of the 26th AIVC Conference, Ventilation in Relation to the Energy Performance of Buildings, Brussels, Belgium, 21–23 September 2005; pp. 157–167. [Google Scholar]
  17. Savin, J.L.; Berthin, S.; Jardinier, M. Demand-controlled ventilation. 20 years of in-situ monitoring in the residential field. In Proceedings of the 35th AIVC Conference “Ventilation and airtightness in transforming the building stock to high performance”, Poznań, Poland, 24–25 September 2014. [Google Scholar]
  18. Guyot, G. Lessons learned from a ten-year monitoring in residential buildings equipped with humidity based demand controlled ventilation in France. In Proceedings of the 40th AIVC—8th TightVent—6th venticool Conference: “From Energy Crisis to Sustainable Indoor Climate—40 Years of AIVC”, Ghent, Belgium, 15–16 October 2019. [Google Scholar]
  19. Berthin, S.; Savin, J.L.; Jardinier, M. Measurements on humidity controlled ventilation systems in 55 occupied apartments. In Proceedings of the IEA ANNEX 41 Meeting, Florianópolis, Brazil, 2–4 April 2007. [Google Scholar]
  20. Guyot, G.; Melois, A.; Bernard, A.M.; Coeudevez, C.S.; Déoux, S.; Berlin, S.; Parent, E.; Huet, A.; Berthault, S.; Jobert, R.; et al. Ventilation performance and indoor air pollutants diagnosis in 21 French low energy homes. Int. J. Vent. 2018, 17, 187–195. [Google Scholar] [CrossRef] [Green Version]
  21. Kwiatkowski, J.; Woloszyn, M.; Roux, J.J. Modelling of hysteresis influence on mass transfer in building materials. Build. Environ. 2009, 44, 633–642. [Google Scholar] [CrossRef]
  22. Mijakowski, M.; Kwiatkowski, J. Moisture flow between indoor air and porous materials—simplified two parameters method and detailed TRNSYS simulation. In Proceedings of the 1st Central European Symposium on Building Physics, Cracow, Poland, 13–15 September 2010; Gawin, D., Kisilewicz, T., Eds.; Technical University of Lodz, Faculty of Civil Engineering, Architecture and Environmental Engineering: Lodz, Poland, 2010; pp. 395–400. [Google Scholar]
  23. Sowa, J. Man as a stochastic factor in indoor air quality predictions. Indoor Environ. 1994, 3, 119–122. [Google Scholar]
  24. Sowa, J. Comparison of methods of including stochastic factors into deterministic models of indoor air quality. Energy Build. 1998, 27, 301–308. [Google Scholar] [CrossRef]
  25. Van Den Bossche, N.; Janssens, A.; Heymans, N.; Wouters, P. Performance Evaluation of Humidity Controlled Ventilation Strategies in Residential Buildings. 2007; ISBN 978-1-933742-28-1. Available online: https://webcache.googleusercontent.com/search?q=cache:RrzNMMkvZ58J:https://web.ornl.gov/sci/buildings/conf-archive/2007%2520B10%2520papers/195_Bossche.pdf+&cd=1&hl=en&ct=clnk&gl=hk (accessed on 10 December 2020).
  26. Laverge, J.; Van Den Bossche, N.; Heijmans, N.; Janssens, A. Energy saving potential and repercussions on indoor air quality of demand controlled residential ventilation strategies. Build. Environ. 2011, 46, 1497–1503. [Google Scholar] [CrossRef] [Green Version]
  27. Heiselberg, P. Natural ventilation design. International journal of ventilation. Int. J. Vent. 2004, 2, 295–312. [Google Scholar]
  28. Op’t Veld, P. Introduction to EC RESHYVENT–EU cluster project on demand controlled hybrid ventilation for residential buildings. Build. Environ. 2008, 43, 1342–1349. [Google Scholar] [CrossRef]
  29. Antvorskov, S. Introduction to integration of renewable energy in demand controlled hybrid ventilation systems for residential buildings. Build. Environ. 2008, 43, 1350–1353. [Google Scholar] [CrossRef]
  30. Yang, D.; Li, P. Dimensionless design approach, applicability and energy performance of stack-based hybrid ventilation for multi-story buildings. Energy 2015, 93, 128–140. [Google Scholar] [CrossRef]
  31. Jeong, Y.; Haghighat, F. Modelling of a Hybrid-Ventilated Building–Using ESP-r. Int. J. Vent. 2002, 1, 127–139. [Google Scholar] [CrossRef]
  32. Zhai, Z.J.; Johnson, M.H.; Krarti, M. Assessment of natural and hybrid ventilation models in whole-building energy simulations. Energy Build. 2011, 43, 2251–2261. [Google Scholar] [CrossRef]
  33. Chenari, B.; Lamas, F.; Gaspar, A.; da Silva, M. Simulation of occupancy and CO2-based demand-controlled mechanical ventilation strategies in an office room using EnergyPlus. Energy Procedia 2017, 113, 51–57. [Google Scholar] [CrossRef]
  34. O’Neill, Z.; Li, Y.; Cheng, H.; Zhou, X.; Taylor, S. Energy savings and ventilation performance from CO2-based demand controlled ventilation: Simulation results from ASHRAE RP-1747 (ASHRAE RP-1747). Sci. Technol. Built Environ. 2020, 26, 257–281. [Google Scholar] [CrossRef] [Green Version]
  35. Hesaraki, A.; Holmberg, S. Demand-controlled ventilation in new residential buildings: Consequences on indoor air quality and energy savings. Indoor Built Environ. 2015, 24, 162–173. [Google Scholar] [CrossRef] [Green Version]
  36. Woloszyn, M.; Shen, J.; Mordelet, A.; Brau, J. Numerical simulations of energy performance of a ventilation system controlled by relative humidity. In Proceedings of the 26th AIVC Conference, Ventilation in Relation to the Energy Performance of Buildings, Brussels, Belgium, 21–23 September 2005; pp. 295–300. [Google Scholar]
  37. Savin, J.L.; Laverge, J. Demand-controlled Ventilation: An outline of assessment methods and simulations tools. In Proceedings of the 32nd AIVC Conference “Towards Optimal Airtightness Performance”, Brussels, Belgium, 12–13 October 2011. [Google Scholar]
  38. Walton, G.; Dols, W.S. CONTAM 2.4 User Guide and Program Documentation (No. NIST Interagency/Internal Report (NISTIR)-7251); US Department of Commerce, National Institute of Standards and Technology: Gaithersburg, MD, USA, 2005. [Google Scholar]
  39. Dols, W.S.; Polidoro, B.J. CONTAM User Guide and Program Documentation Version 3.4. NIST Technical Note 1887; Revision 1; US Department of Commerce, National Institute of Standards and Technology: Gaithersburg, MD, USA, 2020. [Google Scholar]
  40. Haghighat, F.; Megri, A.C. A comprehensive validation of two airflow models—COMIS and CONTAM. Indoor Air 1996, 6, 278–288. [Google Scholar] [CrossRef]
  41. Emmerich, S.J. Validation of multi-zone IAQ modeling of residential-scale buildings: A review. ASHRAE Trans. 2001, 107, 619–628. [Google Scholar]
  42. Emmerich, S.J.; Nabinger, S.J.; Gupte, A.; Howard-Reed, C. Validation of CONTAMW predictions for tracer gas in a townhouse. Building Simulation 2003. In Proceedings of the Eighth International IBPSA Conference, Eindhoven, The Netherlands, 11–14 August 2003; pp. 299–306. [Google Scholar]
  43. Persily, A.; Musser, A.; Emmerich, S.; Taylor, M. Simulations of Indoor Air Quality and Ventilation Impacts of Demand Controlled Ventilation in Commercial and Institutional Buildings; NISTIR 7042; US Department of Commerce, National Institute of Standards and Technology: Gaithersburg, MD, USA, 2003. [Google Scholar]
  44. Emmerich, S.J.; Persily, A.; Nabinger, S. Modeling moisture in residential buildings with a multi-zone IAQ program. In Proceedings of the 9th International Conference on Indoor Air Quality and Climate, Monterey, CA, USA, 30 June–5 July 2002. [Google Scholar]
  45. Lorenzetti, D.M.; Dols, W.S.; Persily, A.K.; Sohn, M.D. A stiff, variable time step transport solver for CONTAM. Build. Environ. 2013, 67, 260–264. [Google Scholar] [CrossRef] [Green Version]
  46. Dols, W.S.; Emmerich, S.J.; Polidoro, B.J. Coupling the multi-zone airflow and contaminant transport software CONTAM with EnergyPlus using co-simulation. In Building Simulation; Tsinghua University Press: Beijing, China, 2016; Volume 9, No. 4; pp. 469–479. [Google Scholar]
  47. Dols, W.S.; Emmerich, S.J.; Polidoro, B.J. Using coupled energy, airflow and indoor air quality software (TRNSYS/CONTAM) to evaluate building ventilation strategies. Build. Serv. Eng. Res. Technol. 2016, 37, 163–175. [Google Scholar] [CrossRef] [Green Version]
  48. Sowa, J.; Mijakowski, M. Whole year simulation of humidity based demand controlled hybrid ventilation in multiapartment building. In Proceedings of the 32nd AIVC Conference “Towards Optimal Airtightness Performance”, Brussels, Belgium, 12–13 October 2011; pp. 12–13. [Google Scholar]
  49. Mijakowski, M.; Narowski, P.; Sowa, J. Integrated calculations of thermal behaviour of buildings and processes in AHU—The tool for assessment of energy performance of complex buildings. Building Simulation 2009. In Proceedings of the Eleventh International IBPSA Conference, Glasgow, UK, 27–30 July 2009; pp. 875–882. [Google Scholar]
  50. ISO-FDIS 13790:2008 Energy Performance of Buildings—Calculation of Energy Use for Space Heating and Cooling; International Organization for Standardization: Geneva, Switzerland, 2008.
  51. Narowski, P.; Mijakowski, M.; Panek, A.; Rucińska, J.; Sowa, J. Proposal of simplified calculation 6R1C method of buildings energy performance adopted to Polish conditions. In Proceedings of the Conference Central Europe Towards Sustainable Building 2010—CESB10, Prague, Czech Republic, 30 June–2 July 2010; Hájek, P., Tywoniak, J., Lupíšek, A., Růžička, J., Sojková, K., Eds.; Department of Building Structures and CIDEAS Research Centre, Faculty of Civil Engineering, Czech Technical University in Prague: Prague, Czech Republic, 2010. [Google Scholar]
  52. Emmerich, S.J. Simulated performance of natural and hybrid ventilation systems in an office building. HVAC&R Res. 2006, 12, 975–1004. [Google Scholar]
  53. Pinto, M.; Viegas, J.; Freitas, V. Performance sensitivity study of mixed ventilation systems in multifamily residential buildings in Portugal. Energy Build. 2017, 152, 534–546. [Google Scholar] [CrossRef]
  54. Sowa, J.; Panek, A.; Mijakowski, M. A method to analyse the performance of residential ventilation systems. REHVA J. 2013, 50, 23–26. [Google Scholar]
  55. Polish Ministry of Infrastructure. Regulation of the Minister of Infrastructure of 12 April 2002 on the Technical Conditions That Should Be Met by Buildings and Their Location; Journal of Laws of the Republic of Poland No 75, Item. 690, (with Recast); Polish Ministry of Infrastructure: Warsaw, Poland, 2002. (In Polish) [Google Scholar]
  56. PKN. Ventilation in Dwellings and Public Utility Buildings; PN-83/B-03430/Az:3 2000; Specifications Polish Committee for Standardization: Warsaw, Poland, 2000. [Google Scholar]
  57. Narowski, P.; Janicki, M.; Heim, D. Comparison of Untypical Meteorological Years (UMY) and their influence on building energy performance simulations. In Proceedings of the BS2013: 13th Conference of International Building Performance Simulation Association, Chambéry, France, 26–28 August 2013; Wurt, E., Ed.; International Building Performance Simulation Association International Building Performance Simulation Association, 2013; pp. 1414–1421. Available online: http://www.ibpsa.org/ (accessed on 10 December 2014).
  58. EN ISO 15927–4:2005—Hygrothermal Performance of Buildings—Calculation and Presentation of Climatic Data—Part 4: Hourly Data for Assessing the Annual Energy Use for Heating and Cooling; International Organization for Standardization: Geneva, Switzerland, 2005.
  59. Persily, A.; de Jonge, L. Carbon dioxide generation rates for building occupants. Indoor Air 2017, 27, 868–879. [Google Scholar] [CrossRef]
Figure 1. The NAPE eight-floor, multiunit residential virtual reference building; plan of a typical floor (unit M3 indicated by the red line) and the building geometry.
Energies 13 06669 g001
Figure 2. Assumed daily variations of moisture gains in unit M3 on work days (left) and weekends (right).
Energies 13 06669 g002
Figure 3. Ambient temperature and humidity ratio for Warsaw.
Energies 13 06669 g003
Figure 4. Sketchpad (CONTAM) presenting the eight floor of the analyzed building using Option 3.
Energies 13 06669 g004
Figure 5. Comparison of air flows for units M3 located on the second and the eighth floors for three considered ventilation systems (red dots indicate opposite air flow in ventilation ducts). (a) Option 1 second floor; (b) Option 1 eighth floor; (c) Option 2 second floor; (d) Option 2 eighth floor; (e) Option 3 second floor; (f) Option 3 eighth floor.
Energies 13 06669 g005
Figure 6. Comparison of daily airflows in units M3 located on the second and the eighth floors for the three considered ventilation systems (workdays). (a) Option 1 second floor; (b) Option 1 eighth floor; (c) Option 2 second floor; (d) Option 2 eighth floor; (e) Option 3 second floor; (f) Option 3 eighth floor.
Energies 13 06669 g006
Figure 7. Daily airflows in units M3 located on the second and the eighth floors for the ventilation system in Option 3 (weekends). (a) Option 3 second floor; (b) Option 3 eighth floor.
Energies 13 06669 g007
Figure 8. Comparison of indoor relative humidity histograms for units M3 located on the second and the eighth floors for the three considered ventilation systems. (a) Option 1 second floor; (b) Option 1 eighth floor; (c) Option 2 second floor; (d) Option 2 eighth floor; (e) Option 3 second floor; (f) Option 3 eighth floor.
Energies 13 06669 g008
Figure 9. Comparison of exposures to CO2 in units M3 located on the second and the eighth floor for three optional ventilation systems (workdays). (a) Option 1 second floor; (b) Option 1 eighth floor; (c) Option 2 second floor; (d) Option 2 eighth floor; (e) Option 3 second floor; (f) Option 3 eighth floor.
Energies 13 06669 g009
Figure 10. CO2 concentrations in units M3, located on the second and eighth floors, for the ventilation system in Option 3 (weekends). (a) Option 3 second floor; (b) Option 3 eighth floor.
Energies 13 06669 g010
Figure 11. Comparison of exposure to CO2 concentrations vs. normalized primary energy in units M3 on the second and the eighth floors, and the building overall.
Energies 13 06669 g011
Table 1. Coefficients C and n, used in the of modeling of different ventilation systems.
Flow ElementCn
m3/(s∙Pa^n)
Window gap (1m)1.80 × 10−50.67
Trickle vent (passive stack ventilation)1.25 × 10−50.50
Exhaust grill (passive stack ventilation)(Added as loss coefficient in the duct)
Humidity-sensitive trickle vent (<35% RH)5.83 × 10−40.50
Humidity-sensitive trickle vent (>65% RH)2.50 × 10−30.50
Humidity-sensitive exhaust grill (<30% RH)3.30 × 10−40.50
Humidity-sensitive exhaust grill (>75% RH)2.20 × 10−50.50
Table 2. Exposure to CO2 concentrations for three ventilation systems applied in the NAPE reference building.
ExposureUnit M3 Second FloorUnit M3 Eighth FloorAll Units in the Building
Option 1Averageppm97415401146
Min (16.7%)ppm450450450
Max (83.3%)ppm135123052803
Option 2Averageppm112716231289
Min (16.7%)ppm450450450
Max (83.3%)ppm163824803029
Option 3Averageppm105011941053
Min (16.7%)ppm450450450
Max (83.3%)ppm151717442116
Table 3. Energy usage of ventilation systems applied in the NAPE reference building.
EnergyUnit M3 Second FloorUnit M3 Eighth FloorAll Units in the Building
Option 1Ventilation heat losskWh/year3361152950,992
kWh/(m2 year)37.9817.2831.21
Electricity used by supplementary fanskWh/year000
kWh/(m2 year)000
Sum of the above,
converted to primary energy
kWh/year2689122440,793
kWh/(m2 year)30.3913.8324.97
Option 2Ventilation heat losskWh/year1878114427,231
kWh/(m2 year)21.2312.9216.67
Electricity used by supplementary fanskWh/year000
kWh/(m2 year)000
Sum of the above,
converted to primary energy
kWh/year150391521,785
kWh/(m2 year)16.9810.3413.33
Option 3Ventilation heat losskWh/year2357211740,404
kWh/(m2 year)26.6323.9224.73
Electricity used by supplementary fanskWh/year1221582245
kWh/(m2 year)1.381.781.37
Sum of the above,
converted to primary energy
kWh/year2252216639,057
kWh/(m2 year)25.4524.4823.90
Publisher’s Note: MDPI stays neutral with regard to jurisdictional claims in published maps and institutional affiliations.

