Article

Development of a Static Equivalent Model for Korean Power Systems Using Power Transfer Distribution Factor-Based k-Means++ Algorithm

Department of Electrical Engineering, School of Electronic and Electrical Engineering, Kyungpook National University, Daegu 41566, Korea
*
Author to whom correspondence should be addressed.
Energies 2020, 13(24), 6663; https://doi.org/10.3390/en13246663
Submission received: 30 October 2020 / Revised: 9 December 2020 / Accepted: 14 December 2020 / Published: 17 December 2020
(This article belongs to the Special Issue Electric Power Systems Research 2020)

Abstract

:
This paper presents a static network equivalent model for Korean power systems. The proposed equivalent model preserves the overall transmission network characteristics focusing on power flows among areas in Korean power systems. For developing the model, a power transfer distribution factor (PTDF)-based k-means++ algorithm was used to cluster the bus groups in which similar PTDF characteristics were identified. For the reduction process, the bus groups were replaced by a single bus with a generator or load, and an equivalent transmission line was determined to maintain power flows in the original system model. Appropriate voltage levels were selected, and compensation for real power line losses was made for the correct representation. A Korean power system with more than 1600 buses was reduced to a 38-bus system with 13 generators, 25 loads, and 74 transmission lines. The effectiveness of the developed equivalent model was evaluated by performing power flow simulations and comparisons of various characteristics of the original and reduced systems. The simulation comparisons show that the developed equivalent model maintains inter-area power flows as close as possible to the original Korean power systems.

1. Introduction

Confidentiality issues of critical energy infrastructure information limit public access to realistic transmission network models without the dedicated permission requirements. Moreover, a free educational version of a power system simulator provides power system solutions only up to a limited number of buses. However, in Korea, no research efforts have been made to develop a reduced network model, and no simplified equivalent model exists to approximate the overall characteristics of a large practical power system. Therefore, without a network model to study, the potential benefits of power system education and research are impossible.
The power system equivalencing technique represents a large system using a simplified system that approximates the behavior of the original system [1]. Traditionally, power system equivalents were used to speed up power system analysis by reducing the system network size [2]. This network-reduction technique is divided into static and dynamic equivalents [3,4]. The static equivalent methods reduce a system model for power flow studies, whereas the dynamic equivalents reduce the computational demands for transient stability analysis.
Classical Ward and REI equivalents are well-known techniques for realizing static network equivalents [1,5]. These techniques partition the electric power system into internal, boundary, and external system buses. The power system model size is decreased by replacing the external system with small equivalents, whereas the area of interest (the internal system) is unchanged. These techniques focus on maintaining the characteristics of a specific portion of the system; thus, the reduced model might be unsuitable for large-scale network analysis where power flow interactions among areas are required.
Recently, a new network-reduction technique was proposed for system-planning analysis. The method, extensively discussed by Xu and Overbye [6], uses a power transfer distribution factor (PTDF) matrix based on the DC power flow model to identify and aggregate the bus groups. A reduced equivalent system correctly approximates the PTDF characteristics of the original system so that the reduced system maintains the line power flows between areas as close as possible to the original system. Thus, the structural properties of the overall system can be retained in the reduced system [7,8,9].
The correct approximation achieved using the reduced system depends on how well the buses are grouped in the original system. For a large power system, identifying the bus groups is complicated because of the huge dimensions of the PTDF matrix. Shi and Tylavsky [10] evaluated various bus-clustering methods based on data-processing algorithms, with k-means++ methods showing the best performance. The k-means++ method overcomes the limitations of the k-means method by advanced initial bus selection and the Euclidean distance of the PTDF matrix.
For the reduction in large power systems, all the characteristics of the original system cannot be preserved; thus, the reduction processes generally focus on specific elements of the power system. In [11], the authors noted that the south/southeastern part of Brazil’s power system can be reduced to a seven-bus system with five generators. The equivalent system correctly represents the electromechanical oscillations and has been used in several small-signal stability studies. Reduction in southern and eastern Australia’s power system to a 14-generator system was achieved by Gibbard [12] by focusing on modal control problems. The reduced model was used to validate the control effects of a power system stabilizer in multimachine power systems. In [13], the simplified two-area interconnected Hokkaido–Honshu power system of eastern Japan was used in order to investigate the effectiveness of fuzzy-PID controller for improved frequency stability. In this manner, with clear objectives for use, the reduced equivalent models can work effectively.
In this study, a static equivalent model preserving the overall system topology of Korean power systems was developed using the PTDF-based k-means++ bus-clustering method. The original system of more than 1600 buses was reduced to a 38-bus system with 13 generators, 25 loads, and 74 transmission lines. The overall system topology was maintained by developing the PTDF matrix and using the k-means++ algorithm for bus-clustering. The bus groups were replaced by a single bus with a generator or load depending on the net power injection in the group. The equivalent impedance of the transmission lines was determined to preserve the power flows among the identified areas as close as possible to the original system. For an advanced representation of the original system, an appropriate voltage magnitude of a bus was selected, and real power losses, ignored in DC power flow models, were compensated.
The next three sections of this paper are organized as follows. 
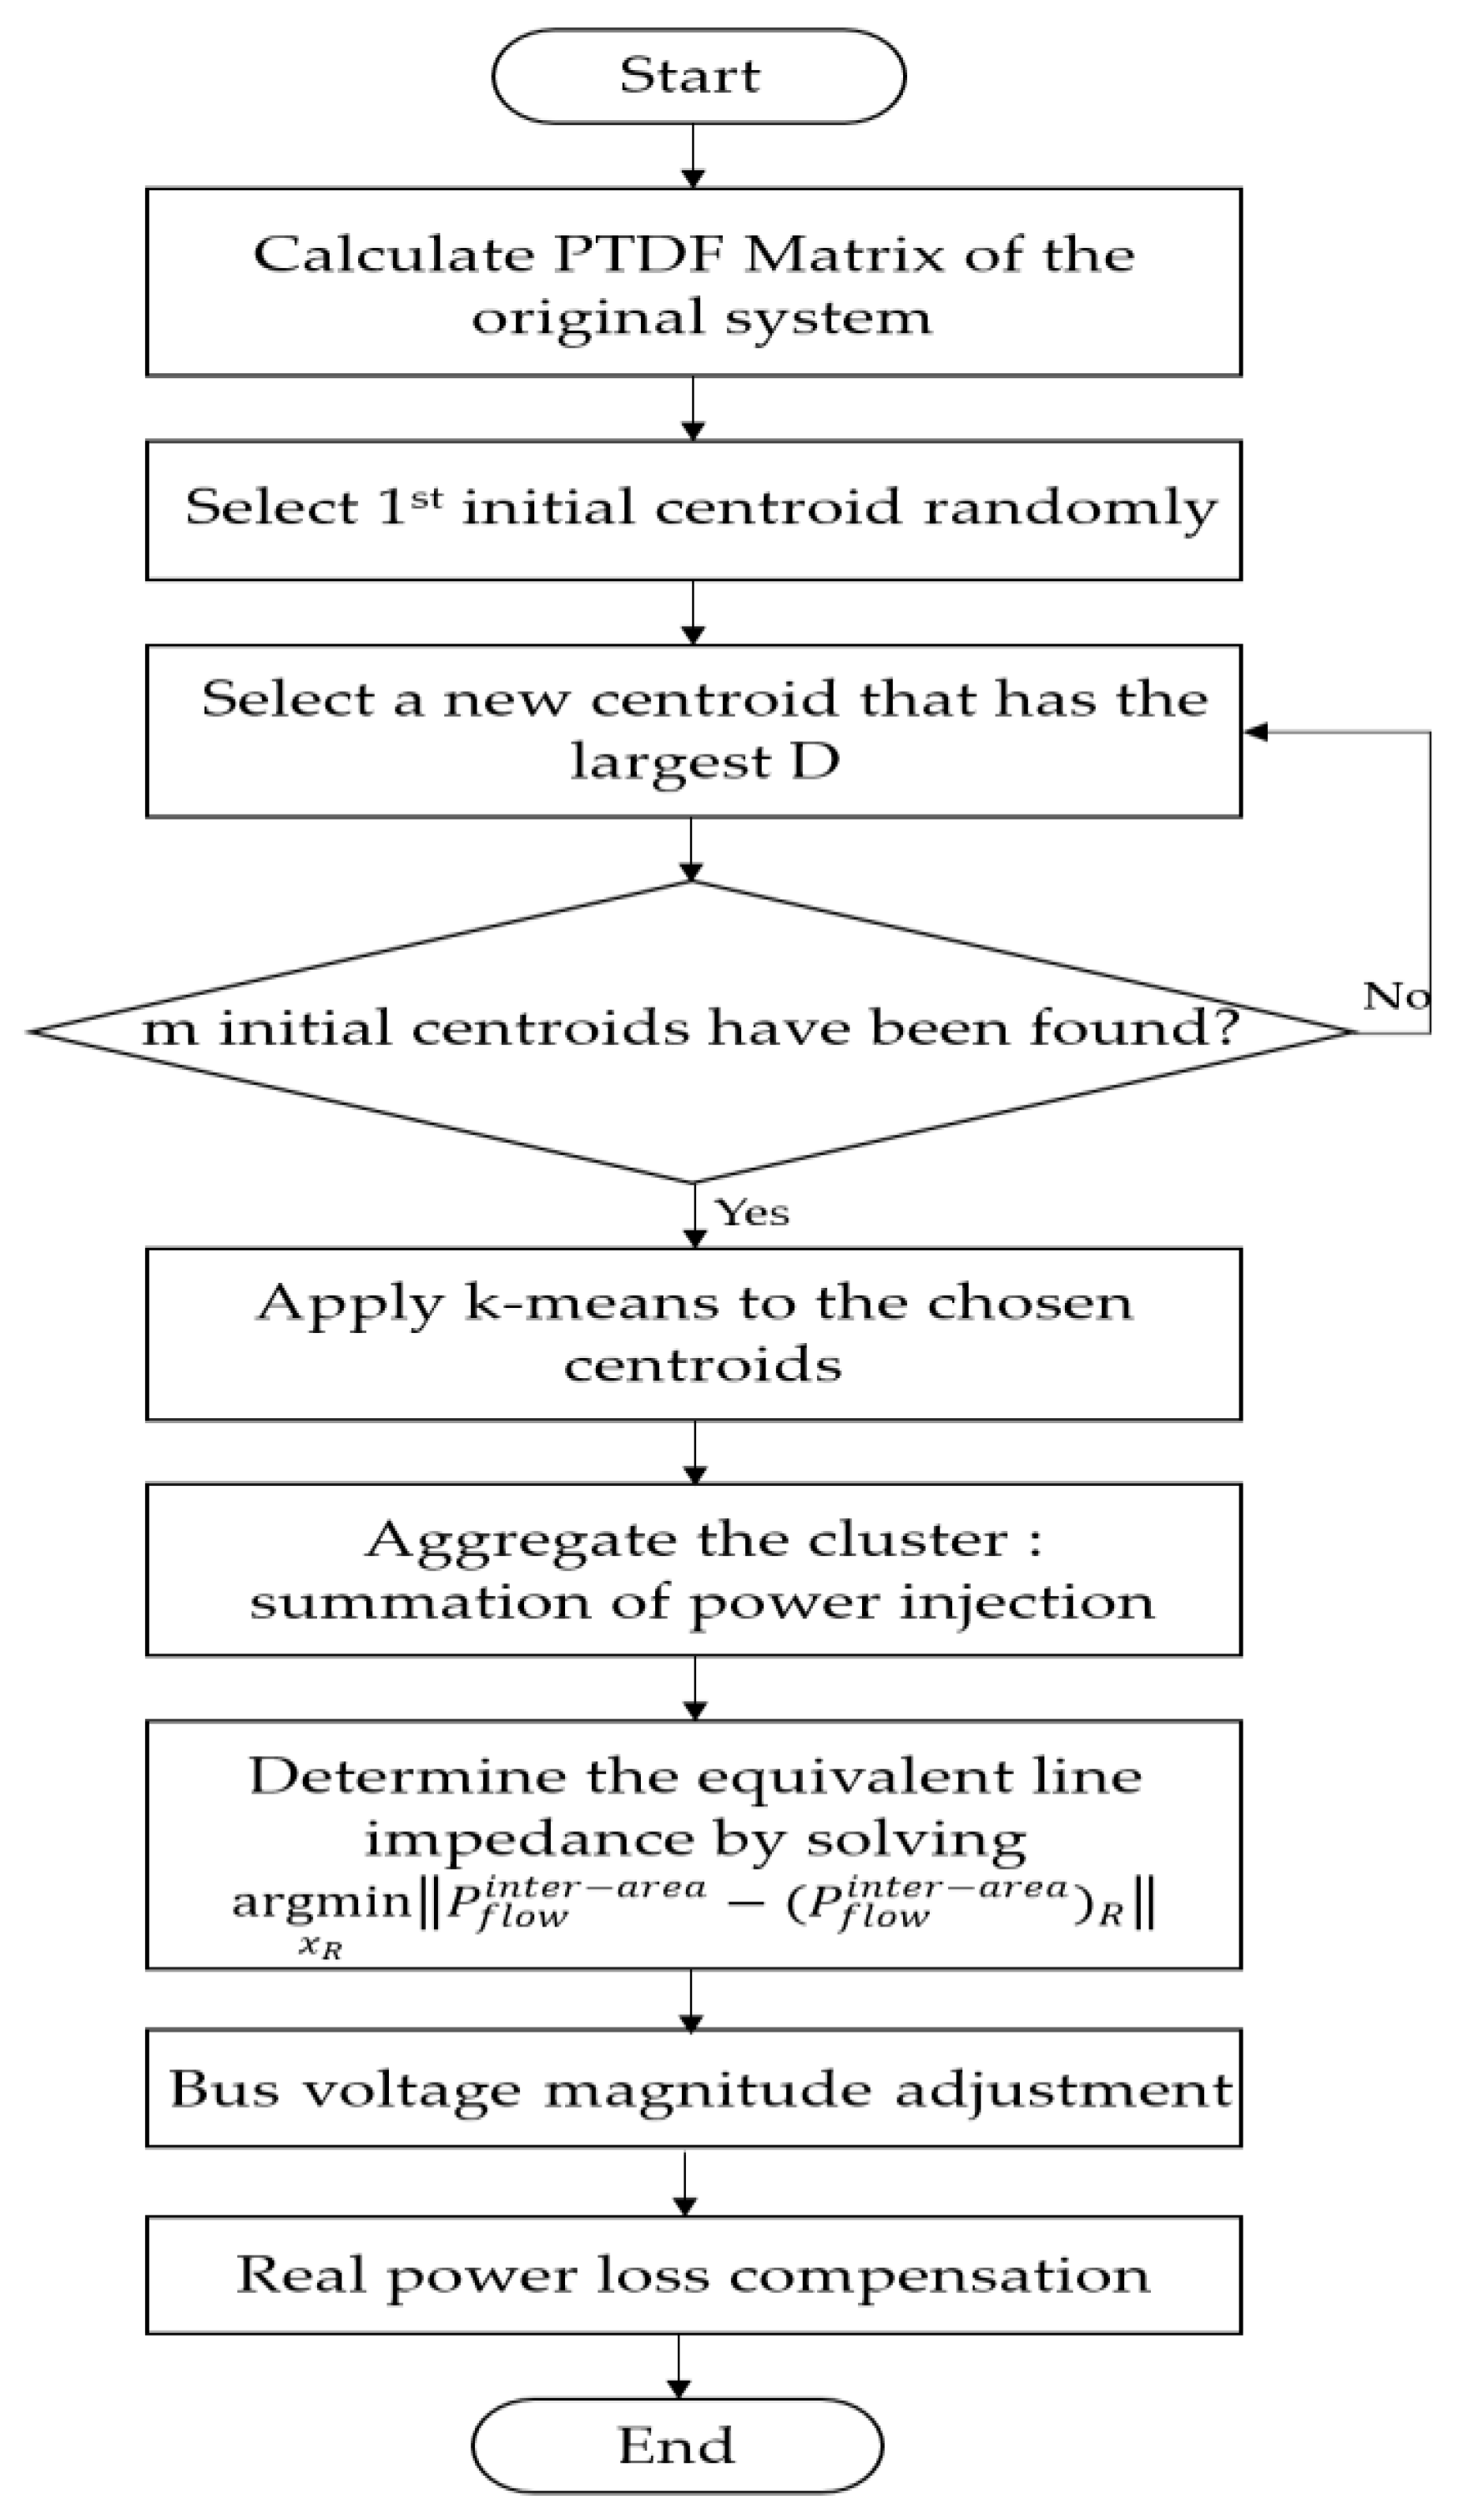
Section 2 describes the method for static model reduction using the PTDF matrix and k-means++ algorithm and introduces the detailed procedures for determining transmission line impedances between the areas and line loss compensation. Section 3 presents the developed equivalent model for Korean power systems and performs simulation comparisons with original systems to evaluate the performance of the reduced system. Section 4 presents the conclusions.

2. Methods for Static Model Reduction

2.1. PTDF Matrix

PTDF is a linear approximation of the active power flow sensitivity in a specific transmission line regarding the shift of real power [14]. In other words, when 1 MW of real power is injected into a specific bus, a change in the power flow in each line can be approximated using the PTDF calculation. A PTDF matrix represents the difference in the real power flow over any line because of the power injection at all system buses.
The PTDF matrix is fully based on the DC power model. The corresponding power flows and power injections are linearly related to a susceptance matrix and bus voltage angles, respectively [15,16]. The PTDF matrix, shown in Figure 1, can be expressed as follows:
Φ =   B b r a n c h B b u s 1 = d i a g ( 1 / x ) C { C T d i a g ( 1 / x ) C } 1 ,
where B b r a n c h and B b u s are the branch and bus susceptance matrices with dimensions of L × N and N × N, respectively. L is the number of transmission lines, N is the number of buses, except for a slack bus, x is the transmission line reactance vector, and C is the incidence matrix with dimensions of L × N.
Each column h i ( i = 1 , 2 , , N ) in this matrix has a corresponding PTDF value, and each column corresponds to a bus and each row corresponds to a line in the system.

2.2. Bus-Clustering Using the Power Transfer Distribution Factor-Based k-Means++ Algorithm

Using the formulated PTDF matrix, the bus groups showing similar PTDF characteristics can be identified by comparing the elements in the column of the matrix. The Euclidean distance measures the similarity, and the entire system can be partitioned into different areas or clusters, as given in Equation (2):
d i N ( h i , h N ) = ( ϕ 1 i ϕ 1 N ) 2 + + ( ϕ L i ϕ L N ) 2 = j = 1 L ( ϕ j i ϕ j N ) 2 ,
where h i is the i th column of the PTDF matrix, ϕ i j is the component in the i th row and j th column of the PTDF matrix, and L is the number of transmission lines.
The k-means++ algorithm is an improved k-means algorithm used to form the bus clusters according to similarity measures from the Euclidean distances of each h i in the PTDF matrix. In the k-means algorithm, the initial centroids in the clusters were randomly selected, and the Euclidean distance between h i and the cluster’s centroid was calculated. The cluster members were identified using the closest Euclidean distance, and the centroid of each cluster was updated by averaging all vectors within the cluster. These steps were repeated until the desired number of clusters was determined. However, for a large power system network, the k-means approach has limitations of nonconvergence and the appearance of many empty clusters because the k-means algorithm randomly selects the initial centroids without knowing the appropriate number of clusters [17]. Problems associated with the k-means algorithm can be overcome using a k-means++ algorithm in the iteration process, improving the convergence speed and resulting in better cluster formations [17,18].
For the bus-clustering with the k-means++ algorithm, the first centroid was randomly selected from all PTDF vectors, followed by calculation of its Euclidean distance ( d i 1 , d i 2 , , d i k , ) from the centroid to all existing noncentroids for each vector h i . For the remaining noncentroid vector, the one with the largest D( h i ) = max { d i 1 , d i 2 , , d i k , } was selected and designated as the new centroid. This process was continued until the desired number of centroids was obtained. Once the iteration was completed, the same method as in the k-means algorithm was used to identify clustering information. Figure 2 illustrates the clustering process using the k-means++ algorithm for a set of data in a two-dimensional Euclidean space. By using the k-means++ algorithm, a converged solution was obtained, and the number of clusters could be controlled [17].

2.3. Determining the Equivalent Transmission Line Impedance between Clusters

During the reduction process, a single bus replaced each cluster and the aggregated generator and load was attached to the bus. The equivalent impedance of the line connecting the identified clusters was determined. The reduced system preserves the inter-area power flows. For the original system, the inter-area power flows could be calculated by summing all line power flows over the transmission lines connecting the corresponding areas as follows:
P f l o w i n t e r a r e a = Π f l o w P f l o w = Π f l o w Φ P i n j ,
where P f l o w i n t e r a r e a is an L R × 1 vector containing the inter-area power flows, L R is the number of transmission lines in the reduced system, Π f l o w is an L R × L matrix summing the line flows, Φ is the PTDF matrix, and P i n j is the bus-injection vector.
After aggregating the bus groups, the reduced network’s power flow is different from that of the original network. The formula for the reduced model is given by Equation (4), which is obtained from the definition of PTDF with a reduced transmission line reactance vector x R and reduced bus-branch incidence matrix C R :
( P f l o w i n t e r a r e a ) R = Φ R ( P i n j ) R = d i a g ( 1 / x R ) C R { C R T d i a g ( 1 / x R ) C R } 1 ( P i n j ) R ,
where subscript R denotes the reduced system.
The principal constraint associated with network reduction is to find a set of transmission line reactance minimizing the power flow difference between the original and reduced systems. The reactance was identified using the optimization method proposed by Shi and Tyvalsky [19] and can be expressed as follows:
argmin x R P f l o w i n t e r a r e a ( P f l o w i n t e r a r e a ) R =   argmin x R Π f l o w Φ P i n j d i a g ( 1 / x R ) C R { C R T d i a g ( 1 / x R ) C R } 1 ( P i n j ) R , s . t .   x R i 0 ,   i = 1 , 2 , , L R
where x R i is the i th component of the transmission reactance vector and · represents the Euclidean norm.
In the reduced model, the injections at each bus are the sum of the injections at all buses within each cluster in the original system. For example, if the amount of real power generation in the cluster is greater than the real power load, the extra real power injection is represented by a generator. For the opposite case, a load represents the extra real power consumption in the cluster. Equation (6) expresses the reduced system power injection.
( P i n j ) R = Π g P i n j ,
where Π g is the sum of the bus injections with dimensions of an N R × N matrix, and each inter-area power flow is the summation of all contributions from different bus injections.

2.4. Selecting an Appropriate Bus Voltage Magnitude

During the reduction process, when a single bus replaced the bus groups, an appropriate bus voltage magnitude was determined, maintaining the overall voltage characteristics of the original system. For developing the equivalent method, the average value of voltage magnitudes within a cluster was selected, as given by Equation (7). For a generator bus, the set voltage was adjusted to match the average value, whereas for a load bus, a shunt capacitor was provided, supporting the required voltage level.
V a v e r a g e i = k i V k n ,
where V a v e r a g e i is the average voltage of the ith area, V k is the bus voltage magnitude at bus k, and n is the number of buses in the ith area.

2.5. Real Power Loss Compensation

The DC power flow model used for developing the PTDF matrix neglects real power losses. Although real power losses on a transmission line are relatively small, their cumulative sum could cause a significant loss of simulation accuracy. In the equivalent model, real power losses in the original system were compensated by adding resistance to the transmission line connecting two areas. Resistances were added to minimize changes in the transmission real power flows of the equivalent model. The appropriate resistance was determined using Equation (8):
R c o m p e n s a t e d i , j = k i , j P l o s s k [ I R i , j ] 2 ,
where R compensated i , j is the resistance of the transmission line between areas i and j, I R i , j is the magnitude of the current over the transmission line between areas i and j in the equivalent model, P loss k denotes the transmission line real power losses in the original system, and k is a transmission line connecting areas i and j.

2.6. Summary of the Procedures

Developing an efficient network-reduction model involves five steps, namely: (1) bus-clustering using a PTDF-based k-means++ algorithm, (2) aggregating the bus groups and converting them into a single equivalent bus, (3) determining the equivalent line impedance, (4) adjusting the bus voltage magnitude, and (5) compensating for real power losses on the transmission line. This study proposes the last two steps for better approximation using the developed equivalent model. Figure 3 illustrates these steps.

3. Developing an Equivalent Model for Korean Power Systems

The reduction approach was implemented using MATLAB and applied to a practical Korean power system. Table 1 presents detailed information about the original system used for the development.
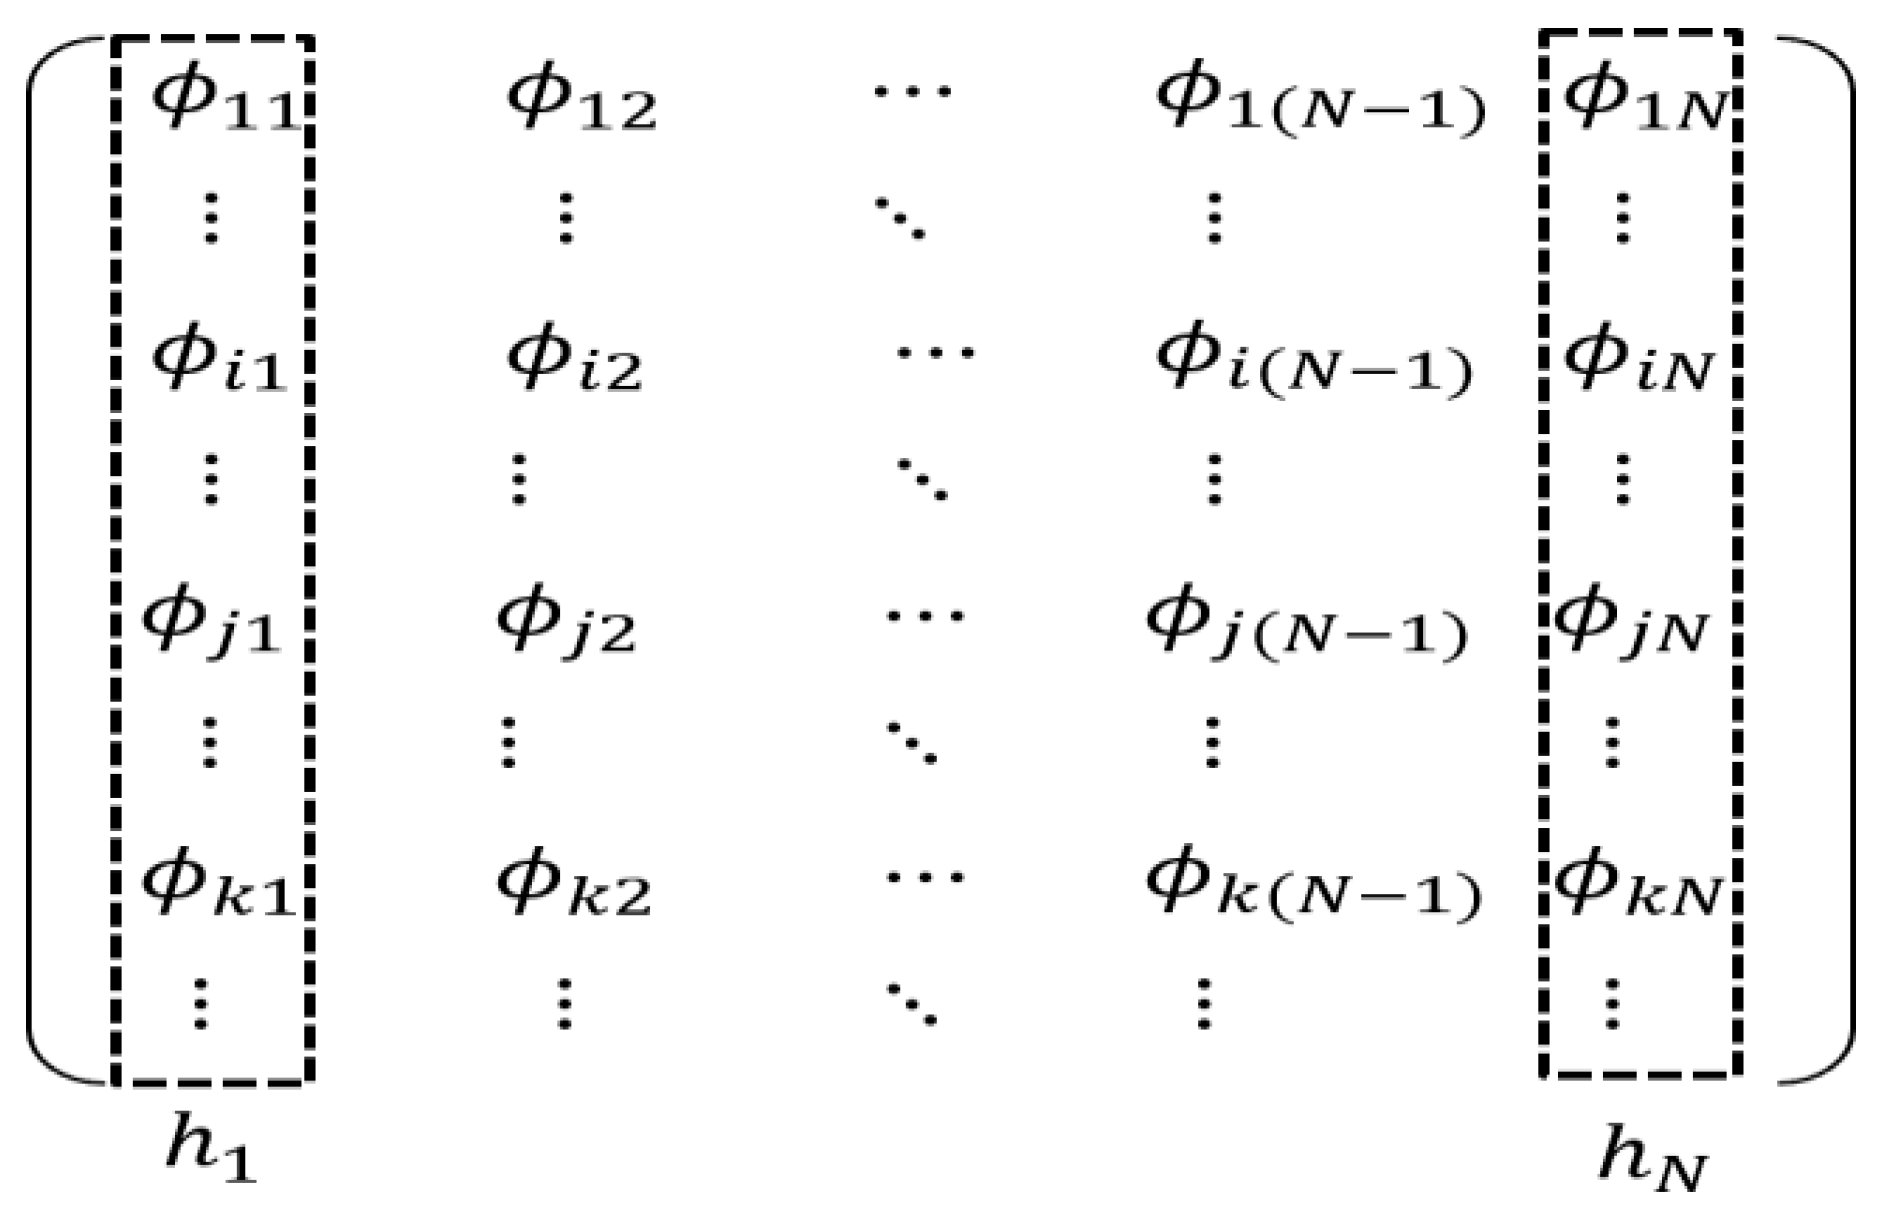
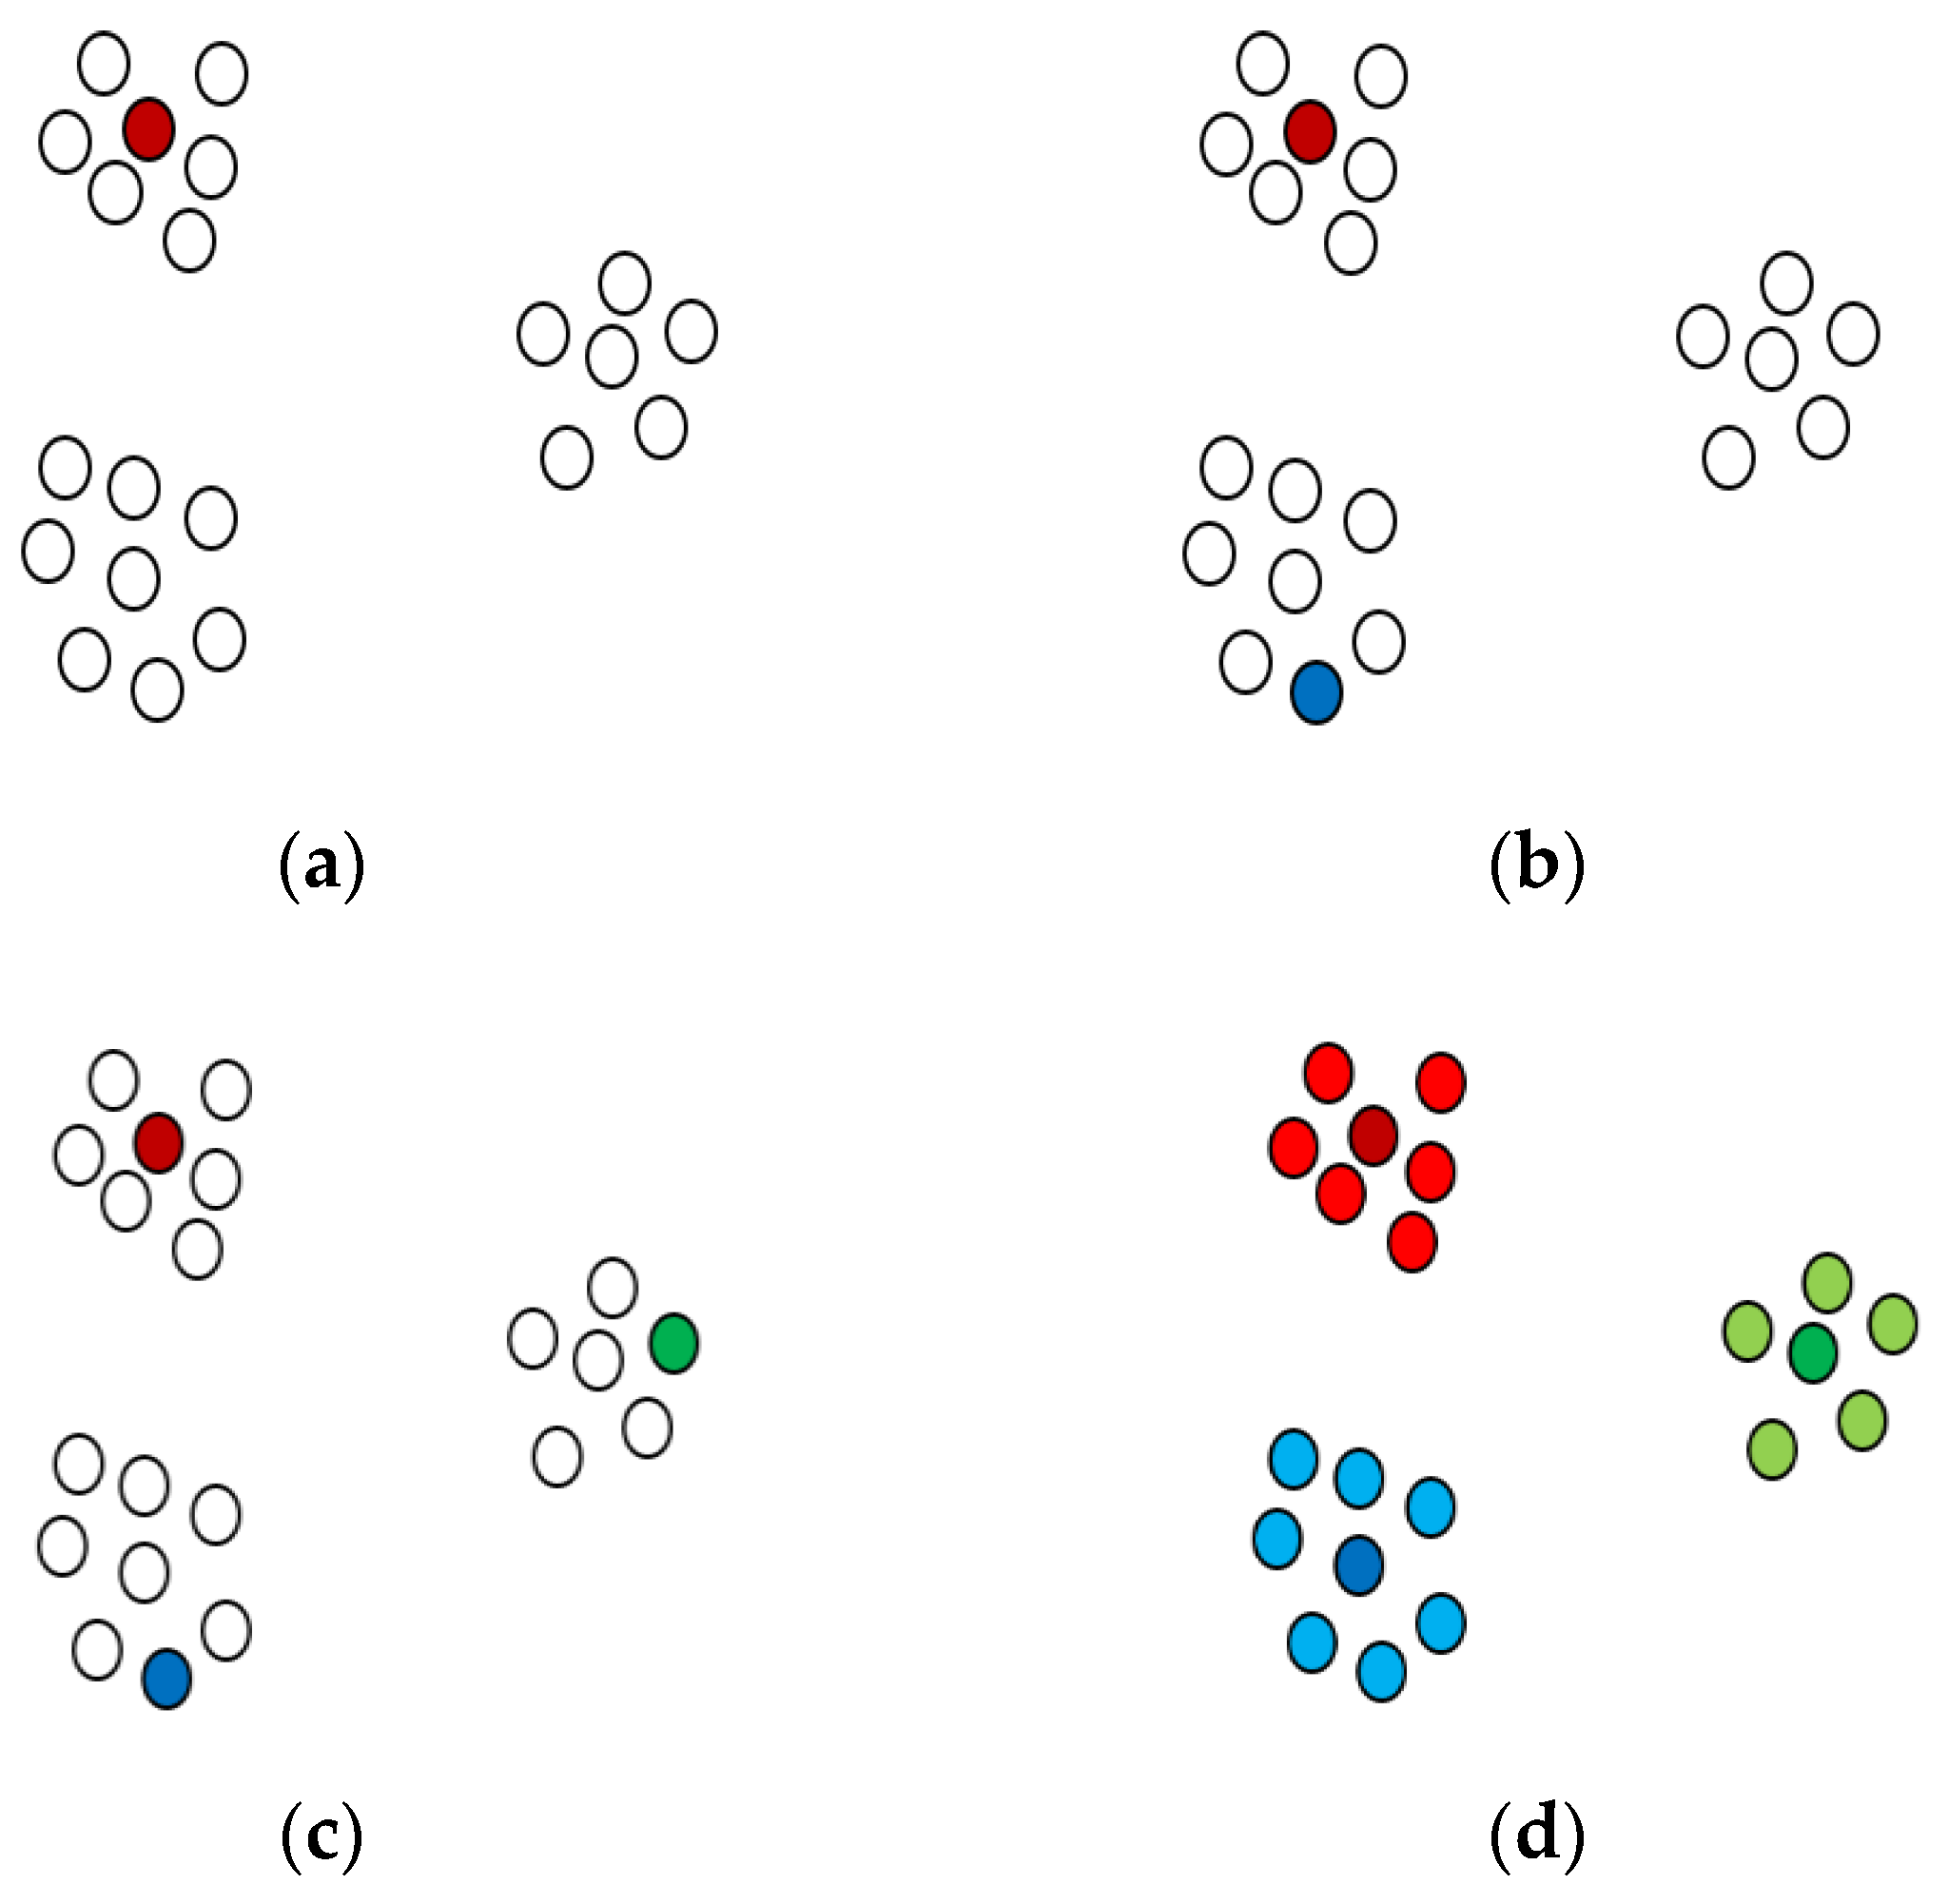
The number of buses for the reduction process can be selected by considering the appropriate representation of the overall Korean power system topology. The limitation of the number of buses was also considered for the free use of a commercial power system simulator. Easy access to the equivalent model was expected for undergraduate and graduate students. Thirty-eight clusters were selected using the Euclidean distance of the PTDF matrix given in Equation (2) and the k-means++ algorithm. The largest cluster includes 280 buses, and the smallest one has only 11 buses. Most clusters have between 20 and 50 buses. These bus groups in the original network were replaced by single buses in the reduced system. 
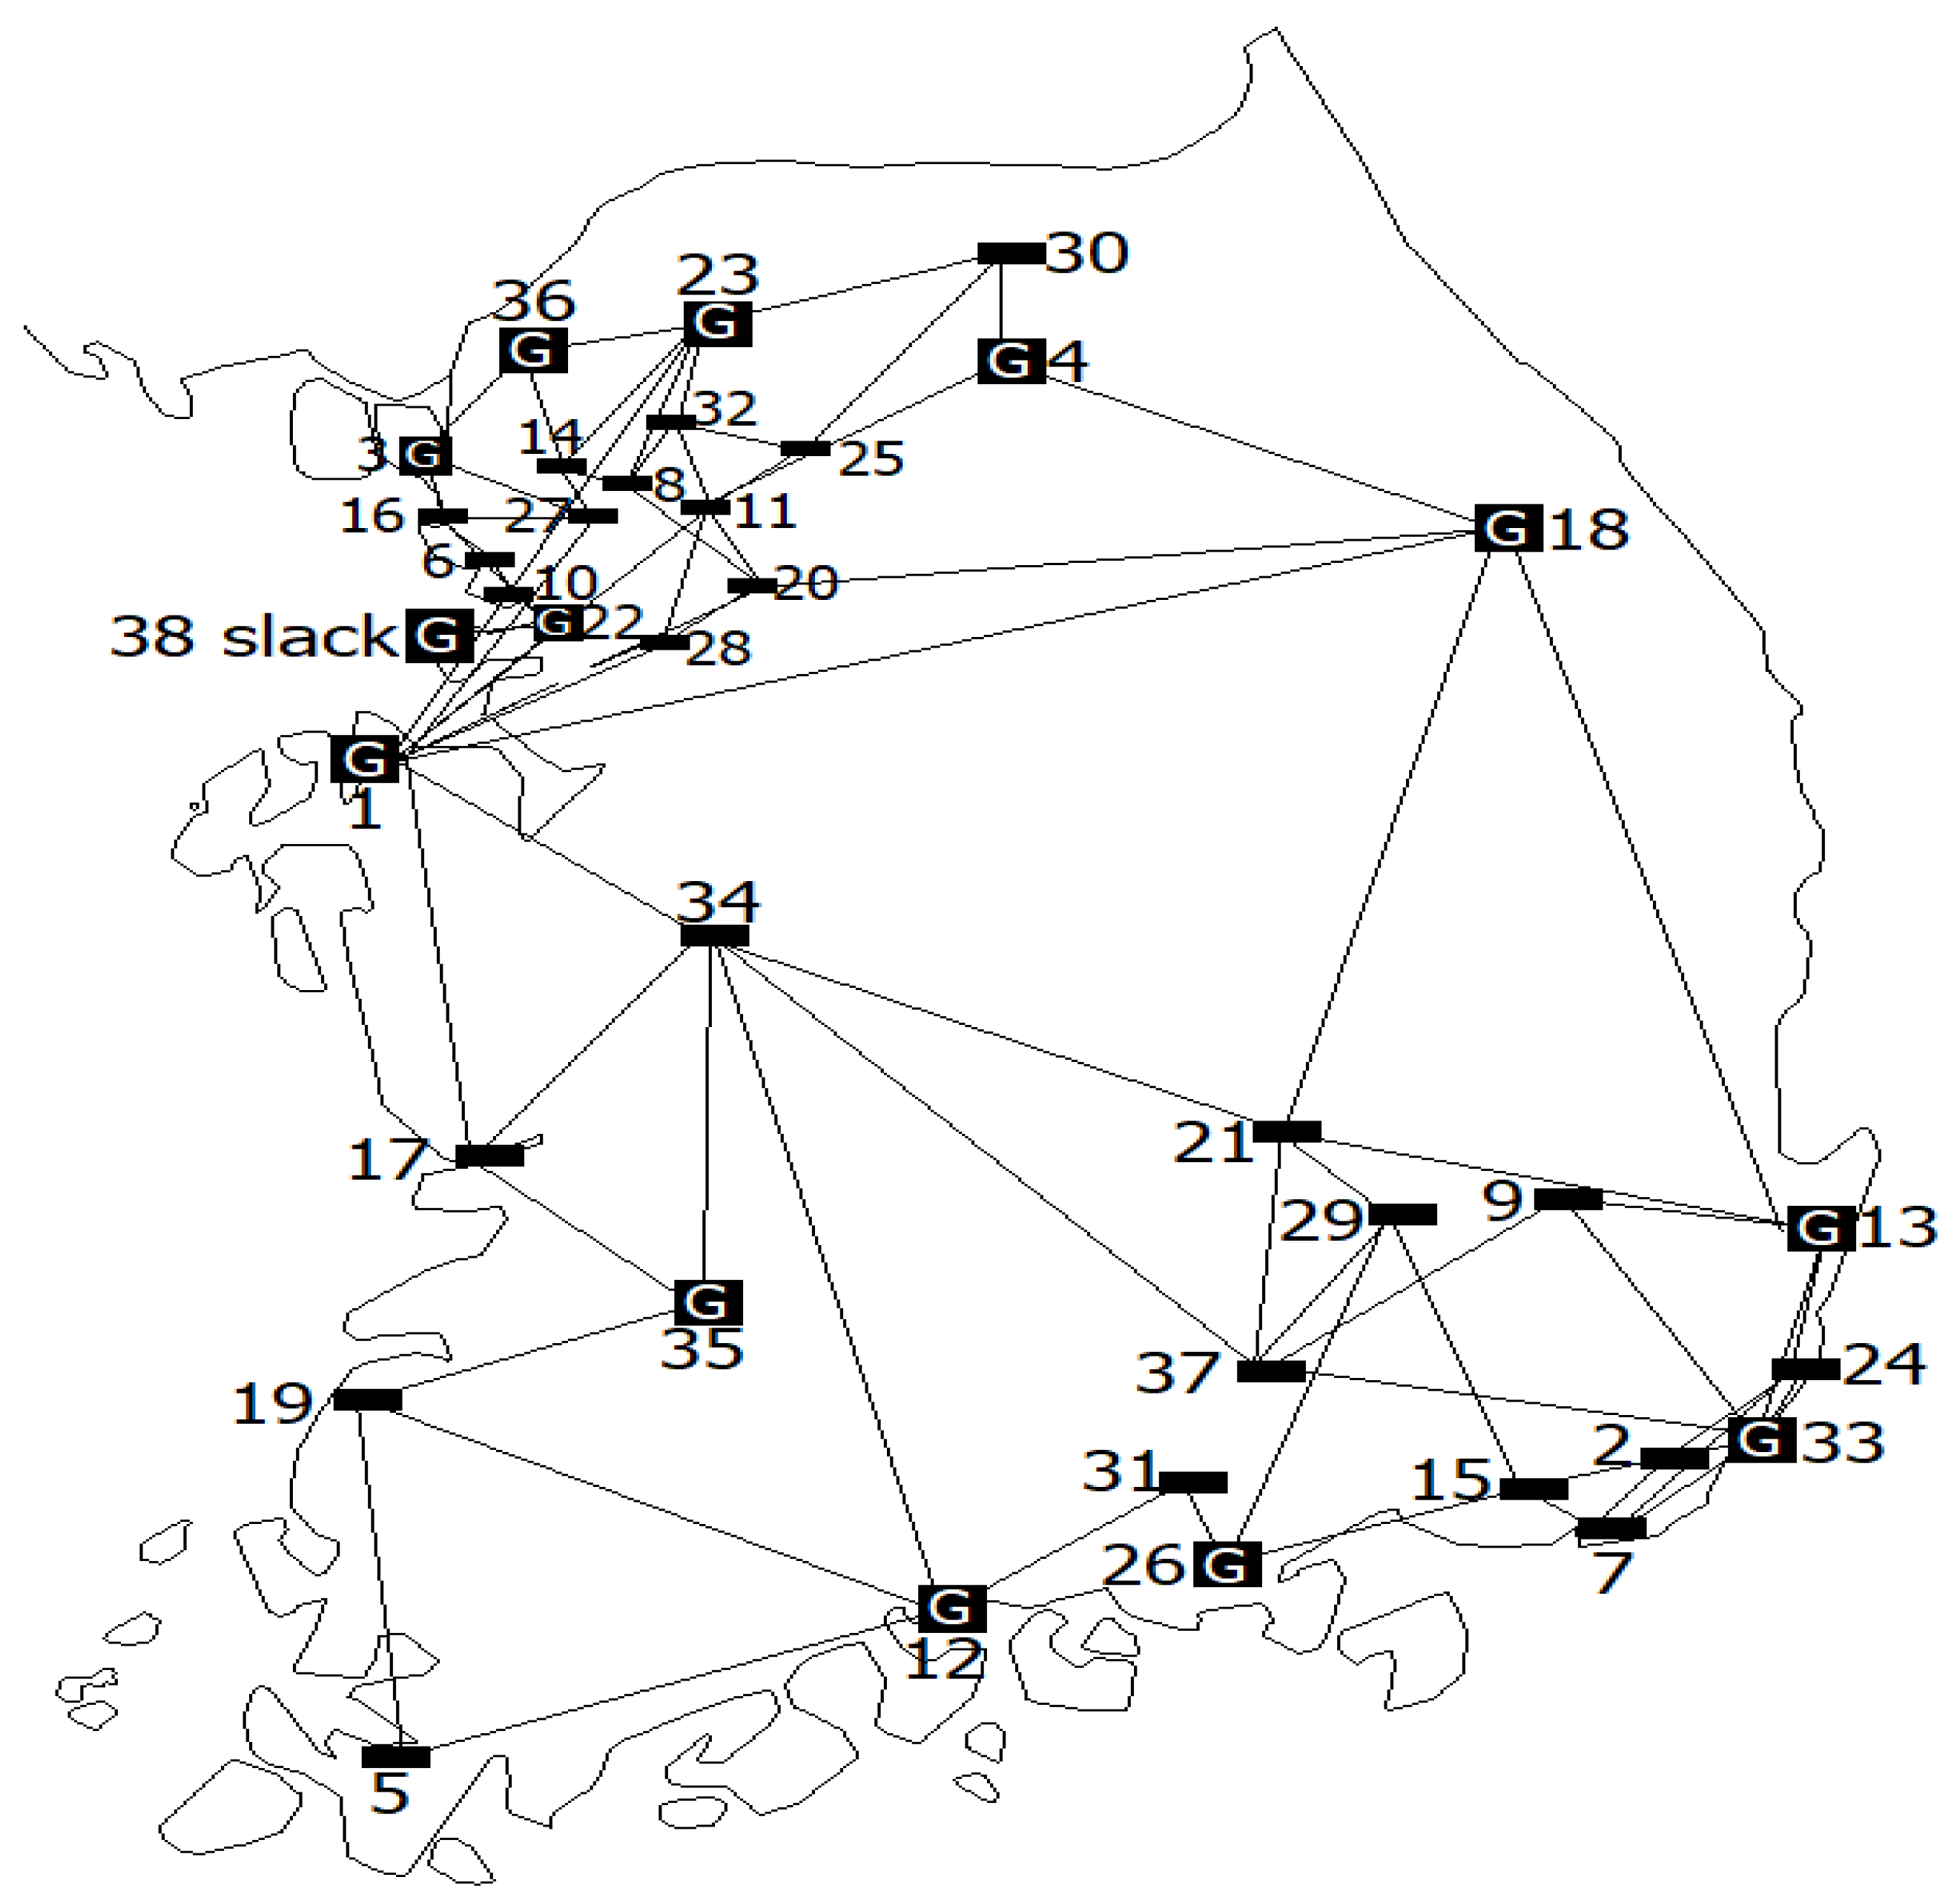
Figure 4 presents the corresponding buses and their geographic locations.
The power injections from all buses within an identified cluster were summed up, and a generator or load, depending on positive or negative injections, was connected to the corresponding bus. The generation and load were scaled down to one-tenth for simplicity. Figure 4 shows that the generator buses are marked as G, whereas the unmarked buses are the corresponding load buses. The buses were grouped around cities with large loads and near power generation complexes.
When there was at least one transmission line between clusters, a corresponding line was created in the reduced model. In total, 74 transmission lines were identified. The equivalent impedance of a line can be calculated by solving the optimization problem in Equation (5). The PTDF matrix for the reduced system has dimensions of 74 × 37, except for a slack bus. The reduced model comprises 13 generator buses, 25 load buses, and 74 transmission lines. 
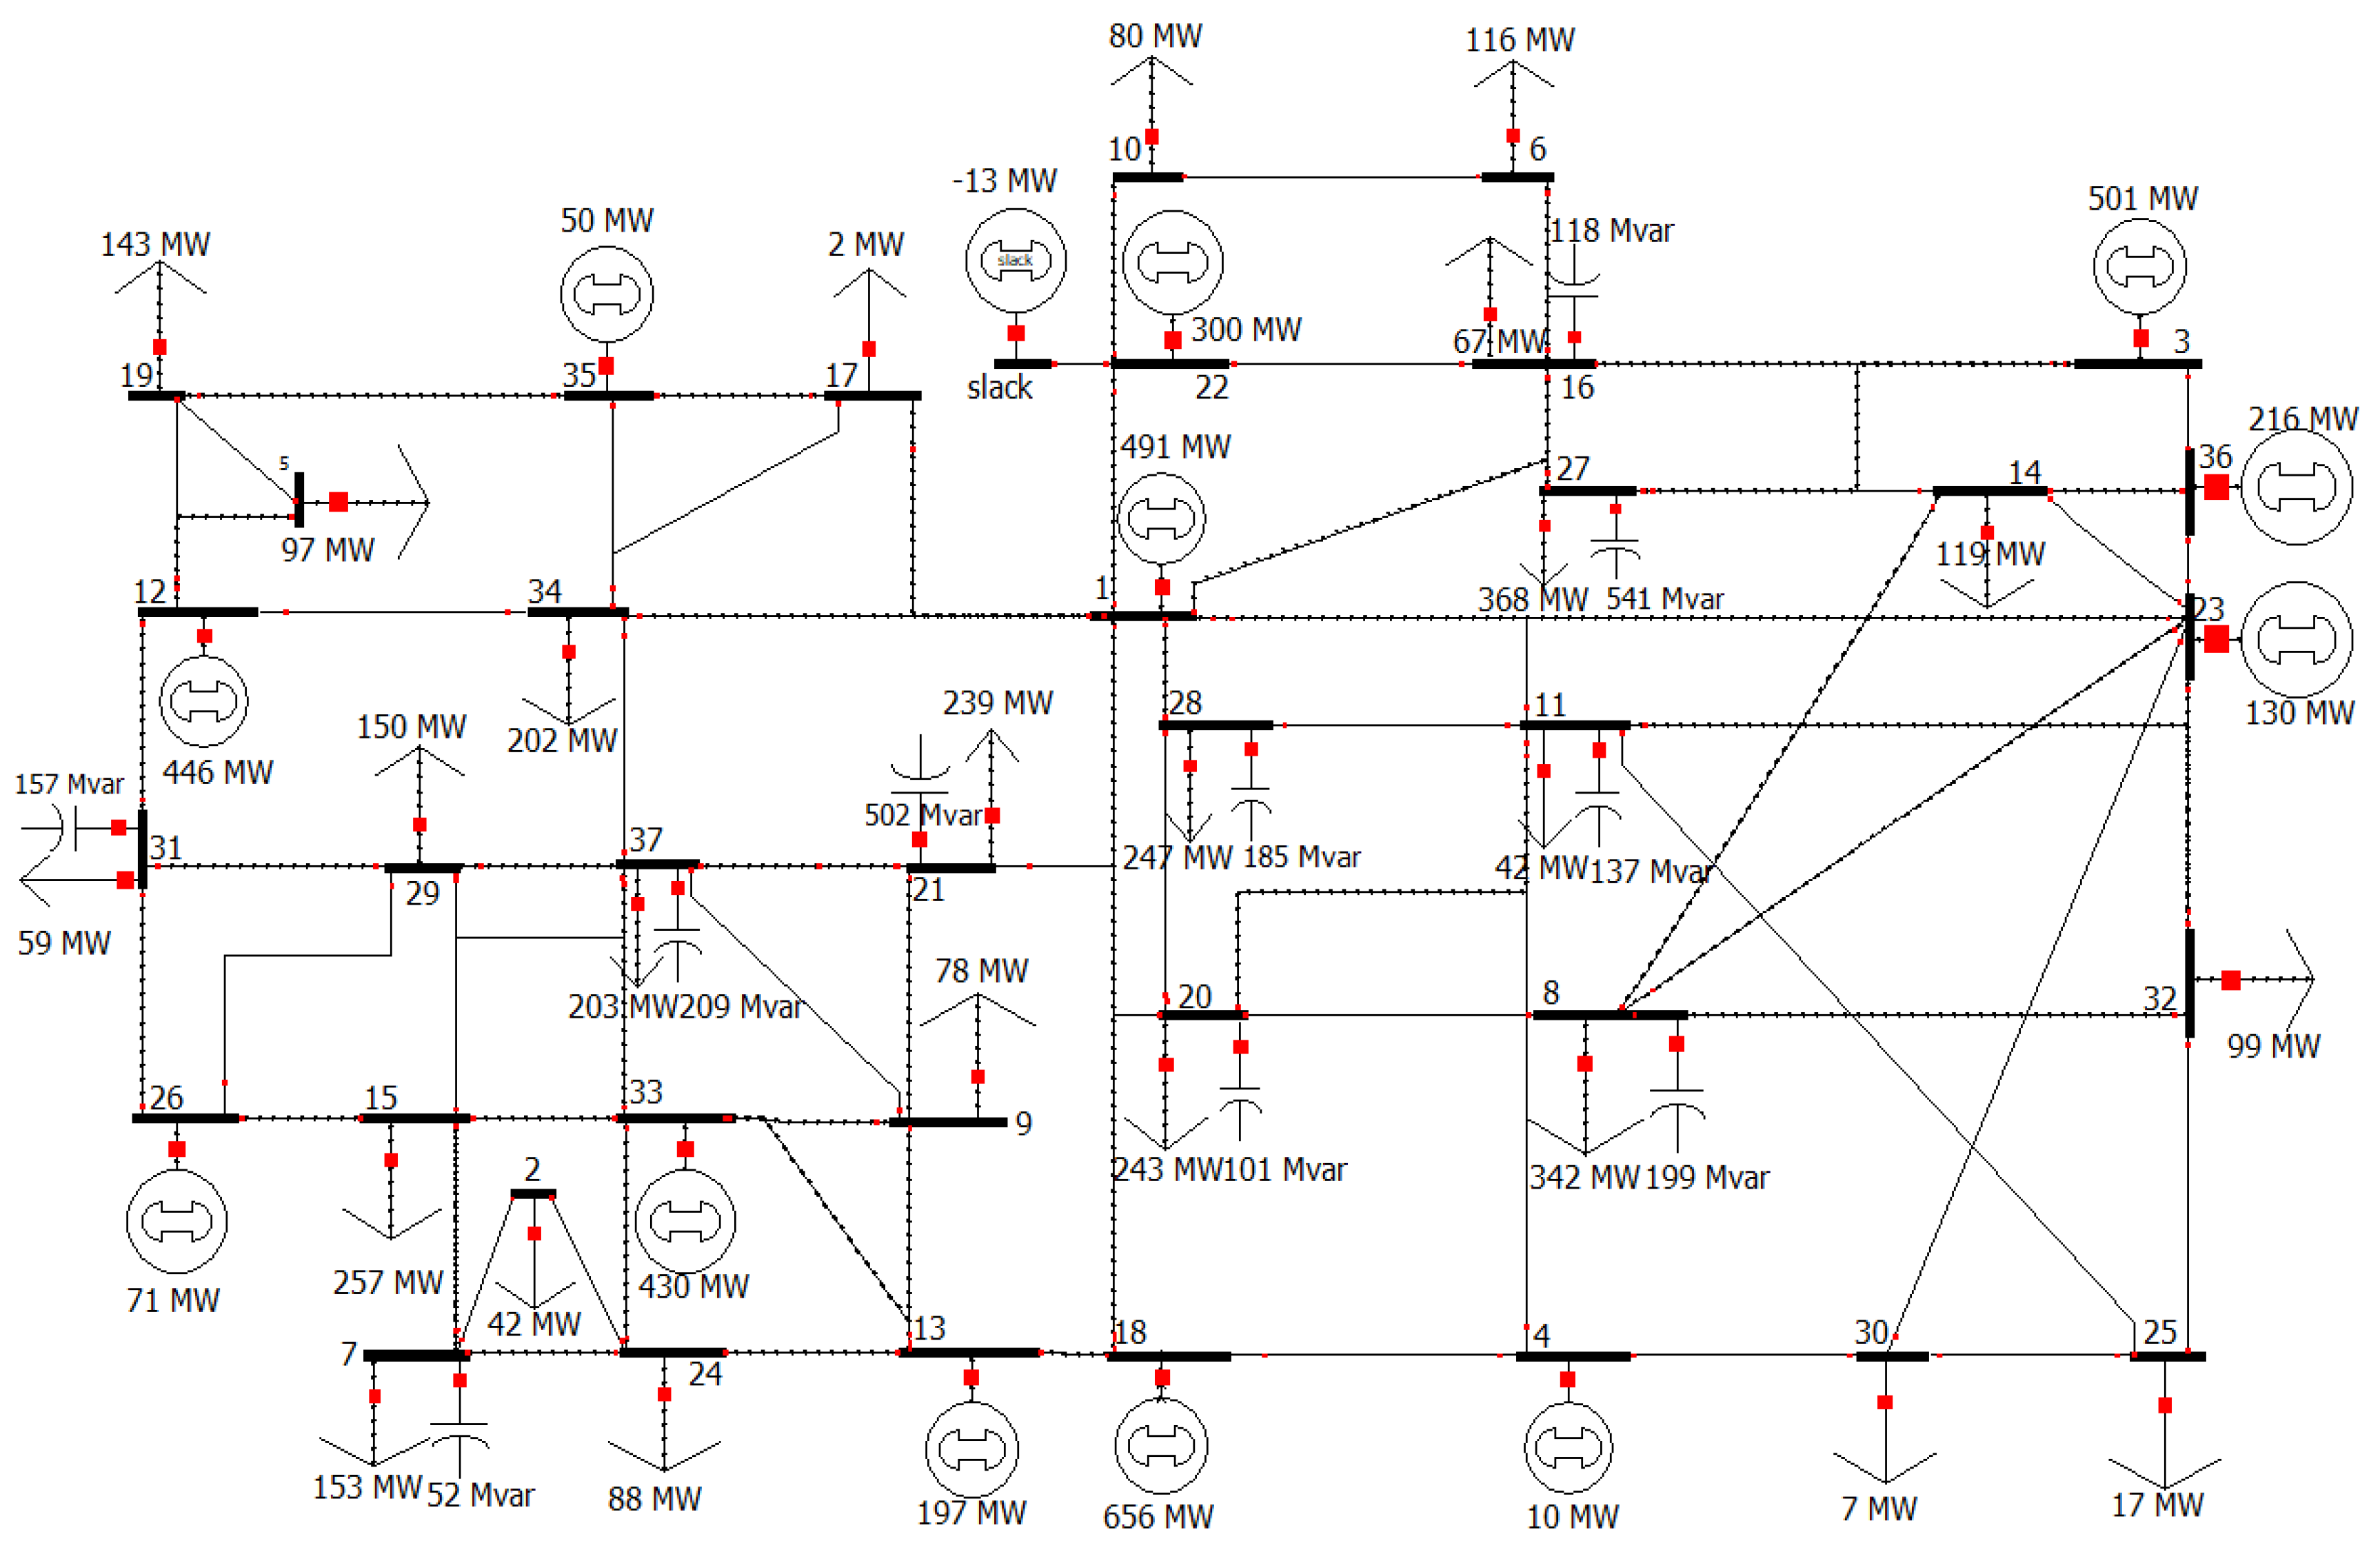
Figure 5 shows a one-line diagram of the reduced Korean power system, and Table 2 presents the information for the reduced system.
The performance of the equivalent model was evaluated by comparing the corresponding power flows through the original and reduced models. 
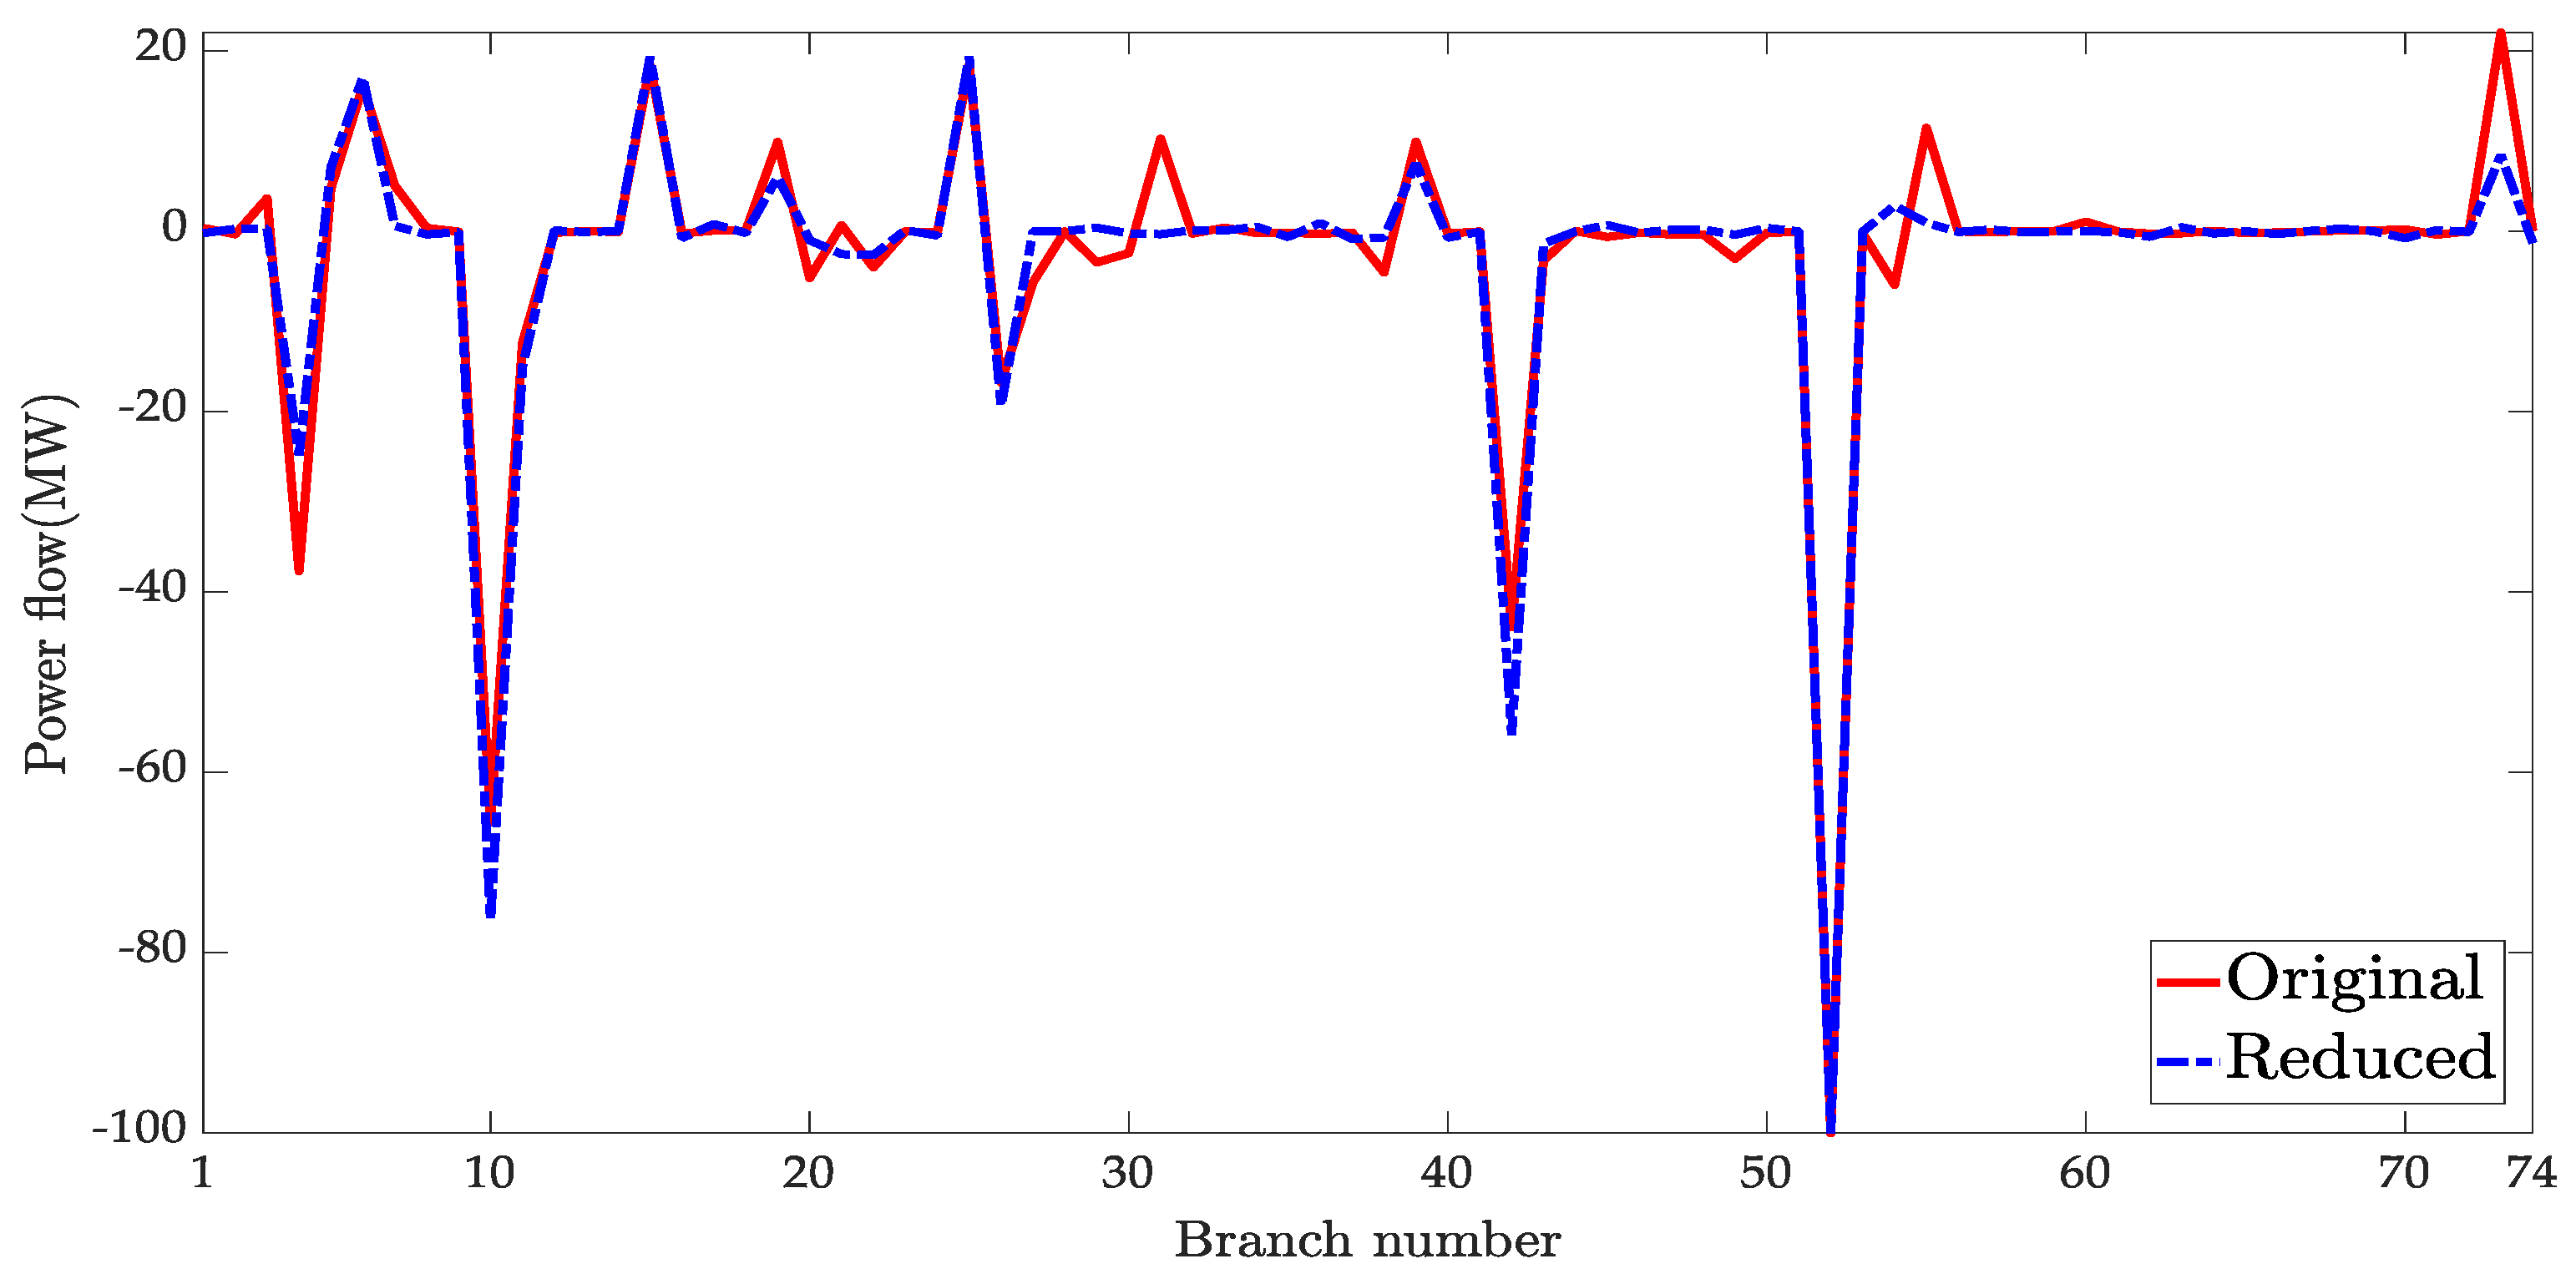
Figure 6 presents a simulation comparison. The power flows in the original model are a summation of power flows between the corresponding areas, with an average difference of 0.4 MW, and a maximum value of 22.5 MW. Figure 6 shows that the equivalent model correlates well with the original model. Therefore, the characteristics of the overall power flow among these areas can be maintained using the developed equivalent model.
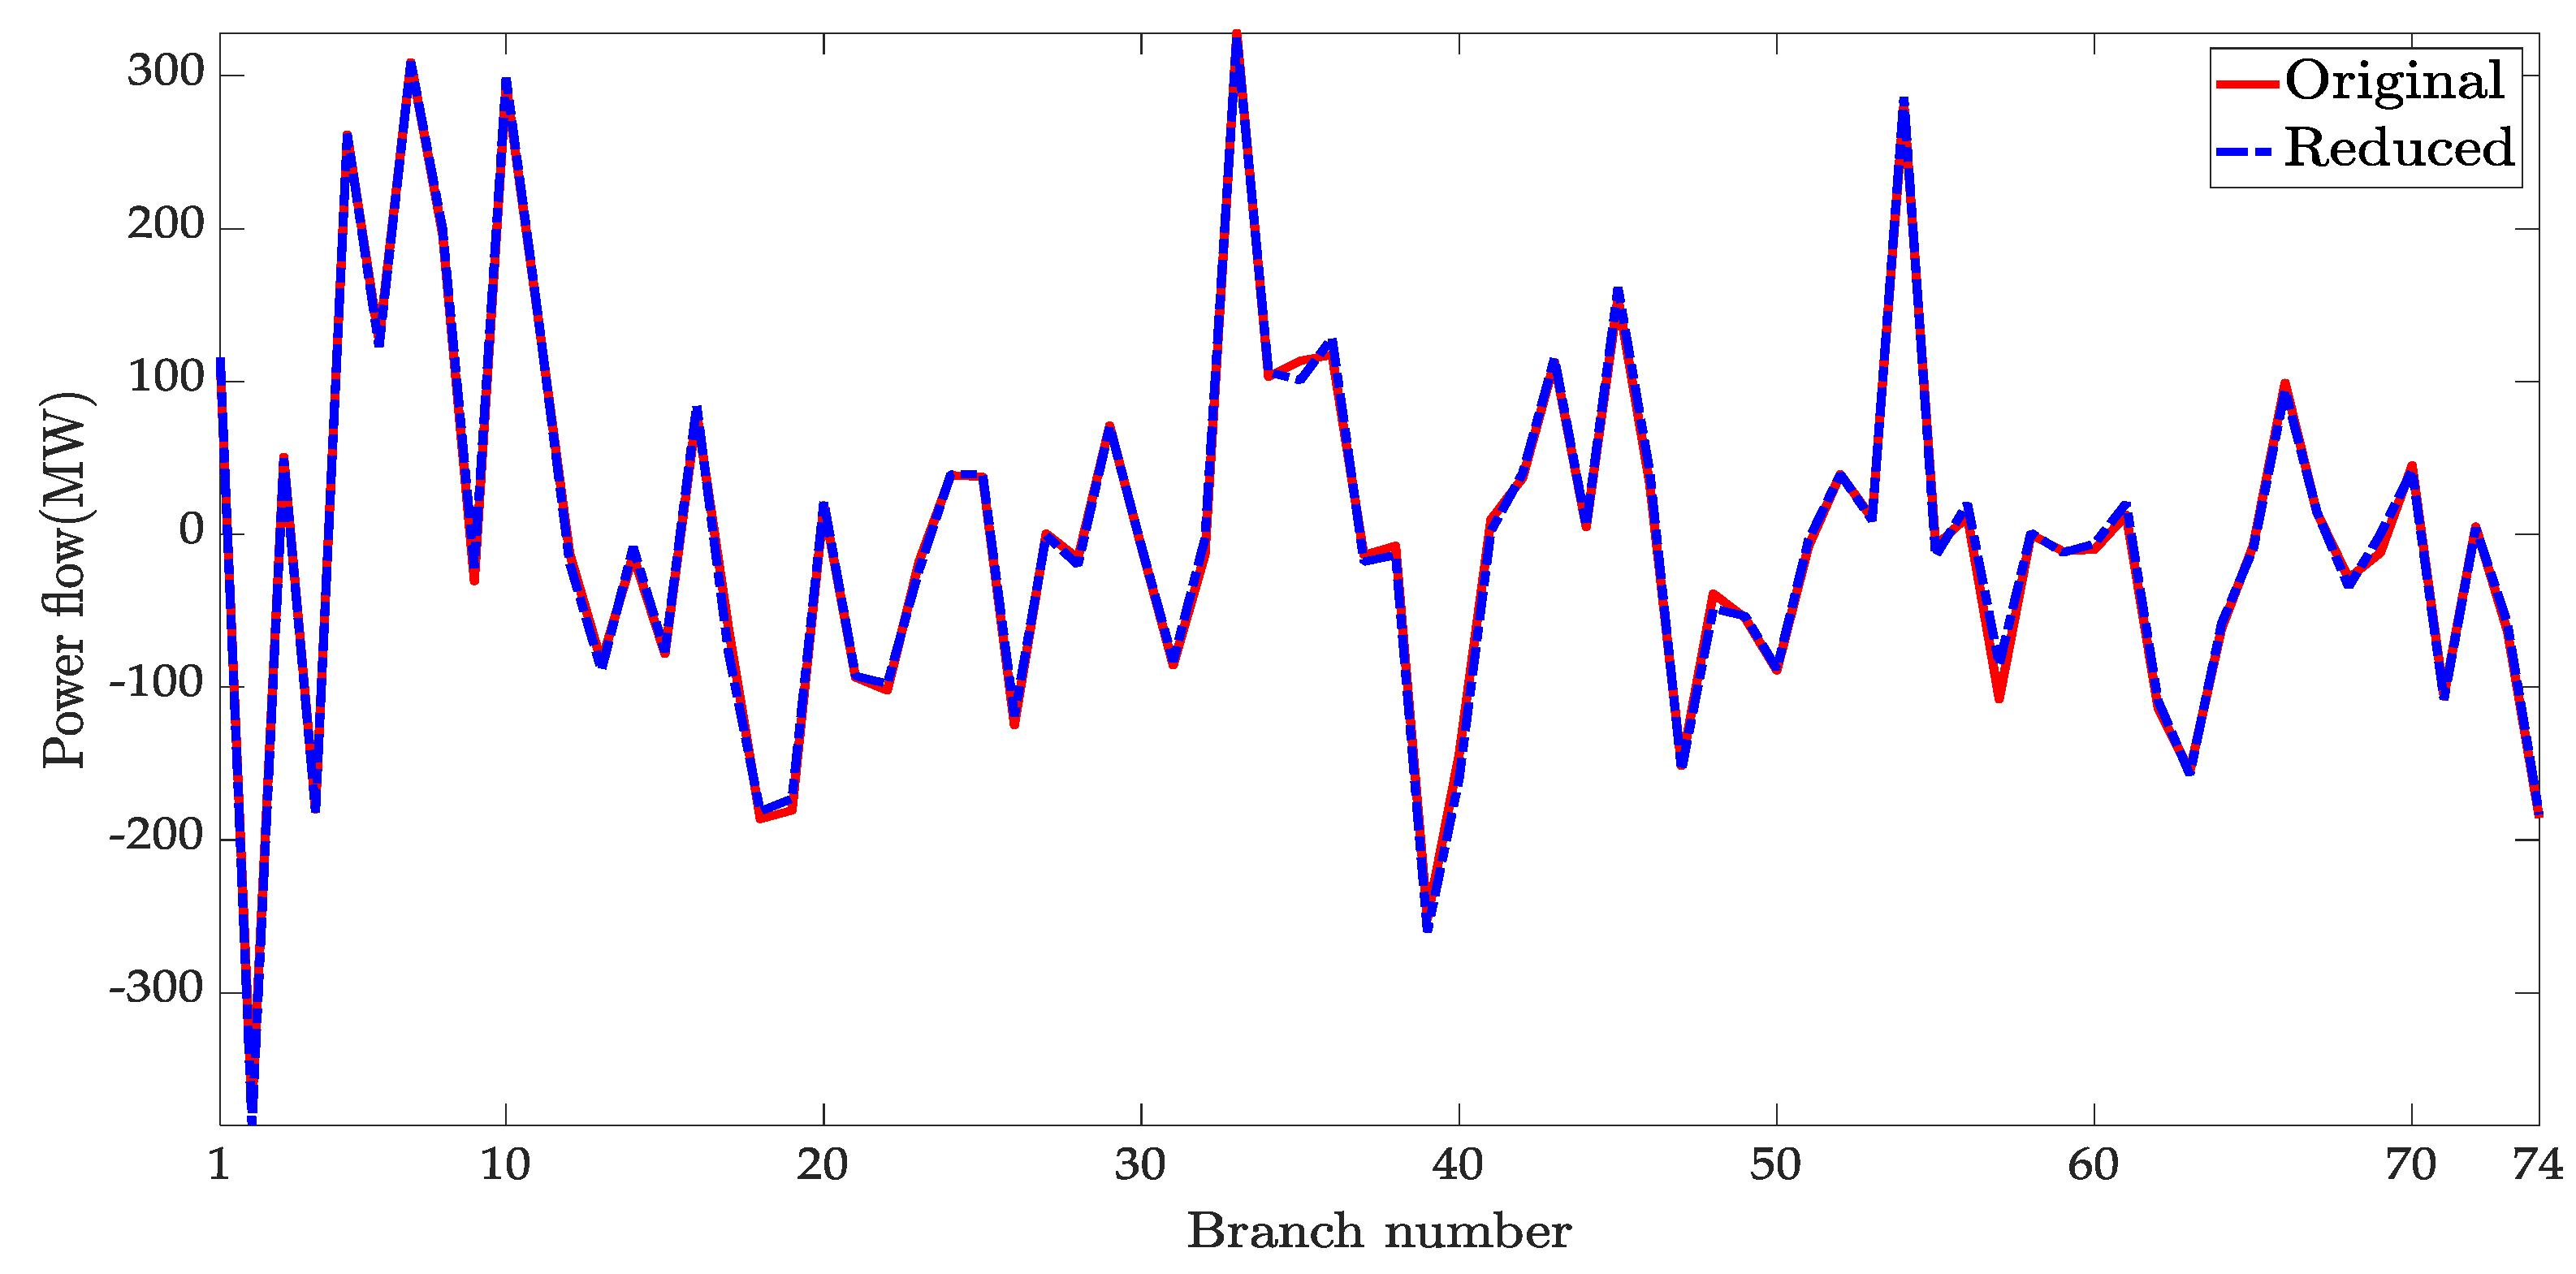
The performance of the equivalent model with a changed operating point was validated by injecting an additional 100 MW of real power into bus 3 in the reduced system. In Figure 7, the changes in the transmission line power flow with the additional injection at bus 3 and the original and reduced models are compared. The average power flow error is 0.49 MW with a maximum value of 15.52 MW. The reduced model achieves satisfactory simulation outcomes in power flow variations, including the amount and direction.
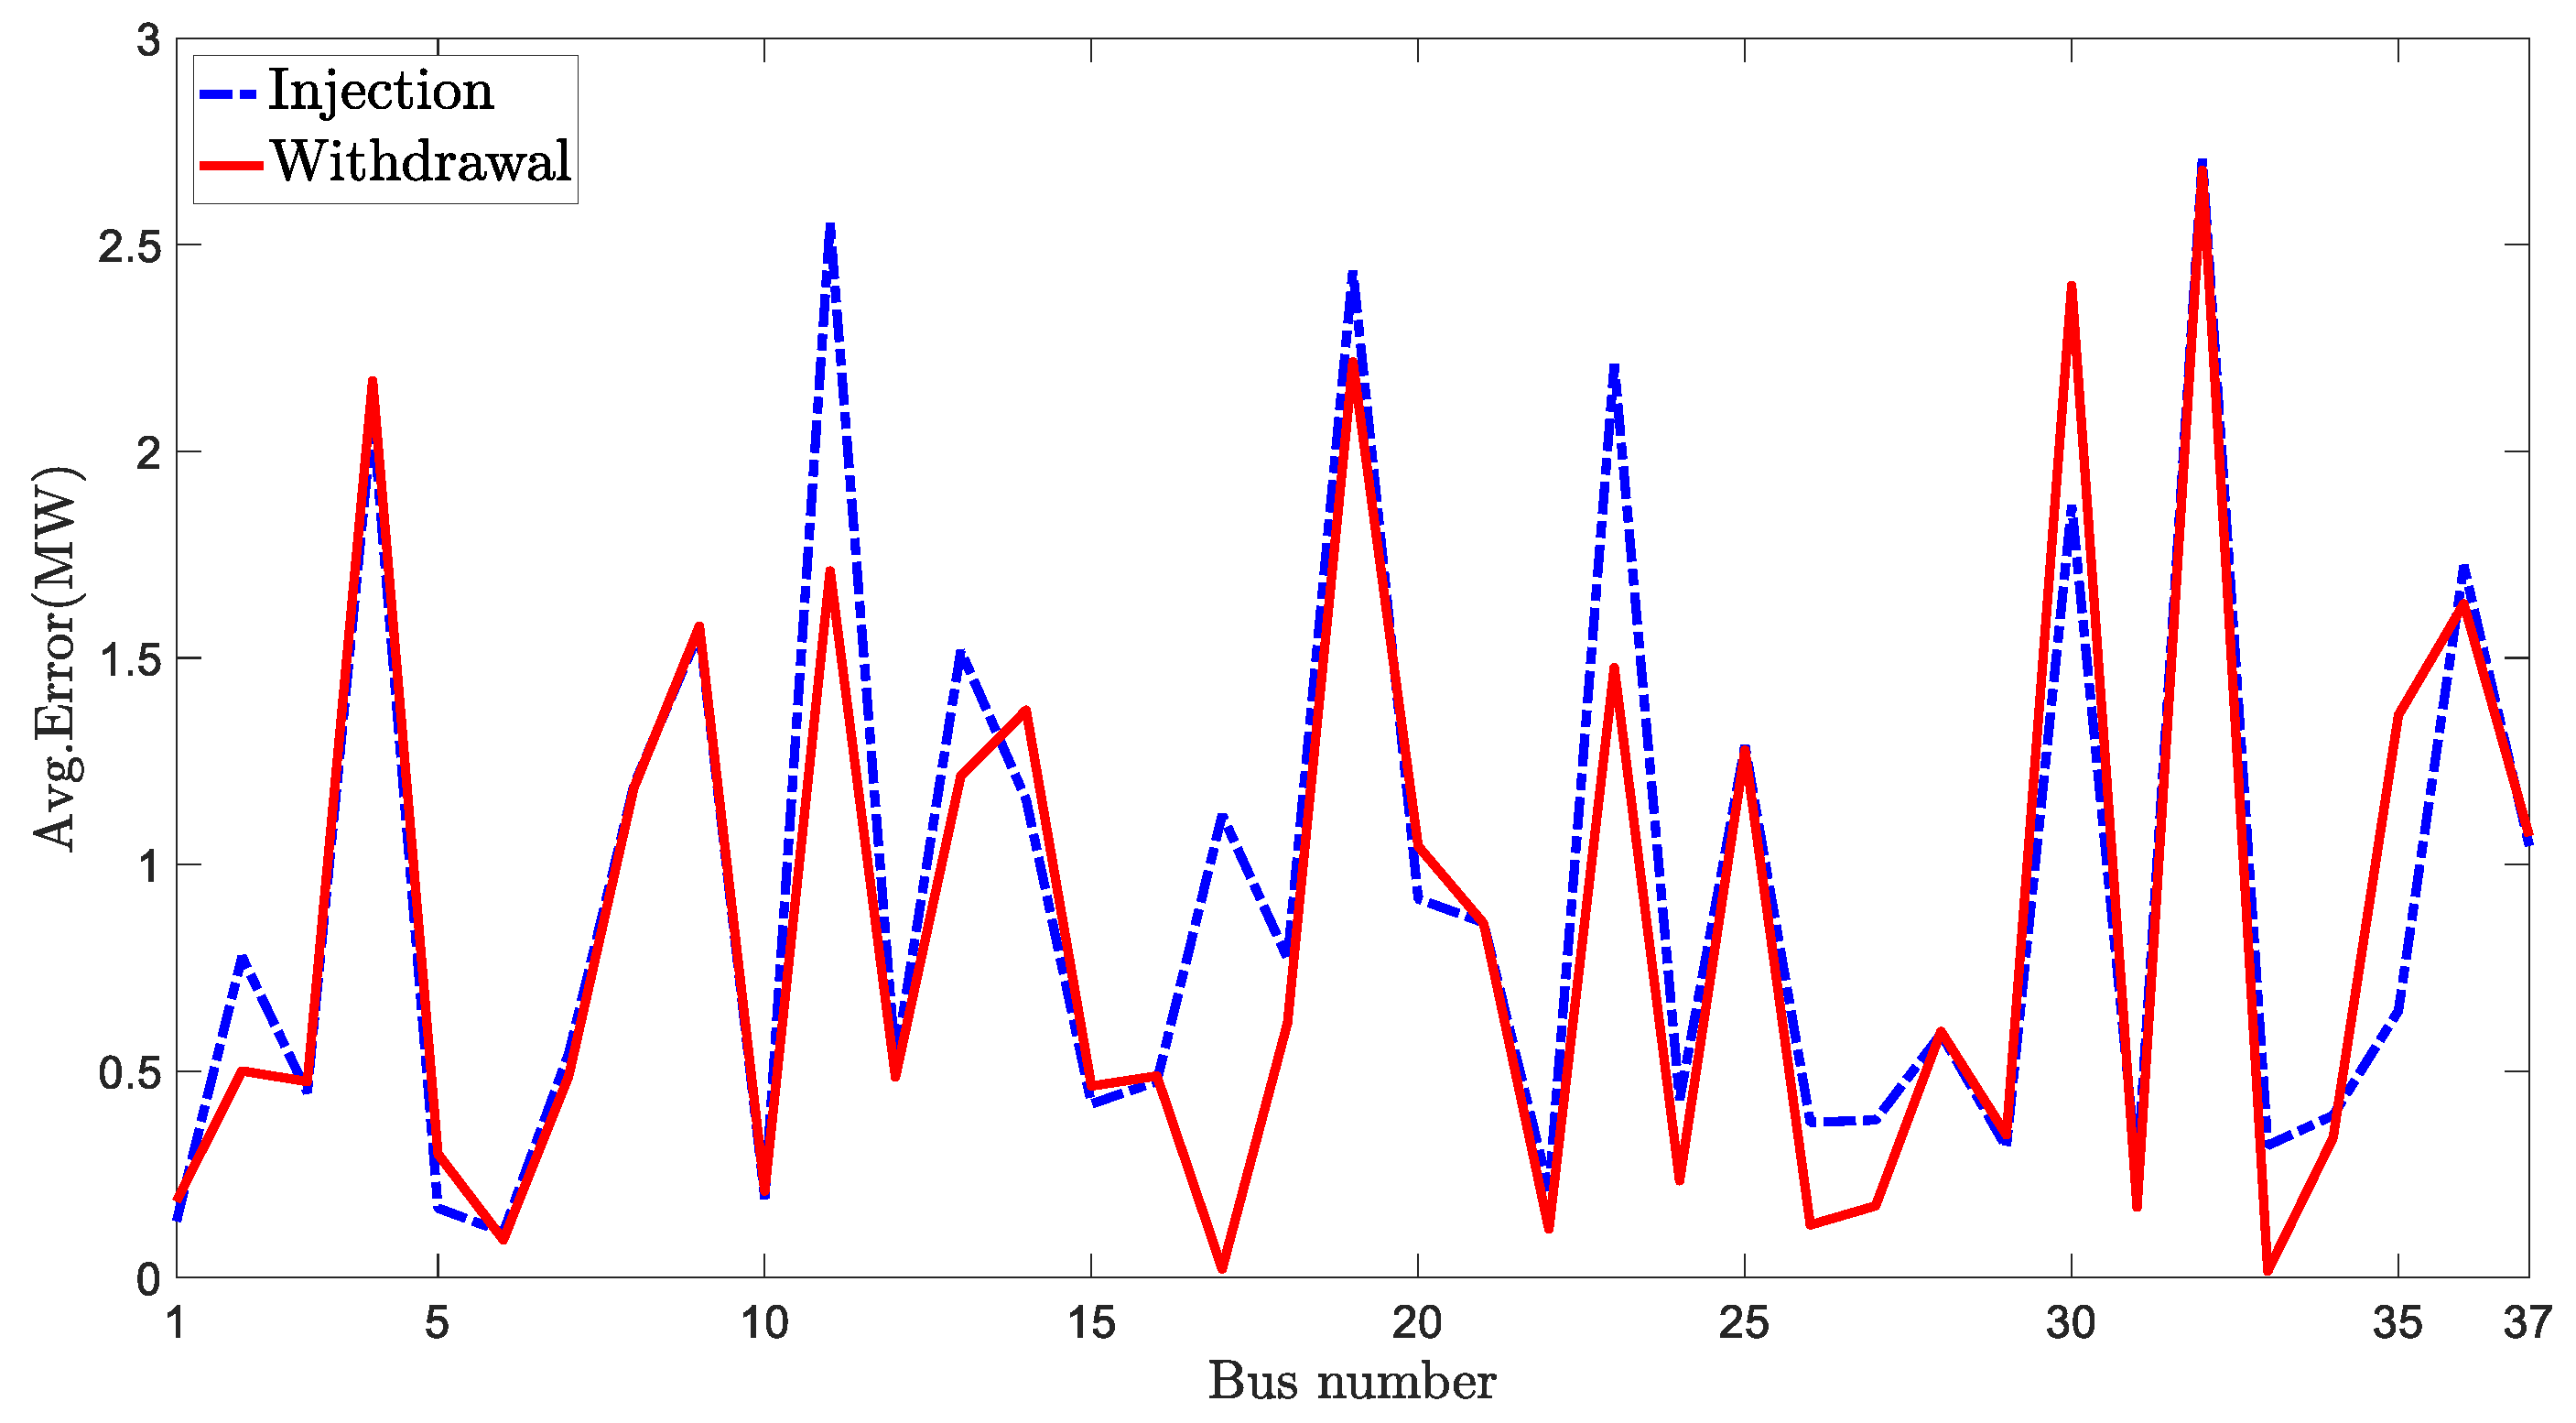
The previous evaluation for considering the changed operating point was extended to all the system buses. With the additional 100 MW injection or withdrawal at a bus, the differences of the real power flow variations between the original and the reduced systems were compared. The average errors with respect to the 100 MW change at the corresponding bus are presented in Figure 8. As shown in the Figure 8, the maximum value of the average error with the injection is 2.7 MW at bus 32 and the minimum value is 0.11 MW at bus 6. With the withdrawal, the maximum error is 2.7 MW at bus 32 and the minimum one is 0.02 MW at bus 33. The average errors are not large enough to produce a significant difference between two systems. Thus, even with the changed operating points from both injection and withdrawal, the power flow characteristics of the original system can be preserved with the reduced system.
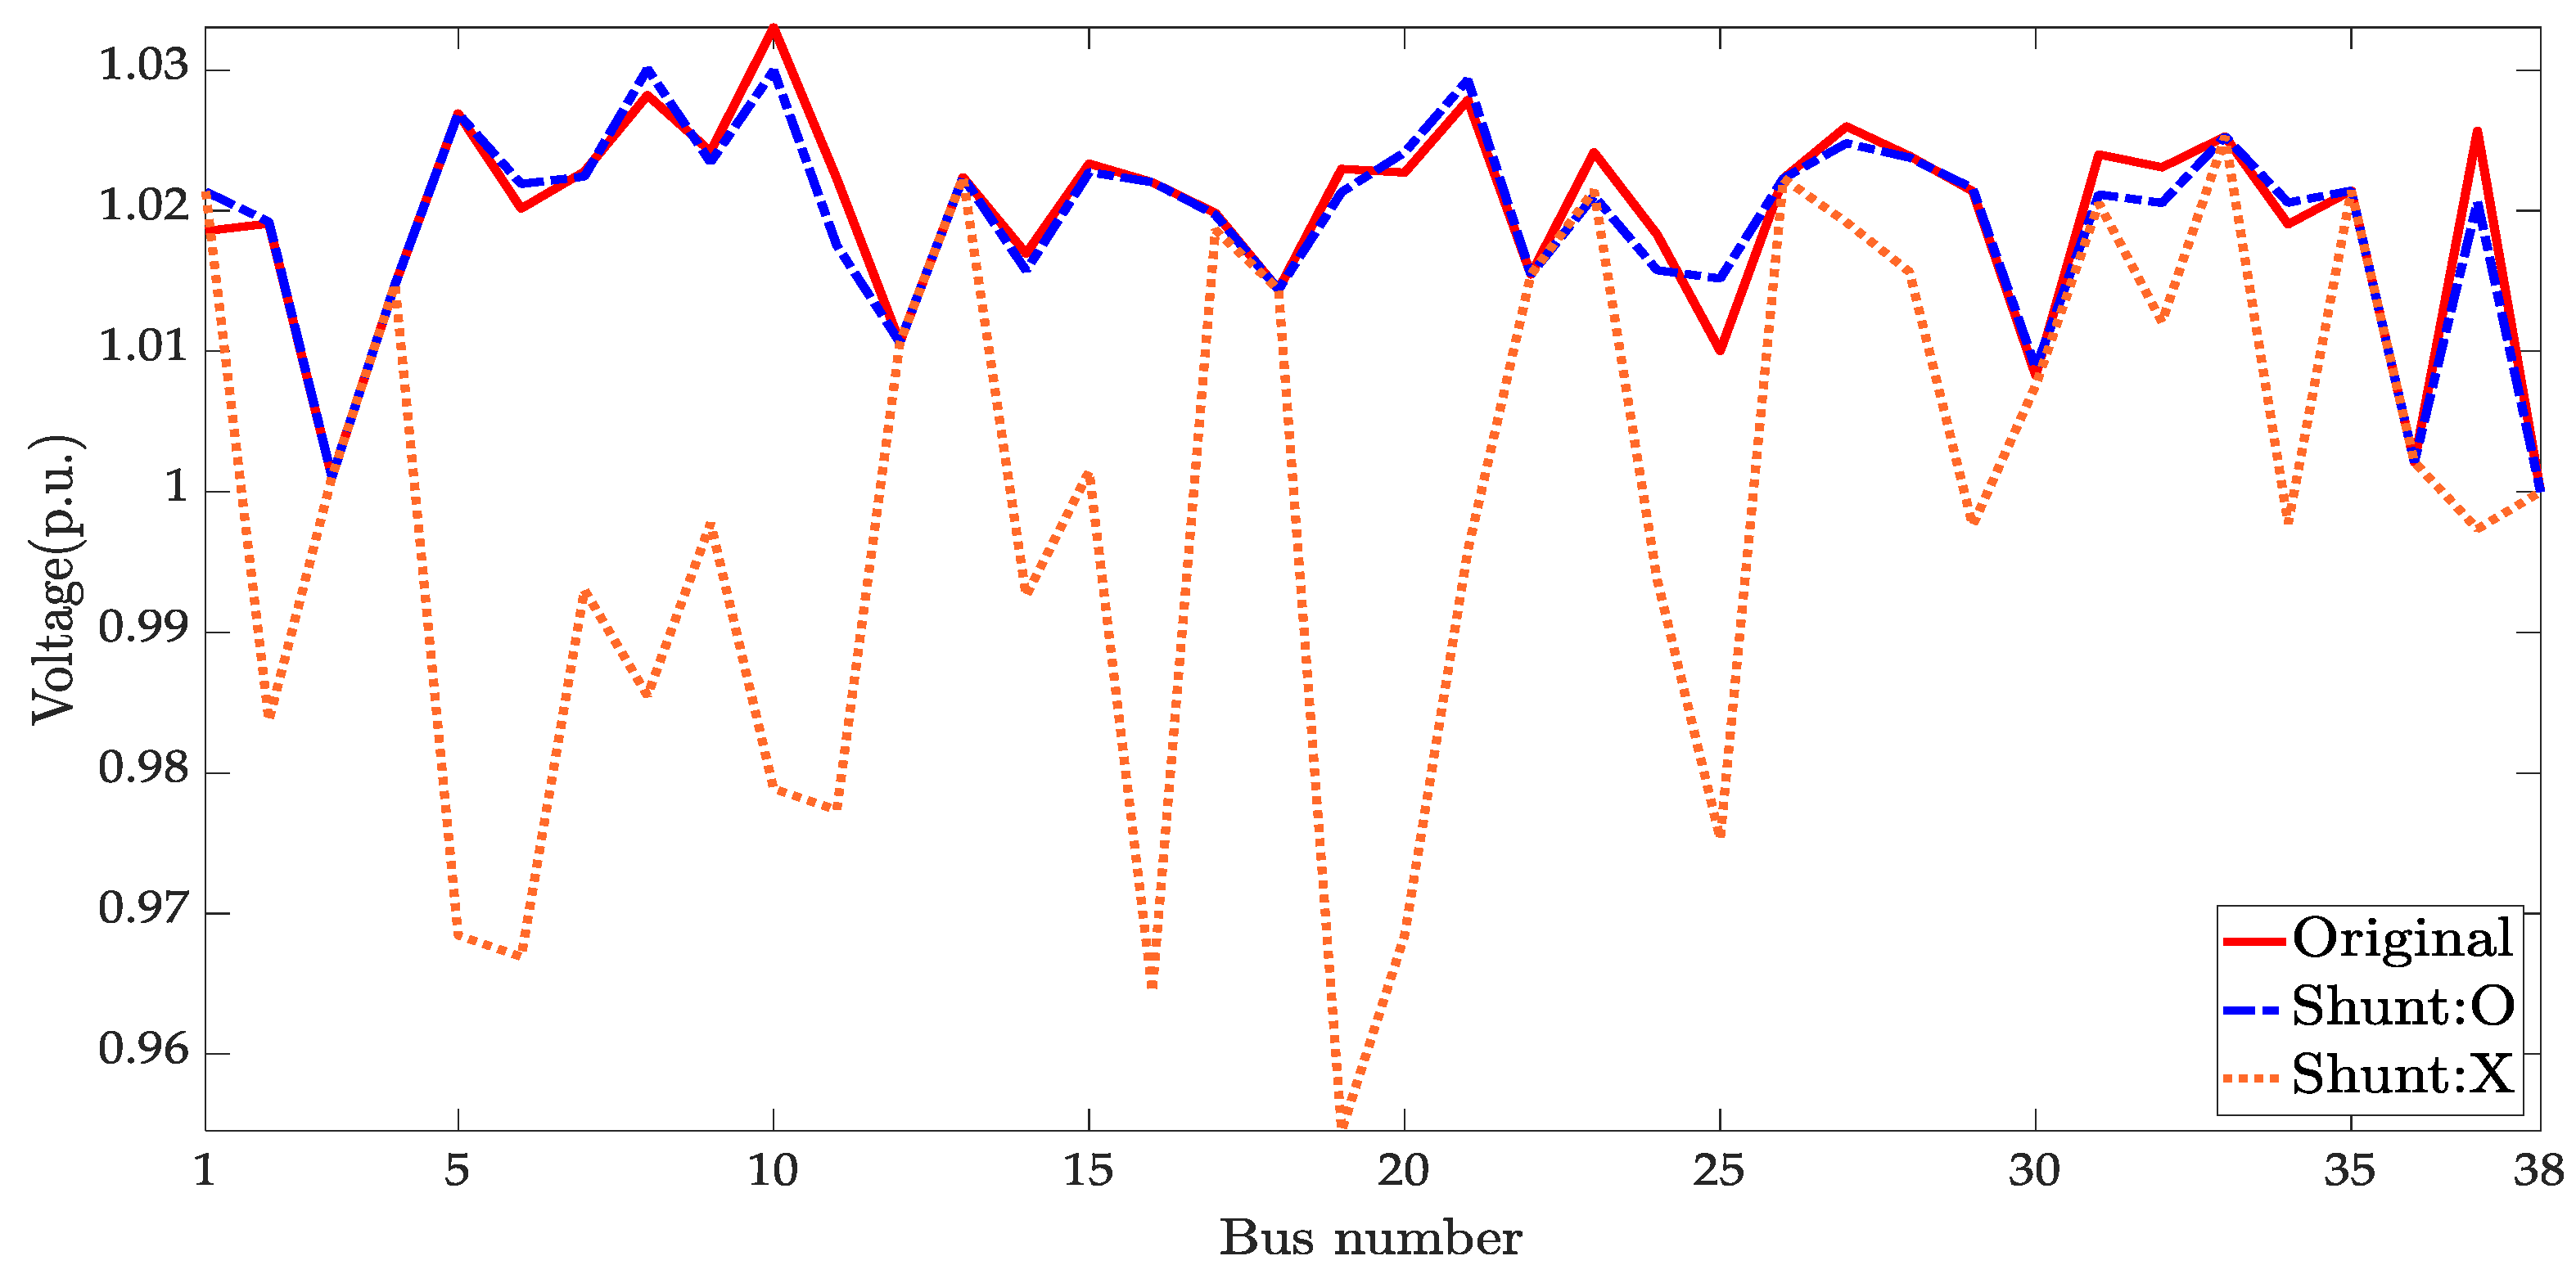
The average voltage of each group in the original system was compared with the corresponding bus voltage of the reduced system. For a generator bus in the reduced system, the voltage magnitude was set to the average cluster voltage magnitude in the original system. For a load bus, an additional shunt capacitor was provided, matching the average voltage level. Ten shunt capacitors were added to the reduced system. Figure 9 presents a comparison of the bus voltage magnitudes in the original and reduced systems. The maximum difference in the voltage magnitude was less than 0.005 p.u. For comparison, the voltage magnitudes before and after adding the shunts were analyzed. The results show that the reduced system without the shunt compensation shows a greater deviation from the original system voltage characteristics, whereas the reduced system with the compensation exhibits a negligible difference.
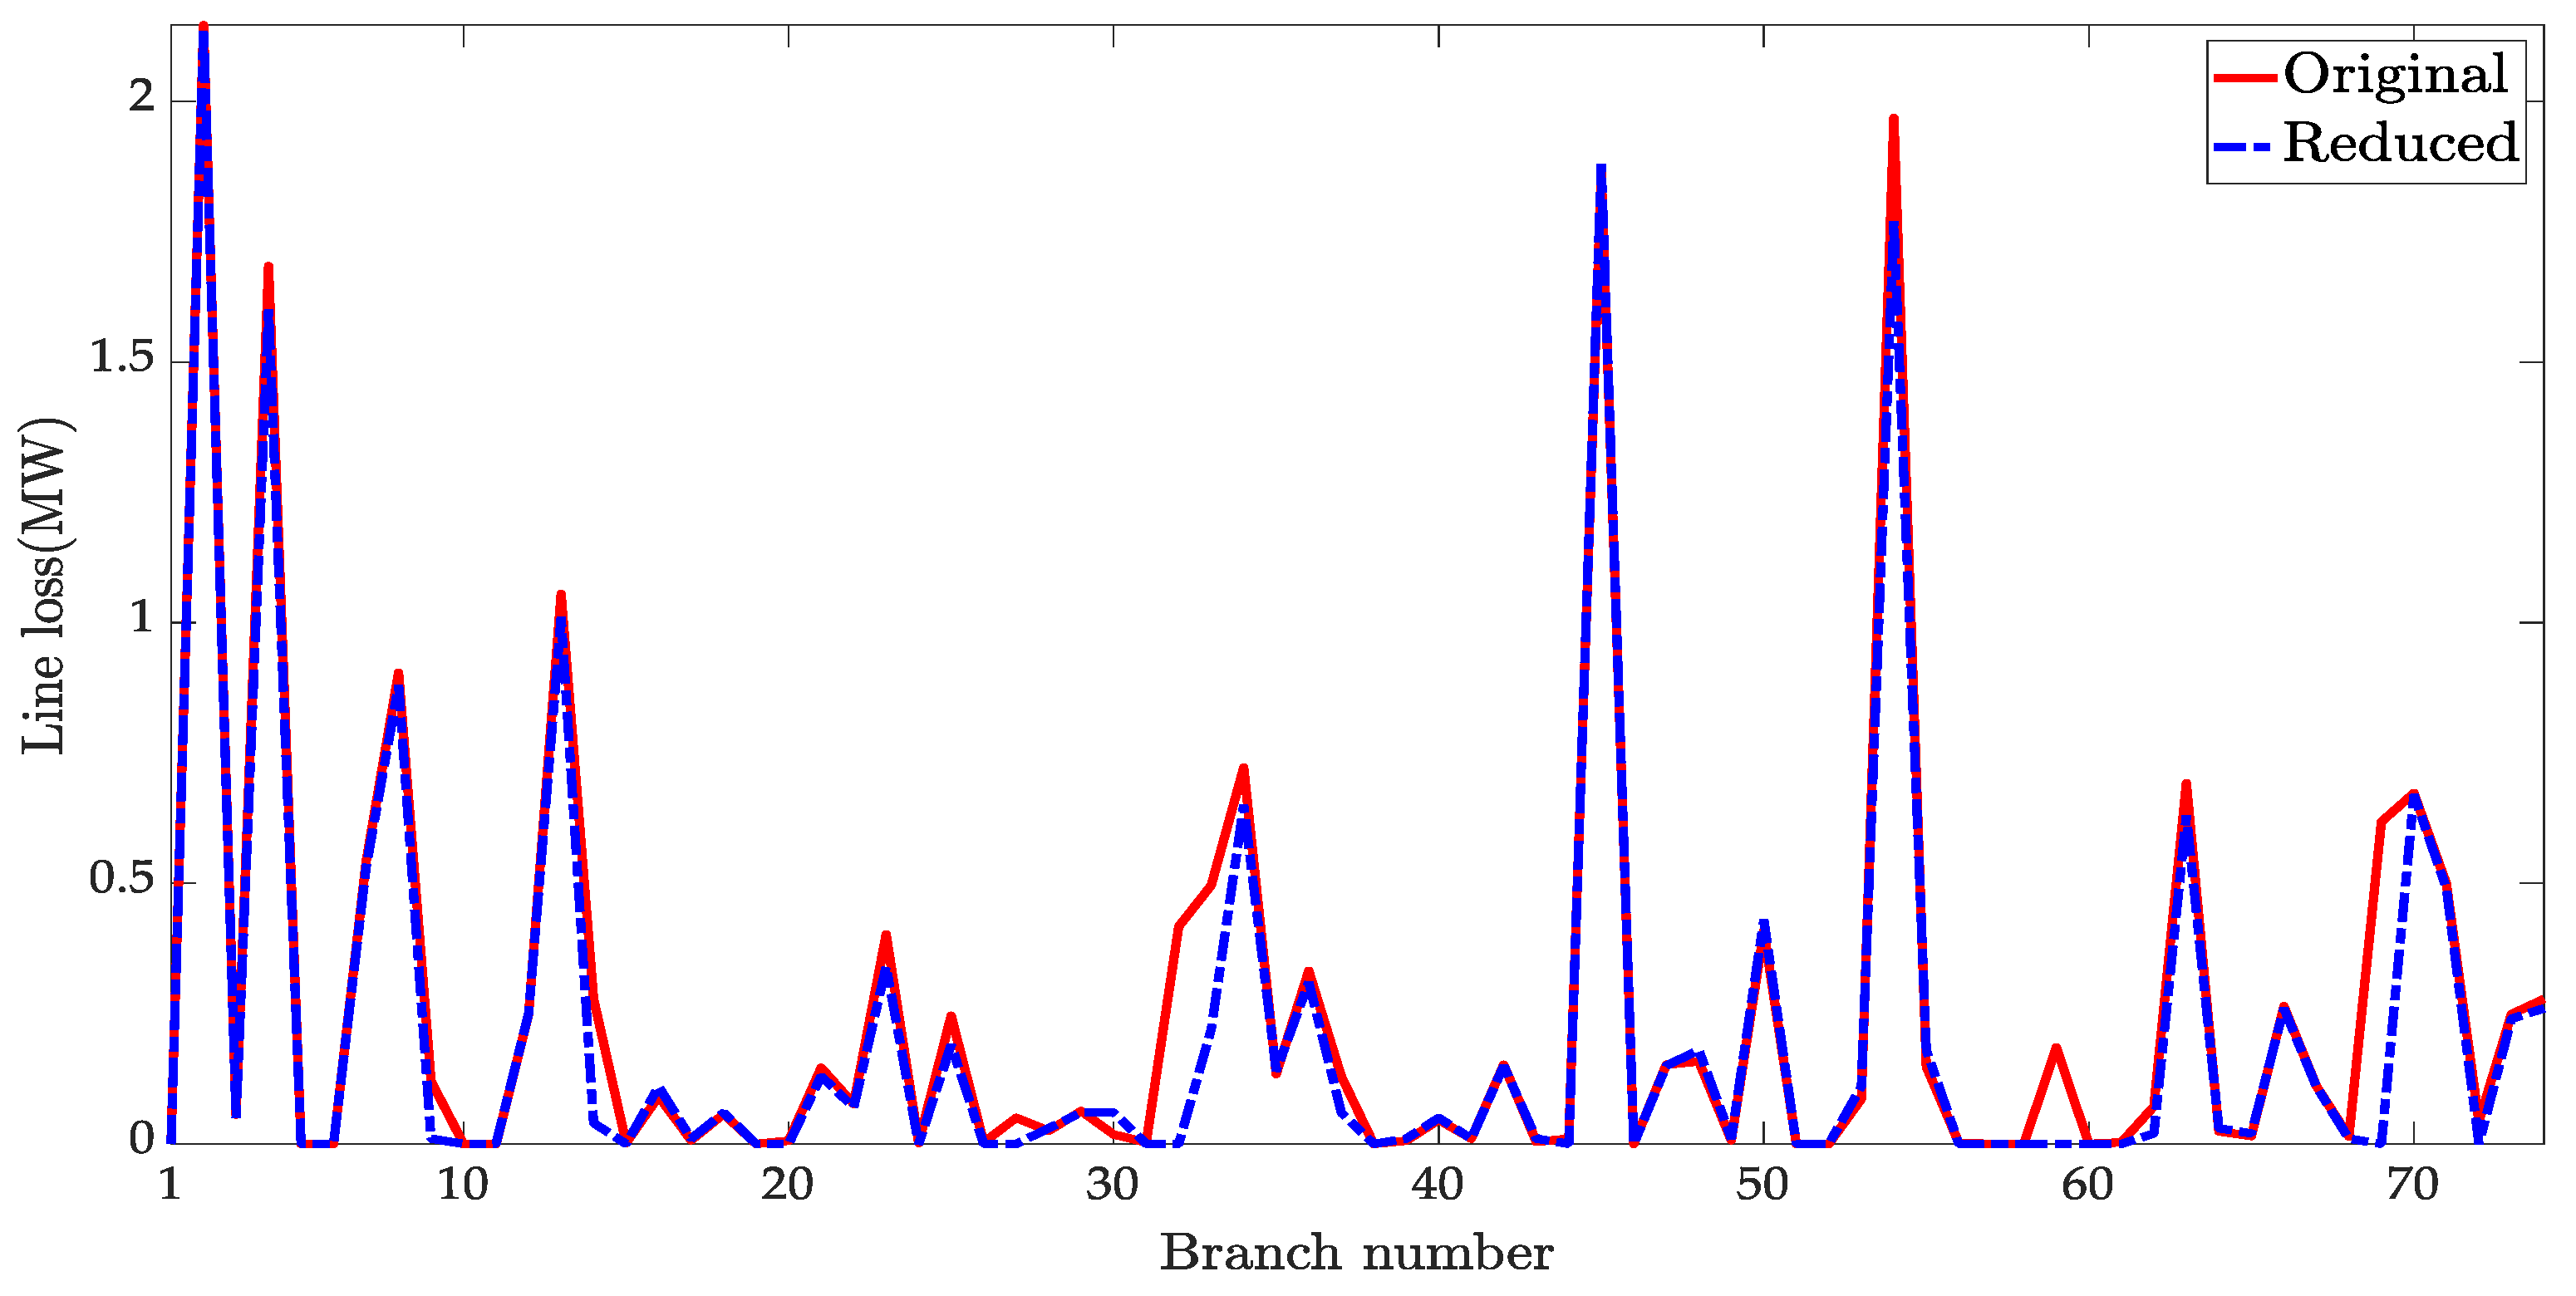
Figure 10 shows the comparison of the real power losses between the reduced and original systems. Total transmission line losses are 19.2 MW in the original system, which is 0.22% of the total power flow. The reduced model preserves 16.6 MW of the line losses when line resistances are added using Equation (8). Thus, the overall system MW balance of the reduced model is improved with line loss compensation.
Table 3 shows the comparison of real power errors between the original and reduced models. In Table 3, all real power flows and losses over transmission lines for the entire system are summed. The average error in inter-area power flows is less than 1%. The total real power losses have an error of 2.6 MW, which is a small amount compared to the total line power flows.

4. Conclusions

This study developed a static equivalent model for Korean power systems using a PTDF-based k-means++ algorithm. The reduced system represents the power flows between areas as close to the original system as possible. The equivalent model was created following five steps, namely: (1) identification of the clusters using Euclidean distance with PTDF matrix and k-means++ algorithm, (2) aggregating the bus groups and converting them into a single generator or load bus, (3) determining the equivalent line impedance, (4) setting the voltage magnitude to the average value of the cluster, and (5) compensating for real power line losses. A large practical Korean power system with more than 1600 buses and over 85 GW of generation capacity was reduced to a 38-bus system with 13 generators, 25 loads, and 74 transmission lines. The performance of the reduced model was evaluated regarding its ability to preserve the characteristics of the original system by comparing the power flows, voltage magnitudes, and real power losses of the reduced and original models. The average power flow error was 0.4 MW, and even with the changed operating point from additional 100 MW injection or withdrawal at all buses, the average error was not large enough. Therefore, the developed equivalent model maintains the overall power flow characteristics of the original Korean power system. The developed equivalent Korean power system can be used for research and education purposes without confidentiality issues of critical energy infrastructure information. Undergraduate and graduate students will have more learning opportunities and experience of the specific characteristics of Korean power systems. As a continuation of this work, a dynamic reduced model focusing on preserving inter-area oscillations will be developed based on the static equivalent model.

Author Contributions

Conceptualization, S.K.; methodology, B.-G.L., J.L. and S.K.; investigation, B.-G.L. and S.K.; writing—original draft preparation, B.-G.L. and S.K.; writing—review and editing, B.-G.L., J.L. and S.K.; visualization, B.-G.L.; supervision, S.K.; funding acquisition, S.K. All authors have read and agreed to the published version of the manuscript.

Funding

This research was funded by Korea Electric Power Corporation, grant number: R19XO01-03.

Acknowledgments

This research was supported by Korea Electric Power Corporation (Grant number: R19XO01-03).

Conflicts of Interest

The authors declare no conflict of interest.

References

  1. Ward, J.B. Equivalent circuits for power-flow studies. Electr. Eng. 1949, 68, 794. [Google Scholar] [CrossRef]
  2. Deckmann, S.; Pizzolante, A.; Monticelli, A.; Stott, B.; Alsac, O. Numerical Testing of Power System Load Flow Equivalents. IEEE Trans. Power Appar. Syst. 1980, 99, 2292–2300. [Google Scholar] [CrossRef]
  3. Machowski, J.; Bialek, J.; Bumby, J. Power System Dynamics: Stability and Control; Wiley: Chichester, UK, 2008. [Google Scholar]
  4. Annakkage, U.; Nair, N.K.C.; Liang, Y.; Gole, A.; Dinavahi, V.; Gustavsen, B.; Noda, T.; Ghasemi, H.; Monti, A.; Matar, M.; et al. Dynamic system equivalents: A survey of available techniques. IEEE Trans. Power Deliv. 2012, 27, 411–420. [Google Scholar] [CrossRef]
  5. Mihai, G.; Ovidiu, I.; Gilda, G. REI equivalent design for electric power systems with genetic algorithms. WSEAS Trans. Circuits Syst. 2008, 7, 911–921. [Google Scholar]
  6. Cheng, X.; Overbye, T. PTDF-Based Power System Equivalents. IEEE Trans. Power Syst. 2005, 20, 1868–1876. [Google Scholar] [CrossRef]
  7. Kumar, A.; Srivastava, S.C.; Singh, S.N. A Zonal Congestion Management Approach Using Real and Reactive Power Rescheduling. IEEE Trans. Power Syst. 2004, 19, 554–562. [Google Scholar] [CrossRef]
  8. Wang, F.; Hedman, K.W. Reserve zone determination based on statistical clustering methods. In Proceedings of the 2012 North American Power Symposium (NAPS), Champaign, IL, USA, 9–11 September 2012; pp. 1–6. [Google Scholar]
  9. Chicco, G.; Napoli, R.; Piglione, F. Comparisons Among Clustering Techniques for Electricity Customer Classification. IEEE Trans. Power Syst. 2006, 21, 933–940. [Google Scholar] [CrossRef]
  10. Shi, D.; Tylavsky, D.J. A Novel Bus-Aggregation-Based Structure-Preserving Power System Equivalent. IEEE Trans. Power Syst. 2014, 30, 1977–1986. [Google Scholar] [CrossRef]
  11. Boukarim, G.; Wang, S.; Chow, J.; Taranto, G.; Martins, N. A comparison of classical, robust, and decentralized control designs for multiple power system stabilizers. IEEE Trans. Power Syst. 2000, 15, 1287–1292. [Google Scholar] [CrossRef]
  12. Gibbard, D.V.M. Simplified 14-Generator Model of the South East Australian Power System; The University of Adelaide: Adelade, Australia, 2014; Available online: http://www.eleceng.adelaide.edu.au/Groups/PCON/PowerSystems/IEEE/BenchmarkData/Simplified_14-Gen_System_Rev3_20100701.pdf (accessed on 17 December 2020).
  13. Kouba, N.E.Y.; Menaa, M.; Hasni, M.; Tehrani, K.; Boudour, M. A novel optimized fuzzy-PID controller in two-area power system with HVDC link connection. In Proceedings of the 2016 International Conference on Control, Decision and Information Technologies (CoDIT), Saint Julian’s, Malta, 6–8 April 2016; IEEE: New York, NY, USA, 2016. [Google Scholar]
  14. Wood, A.J.; Wollenberg, B.F.; Sheblé, G.B. Power Generation, Operation, and Control; John Wiley & Sons: New York, NY, USA, 2013. [Google Scholar]
  15. Zhu, Y.; Tylavsky, D. An Optimization-Based DC-Network Reduction Method. IEEE Trans. Power Syst. 2018, 33, 2509–2517. [Google Scholar] [CrossRef]
  16. Purchala, K.; Haesen, E.; Meeus, L.; Belmans, R. Zonal network model of European interconnected electricity network. In Proceedings of the International Symposium CIGRE/IEEE PES, San Antonio, TX, USA, 5–7 October 2005; pp. 362–369. [Google Scholar]
  17. Arthur, D.; Vassilvitskii, S. kmeans++: The advantages of careful seeding. In Proceedings of the ACM-SIAM Symposium on Discrete Algorithms, New Orleans, LA, USA, 7–9 January 2007; pp. 1027–1035. [Google Scholar]
  18. Aggarwal, C.C.; Gates, S.C.; Yu, P.S. On the merits of building categorization systems by supervised clustering. In Proceedings of the Fifth ACM SIGKDD International Conference on Knowledge Discovery and Data Mining, San Diego, CA, USA, 15–18 August 1999; pp. 352–356. [Google Scholar]
  19. Shi, D.; Tylavsky, D.J. An improved bus aggregation technique for generating network equivalents. In Proceedings of the 2012 IEEE Power and Energy Society General Meeting, San Diego, CA, USA, 22–26 July 2012; pp. 1–8. [Google Scholar]
Figure 1. Formulation of the power transfer distribution factor (PTDF) matrix.
Energies 13 06663 g001
Figure 2. Clustering process using the k-means++ algorithm. (a) First centroid selection. (b) Second centroid selection. (c) Third centroid selection. (d) Result of clustering.
Energies 13 06663 g002
Figure 3. Flowchart for developing the equivalent model.
Energies 13 06663 g003
Figure 4. Geographic representation of the reduced 38-bus Korean power system.
Energies 13 06663 g004
Figure 5. One-line diagram of the reduced 38-bus Korean power system.
Energies 13 06663 g005
Figure 6. Comparison of real power flows over transmission lines.
Energies 13 06663 g006
Figure 7. Variation in transmission line power flows with 100 MW injection into bus 3.
Energies 13 06663 g007
Figure 8. Average errors of transmission line power flows with 100 MW injection or withdrawal into each bus.
Energies 13 06663 g008
Figure 9. Comparison of bus voltage magnitudes.
Energies 13 06663 g009
Figure 10. Real power losses of transmission lines.
Energies 13 06663 g010
Table 1. Korean electric power system information used in this study.
NumbersMWMvar
Generators44585,606.922,349.4
Loads144385,625.425,553.6
Switched shunts3770−7478.8
Buses1692
Branches3309
Table 2. Reduced Korean power system information.
NumbersMWMvar
Generators133488.8−789.3
Loads253459.81617.8
Switched shunts100−2193.8
Buses38
Branches74
Table 3. Comparison of real power errors.
Original Model
(A)
Reduced Model
(B)
Comparison
between Two Models
(=|A–B|/A * 100%)
Total line power flows (MW)6566.46609.40.65%
Total real power losses (MW)19.216.613.5%
Publisher’s Note: MDPI stays neutral with regard to jurisdictional claims in published maps and institutional affiliations.

