Power Split Supercharging: A Mild Hybrid Approach to Boost Fuel Economy †


Abstract
:1. Introduction
2. Experimental Hardware and Model Framework
3. Energy Management System
3.1. Global Fuel Consumption Minimization
3.2. Equivalent Consumption Minimization Strategy
- Torque assist mode ():
- Boosting mode ():
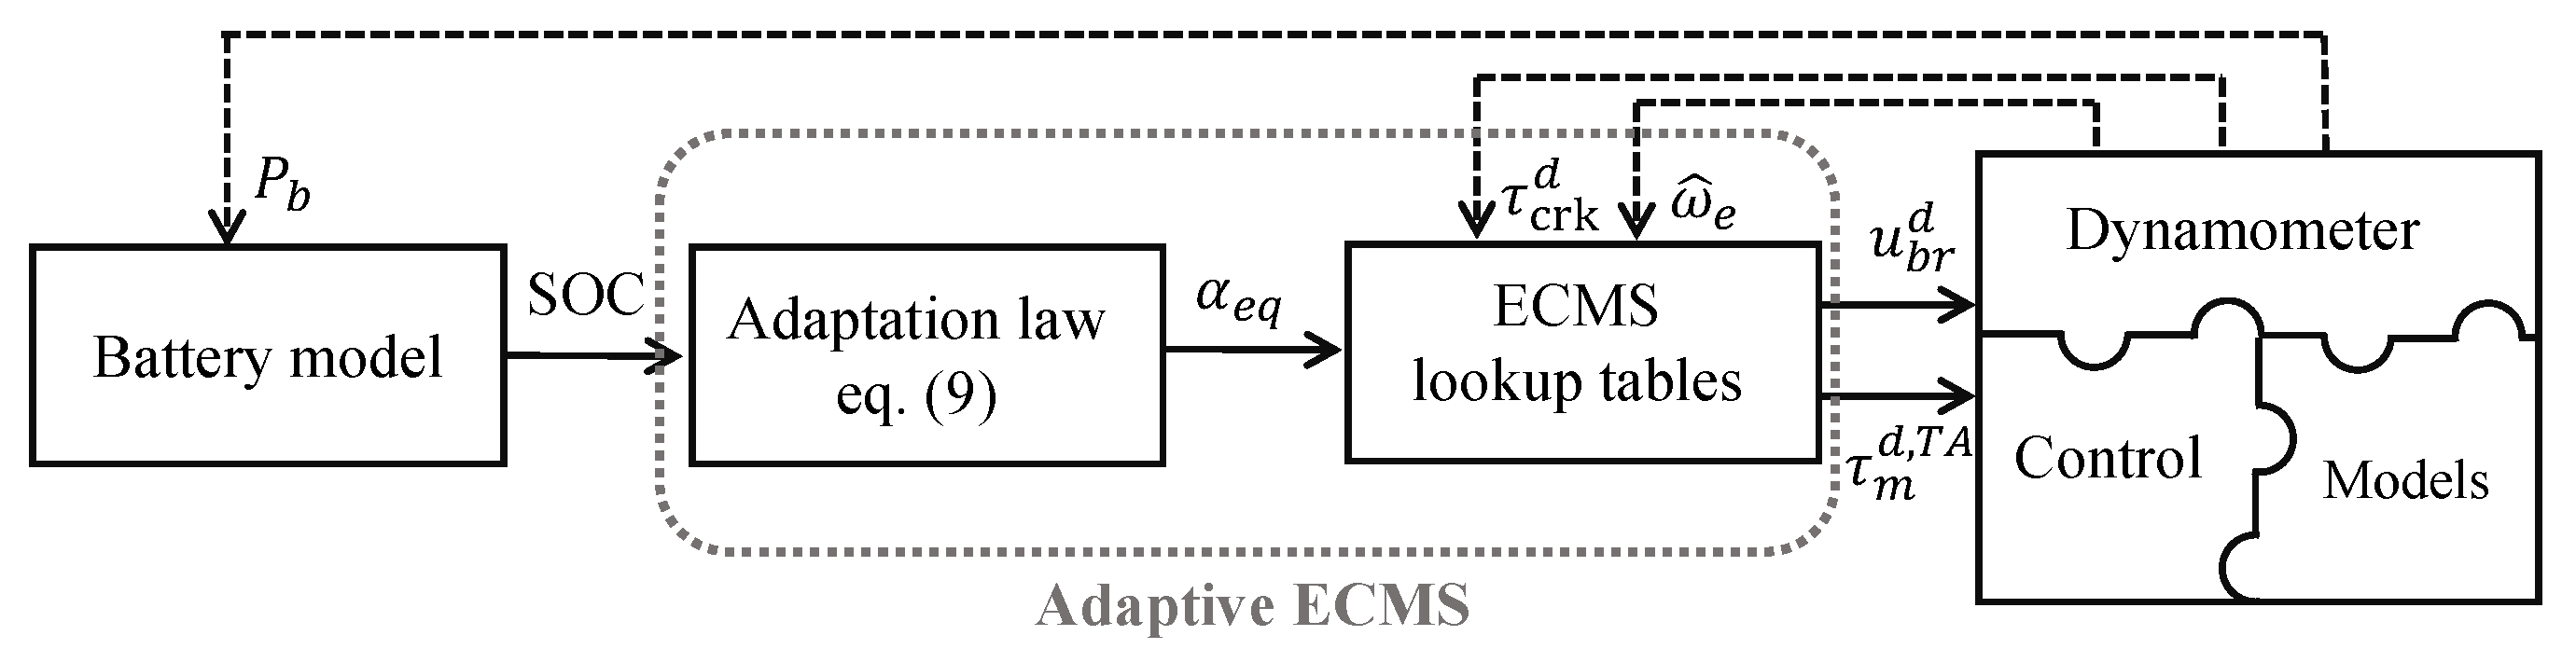
3.3. Adaptive-ECMS
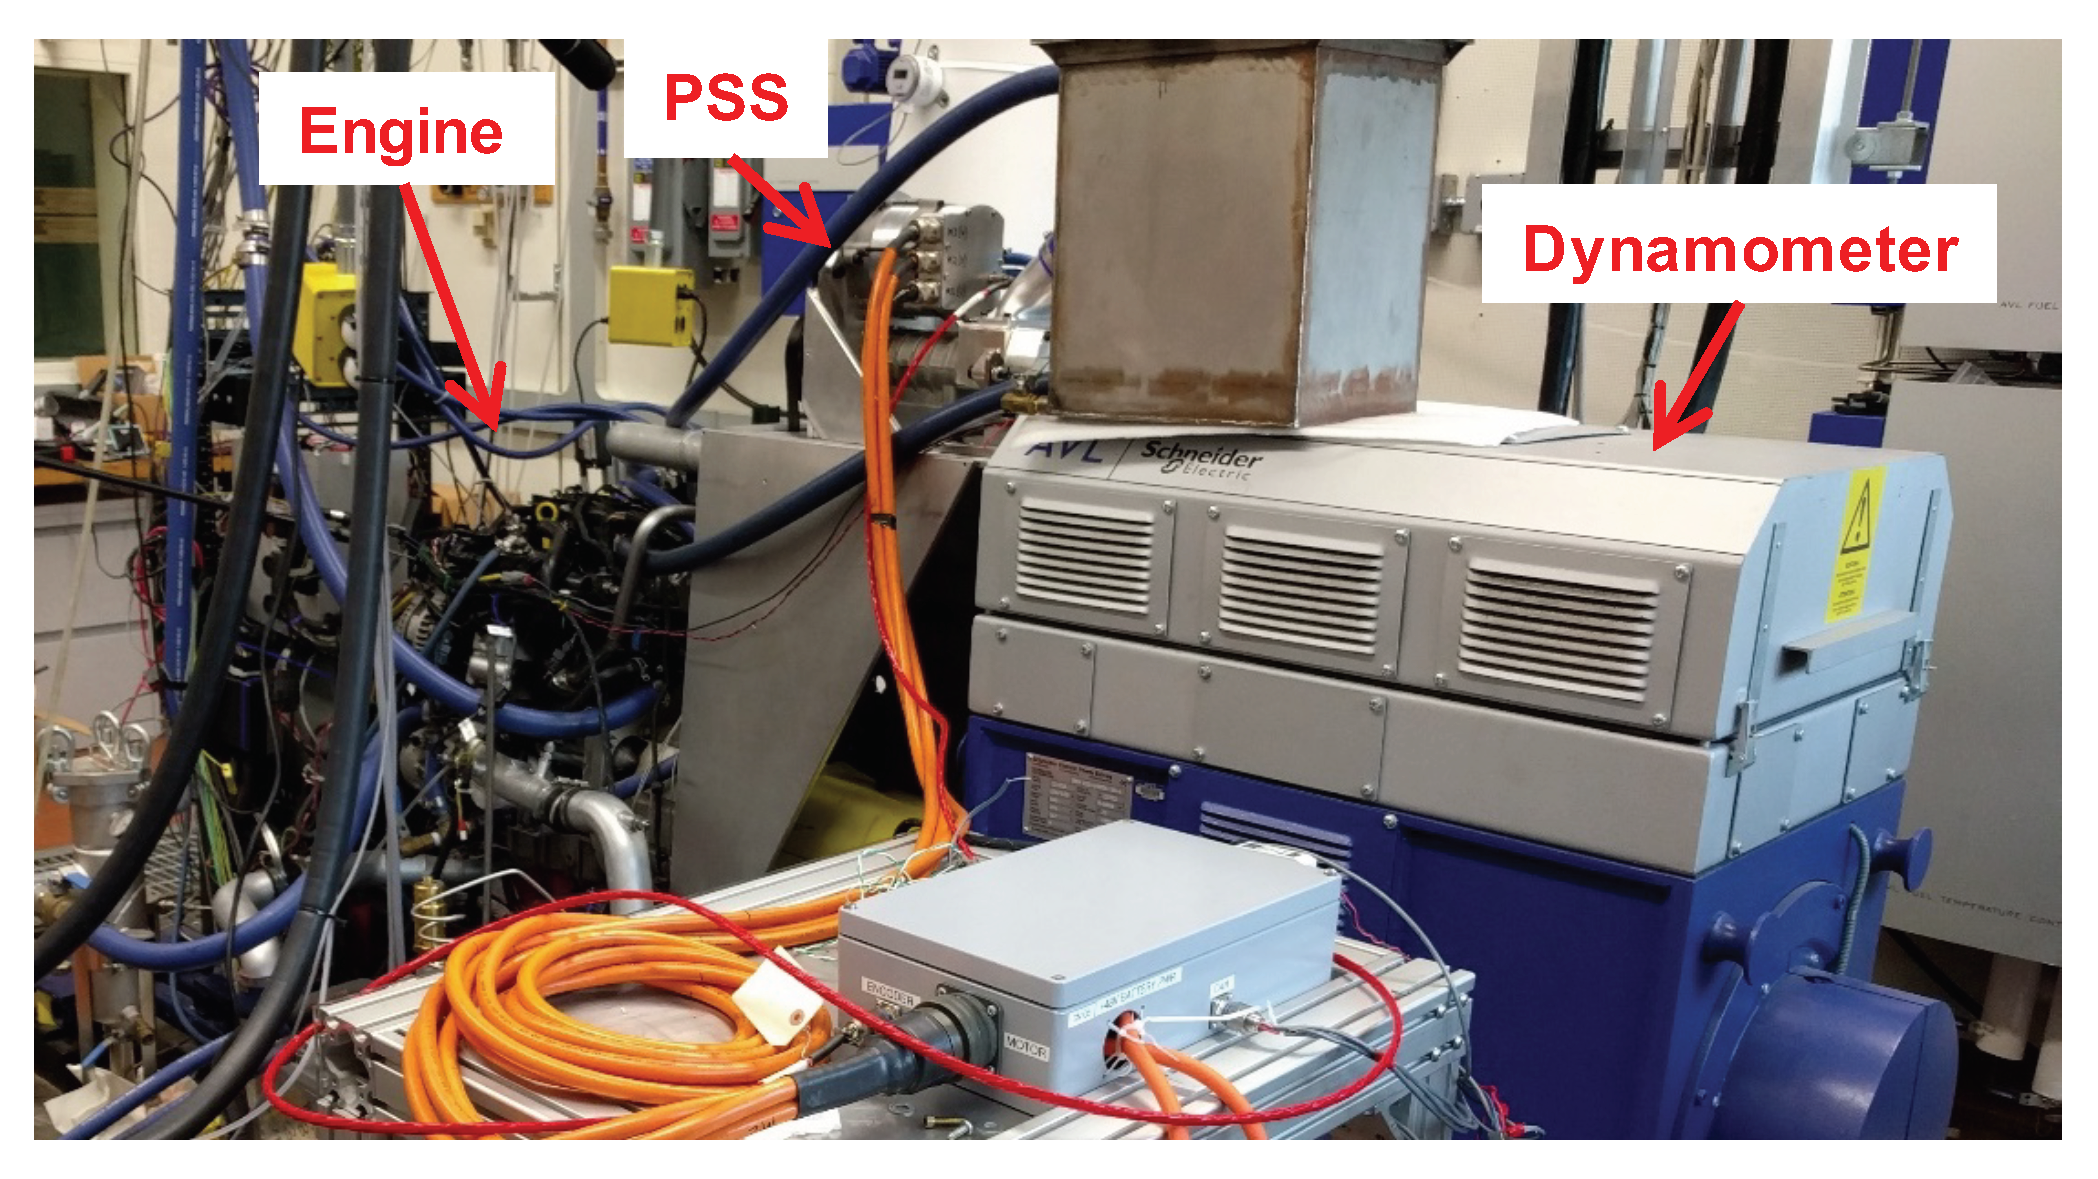
4. Experimental Setup
4.1. Testbed
4.2. Implementing A-ECMS and Hardware-in-the-Loop Experiments
4.2.1. Hardware-in-the-Loop Implementation for Locked Torque Converter
4.2.2. Hardware-in-the-Loop Implementation for Unlocked Torque Converter
4.2.3. Engine Start-Stop
5. Experimental Results
5.1. Fuel Consumption Reduction with PSS
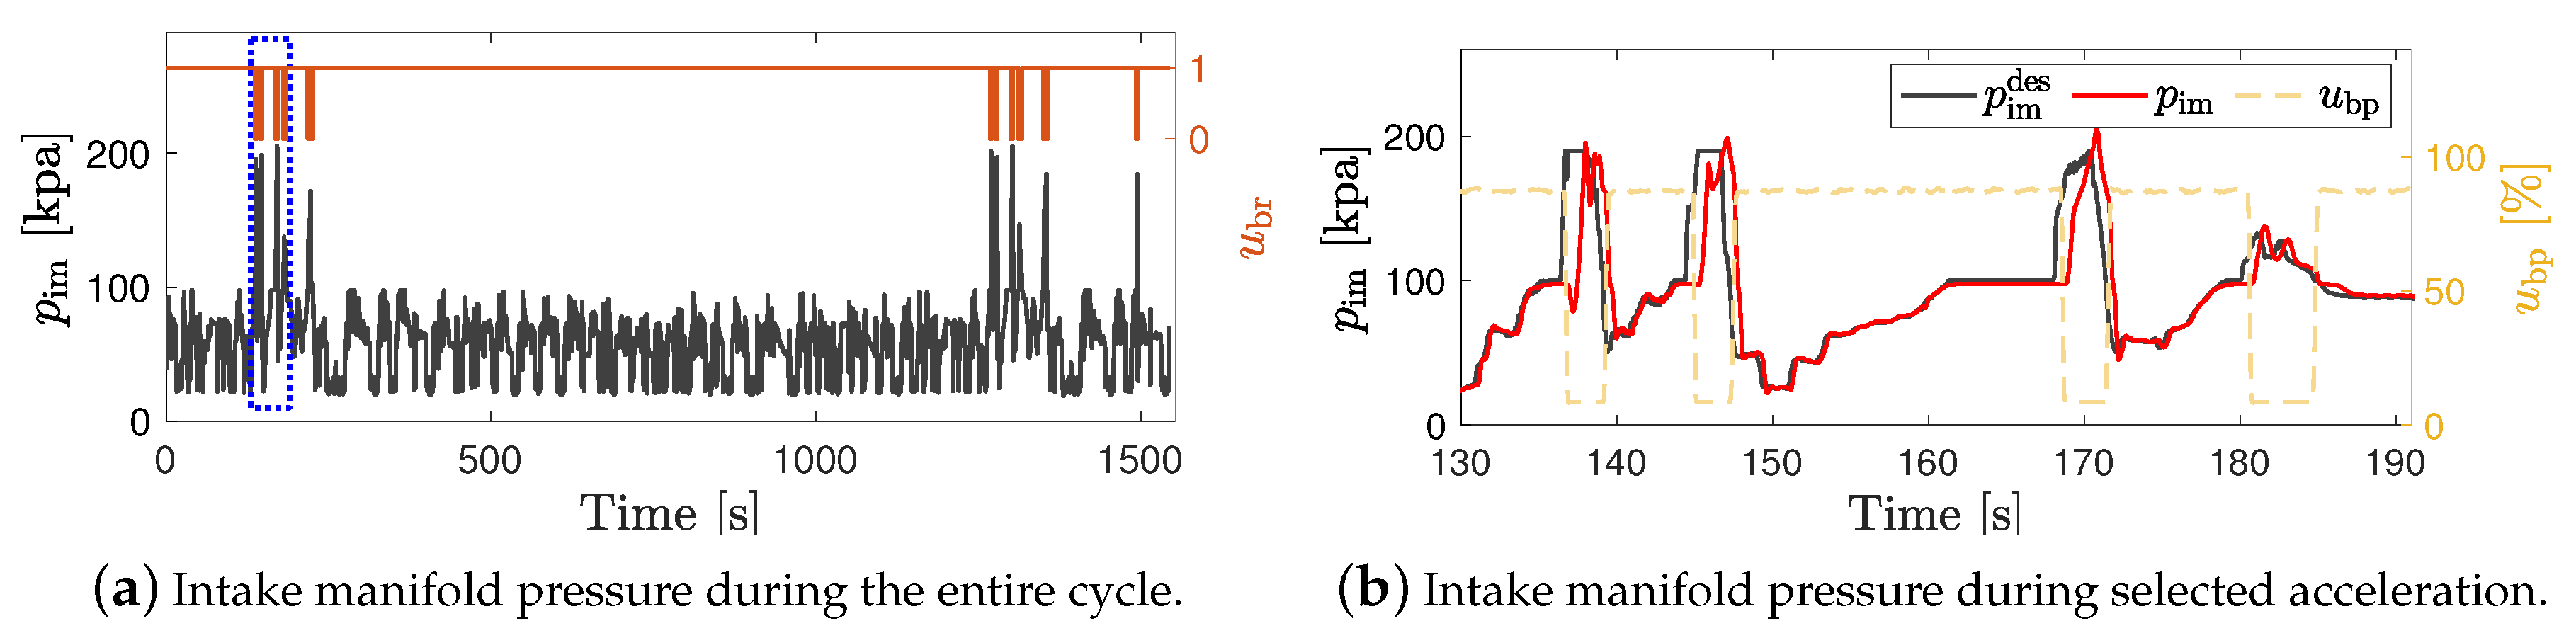
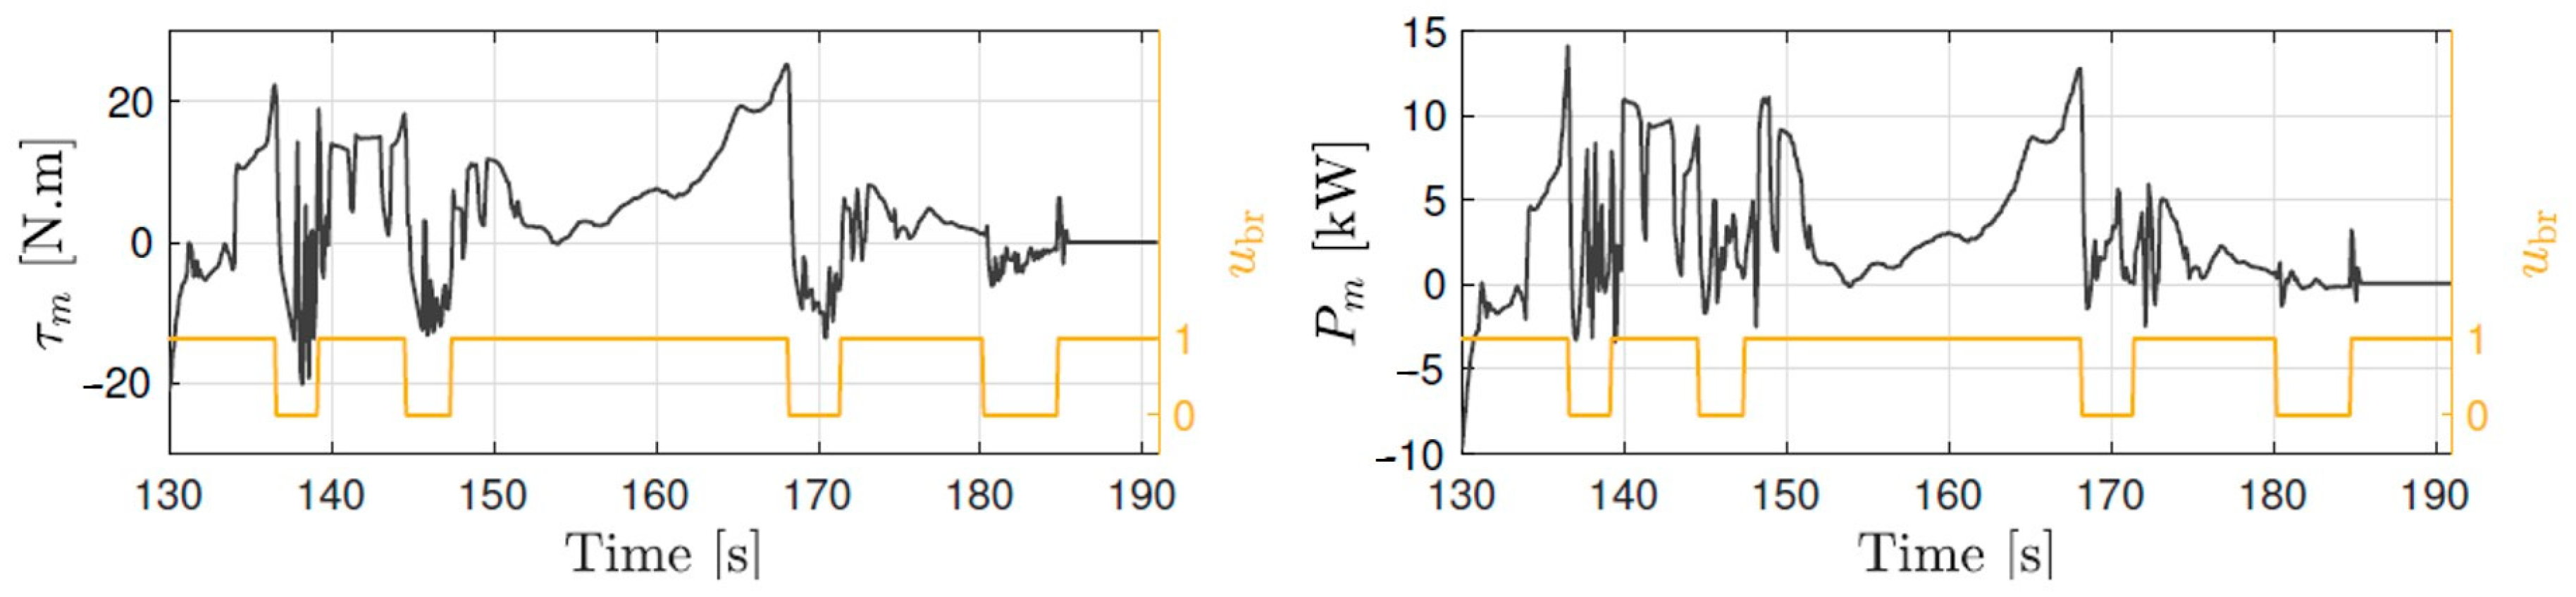
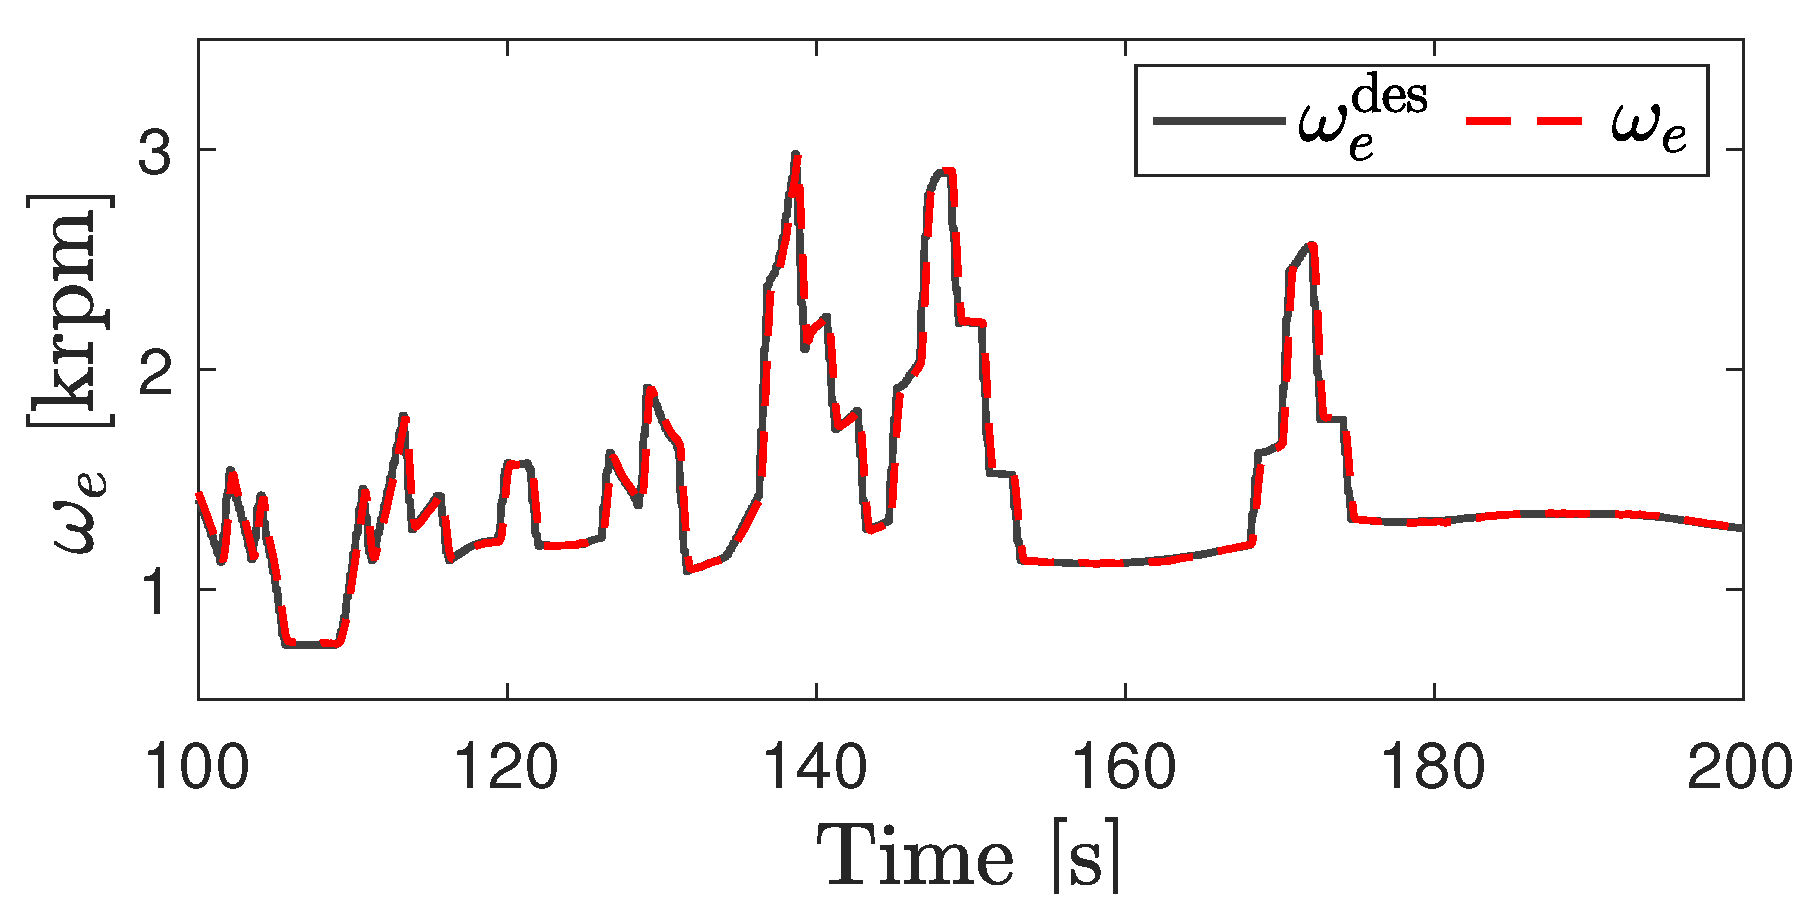
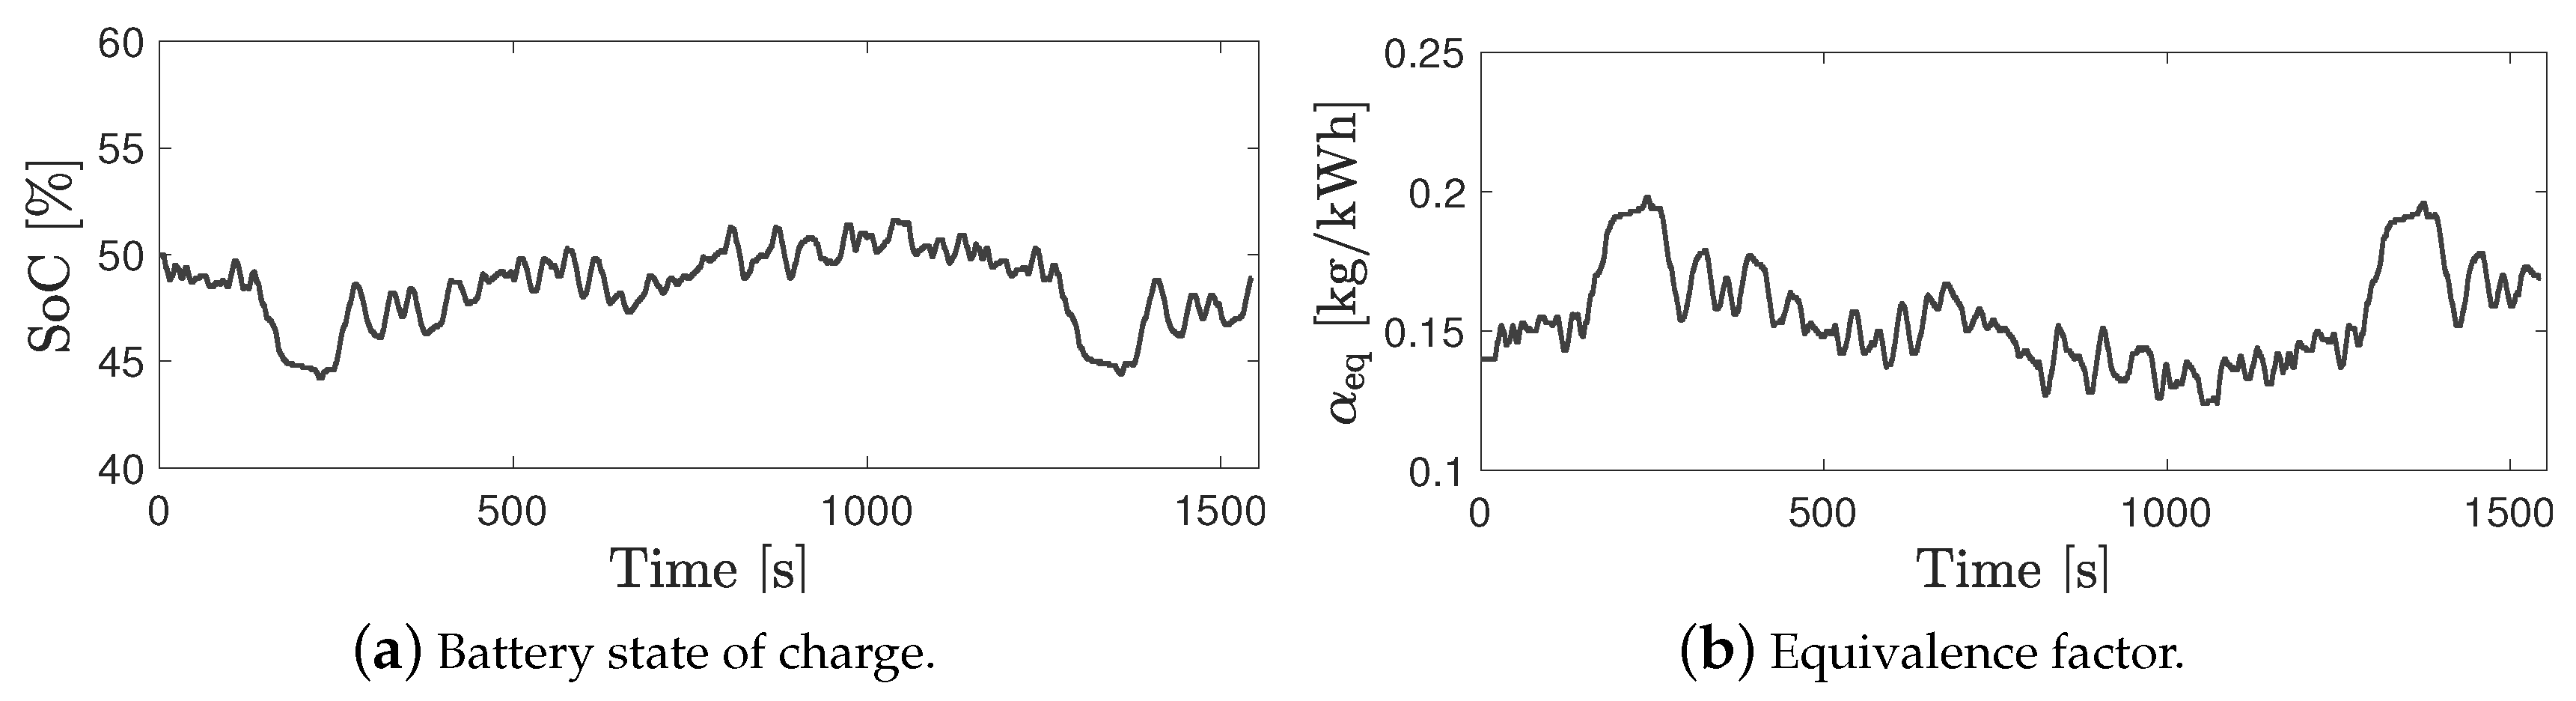
5.2. Power Split Supercharger Operation during a Transient Drive Cycle
6. Conclusions
Author Contributions
Funding
Acknowledgments
Conflicts of Interest
Abbreviations
| A-ECMS | adaptive equivalent consumption minimization strategy |
| DP | dynamic programming |
| ECMS | equivalent consumption minimization strategy |
| EMS | energy management system |
| eSC | electric supercharger |
| FC | fuel consumption |
| HEV | hybrid electric vehicle |
| HIL | hardware-in-the-loop |
| ICE | internal combustion engine |
| MPC | model predictive control |
| NA | naturally aspirated |
| PI | proportional+integral |
| PSS | power split supercharger |
| RPECS | rapid prototyping electronic control system |
| SC | supercharger |
| SI | spark ignition |
| SoC | state of charge |
| TC | torque converter |
References
- Ehsani, M.; Gao, Y.; Miller, J.M. Hybrid electric vehicles: Architecture and motor drives. Proc. IEEE 2007, 95, 719–728. [Google Scholar] [CrossRef]
- Bureau of Transportation Statistics. Available online: https://www.bts.gov/content/gasoline-hybrid-and-electric-vehicle-sales (accessed on 31 March 2020).
- King, J.; Heaney, M.; Saward, J.; Fraser, A.; Criddle, M.; Cheng, T.; Morris, G.; Bloore, P. HyBoost: An Intelligently Electrified Optimised Downsized Gasoline Engine Concept. In Proceedings of the FISITA 2012 World Automotive Congress; Springer: Berlin/Heidelberg, Germany, 2013; pp. 483–496. [Google Scholar]
- Volvo. Available online: https://www.volvocars.com (accessed on 1 March 2020).
- Panday, A.; Bansal, H.O. A review of optimal energy management strategies for hybrid electric vehicle. Int. J. Veh. Technol. 2014. [Google Scholar] [CrossRef] [Green Version]
- Enang, W.; Bannister, C. Modelling and control of hybrid electric vehicles (A comprehensive review). Renew. Sustain. Energy Rev. 2017, 74, 1210–1239. [Google Scholar] [CrossRef] [Green Version]
- Gao, J.; Sun, F.; He, H.; Zhu, G.G.; Strangas, E.G. A comparative study of supervisory control strategies for a series hybrid electric vehicle. In Proceedings of the 2009 Asia-Pacific Power and Energy Engineering Conference, Wuhan, China, 27–31 March 2009; pp. 1–7. [Google Scholar]
- Paganelli, G.; Delprat, S.; Guerra, T.M.; Rimaux, J.; Santin, J.J. Equivalent consumption minimization strategy for parallel hybrid powertrains. In Proceedings of the Vehicular Technology Conference, IEEE 55th Vehicular Technology Conference, VTC Spring 2002, Birmingham, AL, USA, 6–9 May 2002; Volume 4, pp. 2076–2081. [Google Scholar]
- Borhan, H.; Vahidi, A.; Phillips, A.M.; Kuang, M.L.; Kolmanovsky, I.V.; Di Cairano, S. MPC-based energy management of a power-split hybrid electric vehicle. IEEE Trans. Control. Syst. Technol. 2012, 20, 593–603. [Google Scholar] [CrossRef]
- Lin, C.C.; Peng, H.; Grizzle, J. A stochastic control strategy for hybrid electric vehicles. In Proceedings of the American Control Conference, Boston, MA, USA, 30 June–2 July 2004; Volume 5, pp. 4710–4715. [Google Scholar]
- Lin, C.C.; Peng, H.; Grizzle, J.W.; Kang, J.M. Power management strategy for a parallel hybrid electric truck. IEEE Trans. Control. Syst. Technol. 2003, 11, 839–849. [Google Scholar]
- Nazari, S.; Siegel, J.B.; Stefanopoulou, A. Optimal Energy Management for a Mild Hybrid Vehicle with Electric and Hybrid Engine Boosting Systems. IEEE Trans. Veh. Technol. 2019, 68, 3386–3399. [Google Scholar] [CrossRef]
- Nazari, S.; Middleton, R.; Siegel, J.; Stefanopoulou, A. Equivalent Consumption Minimization Strategy for a Power Split Supercharger; No. 2019-01-1207; SAE Technical: Detroit, MI, USA, 2019. [Google Scholar]
- Nazari, S.; Middleton, R.; Sugimori, K.; Siegel, J.; Stefanopoulou, A. Assessing a hybrid supercharged engine for diluted combustion using a dynamic drive cycle simulation. SAE Int. J. Altern. Powertrains 2018, 7, 351–368. [Google Scholar] [CrossRef]
- Nazari, S.; Siegel, J.; Stefanopoulou, A. Optimal energy management for a hybrid electric vehicle with a power split supercharger. In Proceedings of the 2018 IEEE Vehicle Power and Propulsion Conference (VPPC), Chicago, IL, USA, 27–30 August 2018; pp. 1–6. [Google Scholar]
- Sundstrom, O.; Guzzella, L. A generic dynamic programming Matlab function. In Proceedings of the Control Applications, (CCA) & Intelligent Control, (ISIC), St. Petersburg, Russia, 8–10 July 2009; pp. 1625–1630. [Google Scholar]
- Paganelli, G.; Tateno, M.; Brahma, A.; Rizzoni, G.; Guezennec, Y. Control development for a hybrid-electric sport-utility vehicle: Strategy, implementation and field test results. In Proceedings of the American Control Conference, Arlington, VA, USA, 25–27 June 2001; Volume 6, pp. 5064–5069. [Google Scholar]
- Nazari, S.; Stefanopoulou, A.; Martz, J. Minimum backpressure wastegate control for a boosted gasoline engine with low pressure external EGR. In Proceedings of the ASME 2016 Dynamic Systems and Control Conference, American Society of Mechanical Engineers, Ann Arbor, MI, USA, 12–16 October 2016; p. V002T20A002. [Google Scholar]
- Onori, S.; Serrao, L. On Adaptive-ECMS strategies for hybrid electric vehicles. In Proceedings of the international scientific conference on hybrid and electric vehicles, Malmaison, France, 6–7 December 2011; Volume 67. [Google Scholar]
- Sun, C.; Sun, F.; He, H. Investigating adaptive-ECMS with velocity forecast ability for hybrid electric vehicles. Appl. Energy 2017, 185, 1644–1653. [Google Scholar] [CrossRef]


| Powertrain | Result Type | Energy Management | FC | FC | SoC |
|---|---|---|---|---|---|
| [L/100 km] | [%] | [%] | |||
| Turbocharged | Simulation | DP | 6.76 | - | |
| Engine + PSS | Simulation | DP | 5.22 | 22.8 | 0.0 |
| Turbocharged | Experiment | - | 7.29 | - | - |
| Engine + PSS | Experiment | A-ECMS | 5.95 | 18.4 | 1.1 |
Publisher’s Note: MDPI stays neutral with regard to jurisdictional claims in published maps and institutional affiliations. |
© 2020 by the authors. Licensee MDPI, Basel, Switzerland. This article is an open access article distributed under the terms and conditions of the Creative Commons Attribution (CC BY) license (http://creativecommons.org/licenses/by/4.0/).
Share and Cite
Nazari, S.; Siegel, J.; Middleton, R.; Stefanopoulou, A. Power Split Supercharging: A Mild Hybrid Approach to Boost Fuel Economy. Energies 2020, 13, 6580. https://doi.org/10.3390/en13246580
Nazari S, Siegel J, Middleton R, Stefanopoulou A. Power Split Supercharging: A Mild Hybrid Approach to Boost Fuel Economy. Energies. 2020; 13(24):6580. https://doi.org/10.3390/en13246580
Chicago/Turabian StyleNazari, Shima, Jason Siegel, Robert Middleton, and Anna Stefanopoulou. 2020. "Power Split Supercharging: A Mild Hybrid Approach to Boost Fuel Economy" Energies 13, no. 24: 6580. https://doi.org/10.3390/en13246580
APA StyleNazari, S., Siegel, J., Middleton, R., & Stefanopoulou, A. (2020). Power Split Supercharging: A Mild Hybrid Approach to Boost Fuel Economy. Energies, 13(24), 6580. https://doi.org/10.3390/en13246580