Article

The Impacts of Energy Consumption, Energy Prices and Energy Import-Dependency on Gross and Sectoral Value-Added in Sri Lanka

1
School of Business and Economics, North South University, Dhaka 1229, Bangladesh
2
Department of Finance, College of Business Administration, Prince Sattam Bin Abdulaziz University, 173 Alkharj 11942, Saudi Arabia
3
Department of Agriculture Economics, Kafr El-Sheikh University, Kafr El-Sheikh 33511, Egypt
4
Department of Economics and International Studies, University of Buckingham, Buckingham MK18 1EG, UK
*
Author to whom correspondence should be addressed.
Energies 2020, 13(24), 6565; https://doi.org/10.3390/en13246565
Submission received: 23 November 2020 / Revised: 8 December 2020 / Accepted: 11 December 2020 / Published: 12 December 2020

Abstract

:
Drifting away from the neoclassical growth conjecture of economic growth being solely dependent on capital and labor inputs, this paper aimed to evaluate the dynamic impacts of energy consumption, energy prices and imported energy-dependency on both gross and sectoral value-added figures of Sri Lanka. The analysis has particularly used the robust econometric methods that can account for structural break issues in the data. The results, in a nutshell, indicated that energy consumption homogeneously contributes to gross, agricultural, industrial and services value-additions in Sri Lanka. However, positive oil price shocks and greater shares of imported energy in the total energy consumption figures are found to dampen the growth figures, especially in the context of the gross, industrial and services value additions. Besides, the joint growth-inhibiting impacts of oil price movements and energy import-dependency are also ascertained. On the other hand, the causality estimates reveal bidirectional causal associations between energy consumption-gross value-added and energy consumption-industrial value-added. In contrast, no causal impact of energy consumption on the agricultural and services value-added is evidenced. Hence, these findings impose key policy implications for constructing crucial energy policy reforms to make sure that the economic growth performances of Sri Lanka are sustained in the future.

1. Introduction

Energy is acknowledged to be a vital input that catalyzes the output level; thus, it is regarded as one of the major attributes of growth of the world economy [1]. Keeping the energy consumption-induced growth phenomenon into consideration, several existing studies have scrutinized the energy consumption-economic growth nexus [2,3,4]. In line with this notion, Rafindadi and Ozturk [5] asserted that the level of energy consumption within an economy directly determines its growth level. Besides, it is anticipated that ensuring energy security is a pre-requisite to undergoing economic expansion which, in turn, can be anticipated to result in value addition for attaining economic growth [6].
Although in the past energy consumption, in general, was unanimously believed to foster the economic growth strategies pursued by the global economies, the contemporary studies have debunked this preconceived notion by affirming that for economic growth to sustain, the choice of the energy resource to be consumed is equally important [7]. Consequently, several studies have also put forward the economic adversities linked to energy consumption [5,8]. Besides, some studies have also nullified any sort of association between energy consumption and economic growth [9] 2020. Hence, these equivocal assertions highlight the ambiguous nature of the energy consumption-economic growth nexus.
Since energy, like any other commodity, is not free of cost, movements in energy prices tend to both directly impact the energy consumption levels [10,11]; thus, indirectly affecting the economic growth performances as well [12,13]. Consequently, several studies have also explored the oil price volatility impacts on economic growth [14,15]. The energy consumption responses to exogenous shocks to the world oil prices are not symmetric across the global economies. The adverse impacts of positive oil price shocks are relatively depressing for energy importers while the energy exporters are, to some extent, sovereign to such movements. According to the International Energy Agency, positive shocks to oil prices are particularly detrimental to net oil-importing nations due to their predominant oil-dependency issues [16].
On the other hand, most of the developing economies often fail to ensure energy security due to their indigenous energy resources being unable to bridge their respective energy demand. Consequently, these economies rely on energy imports to resolve their energy deficits. Energy trade has been recognized as a means to boosting the energy consumption levels which, in turn, is believed to be effective in enhancing the growth of the energy-importing nations, in particular [17]. In contrast, energy imports can also exert growth-depressing impacts on the energy-importing economies by surging their import bills [18]. Thus, the effects of energy imports on economic growth is said to be ambiguous. As a result, addressing the ambiguous impacts of imported-energy dependency on economic growth is critically important.
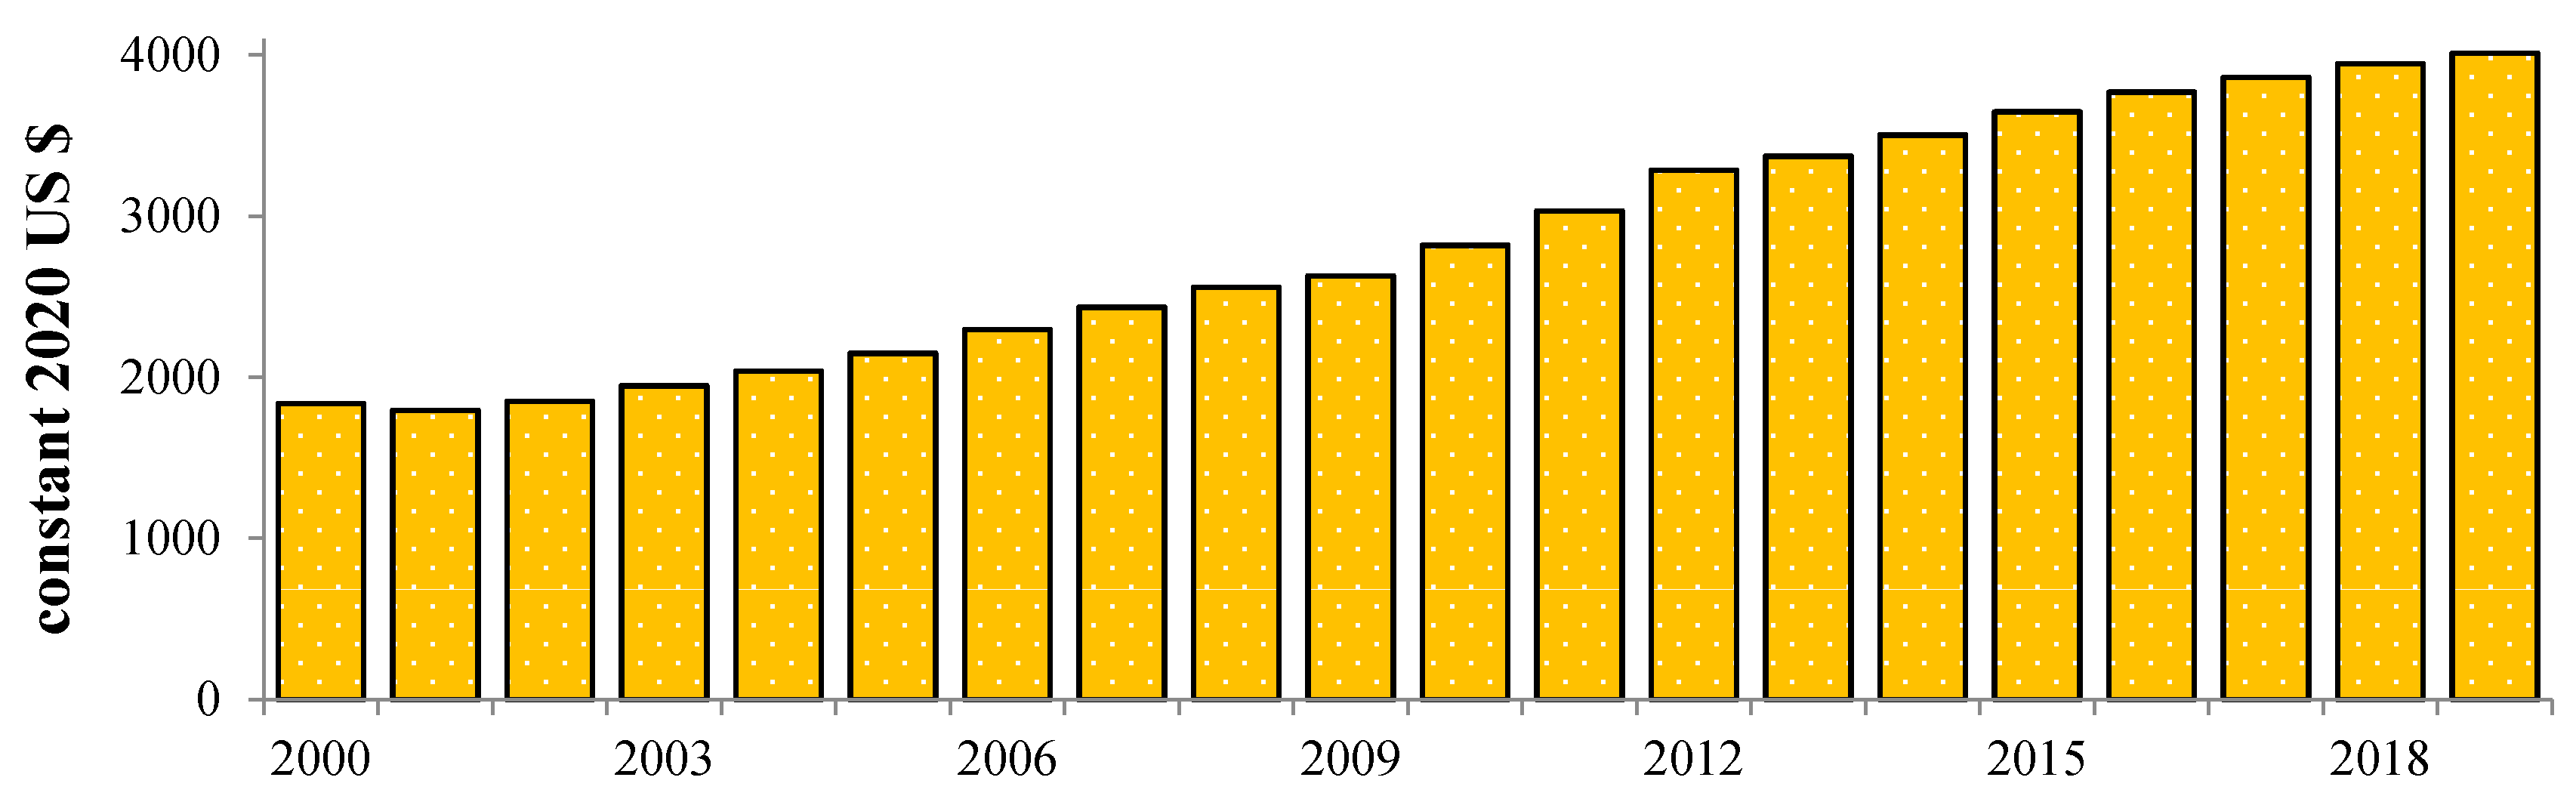
Against this milieu, this paper aims to probe into the dynamic impacts of energy consumption, energy price movements and energy import-dependency on economic growth in Sri Lanka between 1971 and 2018. The choice of Sri Lanka is justified from the perspective that this South Asian nation has traditionally been a net-importer of energy whereby overarching relationships between its energy consumption levels and economic growth performances can be anticipated [11]. Besides, almost 77% of Sri Lanka’s electricity output is generated from both local and imported fossil fuels [
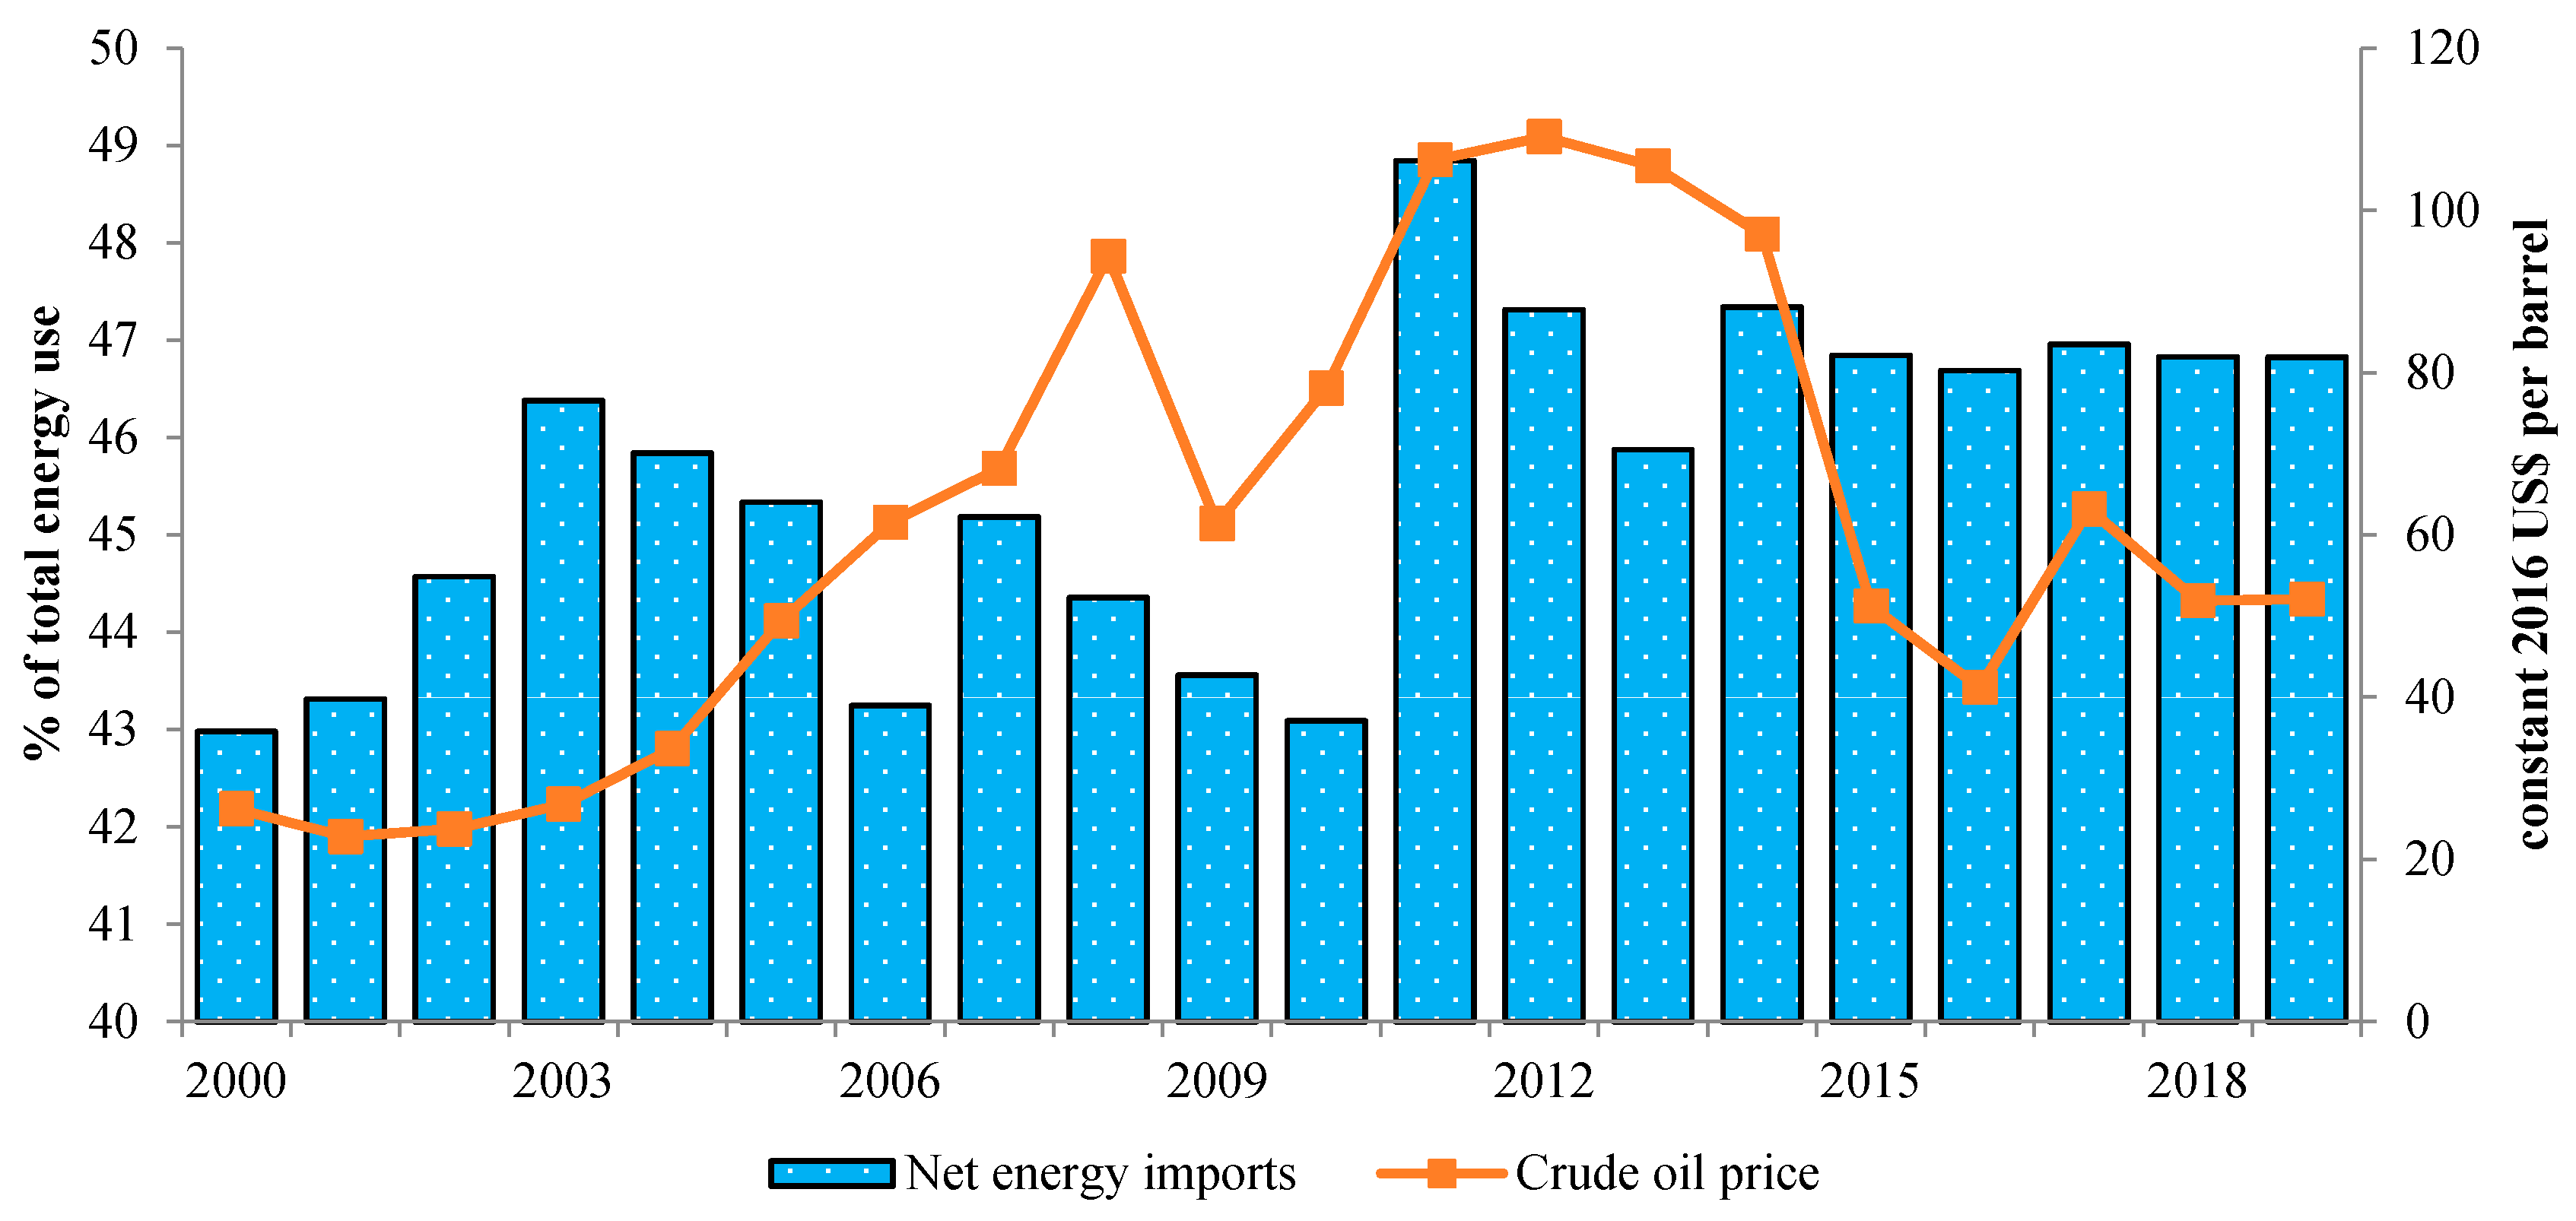
19]. Moreover, 43% of the total petroleum demand of Sri Lanka is met by imported crude and refined oils while the nation also imports coal from India in particular [
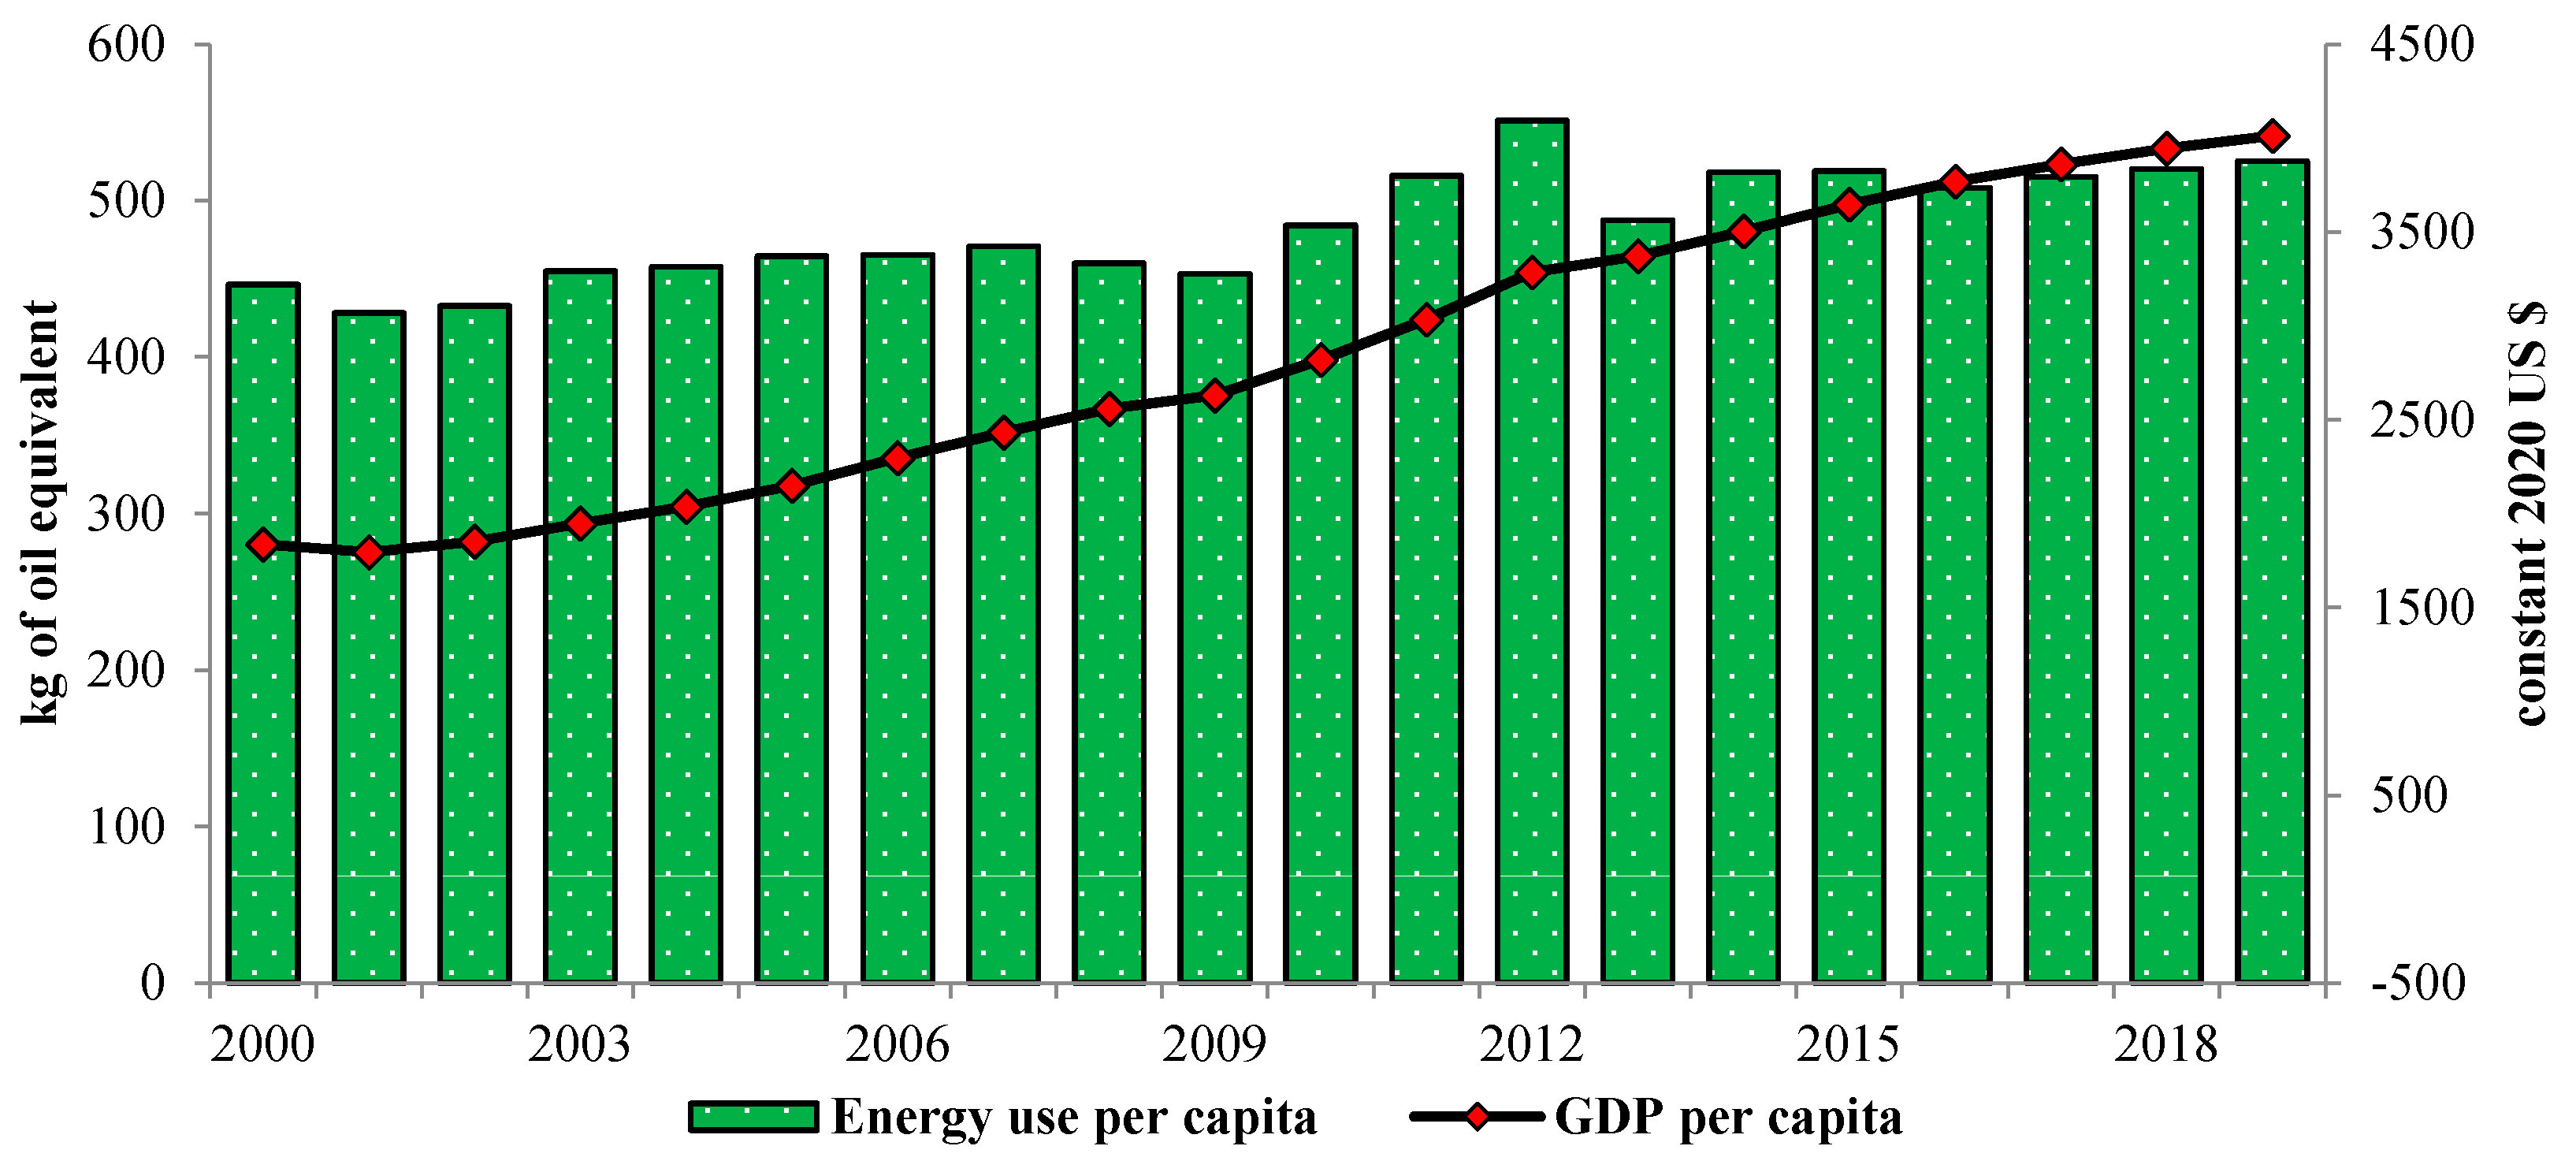
20]. Hence, these statistics clearly highlight the predominant imported energy-dependency of the Sri Lanka. On the other hand, the energy consumption per capita figures of Sri Lanka are lower than that of India and several other Southeast Asian underdeveloped nations [21]. Recently, the power generation crisis of Sri Lanka has turned out to be a major growth-inhibiting factor for the nation [20]. Hence, the volume of energy imports can be expected to surge which, in turn, is likely to further aggravate the nation’s dependency on imported energy. In this regard, examining the impacts of Sri Lanka’s imported energy-dependency on its economic growth is important.
This paper contributes to the literature in multiple aspects. Firstly, to the best of knowledge, this is the seminal study that evaluates the impacts of energy consumption, energy price shocks and energy import-dependency on both the gross and sectoral value-added figures of Sri Lanka. The preceding studies have primarily focused on the impacts of these energy-related variables on the overall growth of the Sri Lankan economy. However, a disaggregated analysis is important for formulation of sector-specific energy policies. Secondly, this paper contributes to the energy economics literature that has largely ignored the empirical analysis of the impacts of energy-import dependency on the growth of the net-importers of energy in particular. Hence, this gap in the literature is bridged through the evaluation of the dynamic impacts of Sri Lanka’s imported energy-dependency on its gross and sectoral value-added figures. Thirdly, the joint impacts of energy price shocks and energy imports on the growth figures are also ascertained. The existing studies in the literature have primarily emphasized on only the direct roles of these variables on the economic growth; but exploring the indirect channels is also important for crucial policy implications. Finally, this paper further contributes to the literature by using econometric methods that are efficient in accounting for structural breaks issues in the data. It is pertinent to control for the structural break issues since Sri Lanka has experienced a prolonged period of civil war from 1983 to 2009 [22] which is likely to have substantially impacted the nation’s growth performances. The majority of the relevant studies on Sri Lanka have overlooked the structural breaks concerns whereby the conclusions documented in the literature can be presumed to be biased to some extent.
The remainder of the paper is organized as follows: Section 2 presents some stylized facts on the relationships between economic growth, energy consumption, energy prices and energy import-dependency in the context of Sri Lanka. A review of the literature is provided in Section 3. The econometric model and the data attributes are discussed in Section 4. The econometric methodology used in this paper is explained in Section 5. Section 6 reports and discusses the findings from the empirical analyses. Finally, Section 7 concludes with some key policy implications.

2. Some Stylized Facts on Economic Growth and Energy Consumption in Sri Lanka

Sri Lanka encompasses a total land area of 65,610 square kilometers and is home to 21.4 million people. The real GDP per capita figures of Sri Lanka, as illustrated in Figure 1, have more than doubled between 2000 and 2019. The growth momentum has specifically teed off around 2012. The end of Sri Lanka’s civil war in 2009 could have played a favorable role in escalating the real GDP per capita figures from 2012 onwards.
Figure 2 depicts the energy consumption per capita figures of Sri Lanka alongside its economic growth performances between 2000 and 2019. The bar charts show that energy consumption per capita levels peaked at around 551 kg of oil equivalent in 2012 before dropping slightly in the subsequent years.
This was primarily because of the conclusion of the nation’s non-tradable sector boom which lasted from 2009 to 2012. Consequently, the energy employment per capita figures between 2016 and 2019 had somewhat stagnated. Besides, for similar reasons, the real GDP per capita figures during this period seem to have stagnated as well. Moreover, the energy use spread across the important sectors in 2017 showed that merely one-fourth (24.3%) of the total energy consumed in Sri Lanka was utilized within the industry sector while the transport and the household sectors accounted for shares of 36.2% and 39.6%, respectively [20]. Although Sri Lanka has managed to ensure a 100% electrification rate in 2017, it did not manage to achieve this feat through the utilization of its domestic primary energy supplies. About 43% of the total primary energy supplies were accounted for by imported petroleum fuels [20].
Figure 3 illustrates the trends in Sri Lanka’s net energy imports in response to the crude oil price fluctuations in the world market during the 2000–2018 periods. The projections reveal that Sri Lanka’s dependency on imported energy resources, particularly crude and refined petroleum, grew from 2000 onwards before declining in 2004. This can be attributed to the decision of the government to transfer ownership of a significant proportion of the state-owned Ceylon Petroleum Corporation to the private company Lanka Indian Oil Company. The declining trend in the imported-oil dependency sustained up to 2010 before surging substantially in 2011 despite the oil prices in the world markets increasing during that time. This was inevitable since meeting the aggravating energy demand in Sri Lanka could not be ensured using the indigenous energy supplies. Therefore, these trends tend to highlight the imported energy-dependency of Sri Lanka. Thus, the nation’s energy imports can be referred to be resistant to positive oil price shocks. Although it is evident from Figure 3 that the shares of net energy imports in the aggregate energy consumption figures have declined from 2012 onwards, it still accounts for more than 45% of the total volume of energy used in Sri Lanka. Consequently, the high associated energy import bills can be presumed to adversely impact the nation’s growth potentials despite bridging the energy deficits to a large extent.

3. Literature Review

3.1. The Literature on the Nexus between Energy Consumption and Economic Growth

Research on the energy consumption-economic growth nexus was pioneered by Kraft and Kraft [23] through their seminal paper on the United States. The authors found evidence of energy consumption enhancing the nation’s gross national product to facilitate economic growth. Since then, a plethora of studies has scrutinized this relationship under four key hypotheses [24]. Firstly, the growth hypothesis which postulates in favor of energy resources being a determinant of economic growth, but not the other way around. Secondly, the conservative hypothesis which asserts that economic growth is responsible for influencing the energy consumption levels. Thirdly, the feedback hypothesis claims energy consumption and economic growth to be causally inter-dependent. Finally, the neutrality hypothesis condemns the causal linkage between these two variables.
The nexus between energy consumption and economic growth has been explored both in the context of the developed and underdeveloped nations. Besides, both time-series country-specific and panel cross-country analyses were conducted. Among the relevant country-specific studies, Park and Yoo [25] found statistical evidence of the feedback hypothesis since a bidirectional causality was ascertained between oil consumption and economic growth in Malaysia. Similarly, Bélaïd and Abderrahmani [26] and Nazlioglu et al. [27] also documented bidirectional causalities between electricity consumption and real gross value-added in the context of Algeria and Turkey, respectively. In contrast, Alshehry and Belloumi [28] authenticated the growth hypothesis in the context of Saudi Arabia. Shahbaz et al. [29] opined that negative shocks to energy consumption exerted a causal influence on India’s economic growth in the long-run. The ambiguity of the energy consumption-economic growth nexus was put forward in the study by Omri [30]. The results showed that in 9 out of the 14 Middle Eastern and North African (MENA) nations energy consumption was positively correlated with economic growth while for the remaining MENA countries either no correlation or negative correlations were established. Besides, the feedback hypothesis for the panel of the 14 MENA countries was also ascertained.
In a recent study concerning the top 10 energy-consuming global economies, Shahbaz et al. [31] found energy consumption to positively influence the growth levels in all the selected nations. On the other hand, using cross-sectional econometric methods, Esen and Bayrak [32] found higher volumes of energy consumption to positively influence the real value-added figures of 75 net energy-importing nations including Sri Lanka. In another study involving 38 Mediterranean economies, Esseghir and Khouni [33] reported evidence of bidirectional causality between energy consumption and economic growth; thus, the feedback hypothesis was validated. On the other hand, in the context of the 21 African economies, Eggoh et al. [34] concluded that energy consumption is pertinent in enhancing the gross value-added figures irrespective of the African nation being an exporter or importer of energy. Besides, the feedback hypothesis was also confirmed from the bidirectional causalities between energy consumption and economic growth in the context of the total energy exporter, energy importer and the combined panels of African nations.
Furthermore, few studies have conducted a disaggregated analysis by scrutinizing the energy consumption impacts on sectoral value additions. In a relevant study on Pakistan, Chandio et al. [35] found that natural gas consumption and electricity use were effective in stimulating the expansion of the nation’s agricultural sector. Similarly, Paramati et al. [36] probed into the effects of renewable energy use on the agricultural, industrial and services value-added figures of the Group of Twenty (G20) countries. The results revealed that both renewable and non-renewable energy consumption attributed to higher gross and sectoral value addition. However, only in the context of the services sector, a unidirectional causality running from renewable energy use to the services value-added was evidenced. Moreover, gross value-added was found to causally influence the non-renewable energy use in the G20 nations; thus, the conservative hypothesis was validated. Besides, in another study on the G20 nations, Qiao et al. [37] found evidence of the growth hypothesis in the context of the developing G20 economies. The causality estimates showed that there is a unidirectional causality stemming from energy consumption per capita to agricultural value-added per capita both in the short and the long-runs. Salim et al. [38] found evidence of bi-directional causation between energy consumption, both renewable and non-renewable, and industrial value-added figures of 29 Organization for Economic Cooperation and Development (OECD) countries, both in the short and long-runs. Thus, the feedback hypothesis was affirmed for the industry sectoral analysis. Similar bidirectional causality between non-renewable energy consumption and overall economic growth was ascertained in the short-run only while, in the long-run, a unidirectional causality stemming from economic growth to renewable energy use was also evidenced. Recently, Marques et al. [39] opined in favor of no causal association between renewable energy consumption and industrial output levels of Greece. However, the authors did find evidence of bidirectional causality between non-renewable energy use and industrial outputs in Greece.

3.2. The Literature on the Nexus between Energy Price Shocks and Economic Growth

Since energy is an utmost important factor of production, fluctuations in the prices of energy are believed to impose macroeconomic adversities [40]. The consequences are relatively grim for the net energy-importing developing nations like Sri Lanka due to these nations being energy-starved and largely dependent on imported energy resources to meet their deficit energy supplies. Van Eyden et al. [41] showed that unforeseen oil price shocks impose heterogeneous impacts on the economies of the oil-importing and oil-exporting OECD nations; particularly, deteriorating the economic performance of the oil-exporters. Arshad et al. [42] asserted that high oil prices dampened the economic growth performances of Pakistan. Similarly, Varghese [43] claimed that positive oil price shocks adversely impacted the economic performance of the Indian economy by worsening the fiscal balance and undermining the sustainability of public debt. In contrast, the positive correlation between oil price growth and economic growth in Saudi Arabia was documented by Foudeh [44]. In the context of another net oil-importing country Liberia, Wesseh and Lin [45] found that positive shocks to international oil prices promoted economic growth while negative shocks in this regard exerted no statistically significant impact.

3.3. The Literature on the Nexus between Energy Imports and Economic Growth

Import of energy is hypothesized to be crucial for mitigating the energy deficits of the net energy-importing economies. Consequently, energy imports can be linked to greater economic output and, therefore, economic growth can be expected to boost. However, a reduction in energy-import dependency has also been acknowledged to promote growth further [46]. Such arguments are grounded on the belief that the huge amounts of energy import bills impose macroeconomic pressures on the economies of the energy-importing countries [47]. Besides, these economies, following their substantial amount of dependency on imported energy resources, are relatively more vulnerable to the energy price volatilities which could further result in macroeconomic adversities to a large extent [48]. Hence, there are equivocal assertions regarding the impacts of energy imports on the growth potentials of the importing nations. However, it is evident that the literature comprising of empirical studies to assess the impacts of energy-import dependency on economic growth is not so rich. Hence, this paper also attempts to bridge this gap in the literature from the perspective of the net-energy importing South Asian economy of Sri Lanka.

4. Empirical Models and Data

The neoclassical growth models included capital and labor as the only factors of production which can be perceived from the Cobb-Douglas production function [49]. However, several other macroeconomic factors drive the global production processes. Among these, energy is acknowledged to directly contribute to the value-added and also indirectly contribute by complementing the capital and labor inputs. Thus, the energy-augmented neoclassical production functions have emerged [50,51]. In this paper, the overall economic growth in Sri Lanka is modeled using an energy-augmented Cobb-Douglas production function which includes energy consumption, energy prices and energy import shares in total energy consumption figures as the key explanatory variables along with the conventional inputs of capital and labor. The underlying model can be specified as:
l n G V A t = 0 + 1 l n E t + 2 l n O t + 3 l n E I M t + 4 ( l n O l n E I M ) t + 5 l n K t + 6 l n L t + ε t
where the subscript t refers to the time (year) and ε denotes the error-term. The parameters 0 . and i   ( i = 1 ,   ,   6 ) . are the intercept and the elasticity parameters to be calculated. The descriptions of the variables are as follows:
  • The variable lnGVA stands for the natural logarithm of the gross value-added figures of Sri Lanka which is used to proxy for its overall level of economic growth. The gross value-added figures are the real GDP per capita figures of Sri Lanka, measured in terms of constant 2010 United States dollar. The positive signs of the elasticity parameters would implicate advancement in the overall growth level of Sri Lanka following a change in the corresponding regressor and vice-versa.
  • The variable lnE refers to the natural logarithm of the energy consumption volumes which are measured in terms of kg of oil equivalent per capita. Higher energy consumption has been acknowledged to stimulate economic expansion to facilitate industrialization within an economy [52].
  • The variable lnO stands for the real crude oil prices measured in constant 2016 United States dollars per barrel. This variable is used as a proxy for the movements in the world energy prices. It is included in the model to account for the impacts of the exogenous energy price shocks on the overall economic growth level of Sri Lanka. The inclusion is justified from the understanding that Sri Lanka meets a significant proportion of its energy demand from crude and refined petroleum fuels [20]. Thus, crude oil price shocks can be expected to affect the nation’s oil imports which, in turn, can affect the economic growth as well. The crude oil prices are measured in terms of constant 2016 United States dollar prices per barrel. Positive oil price shocks are hypothesized to exert adverse consequences on the growth of the energy-importing nations [53].
  • The variable lnEIM abbreviates for the percentage shares of energy imports in the total energy consumption levels in Sri Lanka. Since Sri Lanka is largely energy-constrained economy, it depends heavily on imported energy resources. Hence, to account for the energy import-dependency issue of Sri Lanka, the energy imports shares are augmented into the model. Higher shares implicate greater dependency of the nation on imported energy resources and vice-versa. The impacts of energy imports on economic growth can either be positive, since it elevates the overall energy consumption levels, or negative, due to high import bills exerting adverse impacts on growth.
  • The variable lnO×lnEIM refers to the interaction term between real crude oil prices and energy import shares of Sri Lanka. This variable is included in the model to capture the joint impacts of energy price shocks and energy imports on the economic growth of Sri Lanka. The overall joint impact of energy price movements and energy imports on the gross value-added per capita figures depend on the relatively dominant impact of either of these variables.
  • The variable lnK stands for the capital stock of Sri Lanka. It is proxied by the real values of the gross capital formation. According to the neoclassical growth conjecture, capital accumulation is expected to contribute to higher levels of economic growth.
  • The variable lnL refers to the labor stock of Sri Lanka. It is proxied by the growth rate of Sri Lanka’s population within the labor force participation age bracket of 15 and 64 years. As per the assertions put forward in the neoclassical growth models labor employment is expected to positively contribute to economic growth [54].
Table 1 presents the hypothesized relationships between Sri Lanka’s gross value-added per capita and the explanatory variables.
For robustness check of the homogeneity of the results across the different sectors of the Sri Lankan economy, model (1) is separately estimated by replacing the gross value-added figures by the agricultural, industrial and services value-added figures. The corresponding models can be specified as:
l n A V A t = 0 + 1 l n E t + 2 l n O t + 3 l n E I M t + 4 ( l n O l n E I M ) t + 5 l n K t + 6 l n L t + ε t
l n I V A t = 0 + 1 l n E t + 2 l n O t + 3 l n E I M t + 4 ( l n O l n E I M ) t + 5 l n K t + 6 l n L t + ε t
l n S V A t = 0 + 1 l n E t + 2 l n O t + 3 l n E I M t + 4 ( l n O l n E I M ) t + 5 l n K t + 6 l n L t + ε t
where lnAVA, lnIVA and lnSVA refer to the agricultural, industrial and services value-added per capita figures measured in terms of constant 2010 United States dollars. The empirical analysis involves annual frequency data spanning from 1971 to 2018. All the variables have been transformed into their natural logarithms for the ease of estimating the elasticities and for reducing the sharpness of the data. The data for the crude oil prices have been retrieved from the British Petroleum’s Statistical Review of World Energy database while that for the rest of the variables are sourced from the World Development Indicators database of the World Bank.
Table 2 reports descriptive statistics of the variables considered in this paper and also reports the results from the Variance Inflation Factor (VIF) test. The VIF test is performed to assess the issues of multicollinearity in the data. If the VIF for each variable and the mean VIF values are below the critical value of 10, then it can be asserted that there is low multicollinearity between the explanatory variables. The largest individual VIF and the mean VIF are predicted at 4.58 and 2.97, respectively. Thus, these estimates reveal that multicollinearity is not a concern.

5. Econometric Methodology

5.1. The Unit Root Analysis

The econometric analysis starts by investigating the stationarity properties of the variables included in the models. Identification of the order of integration among the variables concerning the respective models is pertinent in choosing the appropriate regression estimator. Besides, regression analysis involving non-stationary variables is likely to generate spurious elasticity estimates [55,56,57]. A common limitation of the conventional time-series unit root estimation techniques, like the Augmented Dickey-Fuller (ADF) proposed by [58], do not account for the possible breaks in the data. Thus, Perron [59] proposed a single-break unit root estimation technique to overcome the limitations of the ADF method. However, the Perron [59] method was criticized for assuming the break to be exogenously determined [60]. Therefore, this paper uses the structural break-adjusted unit root test proposed by Zivot and Andrews [61] which is robust to predicting the stationarity properties in the presence of a single endogenous break in the data. The test statistics involving the Zivot-Andrews technique are predicted under the null hypothesis of non-stationarity against the alternative hypothesis of stationarity.

5.2. The Cointegration Analysis

The Zivot-Andrews unit root analysis is followed by the cointegration analysis which predicts the possible long-run associations between the variables included in the respective models. The existence of cointegrating equations in the model is pertinent in avoiding the estimation of a spurious regression analysis involving non-stationary variables at levels [60]. Besides, the cointegration analysis pre-requisites the estimation of the long-run elasticities using the appropriate time-series regression estimators [62,63]. The conventionally used cointegration methods like the Johansen [64] cointegration approach fail to incorporate the structural break issues in estimating the cointegrating properties. Hence, to overcome this limitation of the Johansen [64] method, this paper uses the Gregory-Hansen cointegration analysis proposed by Gregory and Hansen [65]. The Gregory-Hansen approach presumes a single endogenously determined structural break in the data. The cointegrating model can generally be specified as:
y t = o + 1 D t + θ 1 T + i = 1 a φ 1 i x i t + i = 1 a φ 2 i D 2 i x i t + ε t
where y is the dependent variable and x is a vector of a i number of dependent variables (i = 1, …, a). ε t is the error term and t is the year. D t is the dummy variable used to capture the structural break in the constant or in both the constant and trend. D t takes a value of 1, denoting the presence of the structural break at a particular year Tb, if t > Tb (interpreted as the year t is after the break year Tb) and a value of 0, denoting no structural break at a particular year Tb, if t < Tb (interpreted as the year t is before the break year Tb). A total of three test statistics, ADF*, Zα and Zt, are predicted under the null hypothesis of no cointegrating relationships between y and xi against the alternative hypothesis of the presence of cointegration equations in the model. The structural breaks identified from the statistically significant test statistics under Gregory-Hansen cointegration analysis are used to create dummies to be augmented into the respective models to account for the break issues while estimating the long-run elasticities.

5.3. Regression Analysis

Following Azam et al. [66], the fully-modified ordinary least squares (FMOLS) estimator, proposed by Phillips and Hansen [67], is employed to predict the long-run elasticities. The FMOLS estimator is a non-parametric approach that modifies the conventional ordinary least squares (OLS) estimator to correct of the endogeneity bias and autocorrelation issues [66]. Since the regression models considered in this paper include oil prices, energy imports and energy consumption as the principal explanatory variables of concern, the correlations between these variables could lead to endogeneity issues. Besides, the FMOLS method is claimed to generate efficient elasticity outputs in the context of the regression model comprising of short time-series and variables that are cointegrated and integrated at their first difference [67]. The FMOLS estimator ( ^ F M O L S ) is derived from a generalized linear model which can be specified as:
Y t = β 0 + β 1 X i , t + U t
where Xt is a vector of i explanatory variables that are stationary at first difference, I(1). Hence, the stationary process of Xt is given by:
Δ X i , t = ϑ + v t
where ∆ denotes the first difference operator; ϑ is the vector of drift parameters; v t is the vector of stationary variables. The FMOLS approach assumes ξ i , t = ( ε ^ i , t ,   Δ X i , t ) and the estimation of the FMOLS estimator involves two stages. In the first stage, the outcome variable Yt is modified for the long-run T which is interdependent of u t and v t . Besides, u ^ t is said to be identically and independently distributed (i.i.d.) much like the residuals of the OLS process [66].
ξ t = ( u ^ t v ^ t )
where v ^ t   = Δ X t u ^ t for t = 2, 3, …, n; u ^ t = ( n 1 ) 1 t = 2 n Δ X t . The long-run variance of ξ t can be specified as:
Ω ^ = Σ ^ + Λ ^ + Λ = [ Ω ^ 11 χ Ω ^ 11 Ω ^ 21 χ Ω ^ 12 Ω ^ 12 χ Ω ^ 21 Ω ^ 22 χ Ω ^ 22 ]
where Σ ^ = 1 n 1 t = 2 n ξ t ξ t ,   Λ ^ = s = 1 m w ( s , m ) Γ ^ s , Γ ^ s = n 1 t = 1 n s ξ t ξ t and w ( s , m ) is the lag window with horizon m [66]. Now assuming:
Δ ^ = Σ ^ = Λ ^ = [ Λ ^ 11 Λ ^ 12 Λ ^ 21 Λ ^ 22 ]
Z ^ = Δ ^ 21 Δ ^ 22 Ω ^ 22 1 Ω ^ 21
Y t ^ = Y t Δ ^ 21 Ω ^ 12 Ω t ^ 1 ν ^ t
( k + 1 ) x k = [ 0 1 x k 0 l k k x k l k ]
In the second stage, the FMOLS estimator ( β F M O L S ^ ) can be specified as:
β F M O L S ^ = ( W W ) 1 ( W Y ^ n D Z ^ )
where Y ^ = ( Y ^ 1 ,   Y ^ 2 ,   ,   Y ^ n ) , W = ( τ n , X ) and τ n = ( 1 ,   1 ,   1 ,   ,   1 ) .
Following, Murshed et al. [68], the robustness of the elasticity estimates are checked using the Dynamic Ordinary Least Squares (DOLS) estimator of Stock and Watson [69]. The DOLS estimator, ideally suited for short time-series dataset, predicts efficient elasticity outputs by correcting for simultaneity bias by including leads and lags [70]. In contrast to the FMOLS method involving a non-parametric approach, the DOLS method uses a parametric approach to perform the regression analysis in the context of variables having the same or mixed orders or integration [71]. Furthermore, the elasticity estimates generated by the DOLS estimator are said to be asymptotically efficient in the context of endogeneity issues [69].
The goodness of fit of the respective models can be assessed from the values of the adjusted coefficient of determination (Adj. R2) which ranges from 0 (poor fit) to 1 (good fit). Besides, the stability of the long-run estimates for all five models is evaluated using a set of diagnostic tests. The Durbin-Watson and the Breusch-Godfrey Lagrange Multiplier (χ2 LM) tests are used to explore the serial correlation problems. The normality of the residuals is evaluated using the Jarque-Berra test (J-B normality). The heteroscedasticity issues are diagnosed with the autoregressive conditional heteroskedasticity (χ2 ARCH) effects and WHITE test (χ2 WHITE). The correct functional forms of the models are assessed using the Ramsey RESET (χ2 RESET) test.

5.4. Causality Analysis

The regression analysis, by default, assumes that the dependent variable affects the independent variable without considering the possible reverse association between the variables. Thus, it is pertinent to assess the causal associations which can be unidirectional or bidirectional. This paper uses the Hacker-Hatemi-J bootstrapped causality estimation method proposed by Hacker and Hatemi-J [71]. This method is a developed version of the technique proposed by Hacker and Hatemi-J [72] in which the modified Wald statistics are generated using a two-stage bootstrapped approach. In the first stage, the optimal lag structure is calculated, while in the second-stage the modified Wald statistic is estimated for evaluating the Granger causality between a set of two variables. The modification of the Wald statistic is effective in handling heteroscedasticity problems and also for accounting the autoregressive conditional heteroscedasticity effects. The statistics are predicted under the null hypothesis of the independent variable not Granger causing the dependent variable against the alternative hypothesis of Granger causality stemming from the independent variable to the dependent variable.

6. Results and Discussion

The results from the Zivot-Andrews unit root analysis are reported in Table 3. It is evident from the statistical significance, at a 1% level, of the test statistics that all the variables, despite being non-stationary at their levels, are stationary at their first differences. Hence, a common order of integration among the variables is ascertained. This implies that the variables are mean-reverting at their first differences. Thus, the possibility of estimating spurious elasticity estimates is nullified.
The Gregory-Hansen cointegration analysis follows the Zivot-Andrews unit root exercises. The results, as reported in Table 4, statistically certify the presence of cointegrating equations in the context of all four models. The statistically significant test statistics reject the null hypothesis on no cointegrating association to affirm the long-run relationships between the gross and sectoral per capita growth figures and energy consumption per capita levels, energy prices, energy import shares, capital and labor.
The long-run elasticities are predicted using the FMOLS and DOLS estimators. The corresponding results from the regression analysis are reported in Table 5 and Table 6. The signs and statistical significance of the elasticity estimates, although differing in terms of the magnitudes, are seen to be homogeneous across the different regression estimators used in this paper. Thus, the results are claimed to be robust across alternative regression methods. Besides, the adjusted R-squared values imply good fits of the regression models.
In the context of model (1), the corresponding elasticity estimates reported in Table 5 demonstrate that energy consumption is effective in enhancing the gross value-added figures of Sri Lanka. A 1% rise in the energy consumption per capita level is found to increase the real gross value-added per capita figures by 1.39–1.71%, on average, ceteris paribus. Thus, the paramount importance of energy use for increasing the overall level of economic growth in Sri Lanka can be understood from these estimates. Therefore, it is pertinent for the Sri Lankan economy to ensure energy sufficiency for attaining higher growth performances. Thus, Sri Lanka should focus on pursuing energy-led growth policies whereby boosting energy supplies can be anticipated to contribute to the development of the economy. This finding corroborates the results reported by Esen and Bayrak [32] in the context of 75 net energy importers. The similarity of the findings can be reasoned from the perspective that Sri Lanka has also been a tradition net oil-importing nation. The positive association between energy consumption and economic growth were also highlighted in the studies by Ivanovski et al. [73] for selected OECD and non-OECD countries, Samu et al. [74] for Zimbabwe and Bouyghrissi et al. [75] for Morocco.
On the other hand, a negative correlation is unearthed between world crude oil prices and the gross value-added per capita figures of Sri Lanka. The corresponding elasticity estimates show that a 1% rise in the real crude oil prices per barrel in the world markets is accompanied by a reduction in the gross value-added per capita figures by 0.09–0.15%, on average, ceteris paribus. Hence, these results reflect the vulnerability of Sri Lanka to positive shocks and fluctuations in the world prices of crude oil. This can primarily be attributed to the nation’s imported oil-dependency which has also been highlighted in the study by Murshed and Tanha [11]. Under such circumstances, safeguarding the economy against the exogenously determined volatile oil price movements is necessary for fostering the overall growth of the Sri Lankan economy. In this regard, Sri Lanka is better-off making greater use of its indigenous energy resources to generate electricity. This would not only be effective in curbing the nation’s vulnerability to exogenous energy price shocks but would also increase the overall energy supplies to further contribute to economic growth. This result echoe the findings highlighted by Arshad et al. [42] in the context of Pakistan which, like Sri Lanka, is another net-oil importing South Asian nation. Similar results were also concluded by Adam et al. [76] for Indonesia and Ferdaus et al. [77] for net oil-importing Next Eleven countries. In contrast, Foudeh [44] revealed the complementary association between oil prices and economic growth in the context of the oil-exporting economy of Saudi Arabia. Kisswani [78] also asserted positive oil price shocks to enhance economic growth in selected Southeast Asian countries that are relatively more developed than Sri Lanka. Besides, Ferdaus et al. [77] showed that positive oil price shocks promote growth only in the context of the net oil-exporting Next Eleven nations. Therefore, such contrasting findings can be reasoned from the understanding that positive oil price shocks are particularly detrimental to the growth performances of the net energy-importing nations.
As far as the impacts of energy import-dependency on Sri Lanka’s gross value-added per capita figures are concerned, the corresponding elasticity estimates denote that dependency on imported energy is not conducive to enhancing the overall growth level of the Sri Lankan economy. A percentage rise in the share of imported energy in the aggregate energy consumption figure is predicted to reduce the gross value-added per capita figures by 0.56–0.73%, on average, ceteris paribus. These findings can be rationalized from the understanding that Sri Lanka has traditionally registered deficits in its trade balances, which could be attributed to the nation’s substantially large import bills. Therefore, it can be asserted that elevating the share of indigenous energy in the aggregate energy consumption levels is critically important in boosting the overall economic growth level in Sri Lanka. Thus, augmenting the domestic energy resources into the national energy-mix, while simultaneously reducing the imported energy-dependency, could be an ideal policy move to catalyze economic growth in Sri Lanka. Similarly, Adams et al. [79] also claimed that energy imports hurt the long-run growth performances of Thailand by deteriorating the country’s balance of payments deficits. Once again, the similarity of Sri Lanka and Thailand in respect of both countries being net importers of energy can be asserted to be the reason behind the identical results in both these studies. In the same vein, Frondel et al. [80] also emphasized on reducing dependency on imported energy to contribute to economic growth and environmental welfare in Germany.
On the other hand, the elasticity estimates also portray the joint adverse impacts of positive oil price movements and higher imported-energy dependency in Sri Lanka. The negative signs and statistical significance of the predicted elasticity parameters attached to the interaction term affirm this claim. Therefore, it is important that the Sri Lanka government adopts relevant policies to curb the imported-energy dependency of the nation while protecting the economy against exogenous shocks to the world oil prices. Finally, the positive signs of the elasticity parameters attached to lnK and lnL validate the neoclassical conjecture of capital accumulation and labor employment positively contributing to the value-added. Similar results were reported by Ahmed et al. [81] for Iran, Bal et al. [82] for India, Saova et al. [83] and Fadiran et al. [84] for European countries. In contrast, Keho [85] found labor to adversely impact the economic growth in Cote d’Ivoire. This contrasting finding could be due to the fact that the real GDP per capita level of Sri Lanka is almost double than that of Cote d’Ivoire [21].
As part of the diagnostic tests, the Durbin-Watson statistic and the statistical insignificance of the χ2 LM statistic imply no serial correlation problems in both the models. Also, the statistical insignificance of the J-B normality test indicates normal distributions of the residuals for both the models. Similarly, the statistical insignificance of the χ2 WHITE and χ2 ARCH statistics denote that the models are free from heteroscedasticity issues as well. On the other hand, the statistical insignificance of the χ2 RESET test implies that the functional forms of the models are well-specified.
Table 6 reports the long-run elasticities of the sectoral value-added per capita figures with respect to changes in the explanatory variables considered in the respective models. It is evident that energy consumption not only positively contributes to the gross value-added figures of Sri Lanka, it also enhances, although in different magnitudes, the sectoral value-added figures.
The elasticity estimates imply that the agricultural value-added per capita of Sri Lanka is relatively less elastic to changes in the energy consumption per capita levels in comparison to the corresponding elasticities of the industrial and services value-added per capita figures. A 1% rise in the energy consumption per capita level in Sri Lanka increases the agricultural value-added per capita figures by merely 0.04–0.05% as opposed to increasing the industrial and services value-added per capita figures by 1.71–1.80% and 1.94–2.15%, respectively, ceteris paribus. A particular reason behind these contrasting findings could be justified from the perspective that the agriculture sector of Sri Lanka, much like in the cases of similar developing nations, is relatively more labor-intensive as compared to the comparatively energy-intensive industry and services sectors. Similar conclusions were put forward in the study by Chandio et al. [35] in which the authors asserted that natural gas and electricity consumption positively attributed to the growth of Pakistan’s agriculture sector. However, Chandio et al. [35] opined that energy consumption is ineffective in explaining the variations in Pakistan’s industrial value-added. In another relevant study on G20 economies, Paramati et al. [36] found energy consumption to be effective in boosting the services value-added figures.
The other elasticity estimates show that the agricultural value-added levels of Sri Lanka are unaffected by exogenous shocks to world crude oil prices. The statistical insignificance of the corresponding elasticity estimates certifies this claim. In contrast, much like in the case of the gross value-added figures, positive shocks to crude oil prices in the world markets are seen to dampen Sri Lanka’s industrial and services value-added per capita figures. Besides, energy imports are found to homogeneously dampen the sectoral value-added figures. A rise in the share of net energy imports in the aggregate energy consumption figures by 1% reduces the agricultural, industrial and sectoral value-added per capita figures by 0.22–0.23%, 0.49–0.83% and 0.73–0.87%, respectively, ceteris paribus. Moreover, the joint negative impacts of crude oil price shocks and energy imports on the sectoral value-added per capita levels are also ascertained. Similarly, capital and labor inputs are also found to homogeneously boost the sectoral value-added figures in Sri Lanka.
Besides, the high adjusted R-squared values imply good fit of the respective models. Besides, the results from the diagnostic tests once again provide reliability of the long-run ARDL estimates. The Durbin-Watson statistic and the statistical insignificance of the χ2 LM statistic imply no serial correlation problems in all the models. Also, the statistical insignificance of the J-B normality test indicates normal distributions of the residuals for all the models. Similarly, the statistical insignificance of the χ2 WHITE and χ2 ARCH statistics denote that all the models are free from heteroscedasticity issues as well. On the other hand, the statistical insignificance of the χ2 RESET test implies that the functional forms of all the models are well-specified.
Finally, to assess the four underlying hypotheses concerning the energy consumption-economic growth nexus in the context of Sri Lanka, the Hacker-Hatemi-J bootstrapped causality analysis is conducted. The key findings from the causality exercise are summarized in Table 7. The statistical significance of the modified Wald statistics affirms the bidirectional causality between the energy consumption and gross value-added figures of Sri Lanka. Thus, the feedback hypothesis between these variables portrays the pertinence of ensuring energy security to safeguard the sustainability of economic growth in Sri Lanka. The feedback hypothesis was also validated in the studies by Destek and Aslan [86] for Greece and South Korea, Shakouri and Yazdi [87] for South Africa and Aydin [88] for Russia. In contrast, the feedback hypothesis did not hold in the study conducted by Paramati et al. [36] on G20 nations which, as opposed to Sri Lanka, comprises of some of the world’s most advance and energy-exporting countries. Besides, in the context of the industrial and services sectors, the feedback causal linkages between energy consumption and sectoral growth are also ascertained. These findings once again highlight the importance of ensuring energy sufficiency in Sri Lanka. Thus, ensuring energy security in this regard can be thought of a major facilitator of the fourth industrial revolution in Sri Lanka which not only would expand the relatively energy-intensive industry and services sectors but would also enhance the overall growth of the Sri Lankan economy. Similar findings were reported by Marques et al. [39] in which the authors found evidence of bidirectional causality between energy consumption and industrial value-added figures of Greece. In a relevant study on the electricity consumption-industrial value-added nexus, Sankaran et al. [89] also reported the feedback hypothesis in the context of Peru which is also a late industrialized economy like Sri Lanka. In contrast, no causal association in this regard could be established in the context of the agricultural sector. In line with these findings, it can be said that energy consumption is particularly important for industrialization and services sector development in Sri Lanka. Therefore, enhancing the reliability of energy supplies for these sectors is critically important in governing the overall economic growth of Sri Lanka.
The other key causality findings reveal unidirectional causalities stemming from oil prices to the gross and industrial value-added per capita figures of Sri Lanka. These findings are parallel to the results reported by Nwani [90] and Bekun and Agboola [91] for Ecuador and Nigeria, respectively. Thus, keeping the corresponding elasticity estimates into consideration, the statistical evidence of unidirectional causalities from oil price to gross and sectoral value-added in Sri Lanka highlight the adverse impacts of imported energy-dependency of the nation on its economic growth. This assertion is confirmed by the unidirectional causalities running from energy import shares to the gross, industrial and services value-added per capita figures. Besides, the agriculture sector of Sri Lanka is found to be causally unaffected by oil price shocks and energy imports. These findings could be explained in terms of the agriculture sector being predominantly less-reliant on energy inputs and heavily dependent on the labor endowments of the country. On the other hand, both capital and labor inputs were found to causally influence the gross and sectoral value-added per capita figures of Sri Lanka. Hence, these findings provide further support to the corresponding elasticity estimates which revealed the importance of capital accumulation and labor employment in promoting gross and sectoral growth in Sri Lanka. The unidirectional causality from capital accumulation to economic growth was also affirmed in the study by Topcu et al. [92] in the context of a panel of middle-income-countries including Sri Lanka. On the other hand, Haque et al. [93] also found evidence of unidirectional causality stemming from female labor force participation and economic growth in Bangladesh.

7. Conclusions

Although the neoclassical growth models have traditionally emphasized on capital and labor endowments being the only determinant of economic growth within an economy, the contemporary growth models have condemned the neoclassical conjecture. Thus, several key macroeconomic aggregates have gradually been augmented into the neoclassical models due to these variables having the capacity to determine the growth of any economy. Among these, the advocates of the energy-led growth strategies have highlighted the paramount importance of energy resources for attaining economic growth. Energy is anticipated to directly contribute to the value-added and also indirectly contribute to it by complementing the capital and labor inputs. Against this backdrop, this paper scrutinized the impacts of energy use, energy prices, energy import-dependency, capital accumulation and labor employment on the gross and sectoral value-added figures of Sri Lanka. The results from the econometric analyses, accounting for structural breaks issues in the data, revealed the favorable impacts of energy consumption on both the overall and sectoral economic growth levels. Besides, the adverse impacts of positive crude oil price shocks and energy import-dependency on the value-added figures, despite of nominal heterogeneity of the findings from the sectoral analysis, were also ascertained. Moreover, the joint adverse economic growth impacts of higher oil prices and greater energy import-dependency were also unearthed. Furthermore, the findings from the causality exercise authenticated the feedback hypothesis in the contexts of the energy consumption-gross value-added, energy consumption-industrial value-added and energy consumption-services value-added nexuses. On the other hand, unidirectional causations were found stemming from crude oil price movements to gross and industrial value-added while energy imports were found to causally influence the gross, industrial and services value-added.
Therefore, the results, in a nutshell, provide two important takeaways. Firstly, economic growth, both at aggregate and disaggregated levels, in Sri Lanka is reliant on greater consumption of energy. However, higher oil prices and greater energy import shares in total energy consumption figures dampen the growth potential to a large extent. Secondly, the industrial and the services sectors are relatively more vulnerable to oil price shocks in comparison to the agriculture sector of Sri Lanka. Hence, keeping these findings into cognizance, it is recommended that the Sri Lankan government ensures energy security within the economy for the sake of sustaining the gross and sectoral growth performances. However, ensuring energy sufficiency by importing energy resources should be discouraged since high dependency on imported energy is found to inhibit the growth of the Sri Lankan economy. In this regard, integration of the locally produced energy into the national energy-mix while simultaneously limiting energy imports can be expected to contribute to economic growth further. Hence, domestic investment in the energy sector of Sri Lanka is critically important to boost domestic energy supplies. Besides, gradually undergoing renewable energy could also be an option that would not only complement the local non-renewable energy supplies in meeting Sri Lanka’s energy demand but would also lessen the nation’s dependency on energy imports. Undergoing the energy transition, from consumption of non-renewable to renewable energy resources, has been referred to be an ideal means of reducing energy imports. Therefore, it is pertinent to incentivize investments for the development of the local renewable energy sector while the energy-import tariff policies should be restructured to limit the volumes of energy imported into Sri Lanka. Moreover, the integration of renewable energy resources into the energy systems can also assist in shielding the Sri Lankan economy against exogenous oil price fluctuations in the world markets.
As part of the future scope of research, this study can also be conducted to decouple the impacts of renewable and non-renewable energy consumption on the gross and sectoral growth of Sri Lanka. Besides, similar studies can also be executed on other developing nations for assessing the generality of the findings.

Author Contributions

Conceptualization: M.M.; Methodology: M.M., H.M. and M.B.; Software: M.M. and H.M.; Formal analysis: M.M.; Investigation: M.M. and T.T.Y.A.; Resources: T.T.Y.A. and H.M.; Data curation: M.M., H.M., T.T.Y.A.; Writing—original draft preparation: M.M.; writing—review and editing: M.M., H.M., T.T.Y.A. and M.B.; Visualization: M.M.; Supervision: M.M. All authors have read and agreed to the published version of the manuscript.

Funding

This research received no external funding.

Acknowledgments

We acknowledge the efforts put in by the anonymous reviewers who have made critically important remarks during the revision.

Conflicts of Interest

The authors declare no conflict of interest.

References

  1. Csereklyei, Z.; Rubio-Varas, M.D.M.; Stern, D.I. Energy and economic growth: The stylized facts. Energy J. 2016, 37, 223–255. [Google Scholar] [CrossRef]
  2. Apergis, N.; Payne, J.E. Energy consumption and economic growth: Evidence from the commonwealth of independent states. Energy Econ. 2009, 31, 641–647. [Google Scholar] [CrossRef]
  3. Apergis, N.; Payne, J.E. Renewable energy consumption and economic growth: Evidence from a panel of OECD countries. Energy Policy 2010, 38, 656–660. [Google Scholar] [CrossRef]
  4. Sunde, T. Energy consumption and economic growth modelling in SADC countries: An application of the VAR Granger causality analysis. Int. J. Energy Technol. Policy 2020, 16, 41–56. [Google Scholar] [CrossRef]
  5. Rafindadi, A.A.; Ozturk, I. Natural gas consumption and economic growth nexus: Is the 10th Malaysian plan attainable within the limits of its resource? Renew. Sustain. Energy Rev. 2015, 49, 1221–1232. [Google Scholar] [CrossRef]
  6. Malik, S.; Qasim, M.; Saeed, H.; Chang, Y.; Taghizadeh-Hesary, F. Energy security in Pakistan: Perspectives and policy implications from a quantitative analysis. Energy Policy 2020, 144, 111552. [Google Scholar] [CrossRef]
  7. Rahman, M.M.; Velayutham, E. Renewable and non-renewable energy consumption-economic growth nexus: New evidence from South Asia. Renew. Energy 2020, 147, 399–408. [Google Scholar] [CrossRef]
  8. Dhungel, K.R. A causal relationship between Energy Consumption and Economic Growth in Nepal. Asia-Pac. Dev. J. 2008, 15, 137–150. [Google Scholar] [CrossRef] [Green Version]
  9. Nathaniel, S.P. Ecological footprint, energy use, trade, and urbanization linkage in Indonesia. GeoJournal 2020. [Google Scholar] [CrossRef]
  10. Thomas, S.; Rosenow, J. Drivers of increasing energy consumption in Europe and policy implications. Energy Policy 2020, 137, 111108. [Google Scholar] [CrossRef]
  11. Murshed, M.; Tanha, M.M. Oil price shocks and renewable energy transition: Empirical evidence from net oil-importing South Asian economies. Energy Ecol. Environ. 2020. [Google Scholar] [CrossRef] [PubMed]
  12. Hussain, M.; Ye, Z.; Usman, M.; Mir, G.M.; Usman, A.; Rizvi, S.K.A. Re-investigation of the resource curse hypothesis: The role of political institutions and energy prices in BRIC countries. Resour. Policy 2020, 69, 101833. [Google Scholar] [CrossRef]
  13. Mukhamediyev, B.; Spankulova, L. The Impact of Innovation, Knowledge Spillovers and Oil Prices on Economic Growth of the Regions of Kazakhstan. Int. J. Energy Econ. Policy 2020, 10, 78–84. [Google Scholar] [CrossRef]
  14. Maheu, J.M.; Song, Y.; Yang, Q. Oil price shocks and economic growth: The volatility link. Int. J. Forecast. 2020, 36, 570–587. [Google Scholar] [CrossRef] [Green Version]
  15. Dong, B.; Ma, X.; Wang, N.; Wei, W. Impacts of exchange rate volatility and international oil price shock on China’s regional economy: A dynamic CGE analysis. Energy Econ. 2020, 86, 103762. [Google Scholar] [CrossRef]
  16. IEA. World Energy Outlook 2004; OECD Publishing: Paris, France, 2004. [Google Scholar] [CrossRef]
  17. Singh, N.; Nyuur, R.; Richmond, B. Renewable energy development as a driver of economic growth: Evidence from multivariate panel data analysis. Sustainability 2019, 11, 2418. [Google Scholar] [CrossRef] [Green Version]
  18. Asif, M. Sustainable energy options for Pakistan. Renew. Sustain. Energy Rev. 2009, 13, 903–909. [Google Scholar] [CrossRef]
  19. Fernando, C. South Asia Could Be Facing an Energy Crisis. 31 March 2020. Available online: https://earth.org/south-asia-could-be-facing-an-energy-crisis/ (accessed on 30 August 2020).
  20. ADB. Sri Lanka: Energy Sector Assessment, Strategy, and Road Map; The Asian Development Bank: Manila, Philippines, 2019. [Google Scholar] [CrossRef] [Green Version]
  21. World Bank. World Development Indicators; The World Bank: Washington, DC, USA, 2020. [Google Scholar]
  22. Thiranagama, S. In My Mother’s House: Civil War in Sri Lanka, 2011; University of Pennsylvania Press: Philadelphia, PA, USA, 2011. [Google Scholar]
  23. Kraft, J.; Kraft, A. On the relationship between energy and GNP. J. Energy Dev. 1978, 401–403. [Google Scholar]
  24. Ozturk, I. A literature survey on energy–growth nexus. Energy Policy 2010, 38, 340–349. [Google Scholar] [CrossRef]
  25. Park, S.Y.; Yoo, S.H. The dynamics of oil consumption and economic growth in Malaysia. Energy Policy 2014, 66, 218–223. [Google Scholar] [CrossRef]
  26. Bélaïd, F.; Abderrahmani, F. Electricity consumption and economic growth in Algeria: A multivariate causality analysis in the presence of structural change. Energy Policy 2013, 55, 286–295. [Google Scholar] [CrossRef]
  27. Nazlioglu, S.; Kayhan, S.; Adiguzel, U. Electricity consumption and economic growth in Turkey: Cointegration, linear and nonlinear granger causality. Energy Sources Part B Econ. Plan. Policy 2014, 9, 315–324. [Google Scholar] [CrossRef]
  28. Alshehry, A.S.; Belloumi, M. Energy consumption, carbon dioxide emissions and economic growth: The case of Saudi Arabia. Renew. Sustain. Energy Rev. 2015, 41, 237–247. [Google Scholar] [CrossRef]
  29. Shahbaz, M.; Sarwar, S.; Chen, W.; Malik, M.N. Dynamics of electricity consumption, oil price and economic growth: Global perspective. Energy Policy 2017, 108, 256–270. [Google Scholar] [CrossRef] [Green Version]
  30. Omri, A. CO2 emissions, energy consumption and economic growth nexus in MENA countries: Evidence from simultaneous equations models. Energy Econ. 2013, 40, 657–664. [Google Scholar] [CrossRef] [Green Version]
  31. Shahbaz, M.; Zakaria, M.; Shahzad, S.J.H.; Mahalik, M.K. The energy consumption and economic growth nexus in top ten energy-consuming countries: Fresh evidence from using the quantile-on-quantile approach. Energy Econ. 2018, 71, 282–301. [Google Scholar] [CrossRef] [Green Version]
  32. Esen, Ö.; Bayrak, M. Does more energy consumption support economic growth in net energy-importing countries? J. Econ. Financ. Adm. Sci. 2017, 22, 75–98. [Google Scholar] [CrossRef]
  33. Esseghir, A.; Khouni, L.H. Economic growth, energy consumption and sustainable development: The case of the Union for the Mediterranean countries. Energy 2014, 71, 218–225. [Google Scholar] [CrossRef]
  34. Eggoh, J.C.; Bangaké, C.; Rault, C. Energy consumption and economic growth revisited in African countries. Energy Policy 2011, 39, 7408–7421. [Google Scholar] [CrossRef] [Green Version]
  35. Chandio, A.A.; Jiang, Y.; Rehman, A. Energy consumption and agricultural economic growth in Pakistan: Is there a nexus? Int. J. Energy Sect. Manag. 2019, 13, 597–609. [Google Scholar] [CrossRef]
  36. Paramati, S.R.; Apergis, N.; Ummalla, M. Dynamics of renewable energy consumption and economic activities across the agriculture, industry, and service sectors: Evidence in the perspective of sustainable development. Environ. Sci. Pollut. Res. 2018, 25, 1375–1387. [Google Scholar] [CrossRef] [PubMed]
  37. Qiao, H.; Zheng, F.; Jiang, H.; Dong, K. The greenhouse effect of the agriculture-economic growth-renewable energy nexus: Evidence from G20 countries. Sci. Total Environ. 2019, 671, 722–731. [Google Scholar] [CrossRef] [PubMed]
  38. Salim, R.A.; Hassan, K.; Shafiei, S. Renewable and non-renewable energy consumption and economic activities: Further evidence from OECD countries. Energy Econ. 2014, 44, 350–360. [Google Scholar] [CrossRef] [Green Version]
  39. Marques, A.C.; Fuinhas, J.A.; Menegaki, A.N. Renewable vs non-renewable electricity and the industrial production nexus: Evidence from an ARDL bounds test approach for Greece. Renew. Energy 2016, 96, 645–655. [Google Scholar] [CrossRef]
  40. Jarrett, U.; Mohaddes, K.; Mohtadi, H. Oil price volatility, financial institutions and economic growth. Energy Policy 2019, 126, 131–144. [Google Scholar] [CrossRef] [Green Version]
  41. Van Eyden, R.; Difeto, M.; Gupta, R.; Wohar, M.E. Oil price volatility and economic growth: Evidence from advanced economies using more than a century’s data. Appl. Energy 2019, 233, 612–621. [Google Scholar] [CrossRef] [Green Version]
  42. Arshad, A.; Zakaria, M.; Junyang, X. Energy prices and economic growth in Pakistan: A macro-econometric analysis. Renew. Sustain. Energy Rev. 2016, 55, 25–33. [Google Scholar] [CrossRef]
  43. Varghese, G. Inflationary effects of oil price shocks in Indian economy. J. Public Aff. 2017, 17, e1614. [Google Scholar] [CrossRef]
  44. Foudeh, M. The long run effects of oil prices on economic growth: The case of Saudi Arabia. Int. J. Energy Econ. Policy 2017, 7, 171–192. [Google Scholar]
  45. Wesseh Jr, P.K.; Lin, B. Exchange rate fluctuations, oil price shocks and economic growth in a small net-importing economy. Energy 2018, 151, 402–407. [Google Scholar] [CrossRef]
  46. Jobert, T.; Karanfil, F. Sectoral energy consumption by source and economic growth in Turkey. Energy Policy 2007, 35, 5447–5456. [Google Scholar] [CrossRef]
  47. Ebohon, O.J. Energy, economic growth and causality in developing countries: A case study of Tanzania and Nigeria. Energy Policy 1996, 24, 447–453. [Google Scholar] [CrossRef]
  48. Apergis, N.; Payne, J.E.; Menyah, K.; Wolde-Rufael, Y. On the causal dynamics between emissions, nuclear energy, renewable energy, and economic growth. Ecol. Econ. 2010, 69, 2255–2260. [Google Scholar] [CrossRef]
  49. Cobb, C.W.; Douglas, P.H. A theory of production. Am. Econ. Rev. 1928, 18, 139–165. [Google Scholar]
  50. Tugcu, C.T.; Ozturk, I.; Aslan, A. Renewable and non-renewable energy consumption and economic growth relationship revisited: Evidence from G7 countries. Energy Econ. 2012, 34, 1942–1950. [Google Scholar] [CrossRef]
  51. Adewuyi, A.O.; Awodumi, O.B. Biomass energy consumption, economic growth and carbon emissions: Fresh evidence from West Africa using a simultaneous equation model. Energy 2017, 119, 453–471. [Google Scholar] [CrossRef]
  52. Akinlo, A.E. Energy consumption and economic growth: Evidence from 11 Sub-Sahara African countries. Energy Econ. 2008, 30, 2391–2400. [Google Scholar] [CrossRef]
  53. Shahbaz, M.; Van Hoang, T.H.; Mahalik, M.K.; Roubaud, D. Energy consumption, financial development and economic growth in India: New evidence from a nonlinear and asymmetric analysis. Energy Econ. 2017, 63, 199–212. [Google Scholar] [CrossRef] [Green Version]
  54. Bhattacharya, M.; Paramati, S.R.; Ozturk, I.; Bhattacharya, S. The effect of renewable energy consumption on economic growth: Evidence from top 38 countries. Appl. Energy 2016, 162, 733–741. [Google Scholar] [CrossRef]
  55. Lin, Y.; Tu, Y. Robust inference for spurious regressions and cointegrations involving processes moderately deviated from a unit root. J. Econom. 2020, 219, 52–65. [Google Scholar] [CrossRef]
  56. Osabuohien-Irabor, O. Unit root tests in the presence of structural breaks: Evidence from African stock markets. Econ. J. Emerging Markets 2020, 12, 119–137. [Google Scholar] [CrossRef]
  57. Murshed, M. LPG consumption and environmental Kuznets curve hypothesis in South Asia: A time-series ARDL analysis with multiple structural breaks. Environ. Sci. Pollut. Res. 2020. [Google Scholar] [CrossRef] [PubMed]
  58. Dickey, D.A.; Fuller, W.A. Distribution of the estimators for autoregressive time series with a unit root. J. Am. Stat. Assoc. 1979, 74, 427–431. [Google Scholar]
  59. Perron, P. The great crash, the oil price shock, and the unit root hypothesis. Econometrica 1989, 57, 1361–1401. [Google Scholar] [CrossRef]
  60. Altinay, G.; Karagol, E. Structural break, unit root, and the causality between energy consumption and GDP in Turkey. Energy Econ. 2004, 26, 985–994. [Google Scholar] [CrossRef]
  61. Zivot, E.; Andrews, D.W.K. Further evidence on the great crash, the oil-price shock, and the unit-root hypothesis. J. Bus. Econ. Stat. 2002, 20, 25–44. [Google Scholar] [CrossRef]
  62. Murshed, M.; Ferdaus, J.; Rashid, S.; Tanha, M.M.; Islam, J. The Environmental Kuznets Curve hypothesis for deforestation in Bangladesh: An ARDL analysis with multiple structural breaks. Energy Ecol. Environ. 2020. [Google Scholar] [CrossRef]
  63. Murshed, M.; Mahmood, H.; Alkhateeb, T.T.Y.; Banerjee, S. Calibrating the Impacts of Regional Trade Integration and Renewable Energy Transition on the Sustainability of International Inbound Tourism Demand in South Asia. Sustainability 2020, 12, 8341. [Google Scholar] [CrossRef]
  64. Johansen, S. Estimation and hypothesis testing of cointegration vectors in Gaussian vector autoregressive models. Econom. J. Econom. Soc. 1991, 1551–1580. [Google Scholar] [CrossRef]
  65. Gregory, A.W.; Hansen, B.E. Residual-based tests for cointegration in models with regime shifts. J. Econom. 1996, 70, 99–126. [Google Scholar] [CrossRef] [Green Version]
  66. Azam, M.; Alam, M.M.; Hafeez, M.H. Effect of tourism on environmental pollution: Further evidence from Malaysia, Singapore and Thailand. J. Clean. Prod. 2018, 190, 330–338. [Google Scholar] [CrossRef]
  67. Phillips, P.C.; Hansen, B.E. Statistical inference in instrumental variables regression with I (1) processes. Rev. Econ. Stud. 1990, 57, 99–125. [Google Scholar] [CrossRef]
  68. Murshed, M.; Alam, R.; Ansarin, A. The Environmental Kuznets Curve Hypothesis for Bangladesh: The importance of natural gas, liquefied petroleum gas and hydropower consumption. Environ. Sci. Pollut. Res. 2020. [Google Scholar] [CrossRef]
  69. Stock, J.H.; Watson, M.W. A simple estimator of cointegrating vectors in higher order integrated systems. Econom. J. Econom. Soc. 1993, 783–820. [Google Scholar] [CrossRef]
  70. Salahuddin, M.; Gow, J. The effects of Internet usage, financial development and trade openness on economic growth in South Africa: A time series analysis. Telemat. Inform. 2016, 33, 1141–1154. [Google Scholar] [CrossRef] [Green Version]
  71. Hacker, S.; Hatemi-J, A. A bootstrap test for causality with endogenous lag length choice: Theory and application in finance. J. Econ. Stud. 2012, 39, 144–160. [Google Scholar] [CrossRef] [Green Version]
  72. Hacker, R.S.; Hatemi-J, A. Tests for causality between integrated variables using asymptotic and bootstrap distributions: Theory and application. Appl. Econ. 2006, 38, 1489–1500. [Google Scholar] [CrossRef]
  73. Ivanovski, K.; Hailemariam, A.; Smyth, R. The effect of renewable and non-renewable energy consumption on economic growth: Non-parametric evidence. J. Clean. Prod. 2020, 124956. [Google Scholar] [CrossRef]
  74. Samu, R.; Bekun, F.V.; Fahrioglu, M. Electricity consumption and economic growth nexus in Zimbabwe revisited: Fresh evidence from Maki cointegration. Int. J. Green Energy 2019, 16, 540–550. [Google Scholar] [CrossRef]
  75. Bouyghrissi, S.; Berjaoui, A.; Khanniba, M. The nexus between renewable energy consumption and economic growth in Morocco. Environ. Sci. Pollut. Res. 2020. [Google Scholar] [CrossRef]
  76. Adam, P.; Rahim, M.; Rosnawintang, R. The Effect of crude oil prices on economic growth in South East Sulawesi, Indonesia: An application of autoregressive distributed lag model. Int. J. Energy Econ. Policy 2019, 9, 194. [Google Scholar]
  77. Ferdaus, J.; Appiah, B.K.; Majumder, S.C.; Martial, A.A.A. A panel dynamic analysis on energy consumption, energy prices and economic growth in next 11 countries. Int. J. Energy Econ. Policy 2020, 10, 87. [Google Scholar] [CrossRef]
  78. Kisswani, K.M. The Dynamic Links between Oil Prices and Economic Growth: Recent Evidence from Nonlinear Cointegration Analysis for the ASEAN-5 Countries. Emerg. Mark. Financ. Trade 2020, 1–14. [Google Scholar] [CrossRef]
  79. Adams, F.G.; Ichino, Y.; Prazmowski, P.A. Economic growth and energy import requirements: An energy balance model of Thailand. J. Policy Modeling 2020, 22, 219–254. [Google Scholar] [CrossRef]
  80. Frondel, M.; Ritter, N.; Schmidt, C.M.; Vance, C. Economic impacts from the promotion of renewable energy technologies: The German experience. Energy Policy 2010, 38, 4048–4056. [Google Scholar] [CrossRef] [Green Version]
  81. Ahmed, K.; Mahalik, M.K.; Shahbaz, M. Dynamics between economic growth, labor, capital and natural resource abundance in Iran: An application of the combined cointegration approach. Resour. Policy 2016, 49, 213–221. [Google Scholar] [CrossRef]
  82. Bal, D.P.; Dash, D.P.; Subhasish, B. The effects of capital formation on economic growth in India: Evidence from ARDL-bound testing approach. Glob. Bus. Rev. 2016, 17, 1388–1400. [Google Scholar] [CrossRef]
  83. Soava, G.; Mehedintu, A.; Sterpu, M.; Raduteanu, M. Impact of Employed Labor Force, Investment, and Remittances on Economic Growth in EU Countries. Sustainability 2020, 12, 141. [Google Scholar] [CrossRef]
  84. Fadiran, G.; Adebusuyi, A.T.; Fadiran, D. Natural gas consumption and economic growth: Evidence from selected natural gas vehicle markets in Europe. Energy 2019, 169, 467–477. [Google Scholar] [CrossRef]
  85. Keho, Y. The impact of trade openness on economic growth: The case of Cote d’Ivoire. Cogent Econ. Financ. 2017, 5, 1332820. [Google Scholar] [CrossRef]
  86. Destek, M.A.; Aslan, A. Renewable and non-renewable energy consumption and economic growth in emerging economies: Evidence from bootstrap panel causality. Renew. Energy 2017, 111, 757–763. [Google Scholar] [CrossRef]
  87. Shakouri, B.; Khoshnevis Yazdi, S. Causality between renewable energy, energy consumption, and economic growth. Energy Sources Part B Econ. Plan. Policy 2017, 12, 838–845. [Google Scholar] [CrossRef]
  88. Aydin, M. The effect of biomass energy consumption on economic growth in BRICS countries: A country-specific panel data analysis. Renew. Energy 2019, 138, 620–627. [Google Scholar] [CrossRef]
  89. Sankaran, A.; Kumar, S.; Arjun, K.; Das, M. Estimating the causal relationship between electricity consumption and industrial output: ARDL bounds and Toda-Yamamoto approaches for ten late industrialized countries. Heliyon 2019, 5, e01904. [Google Scholar] [CrossRef] [Green Version]
  90. Nwani, C. Causal relationship between crude oil price, energy consumption and carbon dioxide (CO2) emissions in Ecuador. OPEC Energy Rev. 2017, 41, 201–225. [Google Scholar] [CrossRef]
  91. Bekun, F.V.; Agboola, M.O. Electricity consumption and economic growth nexus: Evidence from Maki cointegration. Eng. Econ. 2019, 30, 14–23. [Google Scholar] [CrossRef] [Green Version]
  92. Topcu, E.; Altinoz, B.; Aslan, A. Global evidence from the link between economic growth, natural resources, energy consumption, and gross capital formation. Resour. Policy 2020, 66, 101622. [Google Scholar] [CrossRef]
  93. Haque, A.U.; Kibria, G.; Selim, M.I.; Smrity, D.Y. Labor Force Participation Rate and Economic Growth: Observations for Bangladesh. Int. J. Econ. Financ. Res. 2019, 5, 209–213. [Google Scholar] [CrossRef]
Figure 1. The real GDP per capita trends in Sri Lanka. Source: World Development Indicators [21].
Energies 13 06565 g001
Figure 2. The real GDP per capita and energy use per capita trends in Sri Lanka. Note: Energy use per capita (left axis); Real GDP per capita (right axis). Source: World Development Indicators [21].
Energies 13 06565 g002
Figure 3. The trends in Sri Lanka’s energy imports and world crude oil prices. Note: Net energy imports (left axis); real crude oil price (right axis). Source: World Development Indicators [21] and British Petroleum Statistical Review of World Energy.
Energies 13 06565 g003
Table 1. Table of hypothesis.
Explanatory VariableRelationship with lnGVAElasticity
lnEPositive 1 > 0
lnONegative 2 < 0
lnEIMAmbiguous 3 > 0 or 3 < 0
(lnO*lnEIM)Ambiguous 4 > 0 or 4 < 0
lnKPositive 5 5 > 0
lnLPositive 6 > 0
Table 2. The descriptive statistics and variance inflation factor analysis.
Panel A: The Descriptive Statistics
VariableMinMaxMeanSt. Dev.SkewnessKurtosisObservations
lnGVA6.5478.2007.3350.5170.2341.84248
lnAVA4.9105.5615.2250.2040.5502.49148
lnIVA5.1186.8595.9230.5840.1861.68248
lnSVA5.7147.6296.6640.5960.1721.81148
lnE5.6816.3185.9390.2070.3561.48848
lnO0.6414.6923.1940.932−0.6502.18948
lnEIM3.1453.8883.5310.265−0.4311.34648
lnK20.88423.97422.6810.815−0.1192.47248
lnL−0.5880.6770.0540.3890.0751.49948
Panel B: The Variance Inflation Factor (VIF) Test Results
VariableVIF1/VIFVariableVIF1/VIFMean VIF
lnE1.570.832lnK3.210.2852.97
lnO4.580.219lnL3.130.319
lnEIM2.360.259
Table 3. The Zivot-Andrews unit root test results.
VariableLevel, I(0)1st Diff., I(1)Order of Integration
Test Stat.Break YearTest Stat.Break Year
lnGVA−3.533 (2)1987−7.427 *** (1)1990I(1)
lnAVA−3.095 (3)1996−8.079 *** (2)1998I(1)
lnIVA−4.262 (2)1997−6.891 *** (1)2000I(1)
lnSVA−3.453 (2)1987−6.492 *** (1)2011I(1)
lnE−4.723(1)1996−8.379 *** (1)1996I(1)
lnO−3.269 (1)2005−7.867 *** (2)1987I(1)
lnEIM−4.269 (1)1993−6.534 *** (0)1993I(1)
lnK−3.950 (2)2010−7.056 *** (2)1981I(1)
lnL−4.727 (1)1996−9.951 *** (2)1982I(1)
(lnO*lnEIM)−4.118 (1)2001−8.129 *** (1)2004I(1)
Notes: The optimal lag selection is selected on the Akaike Information Criterion (AIC); the break is considered to be in both the trend and the intercept; the lag lengths are provided within the parentheses; *** denotes statistical significance at 1% (α = 0.01) level.
Table 4. The Gregory-Hansen Cointegration test results.
ModelLagsADF Stat.BYZt Stat.BYZa Stat.BY
14−6.920 **1996−7.730 ***1999−91.860 **1999
23−7.950 ***2001−6.900 **2002−42.9902002
34−7.730 ***2001−8.220 ***2001−62.3002001
44−8.920 ***2010−7.820 ***1993−53.3301993
Notes: The optimal lags are based on AIC; The endogenous break is assumed to be in the regime and trend; ADF, Zt and Za denote the modified Augmented Dickey-Fuller and z-statistics respectively; BY refers to the location of the structural break date; *** and ** denote statistical significance at 1% (α = 0.01) and 5% (α = 0.05) significance levels.
Table 5. The long-run elasticity estimates in the context of model (1).
Model(1)(1)
Dep. Var.lnGVAlnGVA
EstimatorDOLSFMOLS
Regressor
lnE1.338 ***1.707 ***
(0.151)(0.330)
lnO−0.145 ***−0.086 ***
(0.016)(0.030)
lnEIM−0.727 ***−0.556 ***
(0.058)(0.173)
(lnO*lnEIM)−0.118 ***−0.308 ***
(0.029)(0.096)
lnK0.632 ***0.563 ***
(0.029)(0.054)
lnL0.612 ***0.258 ***
(0.045)(0.064)
BY1−0.406 ***−0.172 *
(0.061)(0.093)
BY2−0.1070.122
(0.072)(0.088)
Constant5.312 ***3.234 **
(0.631)(1.444)
Observations4547
Adj. R20.8980.887
Diagnostics
Durbin-Watson2.1312.412
J-B Normality0.1800.190
χ2 LM1.5521.271
χ2 WHITE1.7011.543
χ2 ARCH1.2110.815
χ2 RESET0.3110.335
Notes: The optimal lag selection is based on AIC; the robust standard errors are reported within the parentheses; BY1 and BY2 denote the first and second break year dummy variables which have been prepared according to the corresponding breaks years identified from the Gregory-Hansen cointegration analysis; *** and ** denote statistical significance at 1% (α = 0.01) and 5% (α = 0.05) levels, respectively.
Table 6. The long-run elasticity estimates in the context of models (2–4).
Model(2)(2)(3)(3)(4)(4)
Dep. Var.lnAVAlnAVAlnIVAlnIVAlnSVAlnSVA
EstimatorDOLSFMOLSDOLSFMOLSDOLSFMOLS
Regressor
lnE0.046 **0.038 **1.708 ***1.801 ***1.940 ***2.159 ***
(0.022)(0.019)(0.205)(0.343)(0.168)(0.407)
lnO−0.108−0.017−0.177 ***−0.121 ***−0.176 ***−0.118 ***
(0.117)(0.016)(0.022)(0.031)(0.018)(0.037)
lnEIM−0.218 ***−0.225 **−0.831 ***−0.487 ***−0.874 ***−0.726 ***
(0.042)(0.094)(0.079)(0.180)(0.065)(0.213)
(lnO*lnEIM)−0.182 ***−0.112 **−0.189 ***−0.298 ***−0.550 ***−0.709 ***
(0.020)(0.052)(0.038)(0.069)(0.111)(0.118)
lnK0.555 ***0.457 ***0.710 ***0.607 ***0.729 ***0.622 ***
(0.020)(0.029)(0.038)(0.055)(0.031)(0.066)
lnL0.984 ***0.907 ***0.468 ***0.329 ***0.752 ***0.272 ***
(0.032)(0.036)(0.060)(0.066)(0.049)(0.078)
BY1−0.030−0.042−0.321 ***−0.161 *−0.611 ***−0.251 **
(0.043)(0.050)(0.082)(0.096)(0.068)(0.114)
BY2−0.174 ***0.035−0.0560.148−0.236 ***0.101
(0.051)(0.047)(0.097)(0.091)(0.079)(0.108)
Constant12.618 ***11.631 ***2.471 ***2.153 ***2.186 ***−1.087
(0.453)(0.784)(0.859)(0.502)(0.704)(1.780)
Observations454745474547
Adj. R20.8980.8830.8980.8870.8990.882
Diagnostics
Durbin-Watson2.6172.3392.2712.1112.5362.529
J-B Normality0.1660.1550.1990.2010.1660.189
χ2 LM1.5291.5011.7811.8901.6011.688
χ2 WHITE1.6121.5611.6171.6811.8911.765
χ2 ARCH1.0811.2130.6790.7001.3121.098
χ2 RESET0.3210.2610.2980.2240.2980.271
Notes: The optimal lag selection is based on AIC; the robust standard errors are reported within the parentheses; BY1 and BY2 denote the first and second break year dummy variables which have been prepared according to the corresponding breaks years identified from the Gregory-Hansen cointegration analysis; *** and ** denote statistical significance at 1% (α = 0.01) and 5% (α = 0.05) levels, respectively.
Table 7. The Hacker-Hatemi-J bootstrapped causality test results.
Model (1)Model (2)Model (3)Model (4)
Null HypothesisMW Stat.Null HypothesisMW Stat.Null HypothesisMW Stat.Null HypothesisMW Stat.
lnE ≠→ lnGVA15.302 ***lnE ≠→ lnAVA4.091lnE ≠→ lnIVA9.787 ***lnE ≠→ lnSVA16.589 ***
lnGVA ≠→ lnE13.145 ***lnAVA ≠→ lnE2.959lnIVA ≠→ lnE11.093 ***lnSVA ≠→ lnE7.433 **
lnO ≠→ lnGVA8.734 **lnO ≠→ lnAVA3.347lnO ≠→ lnIVA9.359 ***lnO ≠→ lnSVA2.061
lnGVA ≠→ lnO4.322lnAVA ≠→ lnO1.414lnIVA ≠→ lnO3.584lnSVA ≠→ lnO1.121
lnEIM ≠→ lnGVA10.414 ***lnEIM ≠→ lnAVA1.658lnEIM ≠→ lnIVA10.174 ***lnEIM ≠→ lnSVA12.993 ***
lnGVA ≠→ lnEIM3.691lnAVA ≠→ lnEIM4.915lnIVA ≠→ lnEIM2.825lnSVA ≠→ lnEIM2.254
lnK ≠→ lnGVA13.123 ***lnK ≠→ lnAVA6.111 **lnK ≠→ lnIVA19.441 ***lnK ≠→ lnSVA7.122 **
lnGVA ≠→ lnK4.576lnAVA ≠→ lnK1.367lnIVA ≠→ lnK2.228lnSVA ≠→ lnK2.337
lnL ≠→ lnGVA11.678 ***lnL ≠→ lnAVA14.859 ***lnL ≠→ lnIVA17.287 ***lnL ≠→ lnSVA13.114 ***
lnGVA ≠→ lnL1.498lnAVA ≠→ lnL5.226lnIVA ≠→ lnL3.788lnSVA ≠→ lnL3.636
Notes: ≠→ denotes does not Granger causes; the modified Wald statistics are estimated using bootstrap approach; *** and ** denote statistical significance at 1% (α = 0.01) and 5% (α = 0.05) significance levels, respectively.
Publisher’s Note: MDPI stays neutral with regard to jurisdictional claims in published maps and institutional affiliations.

