Article

Application of Phase Change Tracking Approach in Predicting Condensate Blockage in Tight, Low, and High Permeability Reservoirs

by
Benedicta Bilotu Onoabhagbe
,
Paul Russell
,
Johnson Ugwu
and
Sina Rezaei Gomari
*
School of Computing, Engineering and Digital Technologies, Teesside University, Tees Valley, Middlesbrough TS1 3BX, UK
*
Author to whom correspondence should be addressed.
Energies 2020, 13(24), 6551; https://doi.org/10.3390/en13246551
Submission received: 22 October 2020 / Revised: 6 December 2020 / Accepted: 8 December 2020 / Published: 11 December 2020
(This article belongs to the Special Issue Recent Progress in the Application of Gas Geochemistry)

Abstract

:
Prediction of the timing and location of condensate build-up around the wellbore in gas condensate reservoirs is essential for the selection of appropriate methods for condensate recovery from these challenging reservoirs. The present work focuses on the use of a novel phase change tracking approach in monitoring the formation of condensate blockage in a gas condensate reservoir. The procedure entails the simulation of tight, low and high permeability reservoirs using global and local grid analysis in determining the size and timing of three common regions (Region 1, near wellbore; Region 2, condensate build-up; and Region 3, single-phase gas) associated with single and two-phase gas and immobile and mobile gas condensate. The results show that permeability has a significant influence on the occurrence of the three regions around the well, which in turn affects the productivity of the gas condensate reservoir studied. Predictions of the timing and location of condensate in reservoirs with different permeability levels of 1 mD to 100 mD indicate that local damage enhances condensate formation by 60% and shortens the duration of the immobile phase by 45%. Meanwhile, the global change in permeability increases condensate formation by 80% and reduces the presence of the immobile phase by 60%. Finally, this predictive approach can help in mitigating condensate blockage around the wellbore during production.

1. Introduction

Recently, low-permeability tight gas condensate reservoirs, or so-called unconventional reservoirs, have been a focus for exploitation by operators across the world [1]. Condensate blockage in a gas condensate reservoir occurs due to a rapid decline in pressure below the dew point. This is a common problem in tight reservoirs, which can experience severe damage near the wellbore [2,3]. Production from such reservoirs usually displays an extensive period of transient flow, during which a two-phase flow of oil and gas begins [4], where the oil phase is often referred to as “condensate” or “distillate” [5].
The behaviour of such reservoirs is intricate and not fully understood, particularly in vicinity of the wellbore region where the most significant pressure drops occur. Condensate formation results in a build-up of a liquid phase around the wellbore, and this process creates a concentric zone with different liquid saturations around the wellbore [6,7,8]. Condensate blockage near the wellbore can cause a substantial loss in production for low-to-moderate permeability condensate reservoirs since the main source of pressure loss in tight reservoirs depends primarily on reservoir permeability [9]. Tight condensate reservoirs have an extreme tendency to produce hydrates and are very sensitive to the development of damage as compared to high permeability reservoirs. Furthermore, the primary recovery factors are less than 20%, which thereby implies an urgent need for advanced technology solutions. The application of such techniques requires the accurate prediction of condensate formation with respect to timing and location in the reservoir [10,11].
Literature sources state that three gas–liquid phase zones may be present during the productive life of a condensate reservoir [12,13,14,15,16,17,18,19,20]: a mobile phase involving the movement of both gas and condensate towards the wellbore; a condensation phase including mobile gas and immobile condensate; finally a single phase of the hydrocarbon where the fluid pressure is above the dew point pressure, known as the gas phase. Due to the lower permeability to liquid and a higher liquid-to-gas viscosity ratio, most of the condensate liquid present in the reservoir is unrecoverable; hence condensate loss is a significant economic concern [21].
To understand the problems encountered during production and the optimisation techniques employed to enhance deliverability, changes in the behaviour of the fluid phase and the timing of condensation need to be investigated in a gas condensate reservoir. Allahyari et al. [21] investigated a series of fine grid numerical compositional simulations with gas condensate and dry gas reservoir data considering condensate at well bore as ‘skin factor’ to calculate reservoir production levels. They concluded that the absolute permeability and pressure drawdown of the well have an important effect on gas deliverability and the condensate blockage skin factor. Orodu [22] studied the effect of liquid dropout at the near wellbore on well production at low pressure and condensate unloading pressure. It was found that production should be investigated under a high flowing pressure above the dew point pressure to avoid the liquid dropout effect.
A compositional simulation study was conducted by Marhaendrajan [23] to give a better understanding of gas condensate reservoir performance, specifically investigating the parameters that affect condensate blockage. The results showed that gas production rate, gas composition, critical liquid saturation, absolute permeability, and rate scheme could very much affect condensate blockage, where the permeability and critical liquid saturation are most significant. Khazamet et al. [24] studied gas well deliverability forecasting in a condensate reservoir using a compositional and modified black oil model. They investigated the impact of condensate blockage liquid drop-out by examining several fluid parameters such as the reservoir’s absolute permeability (K), critical condensate saturation (Scc), relative permeability shape, and endpoints (krgmax, kromax). The results showed that a permeability of 5 mD has a more significant effect on well deliverability compared to 50 mD and 200 mD with negligible impact.
Bilotu Onoabhagbe et al. [25] developed a novel approach to the tracking of the timing and location of condensation formation in a gas condensate reservoir. The study involved a compositional study of changes in hydrocarbon components over time from the reservoir to the near wellbore. The results were used as a guide for the optimisation of condensate production and also helped in providing a better understanding of the changes in the hydrocarbon phase in the near-wellbore area of the reservoir.
This paper describes research extending the work by Bilotu Onoabhagbe et al. [25] in using proposed tracking approach to predict condensation behaviour in a gas condensate reservoir with different permeability variables. Furthermore, a sensitivity study was performed on one of the major flow parameters to verify the reliability of the proposed approach. Two different global and local methods based on the grid system of the reservoir with respect to permeability variation were utilised for the prediction of the timing and location of condensate formation during production.

1.1. Model Construction

The Eclipse 300 (educational version) compositional simulator was utilised for the investigation of the effect of permeability on condesate formation across the wellbore using the phase change tracking approach. A 3D model was built for the reservoir study based on real field data obtained from Kenyon’s study [26]. The grid block used is a Cartesian model with a 9 × 9 × 4 grids, with a porosity of 0.13 and a permeability of 100 mD homogeneously distributed over the whole reservoir which has four layers with a single producing vertical well drilled at the corner of the cell placed at (I: 7 J: 7 K: 1) in the XYZ direction. The thickness of the layers is varied from 30 ft (layers 1 and 2) to 50 ft (layer 3 and 4) from the reservoir top to bottom. A reservoir fluid sample of nine pseudo-components was used to describe fluid properties in the model. The model was used to develop a base case of natural depletion without an injection well and was run for a production period of 15 years.
From the base case model, a series of sensitivity analyses were performed to compare the condensate saturation profile, pressure profile, condensate liquid volume, hydrocarbon composition, and description of condensate regions for different reservoir permeability scenarios. The analyses were divided into two parts of global and local grid analysis as described below.

1.2. Global Grid Analysis

This refers to the parent grid (the reservoir grid block in the global grid), where the range of I-, J-, and K- indices refer to the global grid. In other words, it can be referred to in simple terms as reservoir block cells having a homogeneous value such as of permeability and porosity. Three reservoir scenarios were investigated, which are: low permeability reservoirs characterised by permeability values of 0.5 mD, 1 mD, 5 mD, and 10 mD; moderate permeability reservoirs with permeabilities of 20 mD, 30 mD, and 50 mD; and high permeability reservoirs with values of 75 mD and 100 mD (the latter one considered as the base case scenario).

1.3. Local Grid Analysis

The local grids refer to blocks in the vicinity of the wellbore. A selected reservoir block cell was applied to describe the effect of permeability variations around the wellbore on condensate formation during production. A cell or a box of cells are identified by their global grid coordinates I1–I2, J1–J2, K1–K2 which is replaced by refined cells. The sizes within the refined grid are specified as NX, NY, NZ. The blocks taken into consideration for the local grid analysis are located at (I: 6 to 8, J: 6 to 8, K: 4 to 4) grid cells. Figure 1 shows the selected blocks (highlighted in yellow) on the surface of layer one. However, the main point of interest is the fourth layer with the same pattern as that selected in the layer one.

2. Methodology

The production activities of a gas condensate reservoir depend on a basic understanding of the phase and flow behaviour of the hydrocarbon in the reservoir. Similarly, if compared with another reservoir (dry gas), it can be noted that many singular features affect the production and performance of a gas condensate reservoir during depletion. In this work, the effect of permeability on well production performance in a gas condensate reservoir and the timing of condensate formation in each region around the well-bore in the reservoir during depletion were analysed. A sensitivity study was carried out using several permeability ranges to evaluate their impact on the different types of reservoir studied using the compositional simulator.
The following tasks were accomplished to complete the study:
  • An evaluation of the effect of variation in absolute permeability on the three regions proposed by Fevang and Whitson [6].
  • An assessment of global and local grid block cells within and around the wellbore.
  • Prediction of the occurrence of condensate saturation in each region of the reservoir as a function of time for each grid block based on the phase tracking approach proposed by Bilotu Onoabhagbe et al. [25].
  • Calculation of the condensate formation, immobile phase and percentage difference in condensate saturation by assuming a logarithmic relationship with permeability.
The simulation results for the global and local analyses were then compared using the following parameters: the pressure drawdown effect, condensate saturation profile for each region, and hydrocarbon composition. Percentage differences in condensate saturation and the condensate immobile phase for both analyses were also evaluated to determine the onset of condensate blockage in the well-bore.

3. Results and Discussion

3.1. Impact of Variation in Global and Local Permeability on Condensate Formation

The results for calculated reservoir pressure at the wellbore for the global and local grid analyses for reservoirs with different permeabilities are shown in Figure 2 and Figure 3, respectively. As can be seen, initial sharp pressure drops were observed for permeability variables of 0.5 mD and 1 mD which stabilised at day 73 of production, and thereafter linear pressure drops over time were noted. The other permeability variables show trends similar to the base case. The lower the reservoir permeability, the more abundant the gas and the higher the pressure drawdown will be during production, which indicates a high potential for condensate blockage. Based on observed pressure drops in all cases, the percentage difference in pressure in low permeability reservoirs compared to other reservoir scenarios is about 280% in the global grid analysis, indicating a rationale for condensate formation in low permeability reservoirs.
Figure 3 presents the pressure drops for all scenarios for the local grid analysis against production time. The pressure difference for the tight permeability reservoir (0.5 mD and 1 mD) is 630.73 psia compared to 498 psia for the global case. The stabilization time was found to be the same as that in the global analysis, but with a different level of pressure drop. The percentage of pressure drawdown for the local grid analysis is 285%, suggesting that the tendency toward condensate formation for local grids with low permeability is higher compared to global permeability variables. This effect in pressure is reflected in condensate saturation for the studied cases. The sharp decrease in well productivity due to decreases in permeability in this work, specifically for local permeability variation, is in-line with results reported by Ahmadi et al. [8] who emphasized a significant reduction in the well productivity owing to a sharp fall in the effective permeability of the gas.
Figure 4 and Figure 5 shows the condensate saturation profile in a logarithmic scale for the global and local grid analyses respectively. Figure 4 shows an increase in condensate saturation as production time increases for the different types of permeability reservoirs scenarios.
The results show an increase in condensate saturation from high to low permeability cases (100 mD to 10 mD) which is not as significant as that observed in the tight permeability case below 10 mD. For instance, the change in condensate saturation between 100 mD to 10 mD is only 7% higher, while for 10 mD to 1 mD this change is about 66%. This indicates that reservoirs with permeability levels lower than 10 mD might have severe problems with condensate formation. Figure 5 shows a similar trend in condensate saturation for reservoirs with permeability in the locally damaged region range of 100 mD to 1 mD. However, the lower permeability values below 10 mD are more sensitive to permeability changes in condensate formation than that the case of the global analysis. As can be seen in Figure 5, the level of condensate saturation shows no change when near-wellbore permeability is reduced from 100 mD to 50 mD, while a reduction from 10 mD to 1 mD leads to 77% more condensate. These results demonstrate that condensate formation is very sensitive to near-wellbore formation damage. It should be noted that the first condensation in the reservoir was observed after 36.5 days of production in both global and local analyses. Moreover, it took 73 days for condensate drop-out to result in condensate build-up in both cases.
The values of maximum condensate saturation from the global and local grid analyses for the studied reservoirs are shown in Table 1 and Table 2, respectively. The critical application of condensate saturation as a function of time can be used to predict the timing of condensate formation and how far each region extends during depletion.

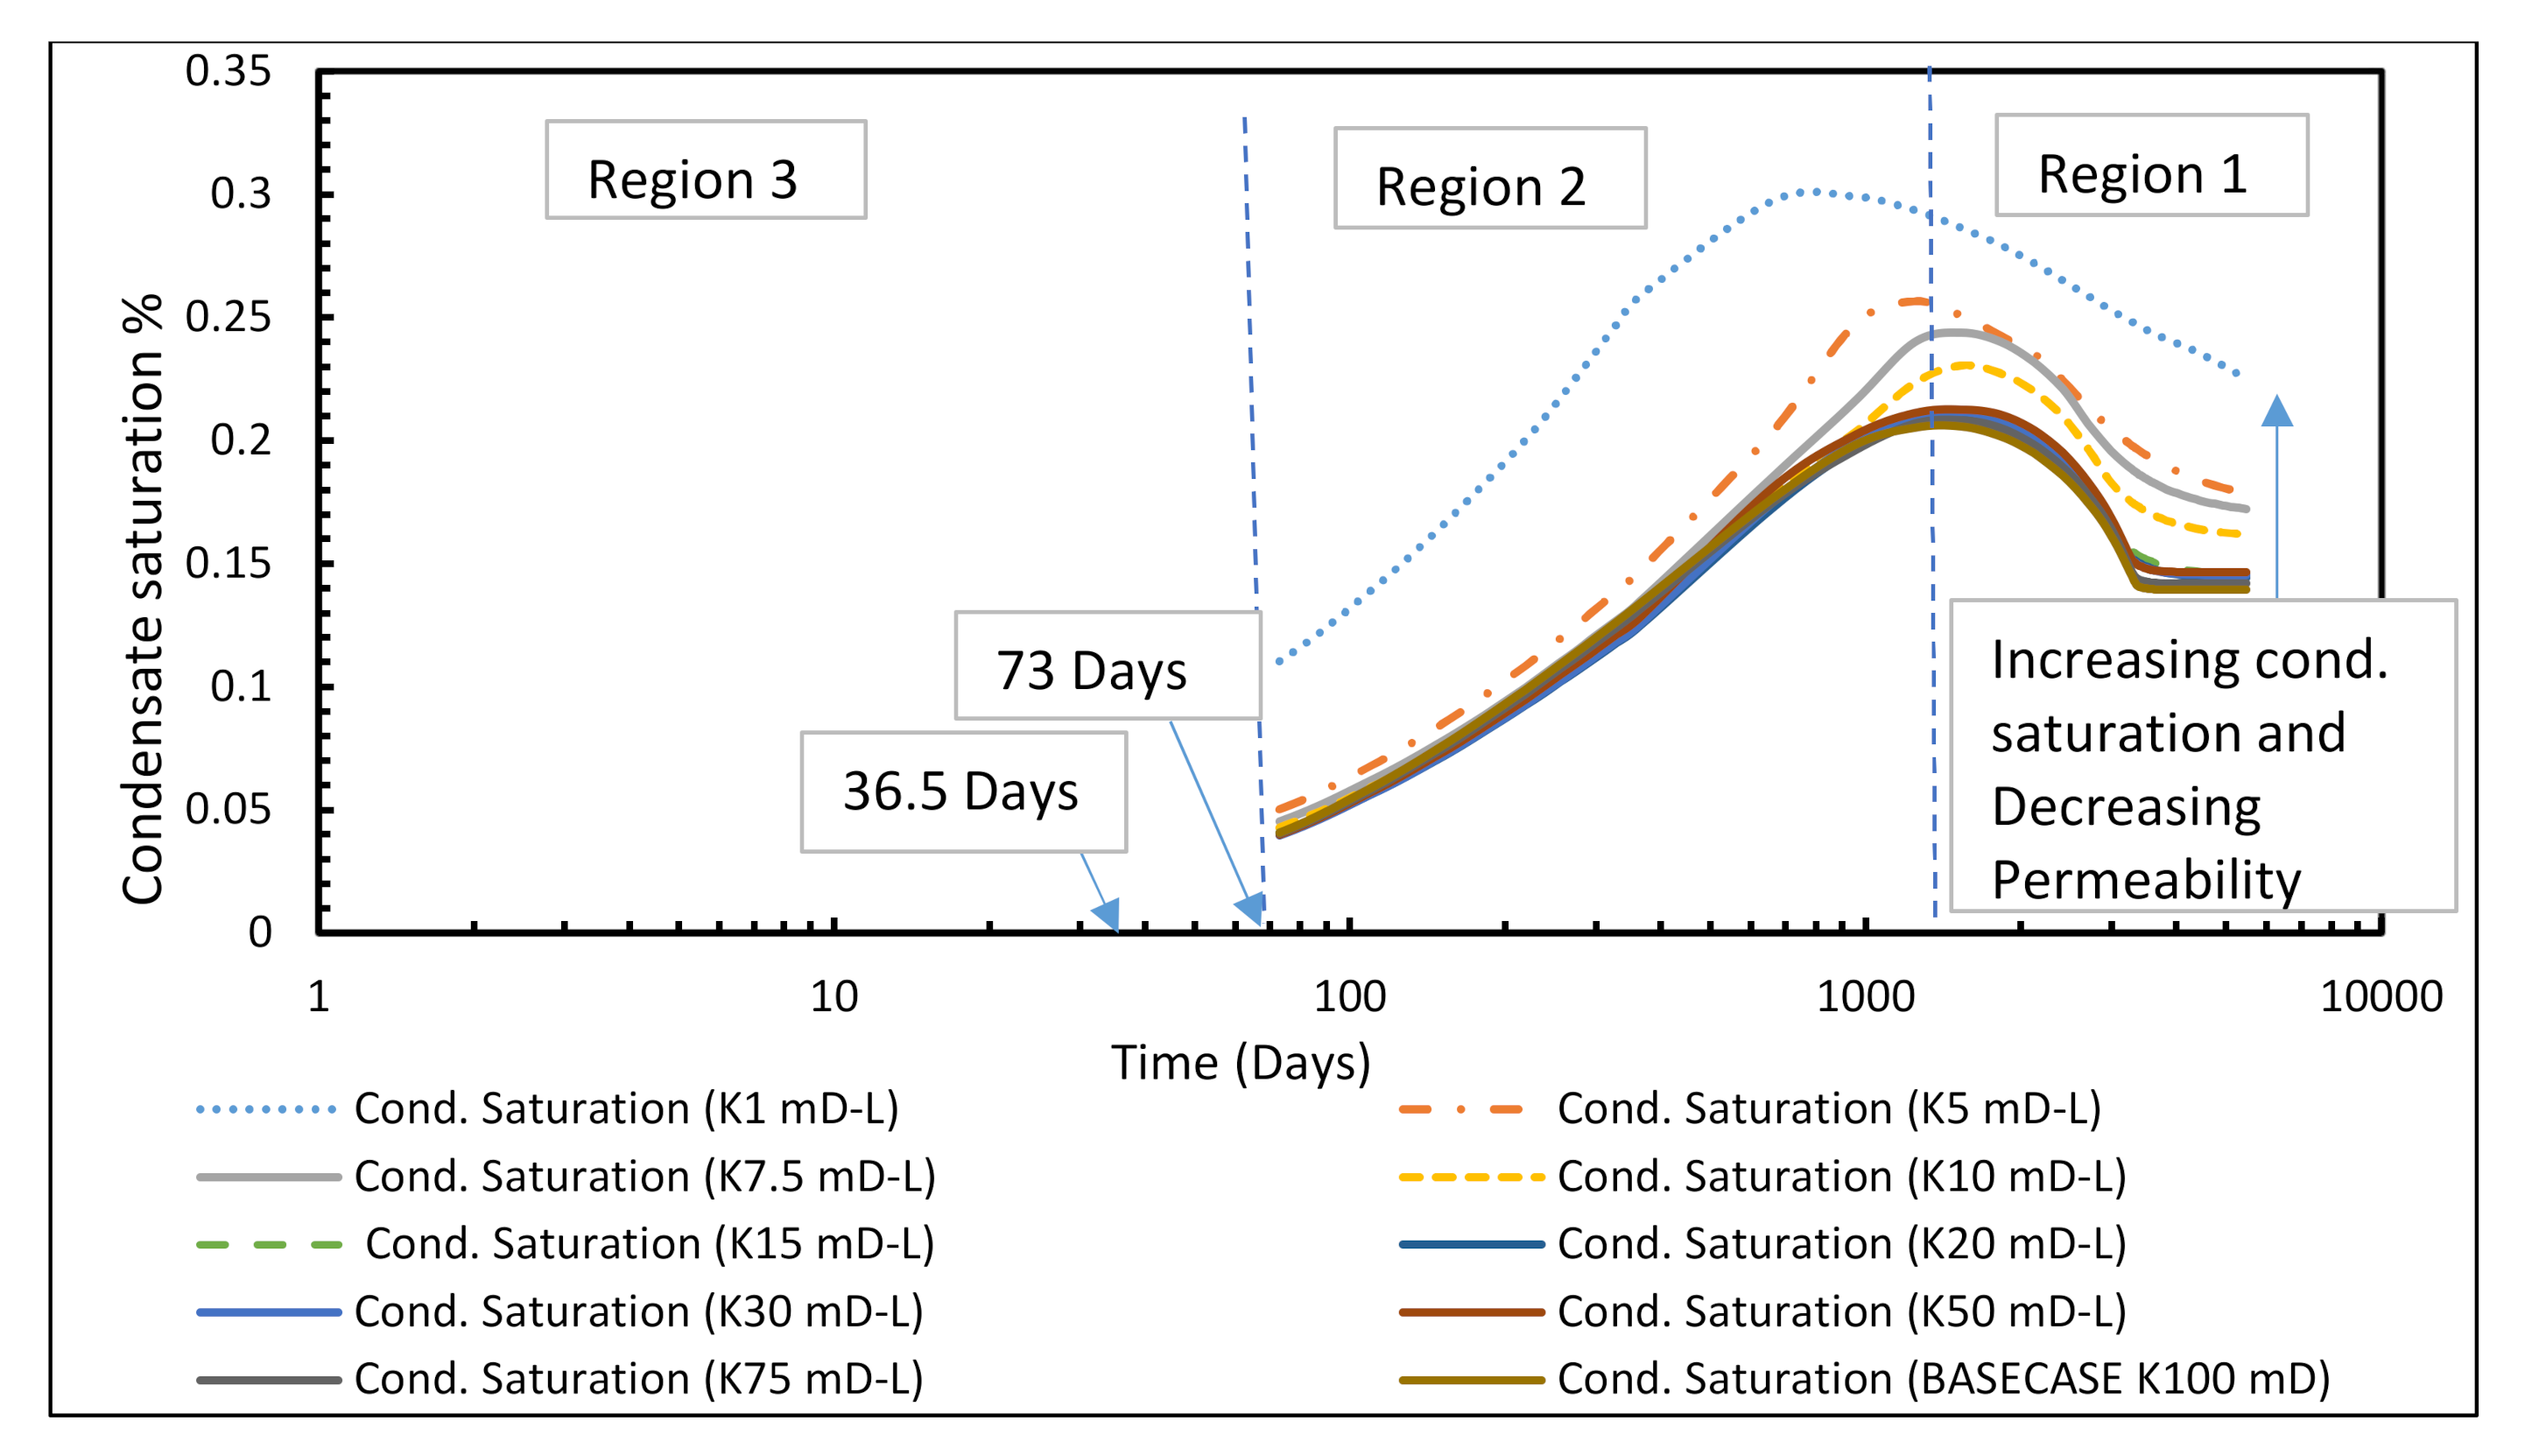
3.2. Impact of Variation in Permeability on the Length of Time of Each Region

For given production conditions, one, two, or all three regions may exist. The pseudo-steady-state flow conditions define these three regions, which means that they represent the steady-state conditions at a given time which then change gradually during depletion. The three regions from Table 1 and Table 2 are explained below. Five cases of permeability variation of 1 mD, 5 mD, 10 mD, 50 mD, and 100 mD were selected to show the effect in each region and to find the relationship between the proposed logarithmic trend and the R-squared factors for correlation in both analyses.

3.2.1. Region 1: Condensate and Gas Are Both Mobile

Figure 6 shows an increase in duration for Region 1 as permeability increases from low to high permeability reservoirs in both analyses. The region represents the mobile phases for both condensate and gas; a longer duration reflects an increase in condensate production. A significant reduction in phase mobility is observed for reservoirs with a permeability of lower than 10 mD. The same trend was observed in the local grid analysis. It then experiences a constant increase in duration of Region 1 at 1496.5 days from lower to higher permeability reservoirs of 10–100 mD. Condensate saturation is determined as a function of time, to ensure that liquid which condenses from a single-gas phase entering Region 1 have adequate mobility to flow through and out of this region without any net build-up. As shown in Figure 6, the duration of Region 1 follows a logarithmic trend in both global and local analyses, with an R-squared factor of 79% to 87% accuracy to predict Region 1. This region is known as the primary source of deliverability losses in a gas condensate well due to the coexistence of condensate and gas phases. Earlier work by Valencia et al. [27] attributed this behaviour to the decrease in the relative permeability of gas due to condensate build-up in Region 1.

3.2.2. Region 2: Only Gas Is Mobile, and the Condensate Is Immobile

Region 2 is the zone of condensate accumulation and represents the point in time of the first liquid drop-out to the time it takes to reach critical condensate saturation. Due to condensate drop-out, the flowing gas phase becomes leaner. Regions 2 and 3 are short near the wellbore but become longer as production moves away from the wellbore. The duration of Region 2 declines with time as that of Region 1 expands over time, hence Region 2 coexists with Region 1.
The results are tabulated in Table 1 and Table 2 and depicted in Figure 7 for tight reservoirs, or damaged formations in local cases. Figure 7 presents the logarithmic trends for global and local analyses with values of the R-squared factor at 84% to 93% in predicting the duration of Region 2 against permeability. The duration of Region 2 dominates condensate production, where the reservoir experiences the immobile phase for a longer period. As permeability increases, the duration of Region 2 decreases and consequently the chance of condensate formation decreases where sharp decrease was observed for the values of permeability from 1 to 10 mD for both cases. Further increase in permeability shows the duration of Region 2 having a fixed value of around 2000 days.

3.2.3. Region 3: Only the Gas Phase Exists

Region 3 is the outer boundary of the reservoir and consists of a single gas phase. This region shows an increase in duration from low- to medium-permeability reservoirs (shown in Table 1 and Table 2) with values of 1–20 mD in the global analysis and 1–15 mD in the local analysis (Figure 8). A constant duration of 2117 days was observed for permeability values of 30–75 mD in the global analysis and 20–75 mD in the local. A further increase in permeability to 100 mD (base case) showed a decrease to 2044 days in both analyses. The logarithmic trends extracted for Region 3 for the global and local analyses have values of the R-squared factor of 78% to 85%, used to predict Region 3.
Looking at the three regions for tight reservoirs or those with severely damaged formations, it can be seen that the duration of Region 3 is zero, meaning that the condensate never reaches this region during the applied simulation time-step in this study, and Region 2 dominates the reservoir’s phase behaviour. In this case, as shown in Table 1 and Table 2, the global analysis condensate saturation is the highest and the probability of condensate blockage is thus greatest.

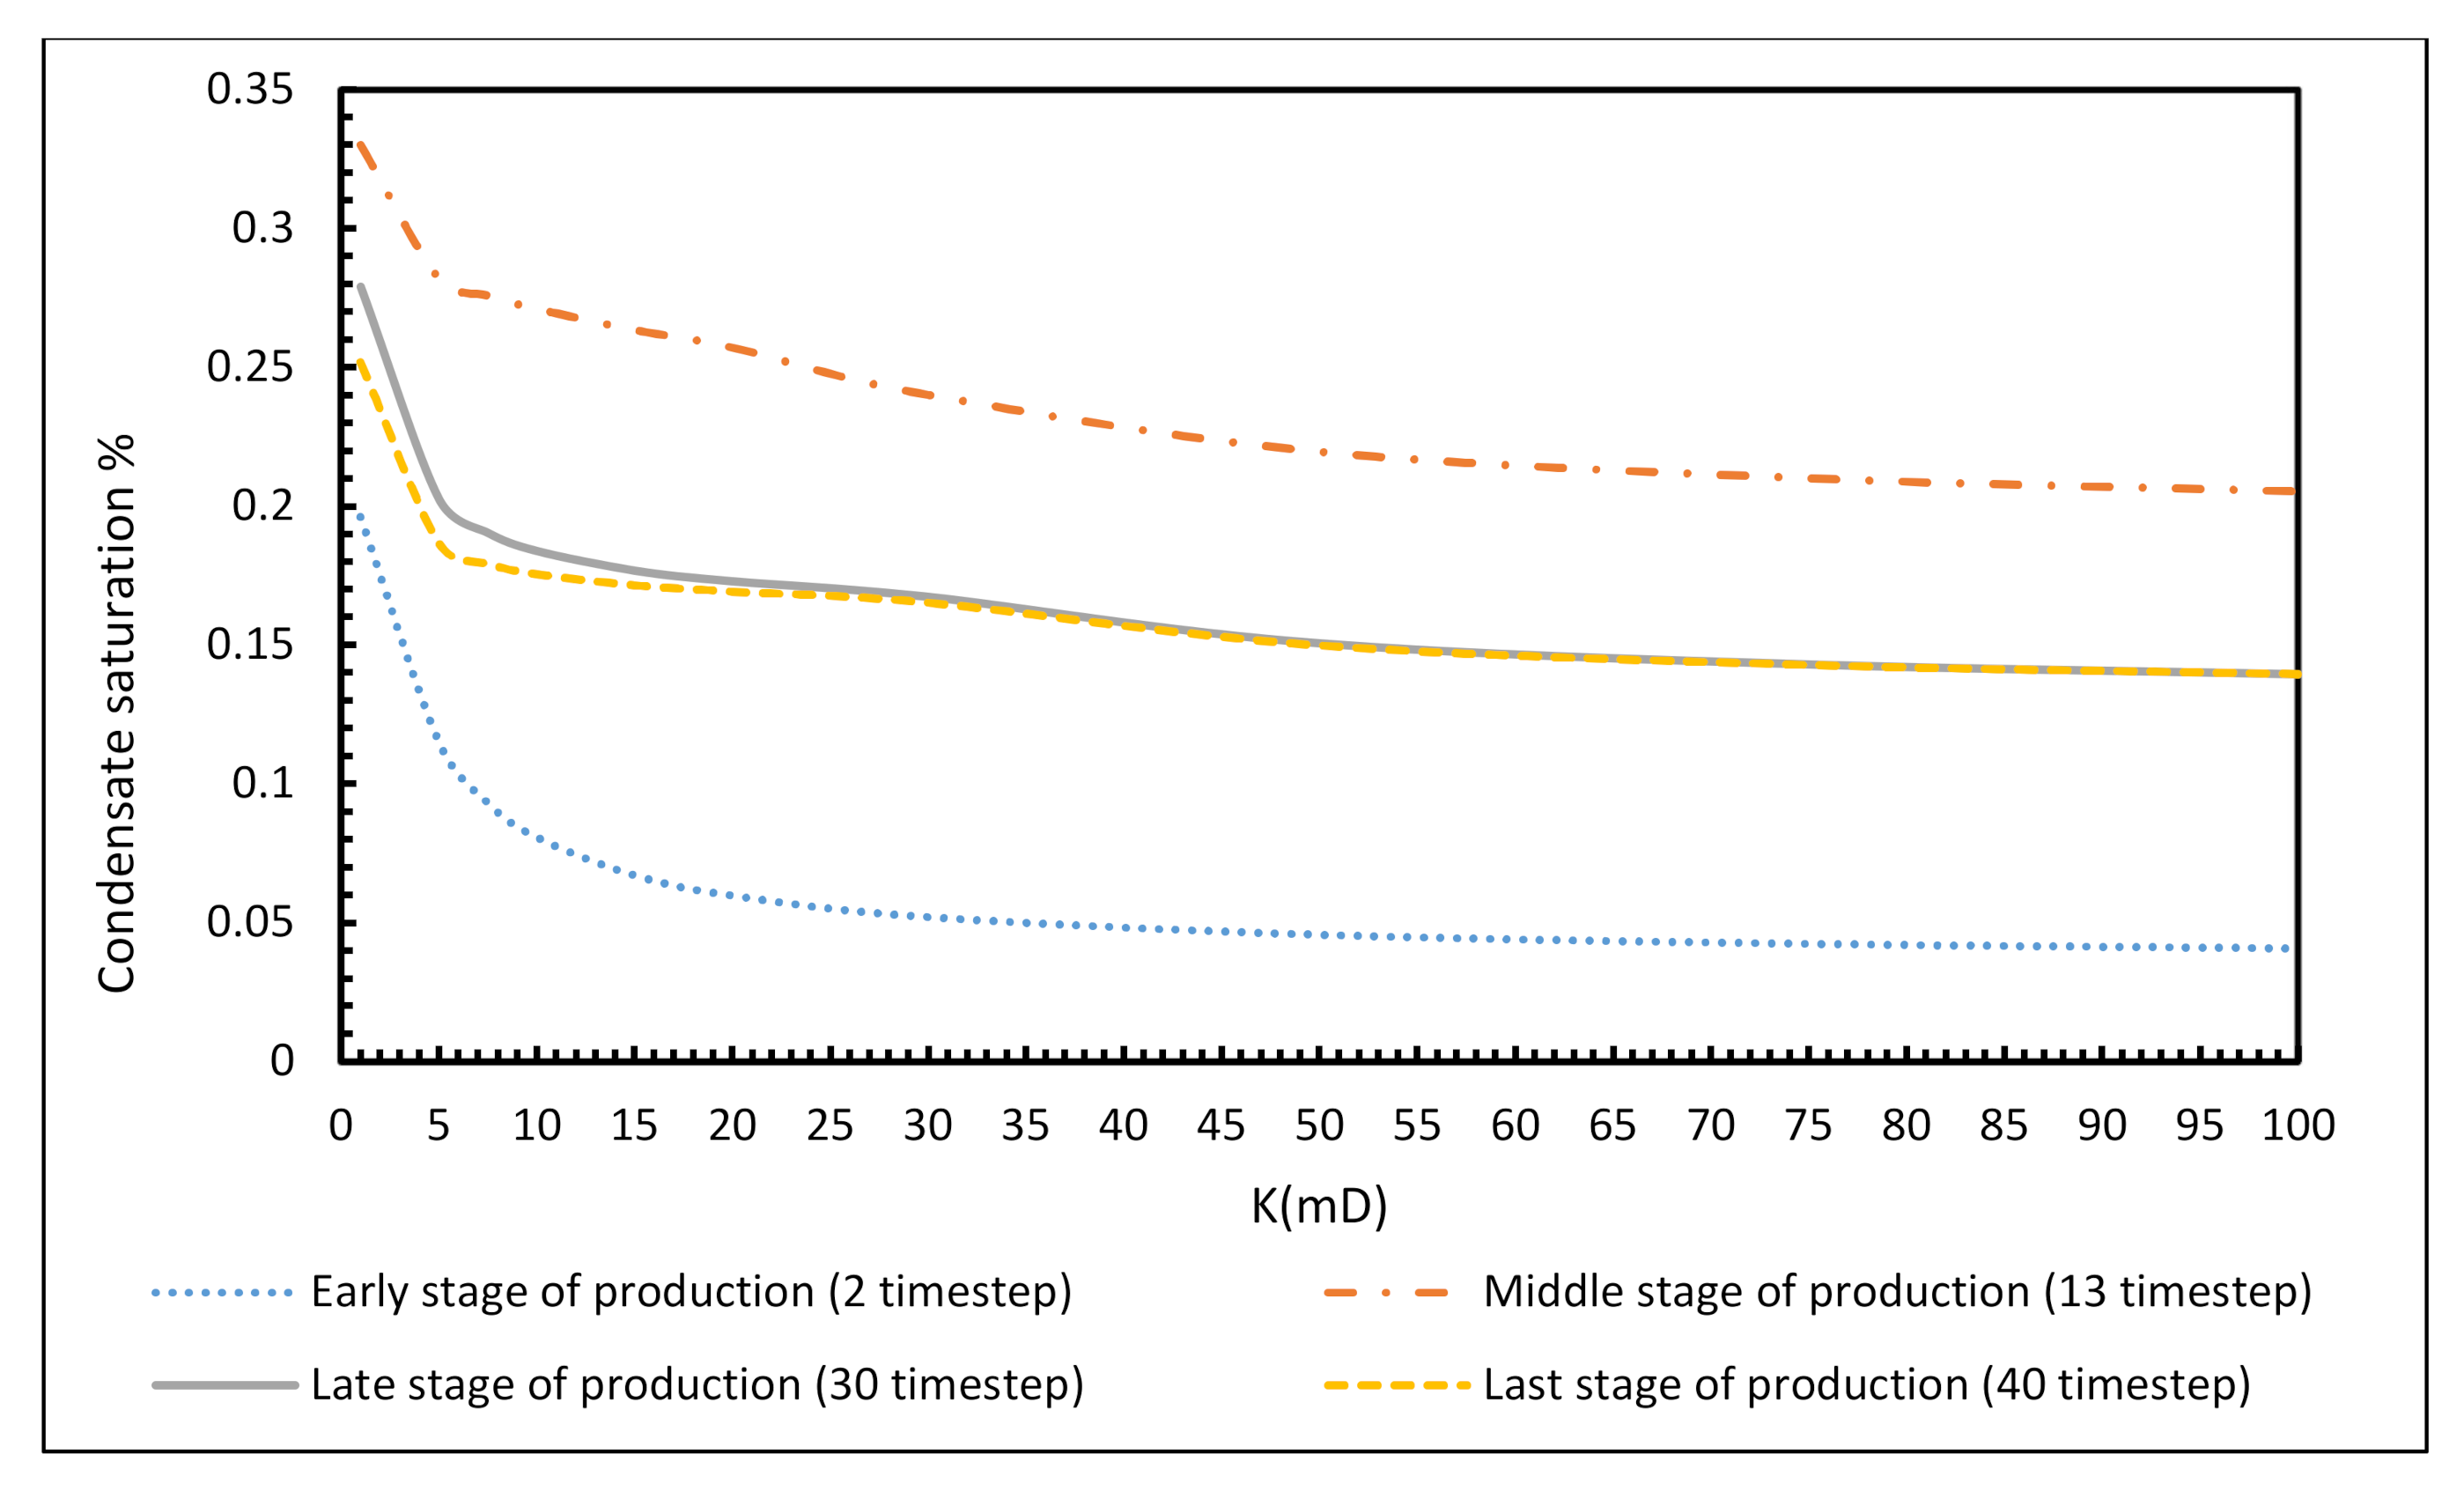
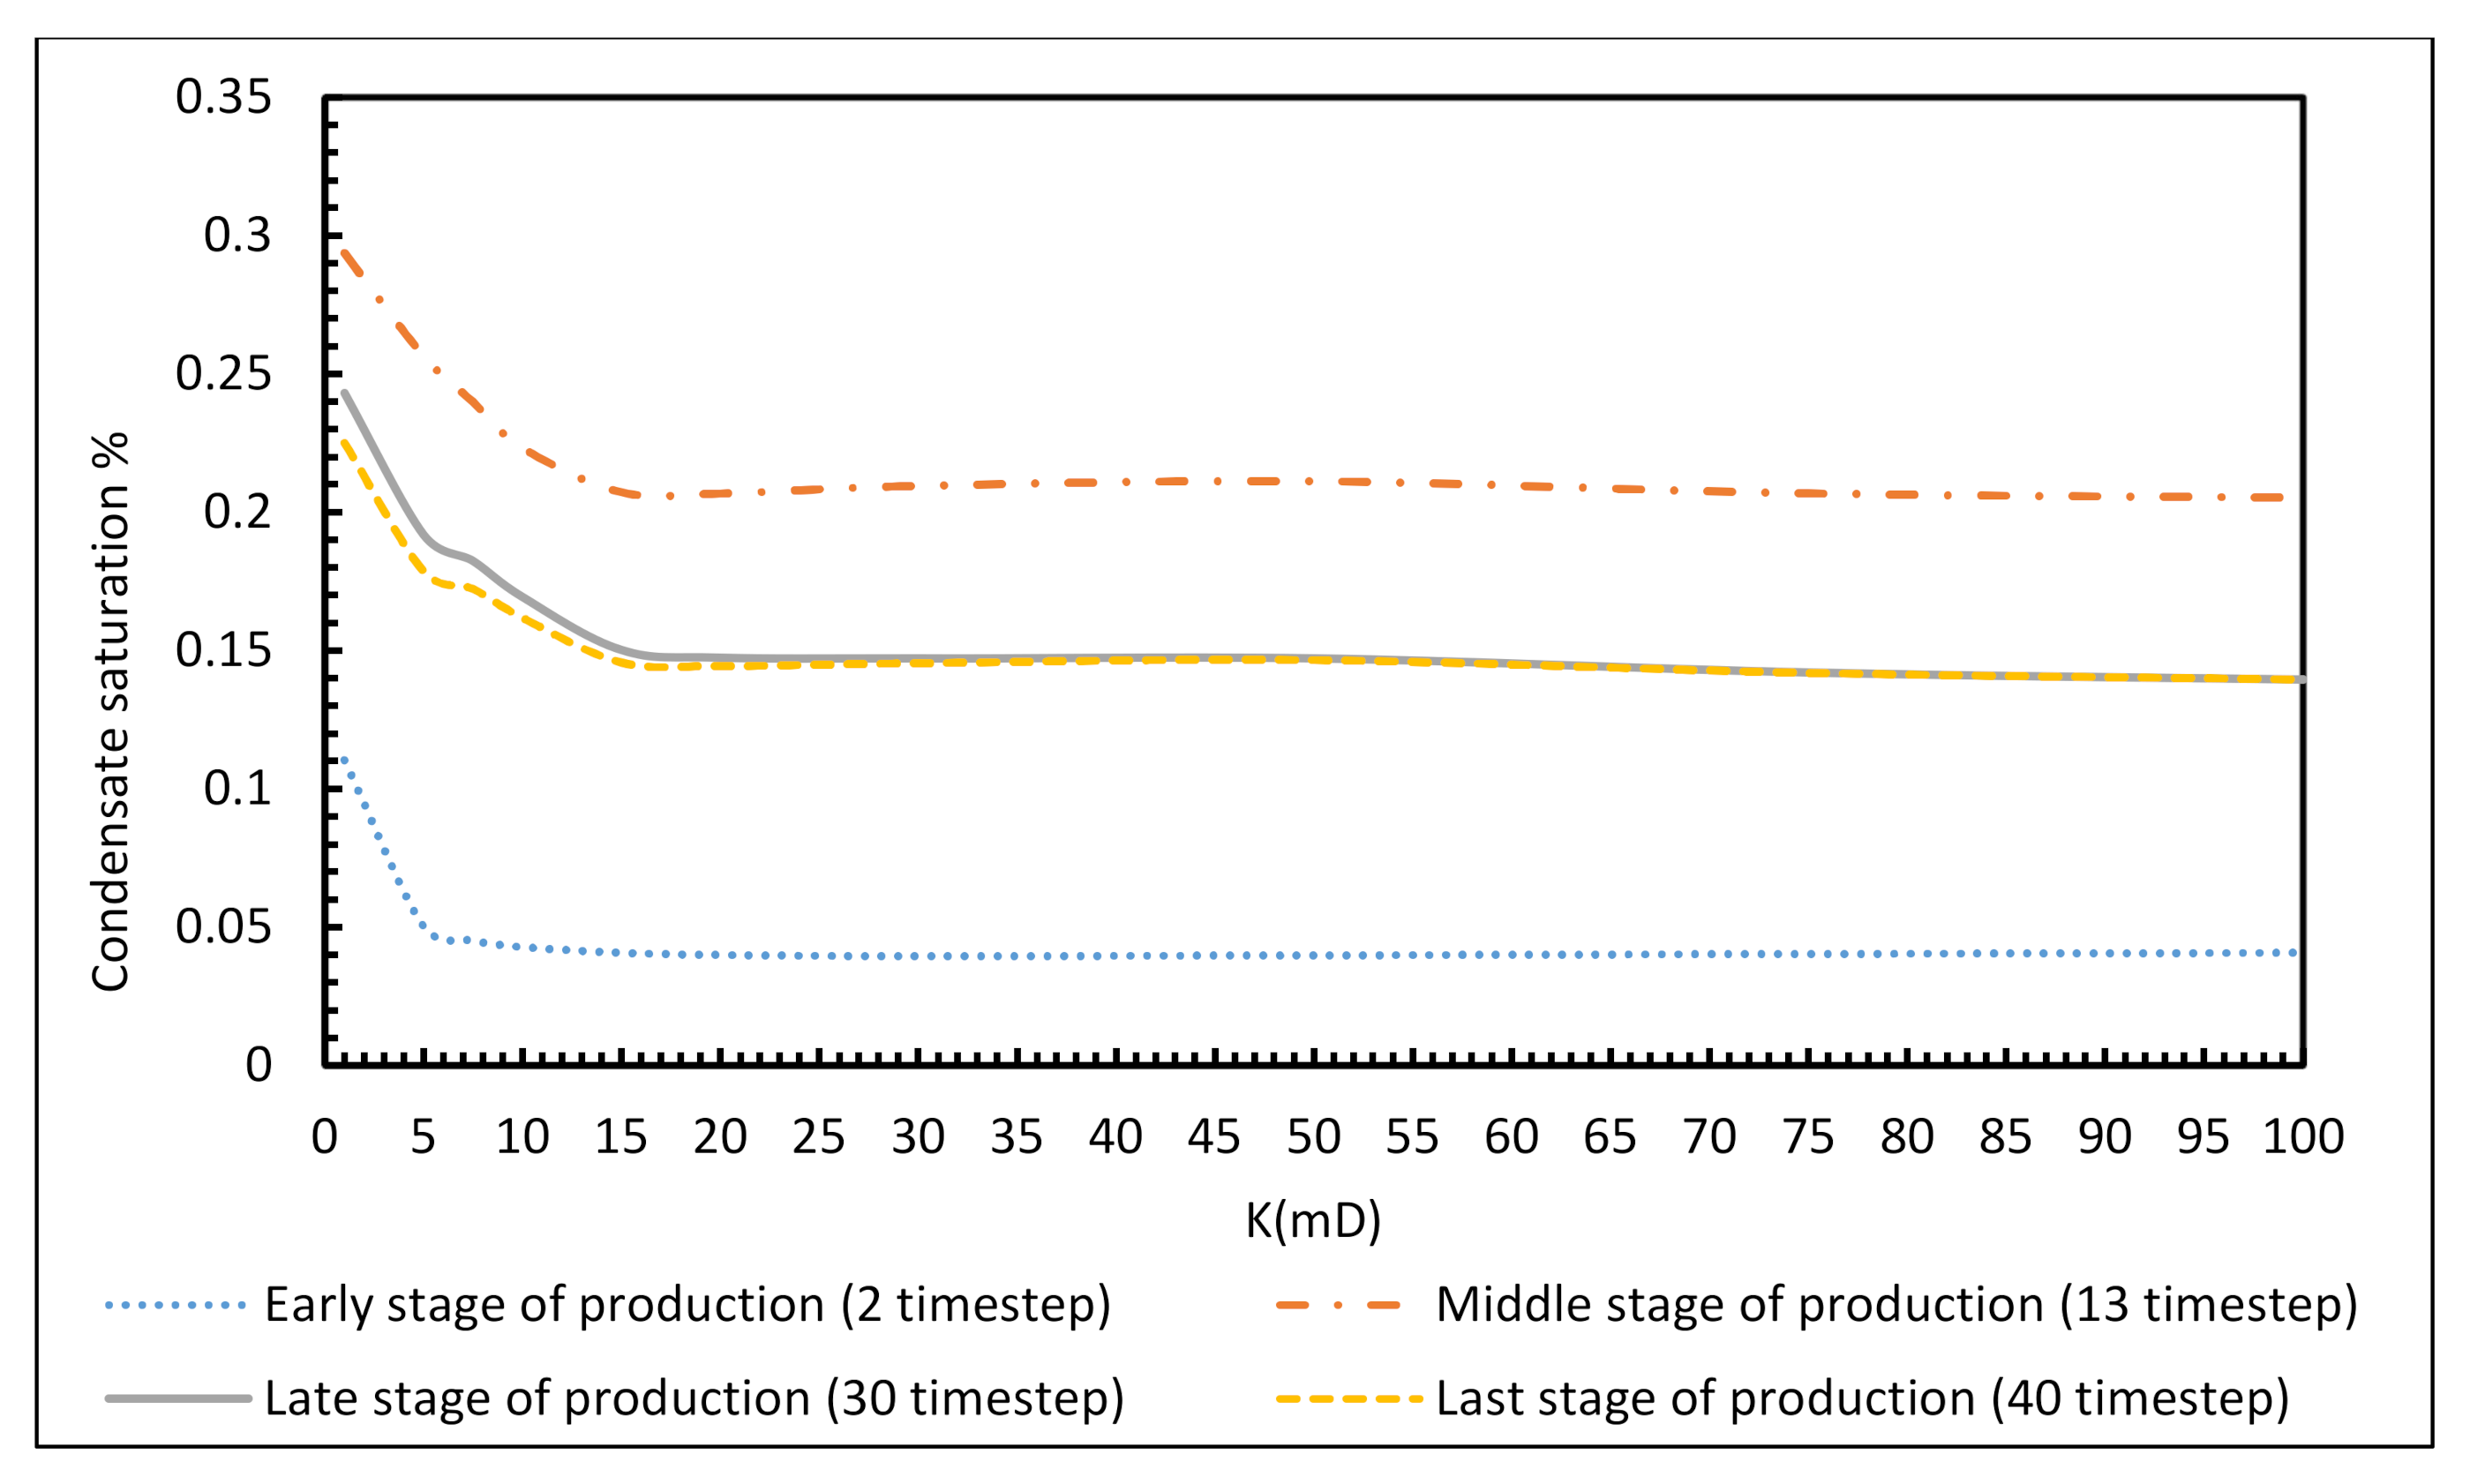
3.3. Impact of Permeability on Different Stages of Production Near the Wellbore

To gain a better understanding of the changes in condensate saturation, the effect of permeability at different stages of production for the blocks nearest to the wellbore in gas condensate reservoirs was evaluated and the results are presented in Figure 9 and Figure 10 for global and local cases, respectively. Figure 9 shows a sharp decrease in condensate saturation for all stages of production in the reservoir with permeability from 1 mD to 5 mD, which then maintains almost constant. This can be attributed to the fact that, for tight to low reservoirs, Region 2 dominates production which in turn results in condensate build-up at the block near the wellbore. On the other hand, for higher permeability reservoirs, Regions 1 and 3 dominate during production, resulting in constant and smooth condensate formation near the wellbore. In line with these observations, the change in phase behaviour of hydrocarbon for each region has been also modelled and presented by Orodu et al. [22] during production from gas condensate reservoirs. In their research, it was observed that, in the early stage of production Region 1 dominated the flow where the gas phase showed considerably better mobility than that of the liquid phase due to condensate build-up in this region.
Figure 10 shows the effect of permeability on condensate formation for cases of local damage for each different stage of production in the wellbore where the same trend as in Figure 9 is also observed. However, the plot has a more distinctly curved shape compared to that for the global analysis. These results prove that local damage can cause the deterioration of high-permeability reservoirs so that they become lower in permeability, and the duration of Region 2 is significantly extended resulting in condensate blockage near the wellbore.

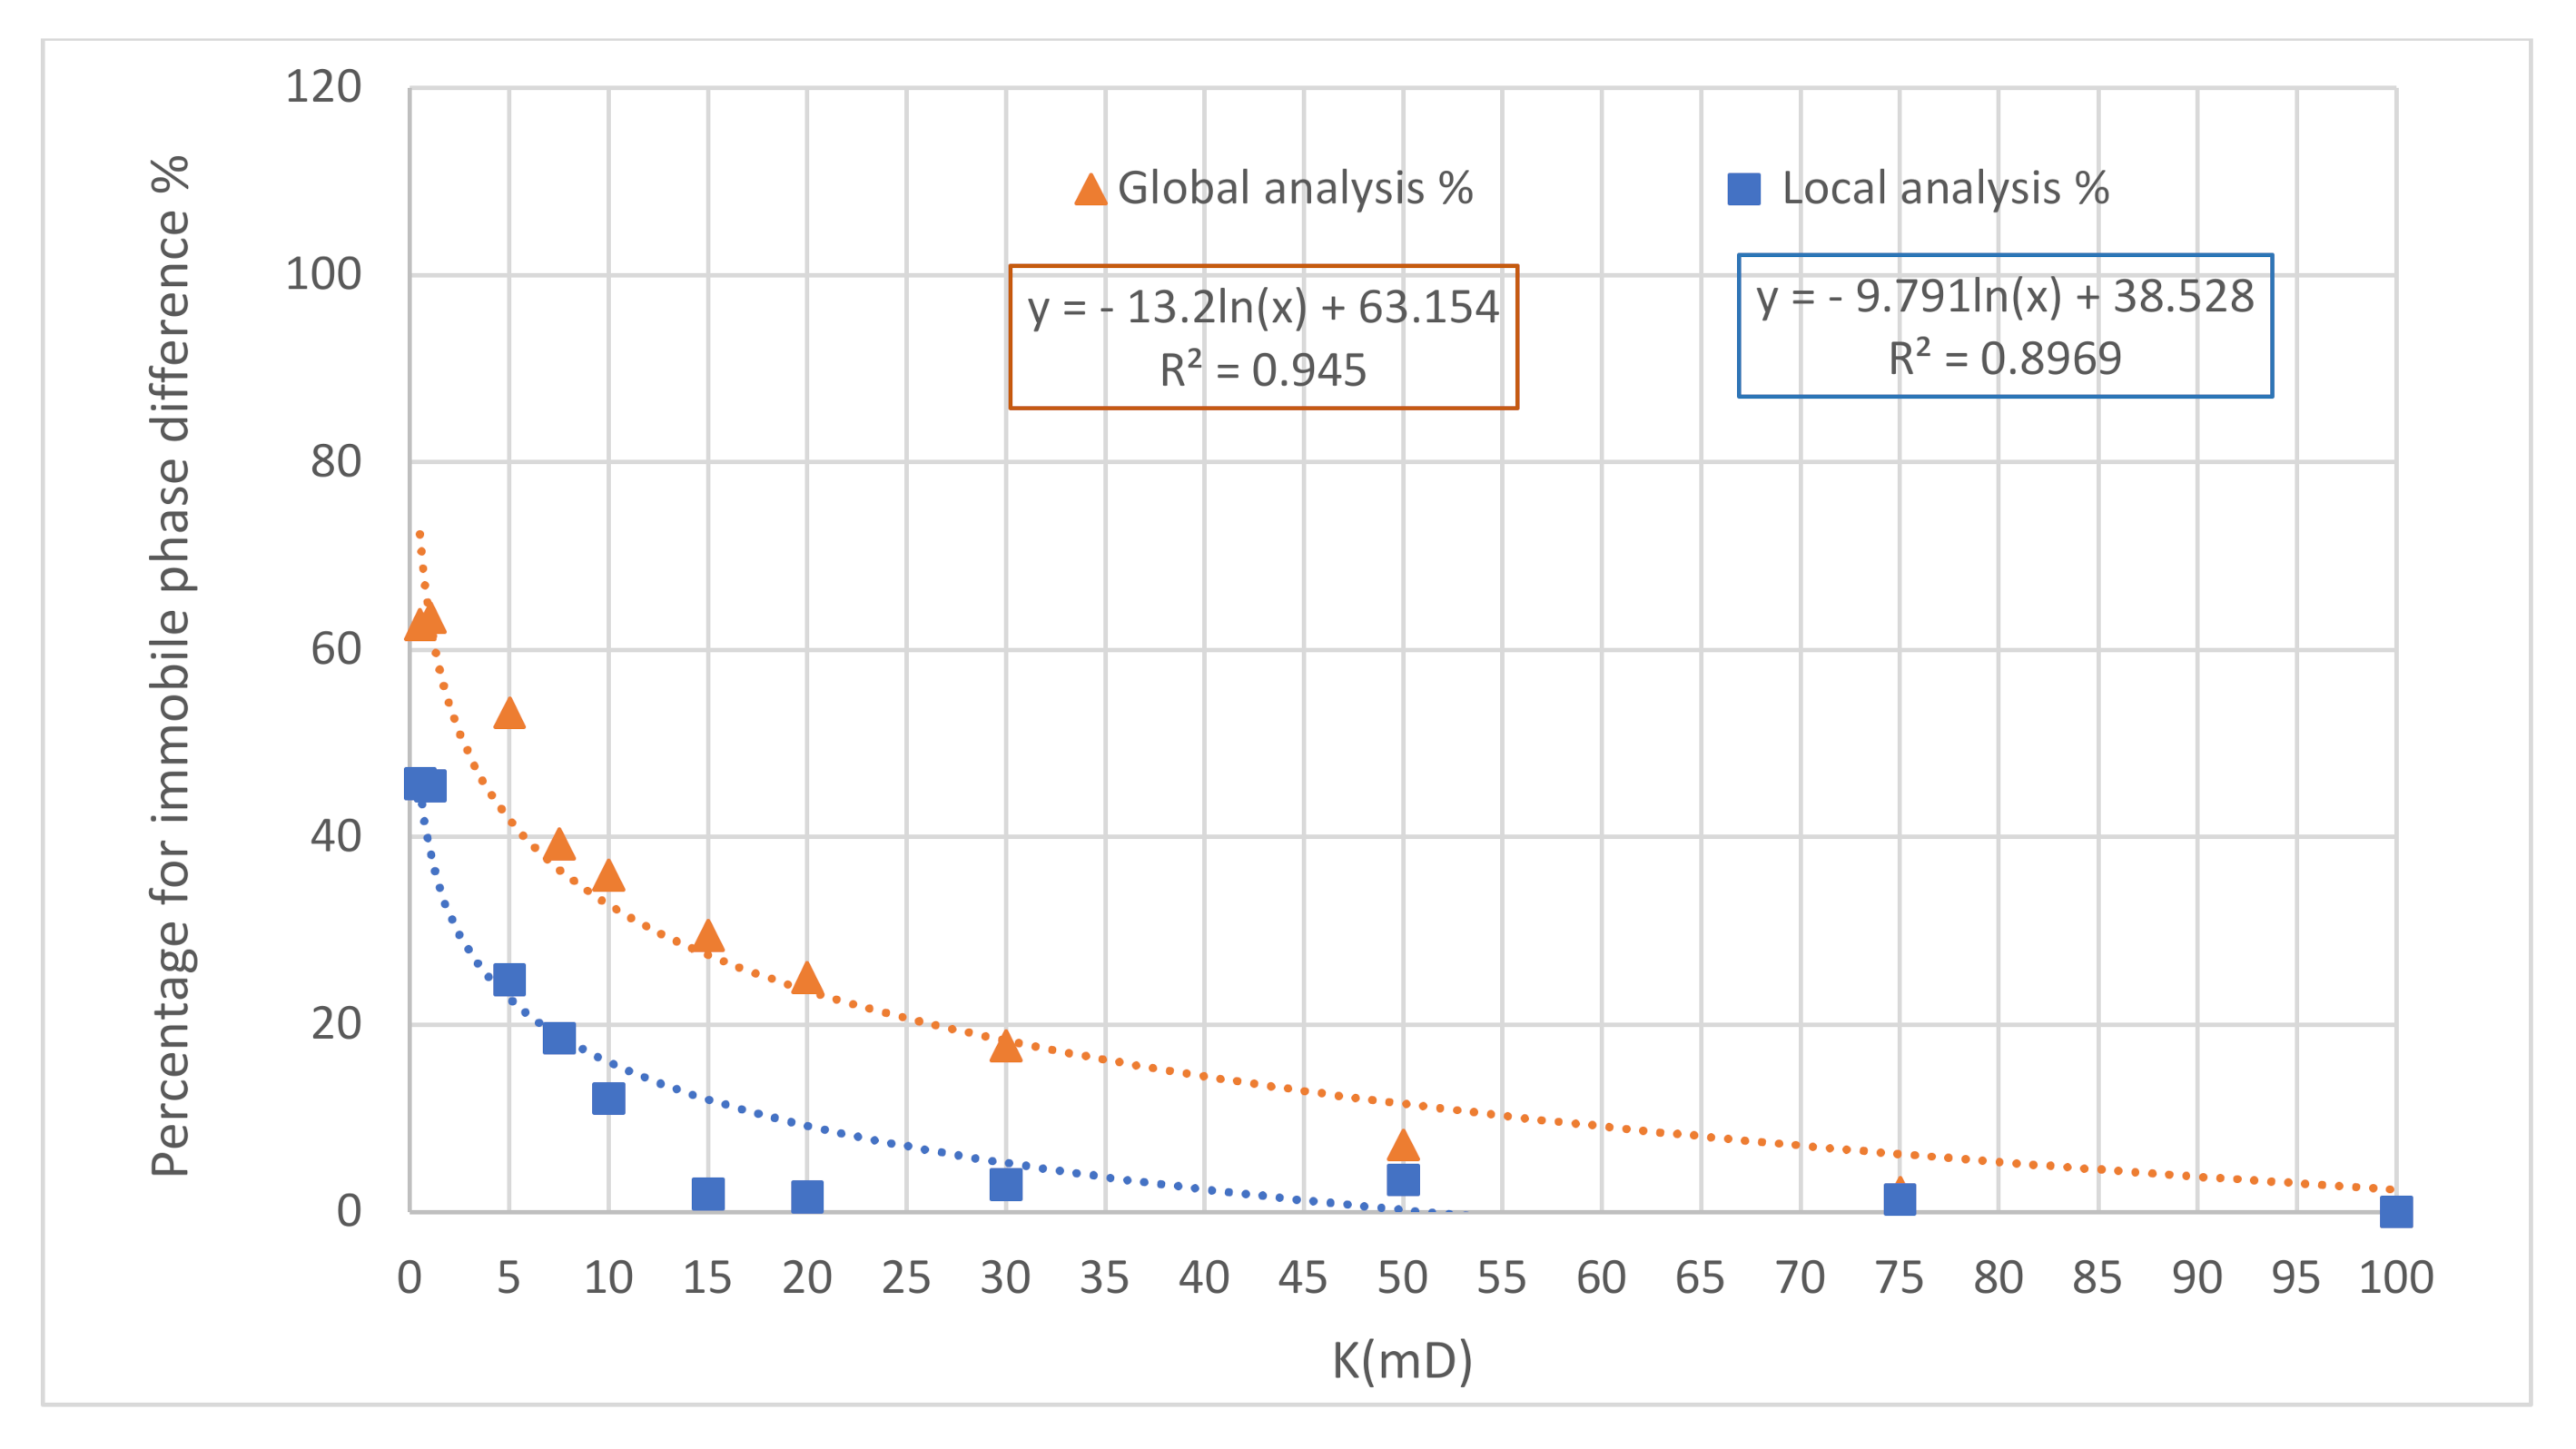
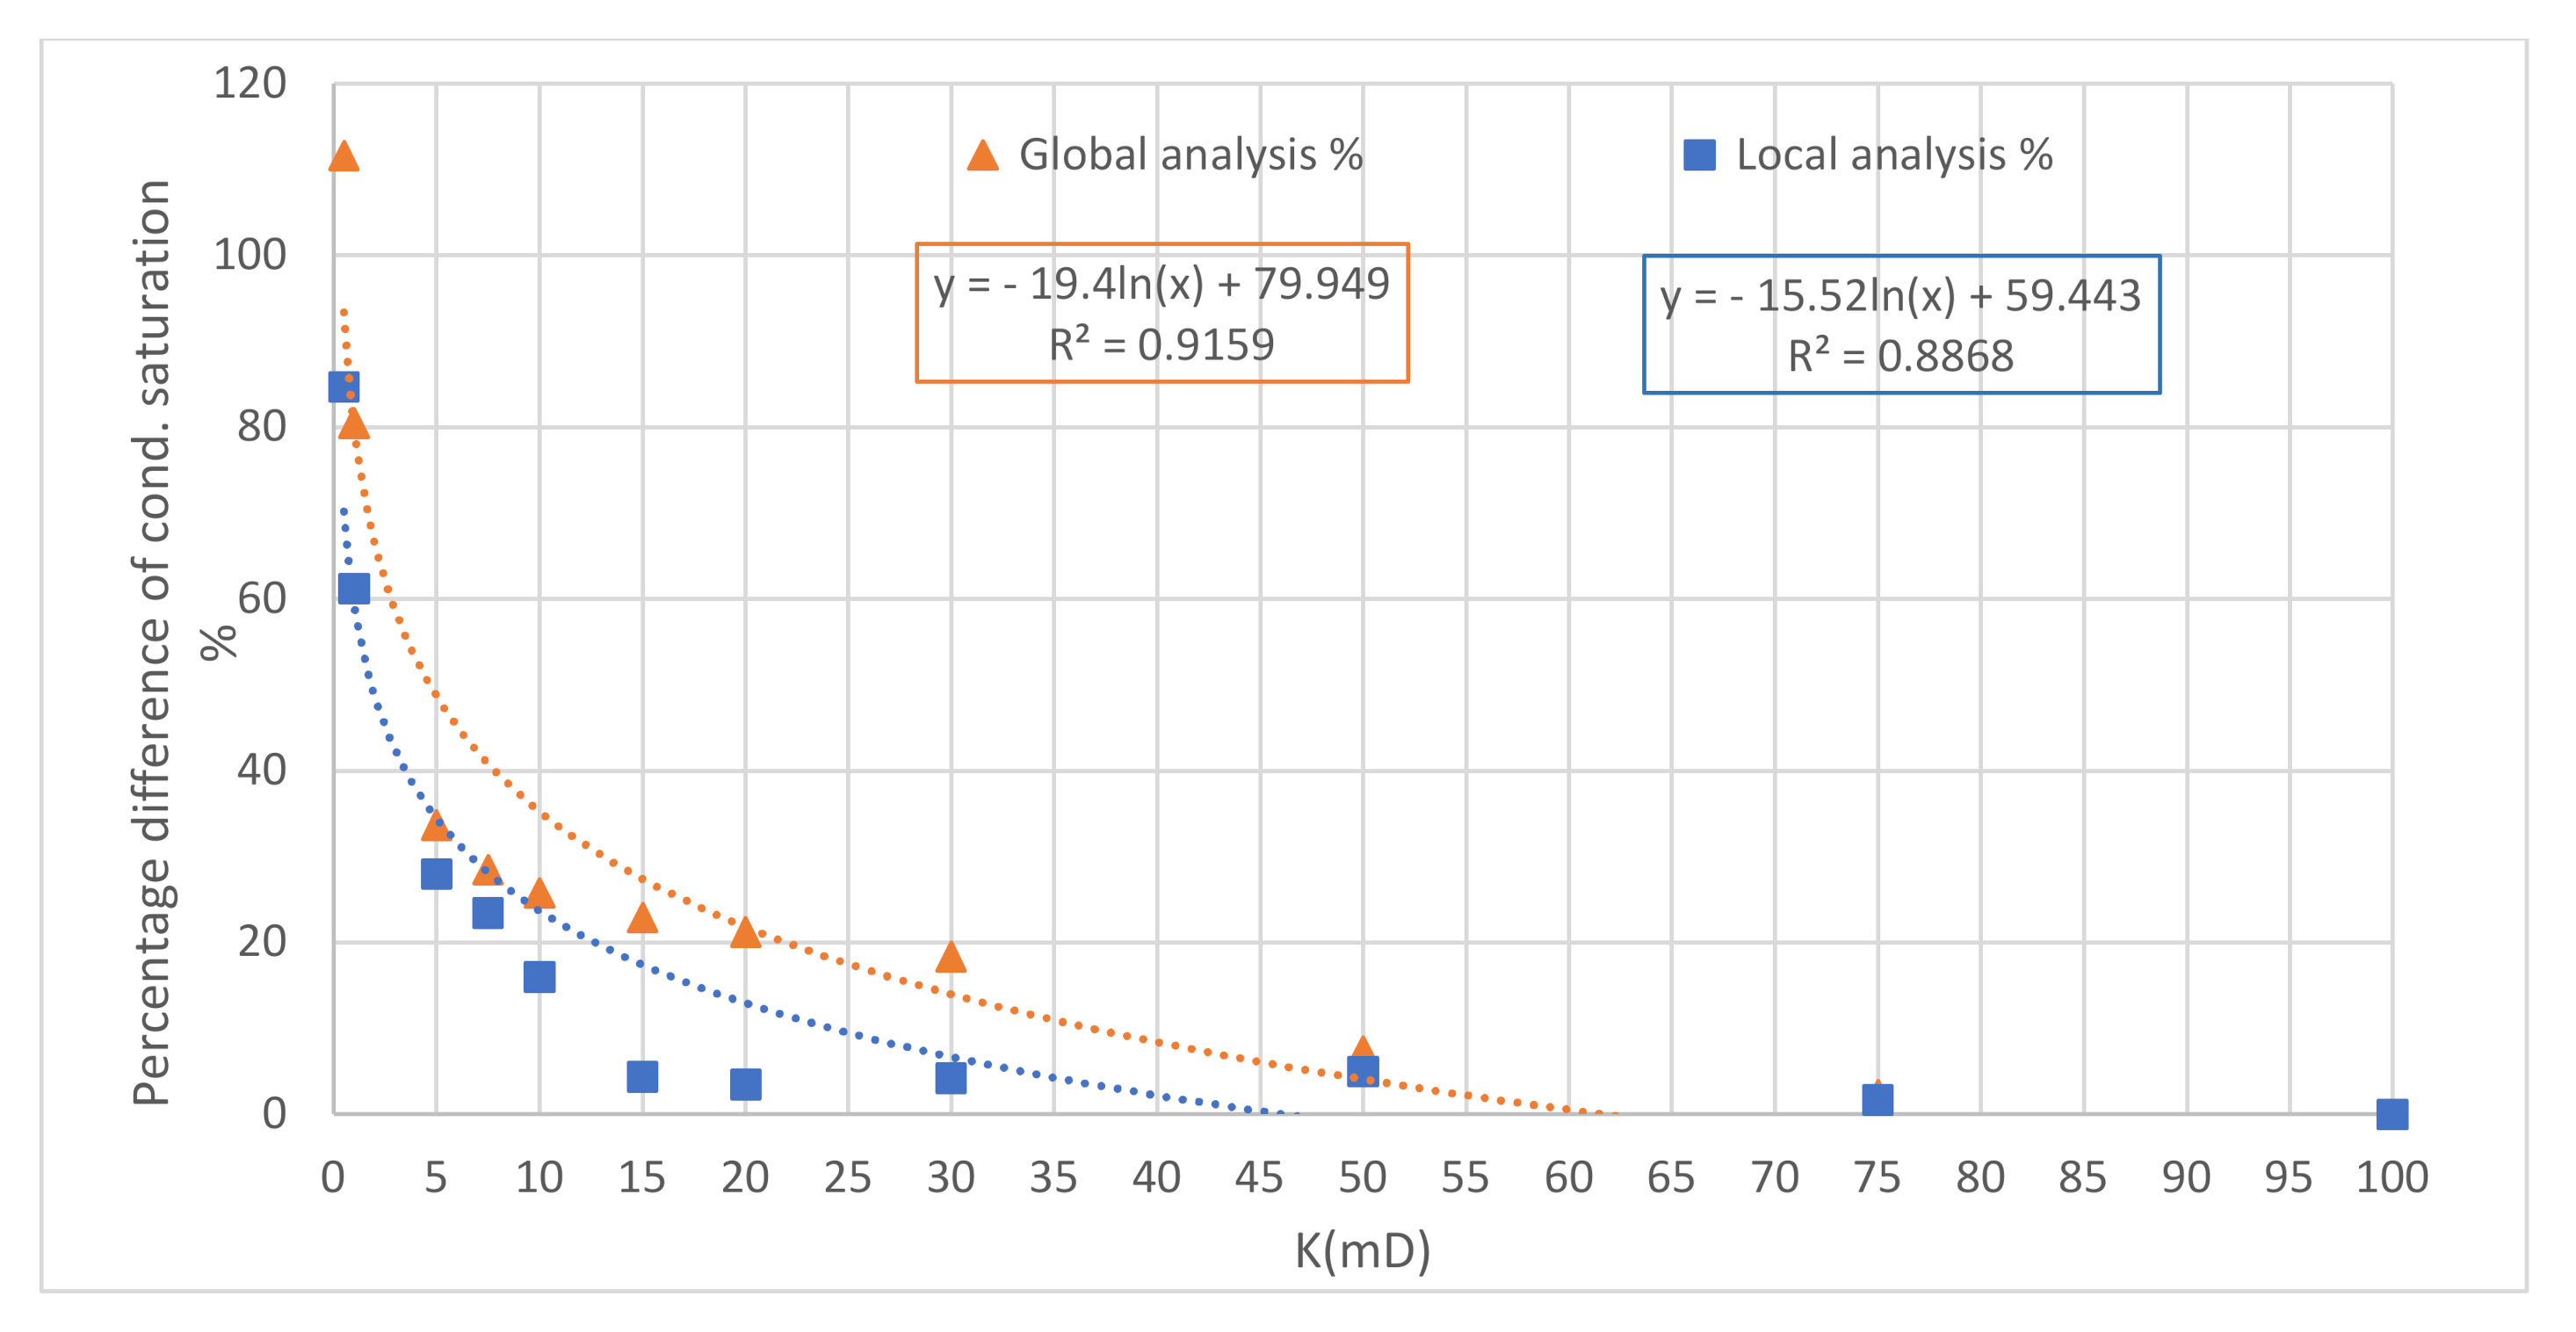
3.4. Comparison of Immobile Phase and Percentage Difference in Condensate Saturation

From the data presented for Regions 1 and 2 shown in Figure 4, Figure 5, Figure 9 and Figure 10, differences in the condensate immobile phase and percentage differences of condensate saturation were calculated and are presented in Figure 11 and Figure 12, respectively. The results show that the formation of the immobile phase as a function of permeability can be divided into three categories. The first is for values of permeability between 100 mD to 50 mD where the concentration of the immobile phase is almost constant; the second category has values from 50 mD to 10 mD with a slow rate of increase in the immobile phase; and in the third category a sharp increase in the immobile phase occurs for values of permeability below 10 mD. The same trends and categories for condensate saturation are observed for both global and local cases, as presented in Figure 12. From these two figures, logarithmic trends for global and local analyses were extracted, with the R-squared factor between 88% and 94% which can be used as correlation equations in prediction of the formation of the immobile phase and condensate saturation in a condensate reservoir.

3.5. Gas Composition Tracking

The impact of reductions in permeability on condensate formation can be tracked according to changes in gas composition, namely light (C1) and intermediate components (C4–6), near the wellbore. As can be seen in Figure 13 and Figure 14, the concentrations of C1 and C4–6 decrease significantly when permeability is reduced from 100 mD to 1 mD. A large proportion of this reduction relates to values of permeability in the tight formation (global analysis) or damaged formation (local analysis) in the range of 10 to 1 mD. These results correlate well with the pressure profiles and condensate saturation data in Section 3.1. More specifically, in the global analysis, the hydrocarbon C1 component has a higher molar fraction of 0.363 compared to that of 0.282 in the local analysis. These results reinforce the findings in this work presented in previous sections, indicating that local reductions in permeability which might be caused due to formation damage can have a significant impact on gas condensate performance and reduce condensate production to a level similar to that in a tight gas condensate reservoir. Allahyari et al. [21] have proposed a different approach in analysing the near wellbore behaviour of gas condensate reservoirs during production stages, where changes in absolute permeability and its impact on well deliverability are translated into the skin factor. In agreement with the present work, their results show that the duration of condensate Regions 1 and 2 increased with reduction in gas permeability. This comparison confirms that the observed trend of change in composition from the proposed approach in this paper is valid and can be used to predict the timing and location of condensate formation in the reservoir.

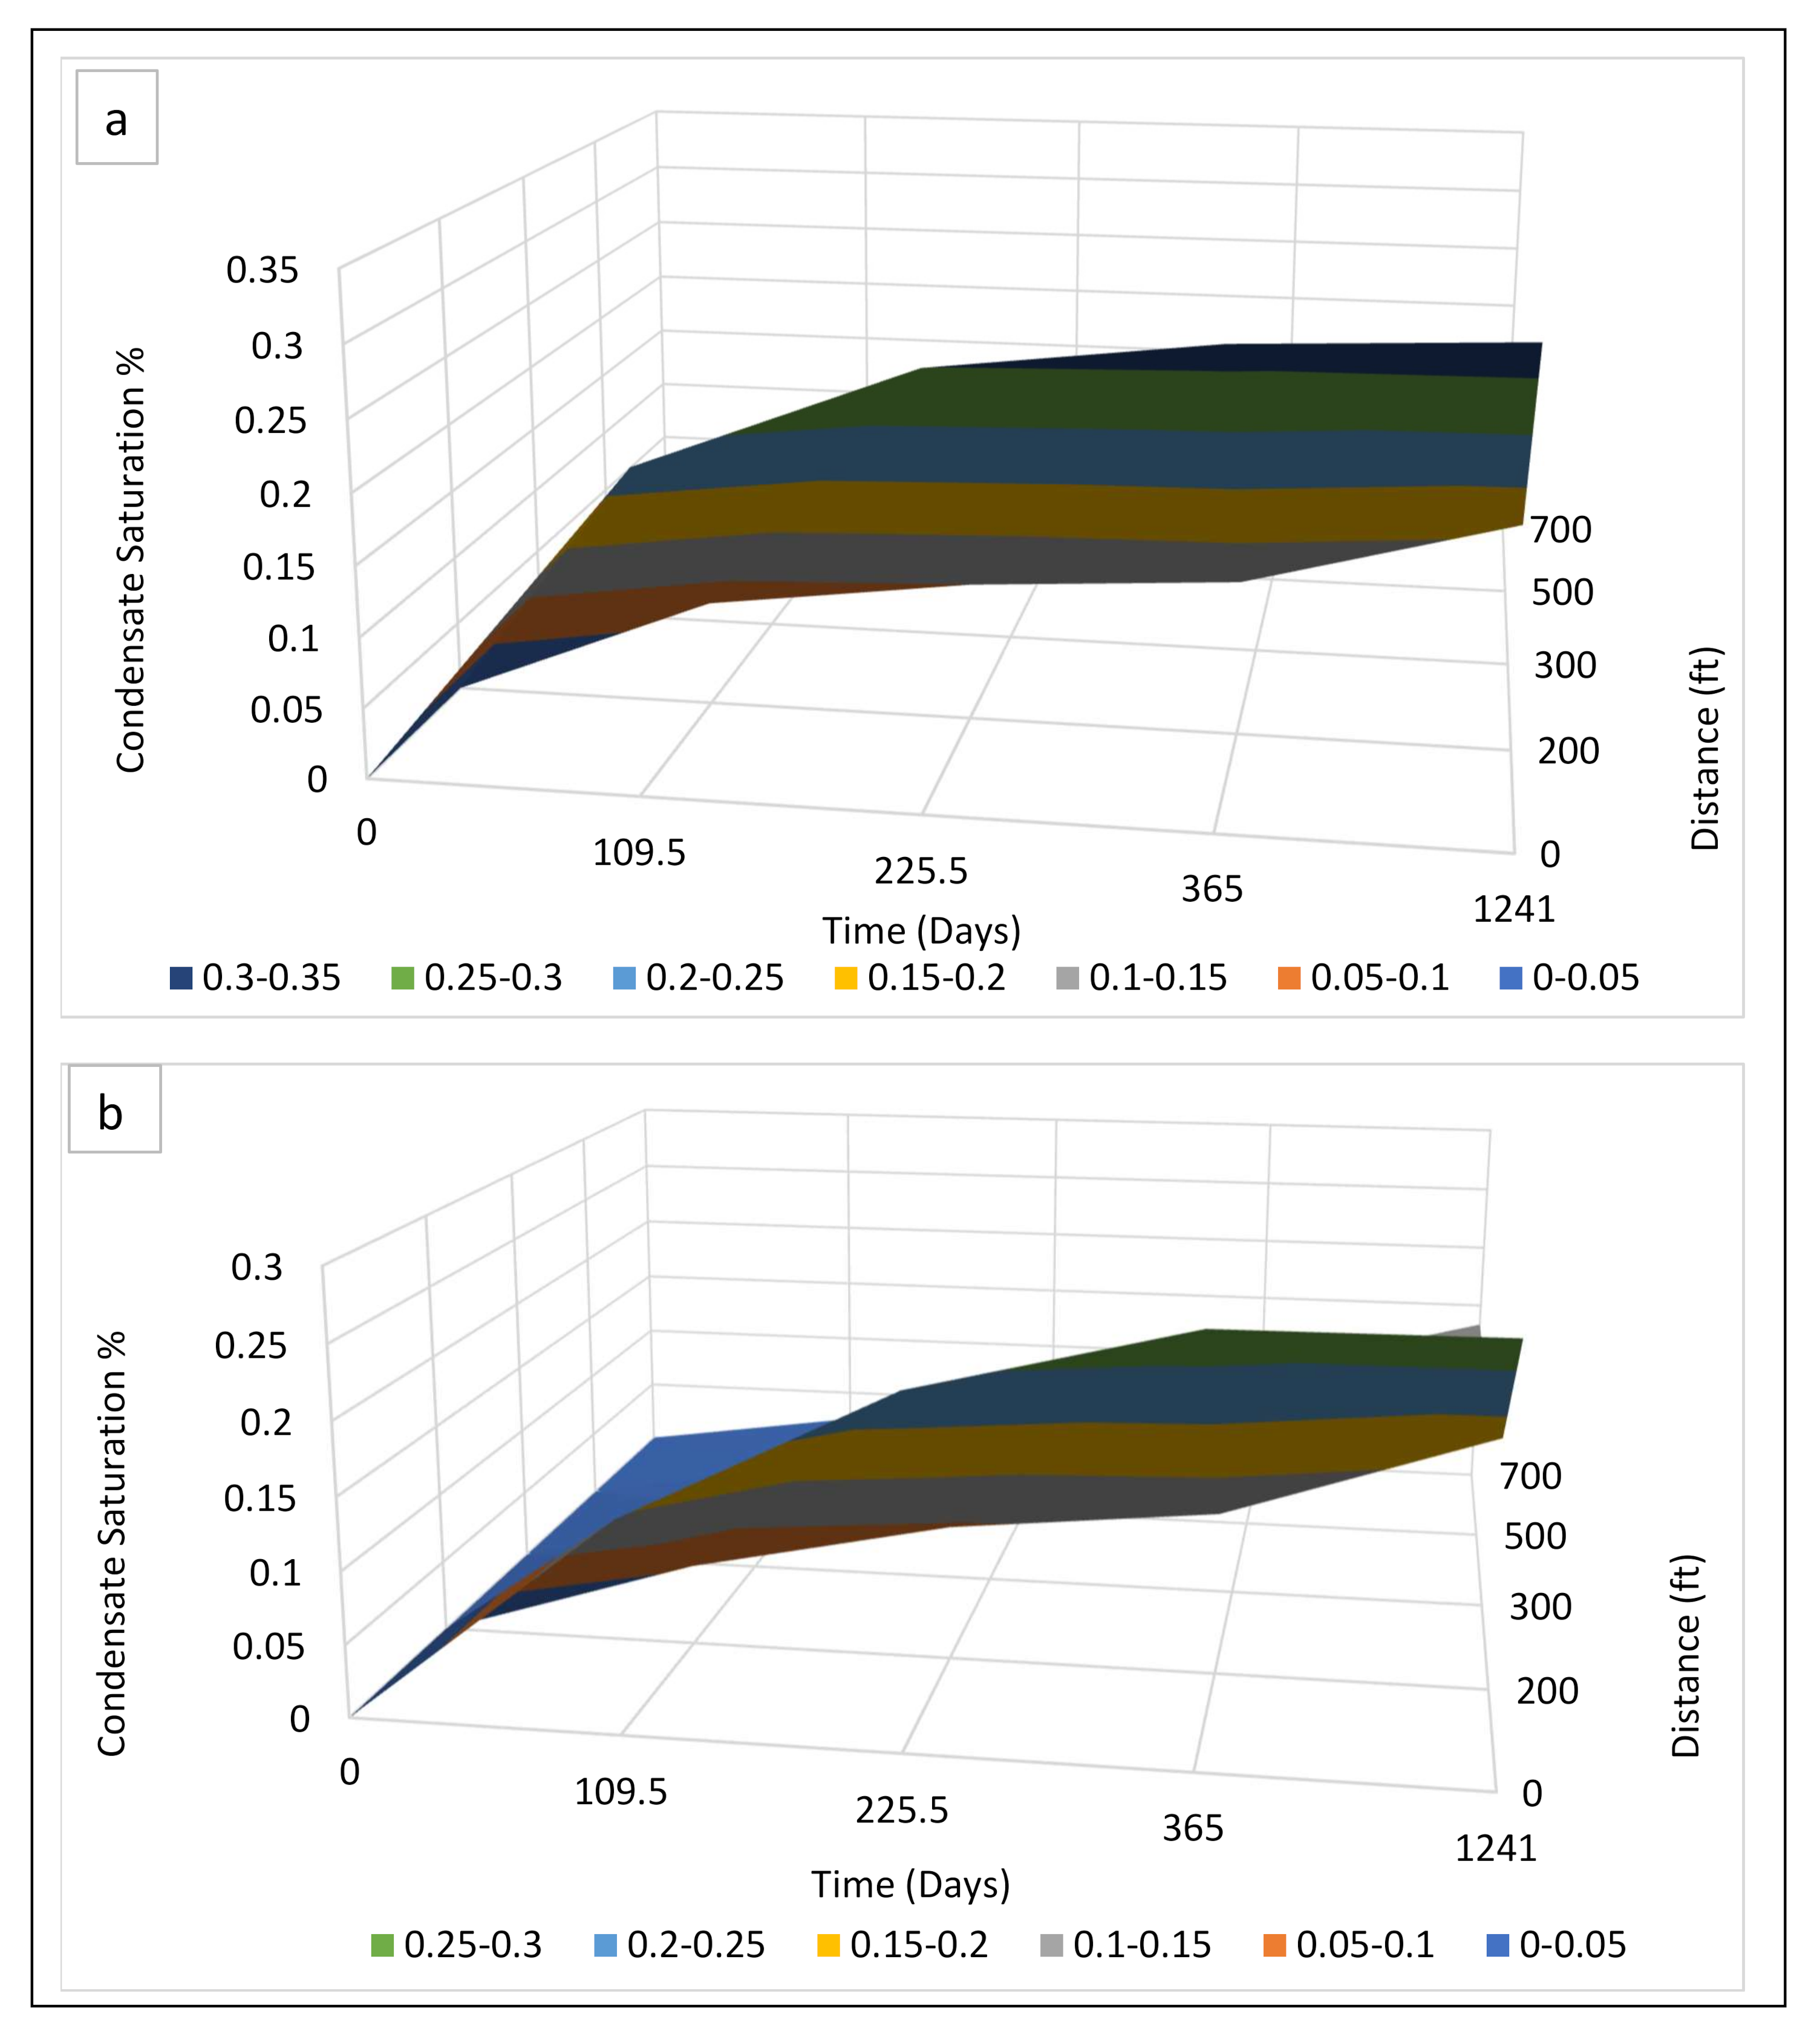
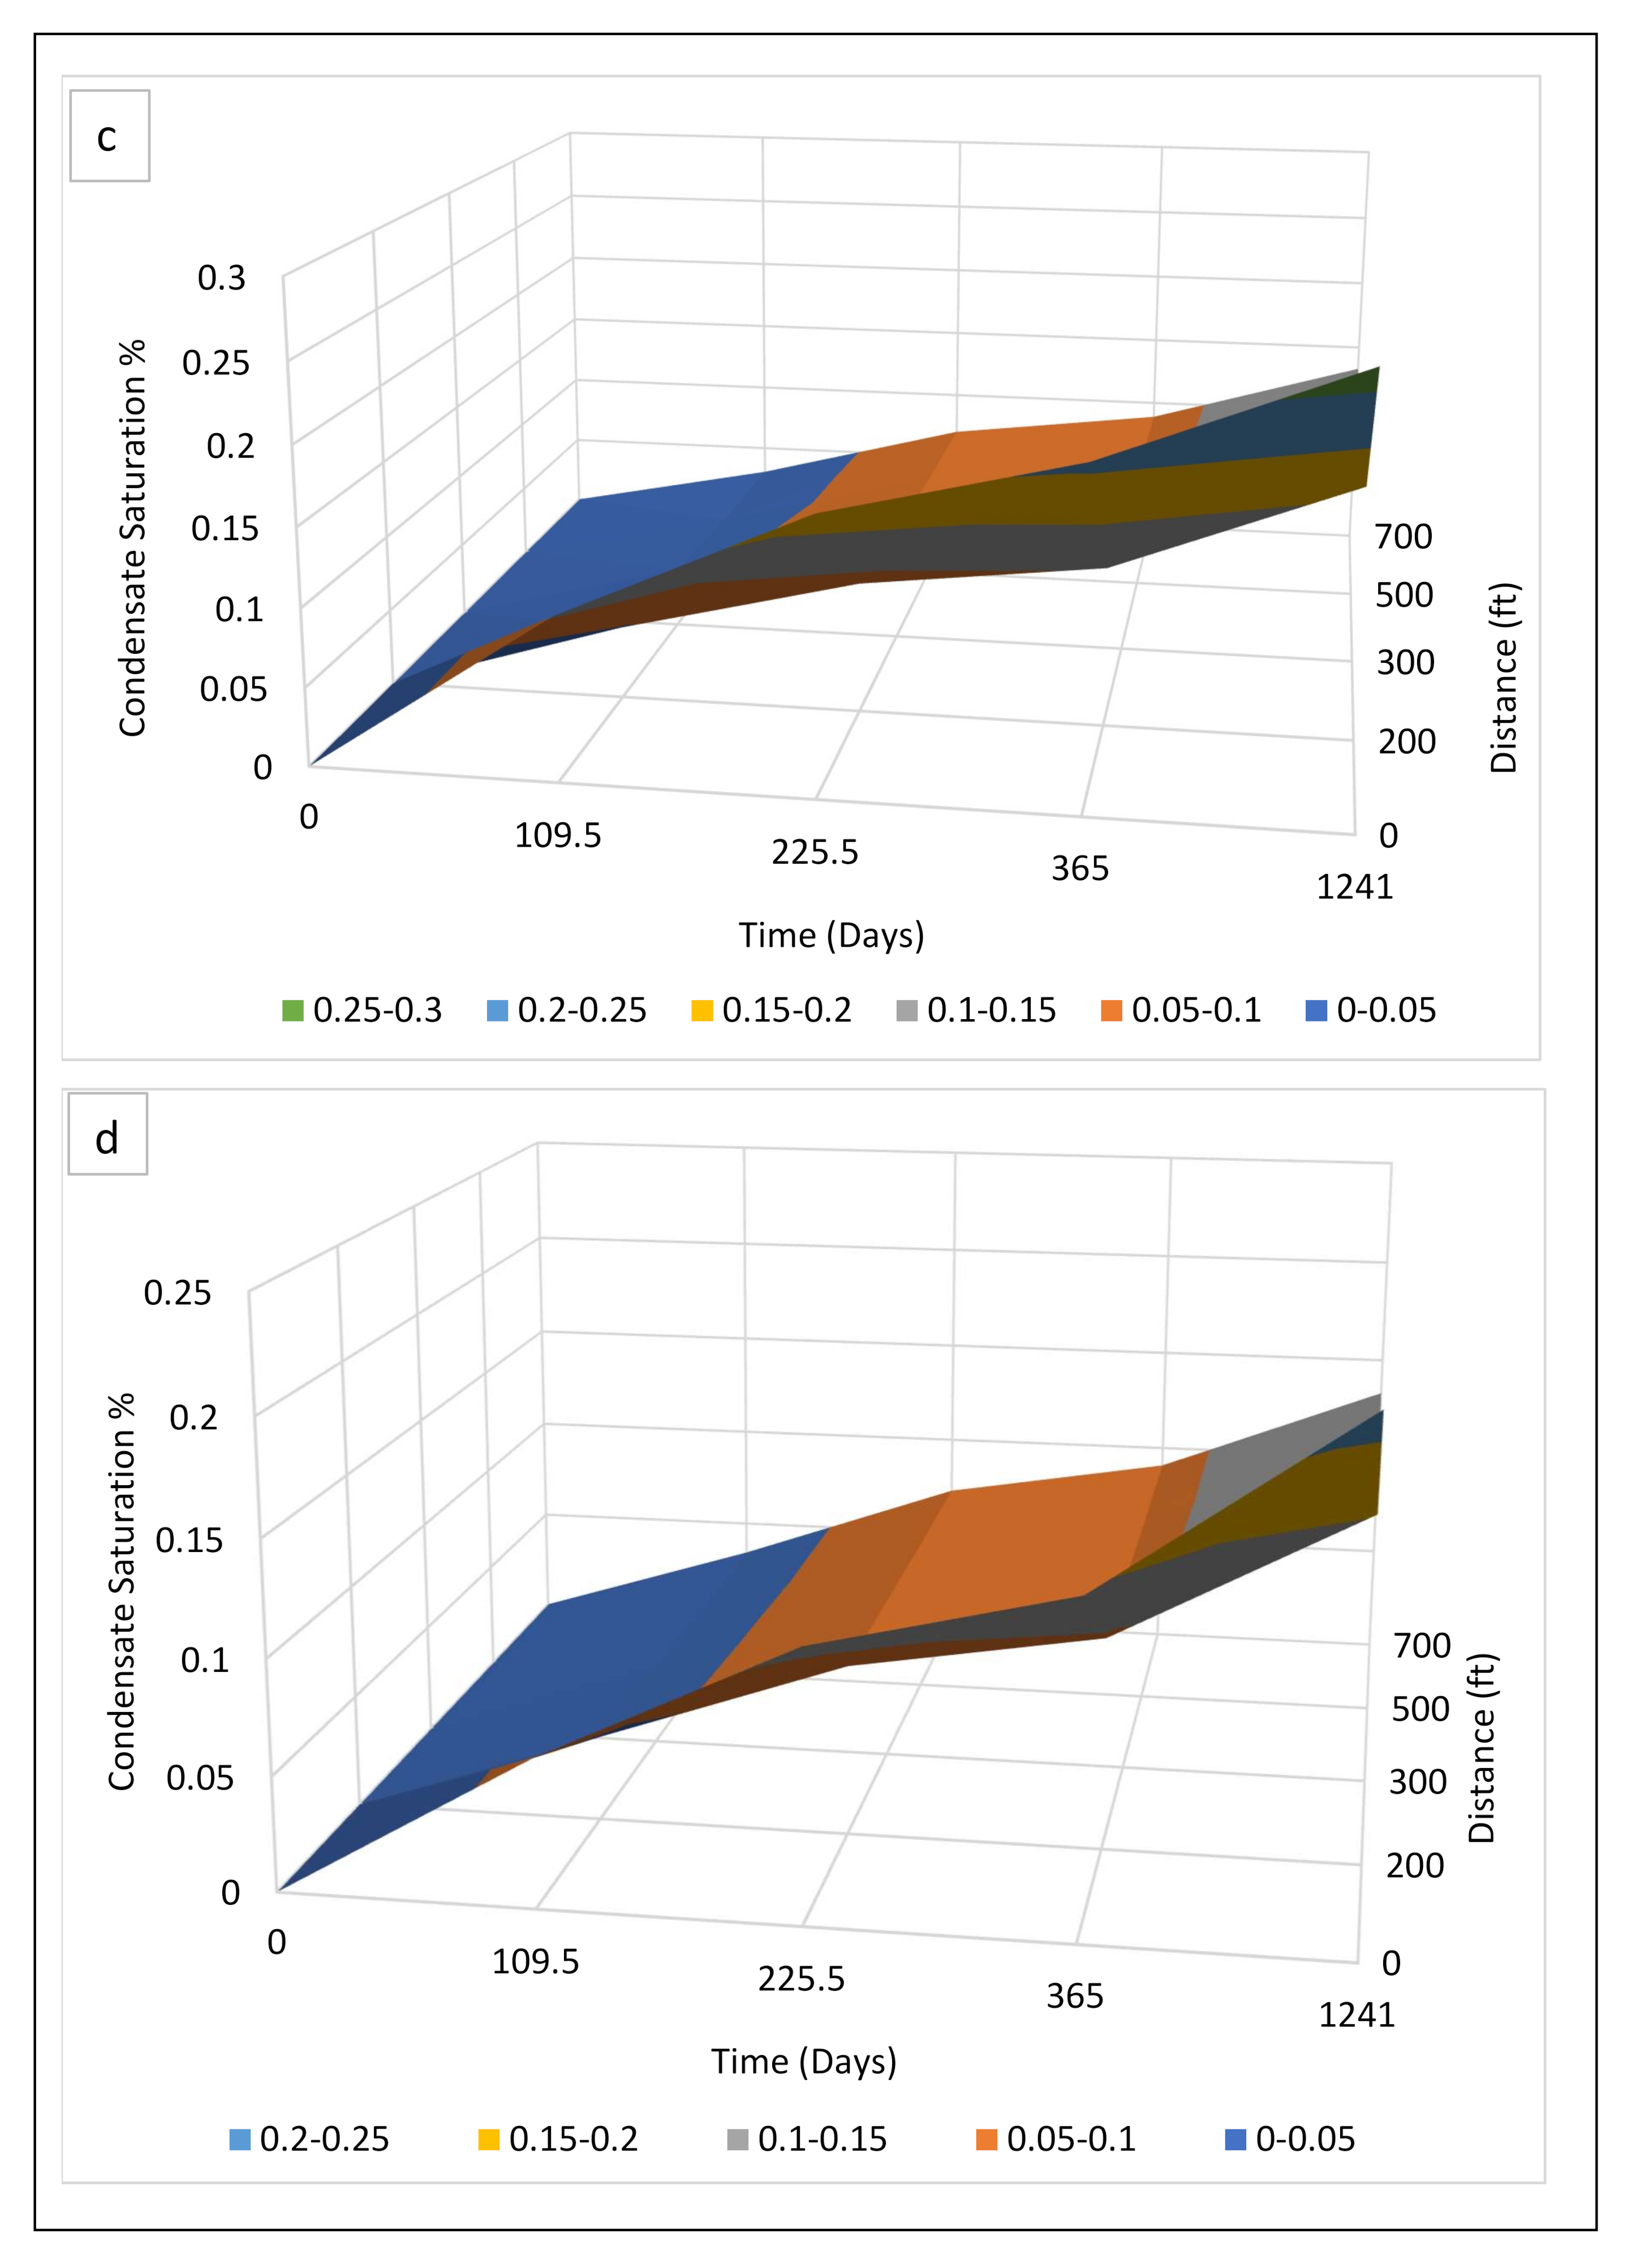
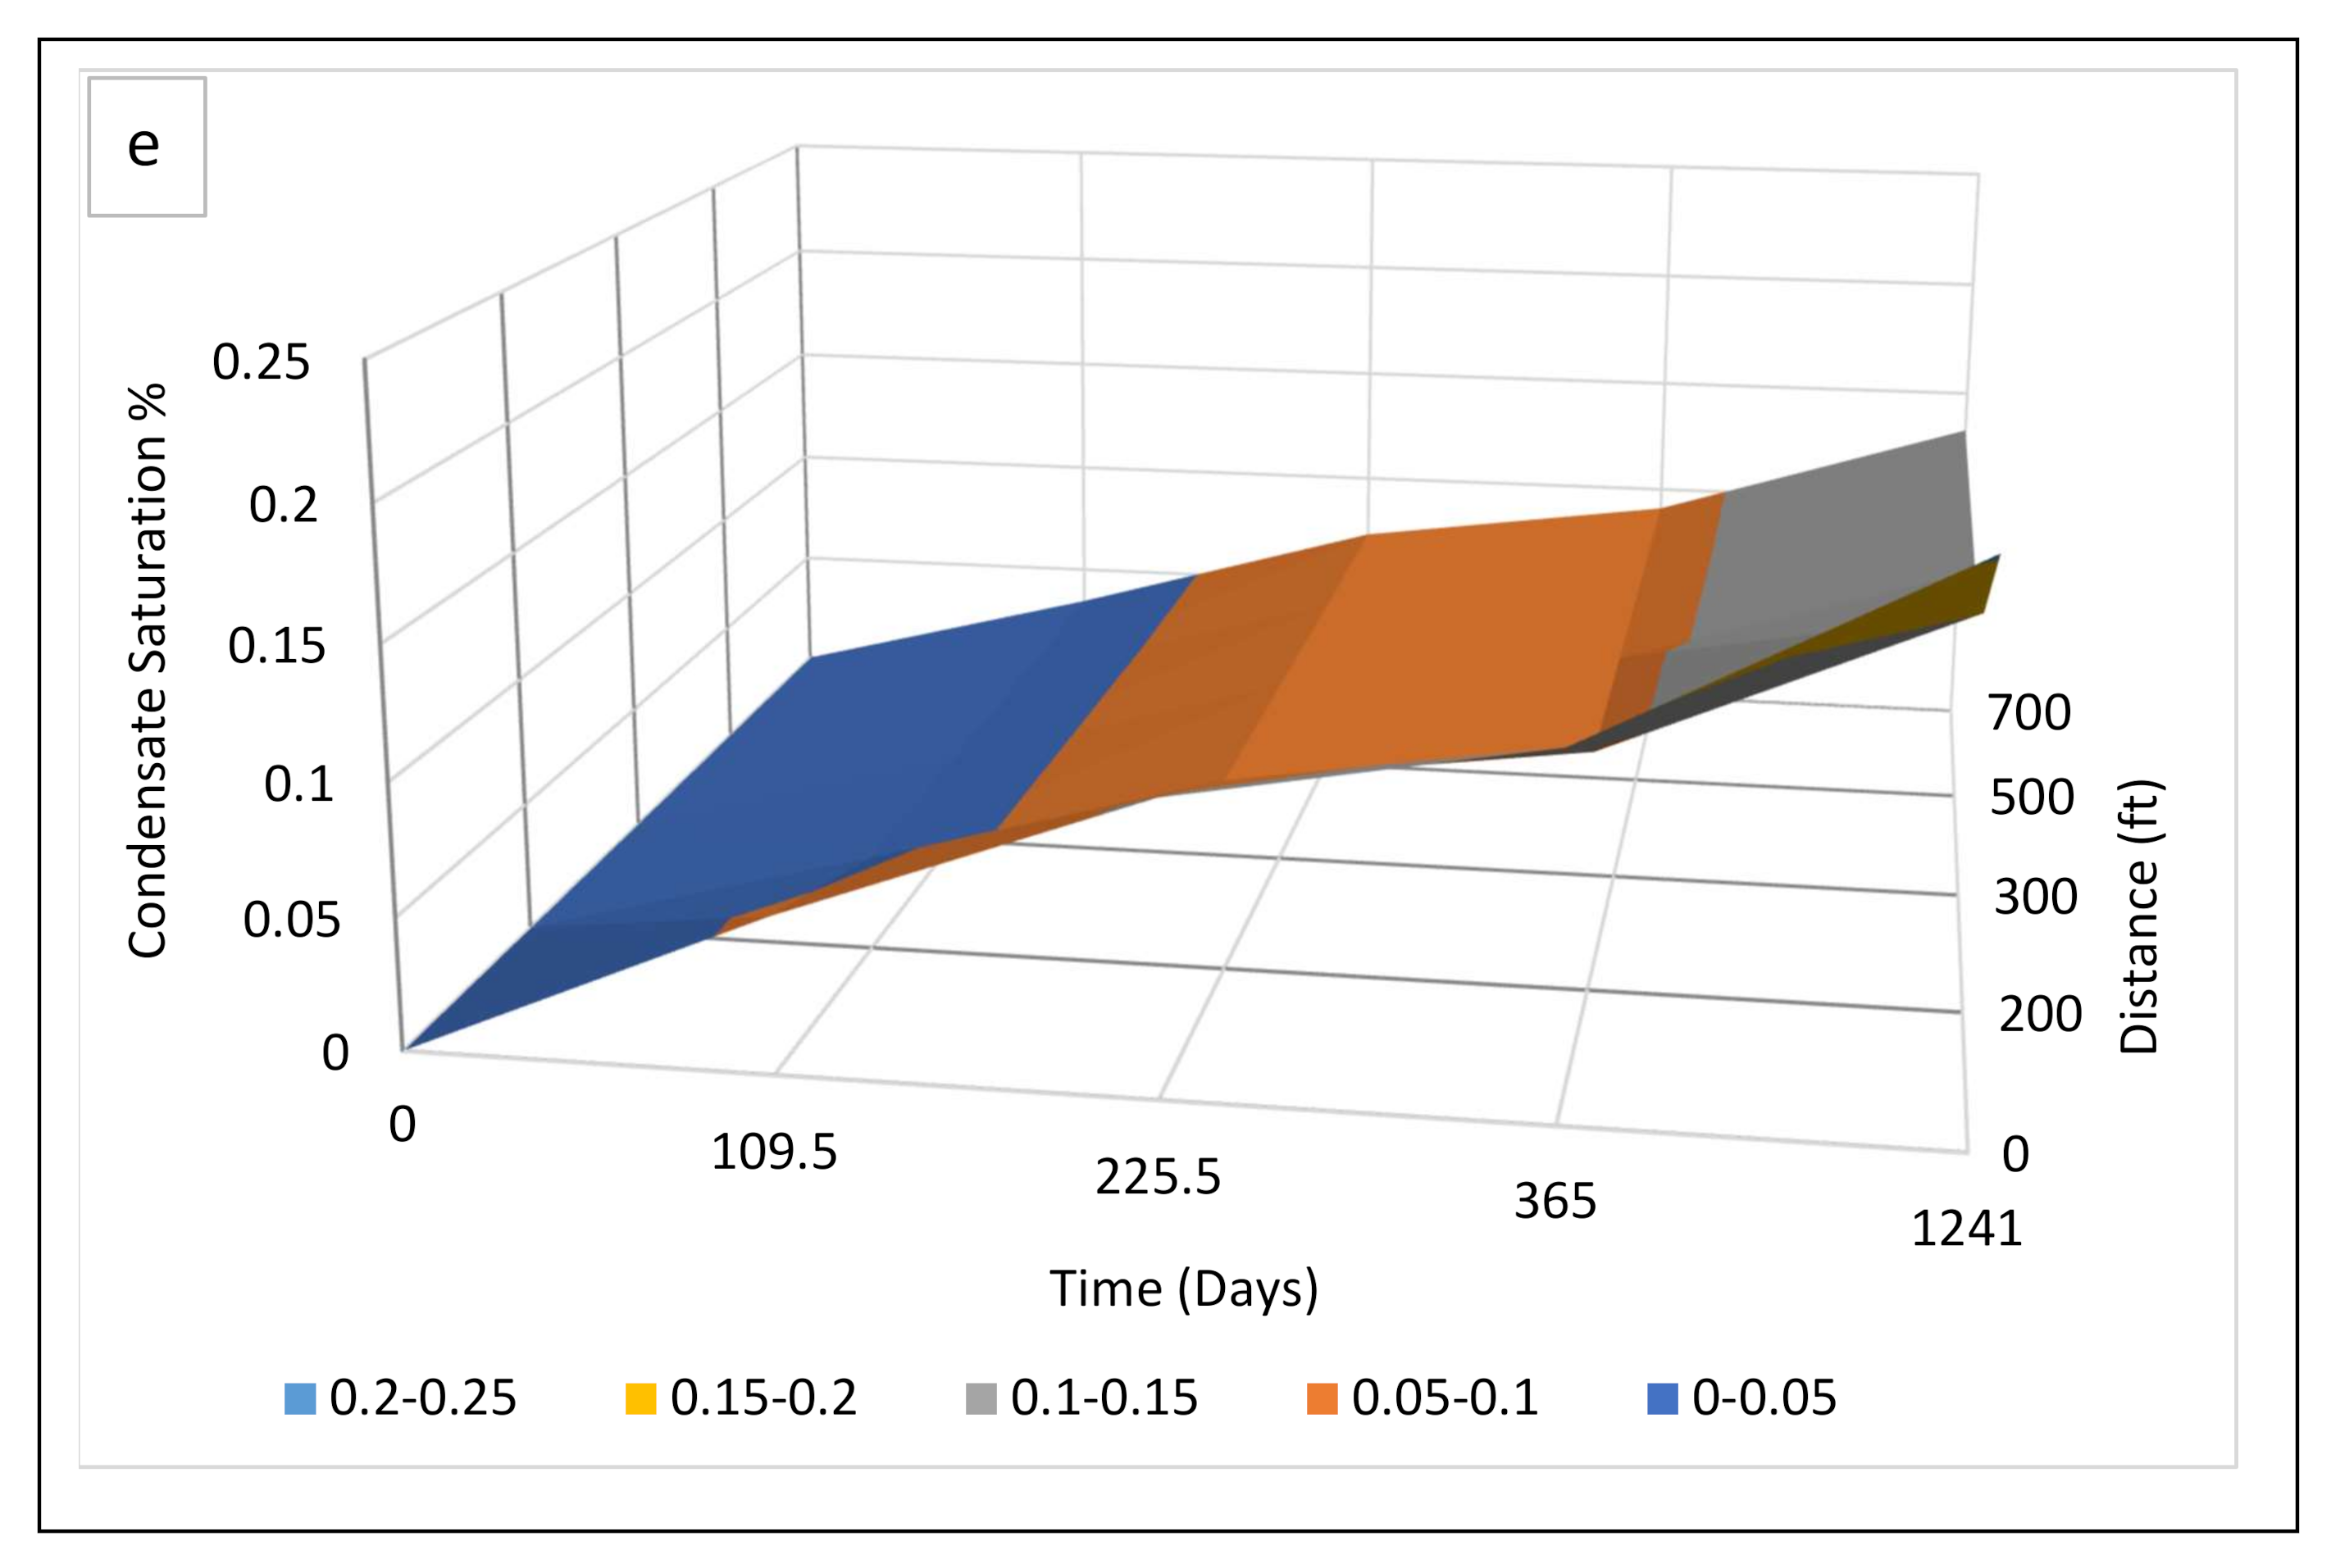
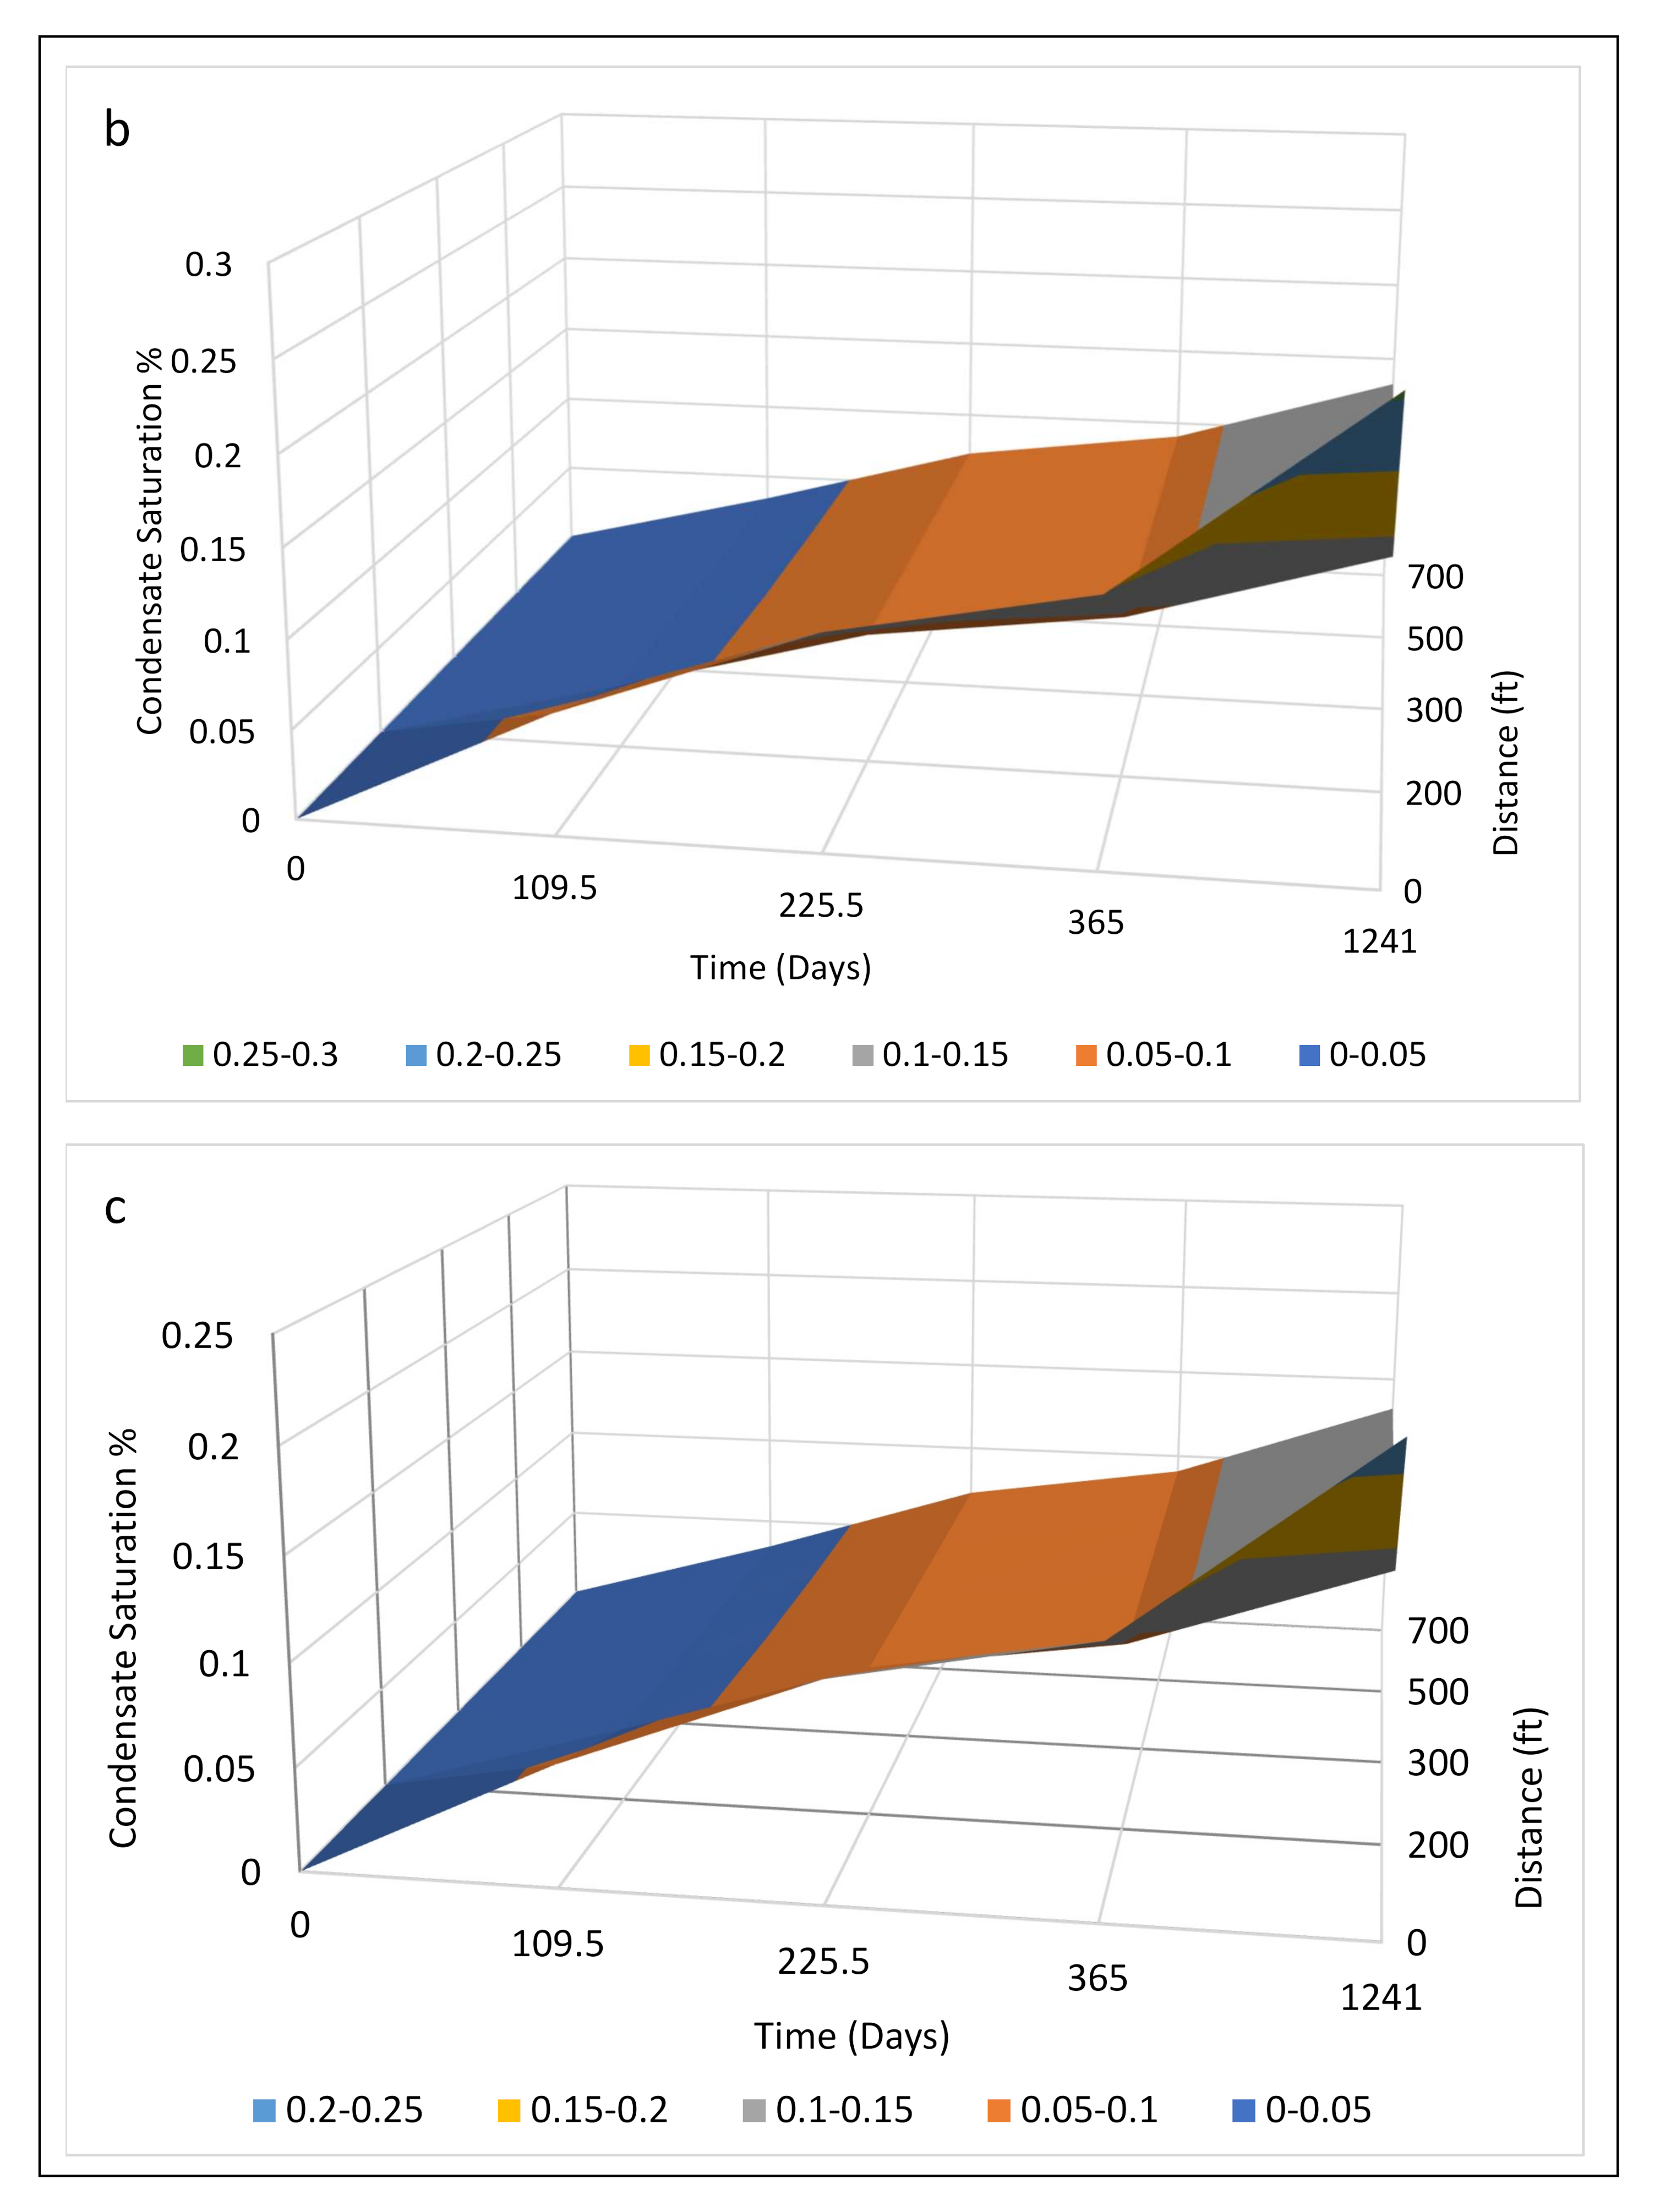
3.6. Time, Distance, and Condensate Concentration and Variation in Permeability

The outcomes of simulation data for local and global cases were used to model the relationship between time, distance, and condensate concentration in a 3D diagram. The selected cases are tight and high-permeability cases. Figure 15 and Figure 16 show 3D plots representing phase changes during condensate production, with condensate formation plotted as a function of time and distance from the wellbore for the global and local grid cases analysed. The 3D image also shows trends in the phase behaviour of condensate saturation from one region to another for a reservoir with a permeability of 0.5–1 mD, demonstrating a very high potential for condensate blockage as compared to other cases. This is reflected in the timing of condensate saturation which was observed to have increased (Figure 15) for the a, b, and c plots in the global analysis as compared to Figure 16 in the local analysis of the same plots. Hence a decline in condensate saturation occurs as reservoir permeability increases from low to high permeability.

4. Conclusions

The results show that permeability has a significant effect on the occurrence of the three regions around the well, which in turn influences the productivity of gas condensate reservoirs.
The lower the reservoir permeability, the more abundant the gas and the higher the pressure drawdown will be during production, which represents a high potential for condensate blockage. Therefore, the permeability of gas condensate reservoirs should be considered as among the most crucial parameters, as it most strongly affects the degree of condensate blockage. Three permeability regions were defined. Region 1 (50 < K < 100) has an insignificant impact on the immobile phase and condensate formation, Region 2 (10 < K < 50) exhibits a slight increase in the immobile phase and also condensate formation, and Region 3 (K < 10) shows a significant increase.
A logarithmic relationship is proposed between immobile phase, percentage condensate saturation and length of each region in order to estimate the equations which can be used to predict the timing, distance, and concentration of condensate formation according to permeability locally and globally.
The predictions of the timing and location of condensate reservoirs for different levels of permeability ranging from 0.5 mD to 100 mD indicate that local damage enhances the rate of condensate formation by up to 60% and shortens the duration of the immobile phase by up to 45%, while global condensate formation is increased by 80% and the presence of the immobile phase is reduced by 60%.
Therefore, tight condensate reservoirs have an extreme affinity towards hydrate production and are very sensitive to the formation of damage as compared to high permeability reservoirs.
This type of prediction can help in efforts to mitigate condensate blockage at the right time and location around the wellbore.
The results of this study show that condensate blockage could have a severe negative impact on reservoirs with low values of permeability (K = 0.5 mD, 1 mD, 5 mD, and 10 mD). In contrast, the effects observed for reservoirs of moderate permeability (k = 20 mD, 30 mD, and 50 mD) could be smaller and may become negligible for high permeability reservoirs (k = 75 mD and 100 mD).

Author Contributions

Supervision, S.R.G., J.U. and P.R.; Writing—original draft, B.B.O.; Writing—review and editing, S.R.G. All authors have read and agreed to the published version of the manuscript.

Funding

This research received no external funding.

Acknowledgments

The author would like to acknowledge Teesside University for providing the IT facilities to perform the reservoir modelling and also wishes to thank the Petroleum Technology Development Fund (PTDF) Nigeria for funding this research.

Conflicts of Interest

The authors declare no conflict of interest.

References

  1. Holditch, S.A. Tight gas sands. J. Pet. Technol. 2006, 58, 86–93. [Google Scholar] [CrossRef]
  2. Bennion, D.B.; Thomas, F.B.; Bietz, R.F. Low permeability gas reservoirs: Problems, opportunities and solutions for drilling, completion, stimulation and production. In Proceedings of the SPE Gas Technology Symposium, Calgary, AB, Canada, 28 April–1 May 1996. [Google Scholar]
  3. Ayyalasomayajula, P.; Silpngarmlers, N.; Kamath, J. Well deliverability predictions for a low-permeability gas/condensate reservoir. In Proceedings of the SPE Annual Technical Conference and Exhibition, Dallas, TX, USA, 9–12 October 2005. [Google Scholar]
  4. Clarkson, C.R.; Qanbari, F. History matching and forecasting tight gas condensate and oil wells by use of an approximate semi-analytical model derived from the dynamic-drainage-area concept. SPE Reserv. Eval. Eng. 2016, 19, 540–552. [Google Scholar] [CrossRef]
  5. Kamath, J. Deliverability of gas-condensate reservoirs: Field experiences and prediction techniques. J. Pet. Technol. 2007, 59, 94–99. [Google Scholar] [CrossRef]
  6. Fevang, Ø.; Whitson, C.H. Modelling gas-condensate well deliverability. SPE Reserv. Eng. 1996, 11, 221–230. [Google Scholar] [CrossRef]
  7. Kniazeff, V.J.; Naville, S.A. Two-phase flow of volatile hydrocarbons. Soc. Pet. Eng. J. 1965, 5, 37–44. [Google Scholar] [CrossRef]
  8. Ahmadi, M.; Sharifi, M.; Hashemi, A. Comparison of simulation methods in gas condensate reservoirs. Pet. Sci. Technol. 2014, 32, 761–771. [Google Scholar] [CrossRef]
  9. Shi, C. Flow Behaviour of Gas-Condensate Wells. Ph.D. Thesis, Stanford University, Stanford, CA, USA, 2009. [Google Scholar]
  10. Bennion, D.B.; Bietz, R.F.; Thomas, F.B.; Cimolai, M.P. Reductions in the productivity of oil and low permeability gas reservoirs due to aqueous phase trapping. J. Can. Pet. Technol. 1994, 33. [Google Scholar] [CrossRef]
  11. Fairhurst, D.L.; Indriati, S.; Reynolds, B.W.; Lewis, J.W.; Holcomb, M.W.; Starr, F.F. Advanced technology completion strategies for marginal tight gas sand reservoirs: A production optimization case study in South Texas. In Proceedings of the SPE Annual Technical Conference and Exhibition, Anaheim, CA, USA, 11–14 November 2007. [Google Scholar]
  12. Fevang, Ø.; Whitson, C.H.; Trondheim, N. Modelling gas condensate well deliverability. In Proceedings of the SPE Annual Technical Conference and Exhibition, Dallas, TX, USA, 22–25 October 1995. [Google Scholar]
  13. Penuela, G.; Civan, F. Gas-condensate well test analysis with and without relative permeability curves. In Proceedings of the SPE Annual Technical Conference and Exhibition, Dallas, TX, USA, 1–4 October 2000. [Google Scholar]
  14. Gringarten, A.C.; Al-Lamki, A.; Daungkaew, S.; Mott, R.; Whittle, T.M. Well test analysis in gas condensate reservoirs. In Proceedings of the SPE Annual Technical Conference and Exhibition, Dallas, TX, USA, 1–4 October 2000. [Google Scholar]
  15. Roussennac, B. Gas Condensate Well Test Analysis. Ph.D. Thesis, Stanford University, Stanford, CA, USA, 2000. [Google Scholar]
  16. Rajeev, R.L. Well testing in gas-condensate reservoirs. Master’s Thesis, Stanford University, Stanford, CA, USA, 2003. [Google Scholar]
  17. Hashemi, A.; Nicolas, L.; Gringarten, A.C. Well test analysis of horizontal wells in gas-condensate reservoirs. SPE Reserv. Eval. Eng. 2006, 9, 86–99. [Google Scholar] [CrossRef]
  18. Al Ismail, M.I. Field Observations of Gas-Condensate Well Testing. Ph.D. Thesis, Stanford University, Stanford, CA, USA, 2010. [Google Scholar]
  19. Al Ismail, M.I.; Horne, R.N. An investigation of gas-condensate flow in liquid-rich shales. In Proceedings of the SPE Unconventional Resources Conference, Woodlands, TX, USA, 1–3 April 2014. [Google Scholar]
  20. Yu, S. A new methodology to predict condensate production in tight/shale retrograde gas reservoirs. In Proceedings of the SPE Unconventional Resources Conference, Woodlands, TX, USA, 1–3 April 2014. [Google Scholar]
  21. Allahyari, M.; Aminshahidy, B.; Sanati, A.; Taghikhani, V. Analysis of near well-bore behaviour of gas condensate reservoir in production stage. Pet. Sci. Technol. 2012, 30, 2594–2603. [Google Scholar] [CrossRef]
  22. Orodu, O.D.; Ako, C.T.; Makinde, F.A.; Owarume, M.O. Well deliverability predictions of gas flow in gas-condensate reservoirs, modelling near-critical wellbore problem of two-phase flow in 1-dimension. Braz. J. Pet. Gas 2012, 6. [Google Scholar] [CrossRef] [Green Version]
  23. Marhaendrajan, T.; Kartawidjaya, A. Parametrical study on retrograde gas reservoir behaviour. J. Transl. Med. 2007, 14, 133. [Google Scholar]
  24. Khazam, M.M.; Abu Grin, Z.Y.; Elhajjaji, R.R.; Sherik, A.A. The impact of condensate blockage on gas well deliverability: Part 1. In Proceedings of the SPE Kuwait Oil and Gas Show and Conference, Kuwait City, Kuwait, 15–18 October 2017. [Google Scholar]
  25. Bilotu Onoabhagbe, B.; Rezaei Gomari, S.; Russell, P.; Ugwu, J.; Ubogu, B.T. Phase change tracking approach to predict the timing of condensate formation and its distance from the wellbore in gas condensate reservoirs. Fluids 2019, 4, 71. [Google Scholar] [CrossRef] [Green Version]
  26. Kenyon, D. Third SPE comparative solution project: Gas cycling of retrograde condensate reservoirs. J. Pet. Technol. 1987, 39, 981–997. [Google Scholar] [CrossRef]
  27. Valencia, K.L.; Chen, Z.; Rahman, M.K.; Rahman, S.S. An integrated model for the design and evaluation of multiwell hydraulic fracture treatments for gas-condensate reservoirs. In Proceedings of the SPE International Improved Oil Recovery Conference in Asia Pacific, Kuala Lumpur, Malaysia, 20–21 October 2003. [Google Scholar]
Figure 1. 3D reservoir image for local grid permeability analysis showing the highlighted cells of interest under study.
Energies 13 06551 g001
Figure 2. Reservoir pressure versus time at the wellbore for global grid analysis.
Energies 13 06551 g002
Figure 3. Reservoir pressure versus time at the wellbore for local grid analysis.
Energies 13 06551 g003
Figure 4. Condensate saturation as a function of time for different absolute permeabilities at the wellbore: global analysis.
Energies 13 06551 g004
Figure 5. Condensate saturation as a function of time at the wellbore for different permeabilities: local analysis.
Energies 13 06551 g005
Figure 6. Duration of region 1 for different cases of permeability at the wellbore for both analyses.
Energies 13 06551 g006
Figure 7. Duration of region 2 as a function of permeability at the wellbore for both analyses.
Energies 13 06551 g007
Figure 8. Duration of Region 3 as a function of permeability at the wellbore for both analyses.
Energies 13 06551 g008
Figure 9. Condensate saturation as a function of permeability at the wellbore for different stages of production (global analysis).
Energies 13 06551 g009
Figure 10. Condensate saturation as a function of permeability for different stages of production at the wellbore (local analysis).
Energies 13 06551 g010
Figure 11. Comparison of percentage of immobile phase condensate versus permeability for global and local analyses.
Energies 13 06551 g011
Figure 12. Comparison of percentage difference in condensate saturation versus permeability for global and local analyses.
Energies 13 06551 g012
Figure 13. Comparison of the cumulative hydrocarbon composition (C1 and C4–6) at the wellbore, global case.
Energies 13 06551 g013
Figure 14. Comparison of the cumulative hydrocarbon composition (C1 and C4–6) at the wellbore, local case.
Energies 13 06551 g014
Figure 15. 3D plots for reservoirs in global analysis with values of permeability of: (a) 1 mD; (b) 5 mD; (c) 10 mD; (d) 50 mD; and (e) 100 mD.
Energies 13 06551 g015aEnergies 13 06551 g015bEnergies 13 06551 g015c
Figure 16. 3D plots for reservoirs in local analysis with values of permeability of: (a) 1 mD; (b) 5 mD; (c) 10 mD; (d) 50 mD; and (e) 100 mD.
Energies 13 06551 g016aEnergies 13 06551 g016bEnergies 13 06551 g016c
Table 1. Summary of the duration of each region and maximum condensate saturation for each case of permeability variation: global analysis.
Permeability
Variation K(mD)
Region 1 (Days)Region 2 (Days)Region 3 (Days)Maximum Condensate
Saturation (%)
1620.54818034
5620.53358146030
7.5620.52993182530
10912.52628189828
15912.52482204427
201204.52190204426
301496.51825211724
501496.51825211722
751496.51825211721
100 Basecase1496.51898204421
Table 2. Summary of the duration of each region and maximum condensate saturation for each case of permeability variation: local analysis.
Permeability Variation K(mD)Region 1
(Days)
Region 2 (Days)Region 3 (Days)Maximum Condensate Saturation (%)
1912.54526030
51204.53139109526
7.51496.52482146024
101496.52117182523
151496.51971197121
201496.51825211721
301496.51825211721
501496.51825211721
751496.51825211721
100 Basecase1496.51898204421
Publisher’s Note: MDPI stays neutral with regard to jurisdictional claims in published maps and institutional affiliations.

