Article

Conceptual Design Development of Coal-to-Methanol Process with Carbon Capture and Utilization

1
Chemical Engineering Department, King Fahd University of Petroleum and Minerals, Dhahran 31261, Saudi Arabia
2
King Abdulaziz City for Science and Technology (KACST), Riyadh 11442, Saudi Arabia
3
School of Chemical Engineering and Materials Science, Chung-Ang University, 84 Heukseok-ro, Dongjak-gu, Seoul 06974, Korea
*
Authors to whom correspondence should be addressed.
Energies 2020, 13(23), 6421; https://doi.org/10.3390/en13236421
Submission received: 22 October 2020 / Revised: 20 November 2020 / Accepted: 27 November 2020 / Published: 4 December 2020

Abstract

:
Methanol is a clean fuel and an important feedstock for the petrochemical industry. Conventionally, the coal-to-methanol process generates a substantial amount of CO2 emissions with a low yield of methanol. In this study, we propose the conceptual design development of coal-to-methanol process using captured CO2 from the gasification plant by implying process intensification. The base case and three alternative designs have been developed using the Aspen Plus to analyze the process performance. The four designs have been compared in terms of their energy consumption, economics, methanol production rate, and carbon emissions while maintaining the gasifier operation conditions, sulfur content in the syngas, and stoichiometric number at the methanol synthesis reactor. Among the developed designs, the most feasible design requires an energy requirement and product cost of 21.9 GJ and $142.5 per ton of methanol product. The study also showed that the coal-to-methanol process assisted with external hydrogen from electrolysis plant for achieving higher production rates and low CO2 emissions is currently not economical due to the high H2 cost.

1. Introduction

Despite significant advancements and commercialization of the renewable energy, fossil fuel remains the major contributor in the global energy share. Meanwhile, the impact of climate change and rising carbon emissions are serious concerns that need to be responded quickly. Intergovernmental Panel on Climate Change (IPCC) and other global agencies have warned that if not enough action is taken rapidly, the climate change will bring extensive droughts and famines, spread of diseases and displacement of populations [1]. Carbon capture, utilization, and storage (CCUS) is a potential technology that can help with the reduction of CO2 emissions. The conversion of CO2 to valuable chemicals offer cleaner environment as well as an economic advantage. Among many options, CO2 conversion to methanol is one of the key routes and is important feedstock for the downstream production of many other valuable chemicals. Due to its clean combustion characteristics, many countries are promoting methanol blending with the gasoline for its usage in the vehicles. Methanol is also gaining fast acceptance as a marine fuel because of its low emissions compared to the heavy fuel oil [2]. In addition, methanol has a wide range of applications including biodiesel production, as a solvent in paints and resins, as an antifreeze agent, and in denitrification of wastewater [3,4]. Methanol has an ever-increasing strong market demand and its market increased with a compound annual growth rate (CAGR) of 6% from 2013 to 2018 and is forecasted to increase with a growth rate of 5% in the next four years mainly led by methanol-to-olefins (MTO) [5]. Currently, China is the largest consumer of global methanol production, accounting for around 58% of the methanol usage [5].
Currently, most of the methanol is produced by the catalytic reaction of synthesis gas as shown in Equation (1). Synthesis gas is mainly a mixture of gases containing H2, CO and CO2 and is mostly produced through the steam reforming of natural gas [6]. Figure 1 shows the simple process flow diagram for the methanol production from the reforming of natural gas.
CO + 2H2 ↔ CH3OH   ∆H = −90.64 kJ/mol
In recent years, direct hydrogenation of CO2 for methanol production has been a subject of an extensive research due to an alarming level of CO2 in the atmosphere. Many studies have been conducted exploring the thermodynamic, kinetic, catalytic, and process design aspects of CO2 conversion to methanol. Nguyen and Zondervan [7] performed the economic evaluation of CO2 to methanol routes including hydrogenation, bi-reforming, and tri-reforming at three different capacities. Their results showed that bi- and tri-reforming offer 37% and 39% lower total annual cost (TAC) respectively compared to the direct CO2 hydrogenation route. Leonzio et al. [8] studied various reactor configurations for CO2 to methanol hydrogenation reaction. They reported the reaction conversion to be 38%, 58% and 69% for once through reactor, membrane reactor and reactor with recycle respectively. Tamnitra et al. [9] performed the kinetic modelling of methanol synthesis reaction by modifying the work of Setinc and Levec [10] to match the experimental data. Lee et al. [11] proposed an economically optimized design using complex superstructure optimization. The study found that the CO2 conversion can be increased to 52% using a multistage reactor design with inter-stage product recovery. Xiang et al. [12] proposed the methanol and hydrogen production through chemical looping reforming process by integrating the combustion process to utilize the CO2 emissions. Kim et al. [13] performed the techno-economic evaluation for the poly-generation of methanol, power and heat from the coke oven gas as the feedstock. Similar analysis was performed by Ahmed [14] with the integration of a coal gasification and natural gas reforming process for the methanol production.
Conventionally, the catalyst employed for methanol synthesis is a combination of Cu/ZnO/Al2O3 as reported in the literature. Recently, Agarwal [15] proposed CO2 hydrogenation using metal-organic frameworks (MOFs) for an improved catalytic activity and selectivity of the catalyst. Ting et al. [16] reported the hydrogenation of CO2 to methanol under low reaction temperature condition using TiO2 supported catalysts. Li et al. [17] studied the CO2 hydrogenation Cu/AlCeO catalyst and reported that the Cu/AlCeO catalyst had the lowest apparent activation barriers for CO2 activation and methanol synthesis.
One of the key economic hurdles in the production of methanol via CO2 hydrogenation is the source of H2. The production of H2 using the conventional reforming processes is energy intensive and contribute to carbon emissions. Some studies have explored the generation of renewable H2 integrated with the methanol synthesis process. Van-Dal et al. [18] designed and simulated the conversion of CO2 and H2 to methanol using Aspen Plus. They proposed to capture CO2 from a coal fired power plant and produce H2 from the water electrolysis. Their results showed that 1.6 ton of CO2 can be abated per ton of methanol production. Similarly, Asif et al. [19] studied the methanol production assuming the H2 from the electrolysis unit and CO2 stream from 600 MW supercritical coal power plant using post-combustion chemical solvent based technology. Charoensuppanimit et al. [20] proposed to utilize H2 as a by-product produced from the sodium methoxide (NaOCH3) production integrated with methanol synthesis process. A chemical reaction between sodium hydroxide and methanol releases a large amount of H2 that can be utilized to produce back methanol through CO2 hydrogenation. Kiss et al. [21] simulated the methanol synthesis process by CO2 hydrogenation using wet hydrogen by-product from the chlor-alkali production. Chlor-alkali process produces wet H2 as a by-product by performing the salt electrolysis. The energy analysis of this study showed the electricity consumption of 550 kWh and 0.48–1.16 ton steam per ton methanol produced. Luu et al. [22] studied the dry reforming of CO2 with methane to produce syngas for the methanol production. They evaluated five scenarios for the CCU-methanol system and reported the DMR with additional H2 from carbon-free water splitting plant to be the best case in terms of CO2 emission intensity.
Considering the availability and price fluctuations of the natural gas, alternative feedstocks such as coal and biomass are under investigation to produce syngas. Puig-Gamero et al. [23] simulated the pine gasification process for the production of methanol and performed a sensitivity analysis on some of the variables in the gasification and methanol synthesis section. Liu [24] studied the effect of plant size on the methanol production cost using coal and biomass as the feedstock. The study concluded the coal gasification to be more economical compared to the biomass or biomass-coal feedstocks. Herdem et al. [25] studied the biomass gasification assisted with photovoltaic hydrogen production system for the methanol production under different climatic conditions of Canada and Italy. Rivarolo et al. [26] compared the methanol production from different renewable sources such as solar, wind and hydroelectric to produce renewable H2. Their results showed that there is a great potential for methanol production from renewable sources provided governments provide financial incentives. Wang and Demirel [27] studied the oxy-combustion plant with carbon capture to produce power and methanol through coal gasification. They reported the input energy of 0.56 MW per ton of methanol produced. The study performed a life-cycle assessment to estimate the GHG emissions, water consumption, and energy consumption for coal to methanol process. Similar studies [28,29] have been conducted to analyze the technical and economic aspects of combined power and methanol production process. Gu et al. [30] proposed a coal-based gasification process for the co-production of LNG and methanol. The study performed the energy and economic analysis for the co-production process and reported the IRR to be 19%.
All the existing coal-to-methanol (CTM) plants employ coal gasification to produce syngas. Depending on the coal composition and gasifier technology, the typical syngas ratio (H2:CO) produced from the coal gasification process is in the range of 0.5–0.95 [31,32] which does not achieve the required stoichiometric ratio as shown in Equation (1). Therefore, the hydrogen amount is increased by reacting the CO with steam through water gas shift (WGS) to produce additional CO2 which is usually vented to the atmosphere. Similarly, most of the previous studies focusing on CTM process considered the sequestration of CO2 produced from the process and methanol was mainly produced from CO as shown in Equation (1). This study is focused on the conceptual design of CTM process where the energy intensive carbon capture and WGS units can be removed from the process while utilizing the CO2 for the methanol production. The goal of this work is to propose an improved design for CTM process using process intensification concept whereby minimizing the CO2 emissions from the process. First a base case model is developed by modifying the CTM process reported in literature [33]. Then, three alternative designs have been developed, implying the principles of process intensification to study the feasibility of the proposed designs. Finally, a detailed energy and cost analysis has been performed to ascertain the techno-economic viability of the processes.

2. Simulation Methodology

The general methodology followed in this study comprise of following steps: design conceptualization, process simulation and techno-economic analysis. First, three alternative CTM processes are developed by design intensification of the base case design that can reduce the carbon emissions while maximizing the methanol production. In order to have a fair comparison among various design alternatives, the inlet coal feed rate is fixed for all the cases. In addition, the maximum allowed H2S concentration in the syngas is 100 ppbv, while the CO2 removal rate is assumed to be 95%. The stoichiometric number at the inlet of methanol synthesis reactor is maintained at 2 for all the cases. Second, the simulation models have been developed using a commercial tool Aspen Plus. The thermodynamic package employed is the Peng-Robinson with Boston Mathias (PR-BM) equation of state (EOS) as the base method. This property method is recommended for the petrochemical applications where non-polar or mildly polar mixtures of hydrocarbons and light gases, such as CO2, H2S, and H2, are present [34]. Depending on the coal type, it may have a varied composition and heating value. In this study, coal is defined as an unconventional component for the purpose of simulation and the composition of coal is shown in Table 1. The heating value and density of the coal are specified using the HCOALGEN and DCOALGEN models respectively in the Aspen Plus. RGIBBS reactor model which is based on the minimization of Gibbs free energy is used as the gasifier in the simulation. WGS reactor is based on the REquil reactor model since the reaction stoichiometry is known and the reaction reach its chemical equilibrium. For the methanol synthesis, RPlug reactor has been employed using Vanden Bussche and Froment [35] reaction kinetics with adjusted parameters [18]. RPlug assumes that perfect mixing happens in the radial direction and that no mixing happens in the axial direction. The key specifications used in the Aspen Plus simulations are shown in Table 2. Finally, the proposed designs are compared in terms of energy consumption, methanol production, carbon emissions, and economic feasibility.

3. Process Description

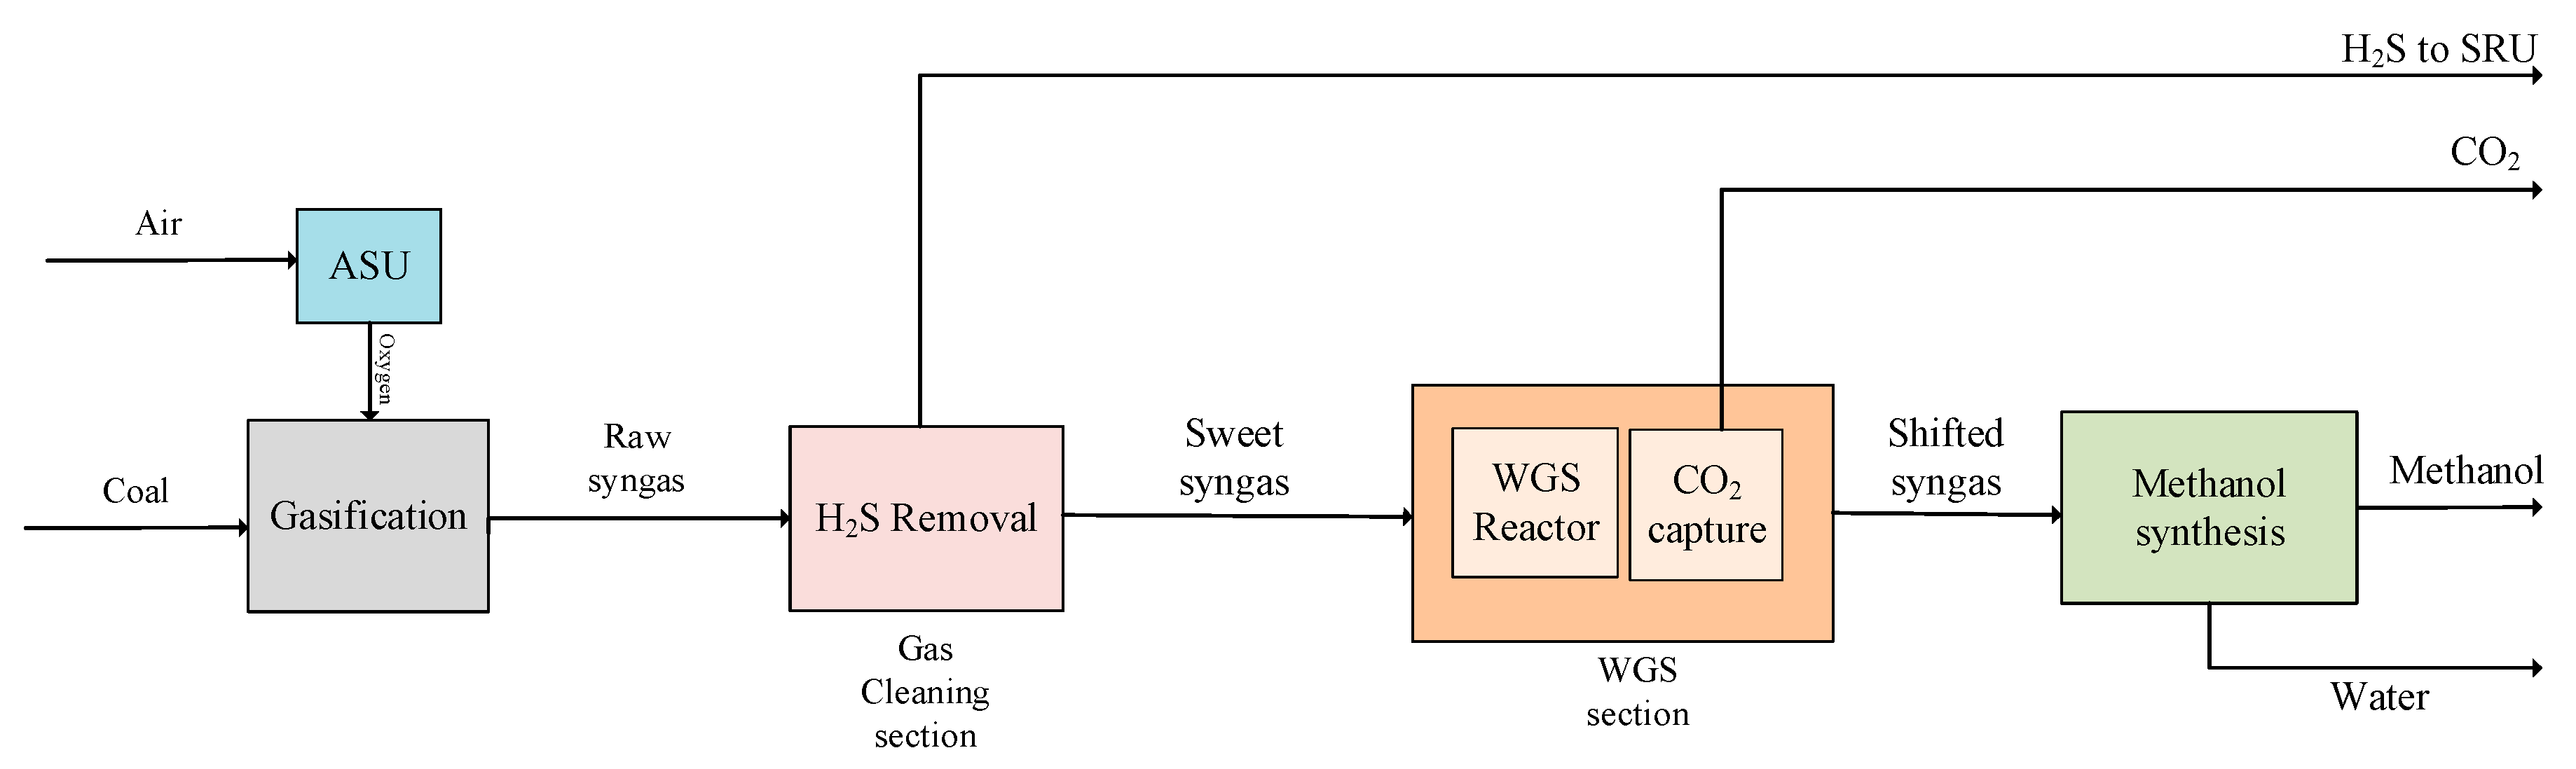
3.1. Base Case Design

The CTM base case design consists of four steps as shown in Figure 2. The first section in the process is coal preparation and gasification where the coal is grinded to prepare a coal slurry with 35 wt.% water. A calculator block is installed using a Fortran statement to calculate the required water flowrate for the desired coal slurry composition. The coal slurry is pumped to an elevated pressure of 50 bar before feeding it to the gasifier. The high temperature entrained-flow gasifier is fed with a controlled amount of 95 mol.% pure oxygen. The coal is gasified at 1300 °C and 50 bar with 99% carbon conversion forming ash, slag and raw syngas. Most of the slag leaves at the bottom of the gasifier, while the ash and other particulates are removed in a cyclone separator. The high temperature and high pressure raw syngas is cooled by exchanging heat to produce steam which is used to generate power through a steam cycle. Steam generated from the gasifier is also used in the WGS which is located downstream of the syngas cleaning unit. The raw syngas contains varying concentrations of H2S, COS and SOx depending on the coal type used. These sulfur based compounds must be removed from the syngas as they can poison the catalyst employed in the WGS reactor and methanol synthesis reactor. The maximum H2S quantity allowed in the methanol synthesis reactor should be no more than 100 ppbv. For this purpose, the raw syngas is routed to the gas cleaning unit, where a physical solvent is employed to remove the unwanted sulfur components. The gas cleaning unit is a conventional absorber-regenerator system where low temperature methanol at −34 °C is used as a solvent to absorb the sulfur components along with some CO2 in the absorber. The syngas free of H2S is then routed to CO2 capture unit where chilled methanol is employed the remove 95% of the CO2. Design Spec function in Aspen Plus has been used to adjust the lean solvent flowrate for the desired level of acid gases removal from the syngas. The syngas produced from the coal gasification usually have a low stoichiometric number (SN) which is defined in Equation (2).
SN =   H 2   CO 2 CO + CO 2
It has been widely reported in the literature that a methanol reactor should be operated with a stoichiometric number of 2 for maximum efficiency [8,36,37]. Therefore, in order to increase the H2 content, the cleaned syngas is passed through a two-stage WGS unit where the CO reacts with steam to form CO2 and H2 as shown in Equation (3).
CO + H2O ↔ CO2 + H2   ∆H = −41 kJ/mol
The steam supplied to the WGS reactor comes from the gasification section. The WGS reaction is an exothermic reaction increasing the temperature of the first stage effluent to around 395 °C which is cooled before feeding it to the second reactor. The steam flowrate required in the WGS reactor is manipulated using Design Spec function to achieve 99.5% conversion of CO. Additional CO2 capture unit is installed in the WGS section to remove the excess CO2 in order to maintain the SN of 2. The SN is maintained by adjusting the CO2 removal rate in the WGS section using the Design Spec function. The clean and shifted syngas is then fed to the catalytic packed bed methanol reactor at 210 °C and 76 bar where the crude methanol is produced by the reaction shown in Equation (4).
CO2 + 3H2 ↔ CH3OH + H2O   ∆H = −49.47 kJ/mol
The crude methanol is separated from the unreacted gas stream by reducing the reactor effluent temperature and pressure. The unreacted syngas is recycled back to the reactor with small amount being purged to limit the inert gas accumulation, while the 99.4 mol.% pure methanol is produced by distillation.

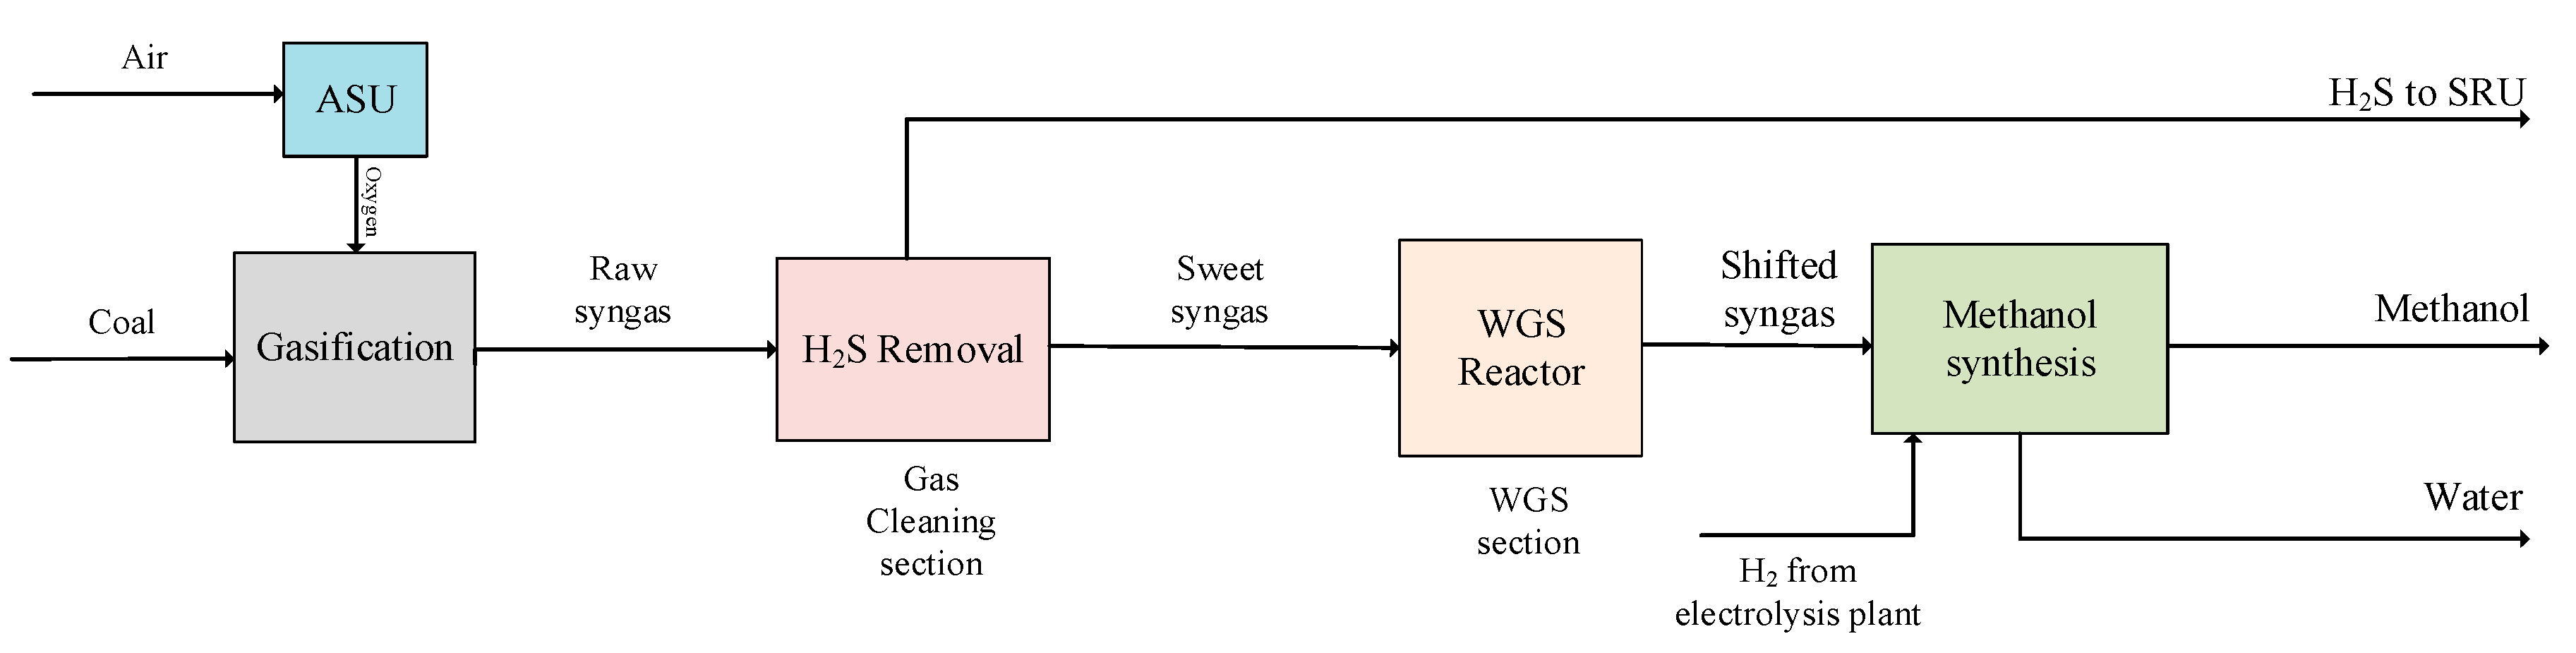
3.2. Modified Design 1 (MD1)

The modified design 1 proposed in this study contains the gasification, H2S gas cleaning, WGS, and methanol synthesis sections similar to the base case design as shown in Figure 3. However, the main difference is the absence of CO2 removal unit in the gas cleaning section compared to the base case design. In MD1, all the CO2 is captured after the WGS reactor in contrast to the base case design where most of the CO2 produced in the gasifier is removed prior to the WGS reactor and CO2 produced from the shift reaction is captured in a separate unit. This design alternative offers energy and cost savings due to the removal of CO2 capture unit in the gas cleaning section. On the other hand, the WGS reactor size and utilities consumption are increased because of the larger syngas flowrate. All the design variables are kept same as that of the base case design.

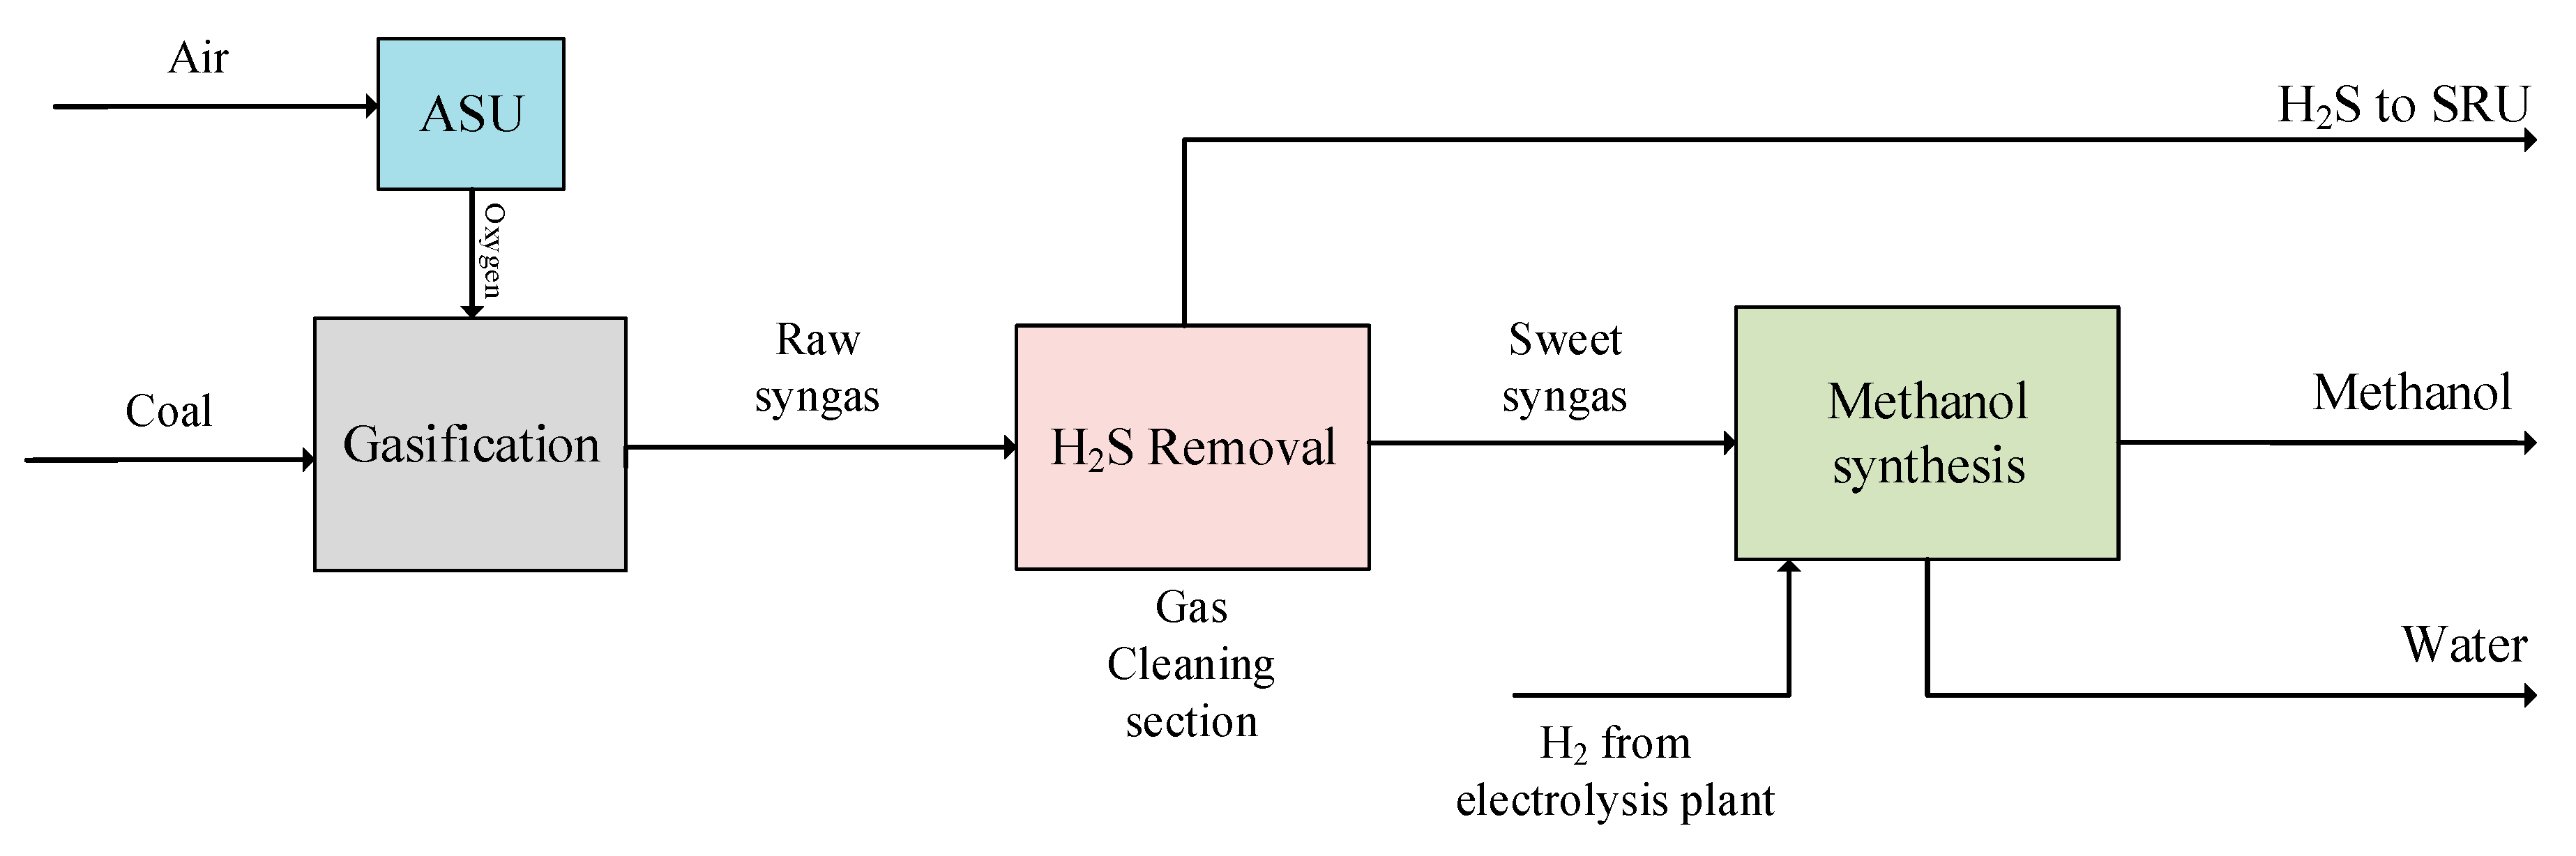
3.3. Modified Design 2 (MD2)

The modified design 2 contains the gasification, H2S gas cleaning, WGS and methanol synthesis sections, however, no CO2 is captured and removed from the process. Figure 4 shows the simplified block flow diagram for the MD2. The CO2 produced from the gasification unit and WGS reaction is directed to the methanol synthesis. However, in order to maintain the SN at the inlet of the methanol reactor, an additional quantity of external H2 is added to the process. In this study, the external H2 is assumed to be available from the alkaline water electrolysis plant costing an energy consumption of 4.5 kWh/m3 of H2 [38]. The energy consumption, and consequently the production cost of H2 from the electrolysis, is on the high side compared to the conventional process mainly because of the expensive electrodes employed in the process. This design alternative offers significant energy savings in gas cleaning and WGS sections together with higher methanol production and low carbon emissions. However, all of these benefits are negated by the high cost of external H2 supply to maintain the SN in the methanol synthesis section.

3.4. Modified Design 3 (MD3)

In modified design 3, both the CO2 cleaning and WGS units have been removed from the flowsheet as shown in Figure 5. The syngas from the gasification unit is sent to the H2S cleaning unit for the removal of sulfur compounds. The cleaned syngas mainly containing CO, CO2 and H2 is then routed to the methanol synthesis block. Similar to MD2, additional H2 is added from the electrolyser in order to maintain the SN at the inlet of the methanol reactor. This design offers better process performance in terms of lower carbon emissions, higher methanol production and lower capital cost compared to the MD2-CTM. However, similar to the MD2-CTM case, an expensive external H2 supply from the electrolyser makes the overall process infeasible. The quantitative analysis in terms of design performance indicators is discussed in the following sections. The stream information for all the four cases is shown in Table 3.

4. Results and Discussions

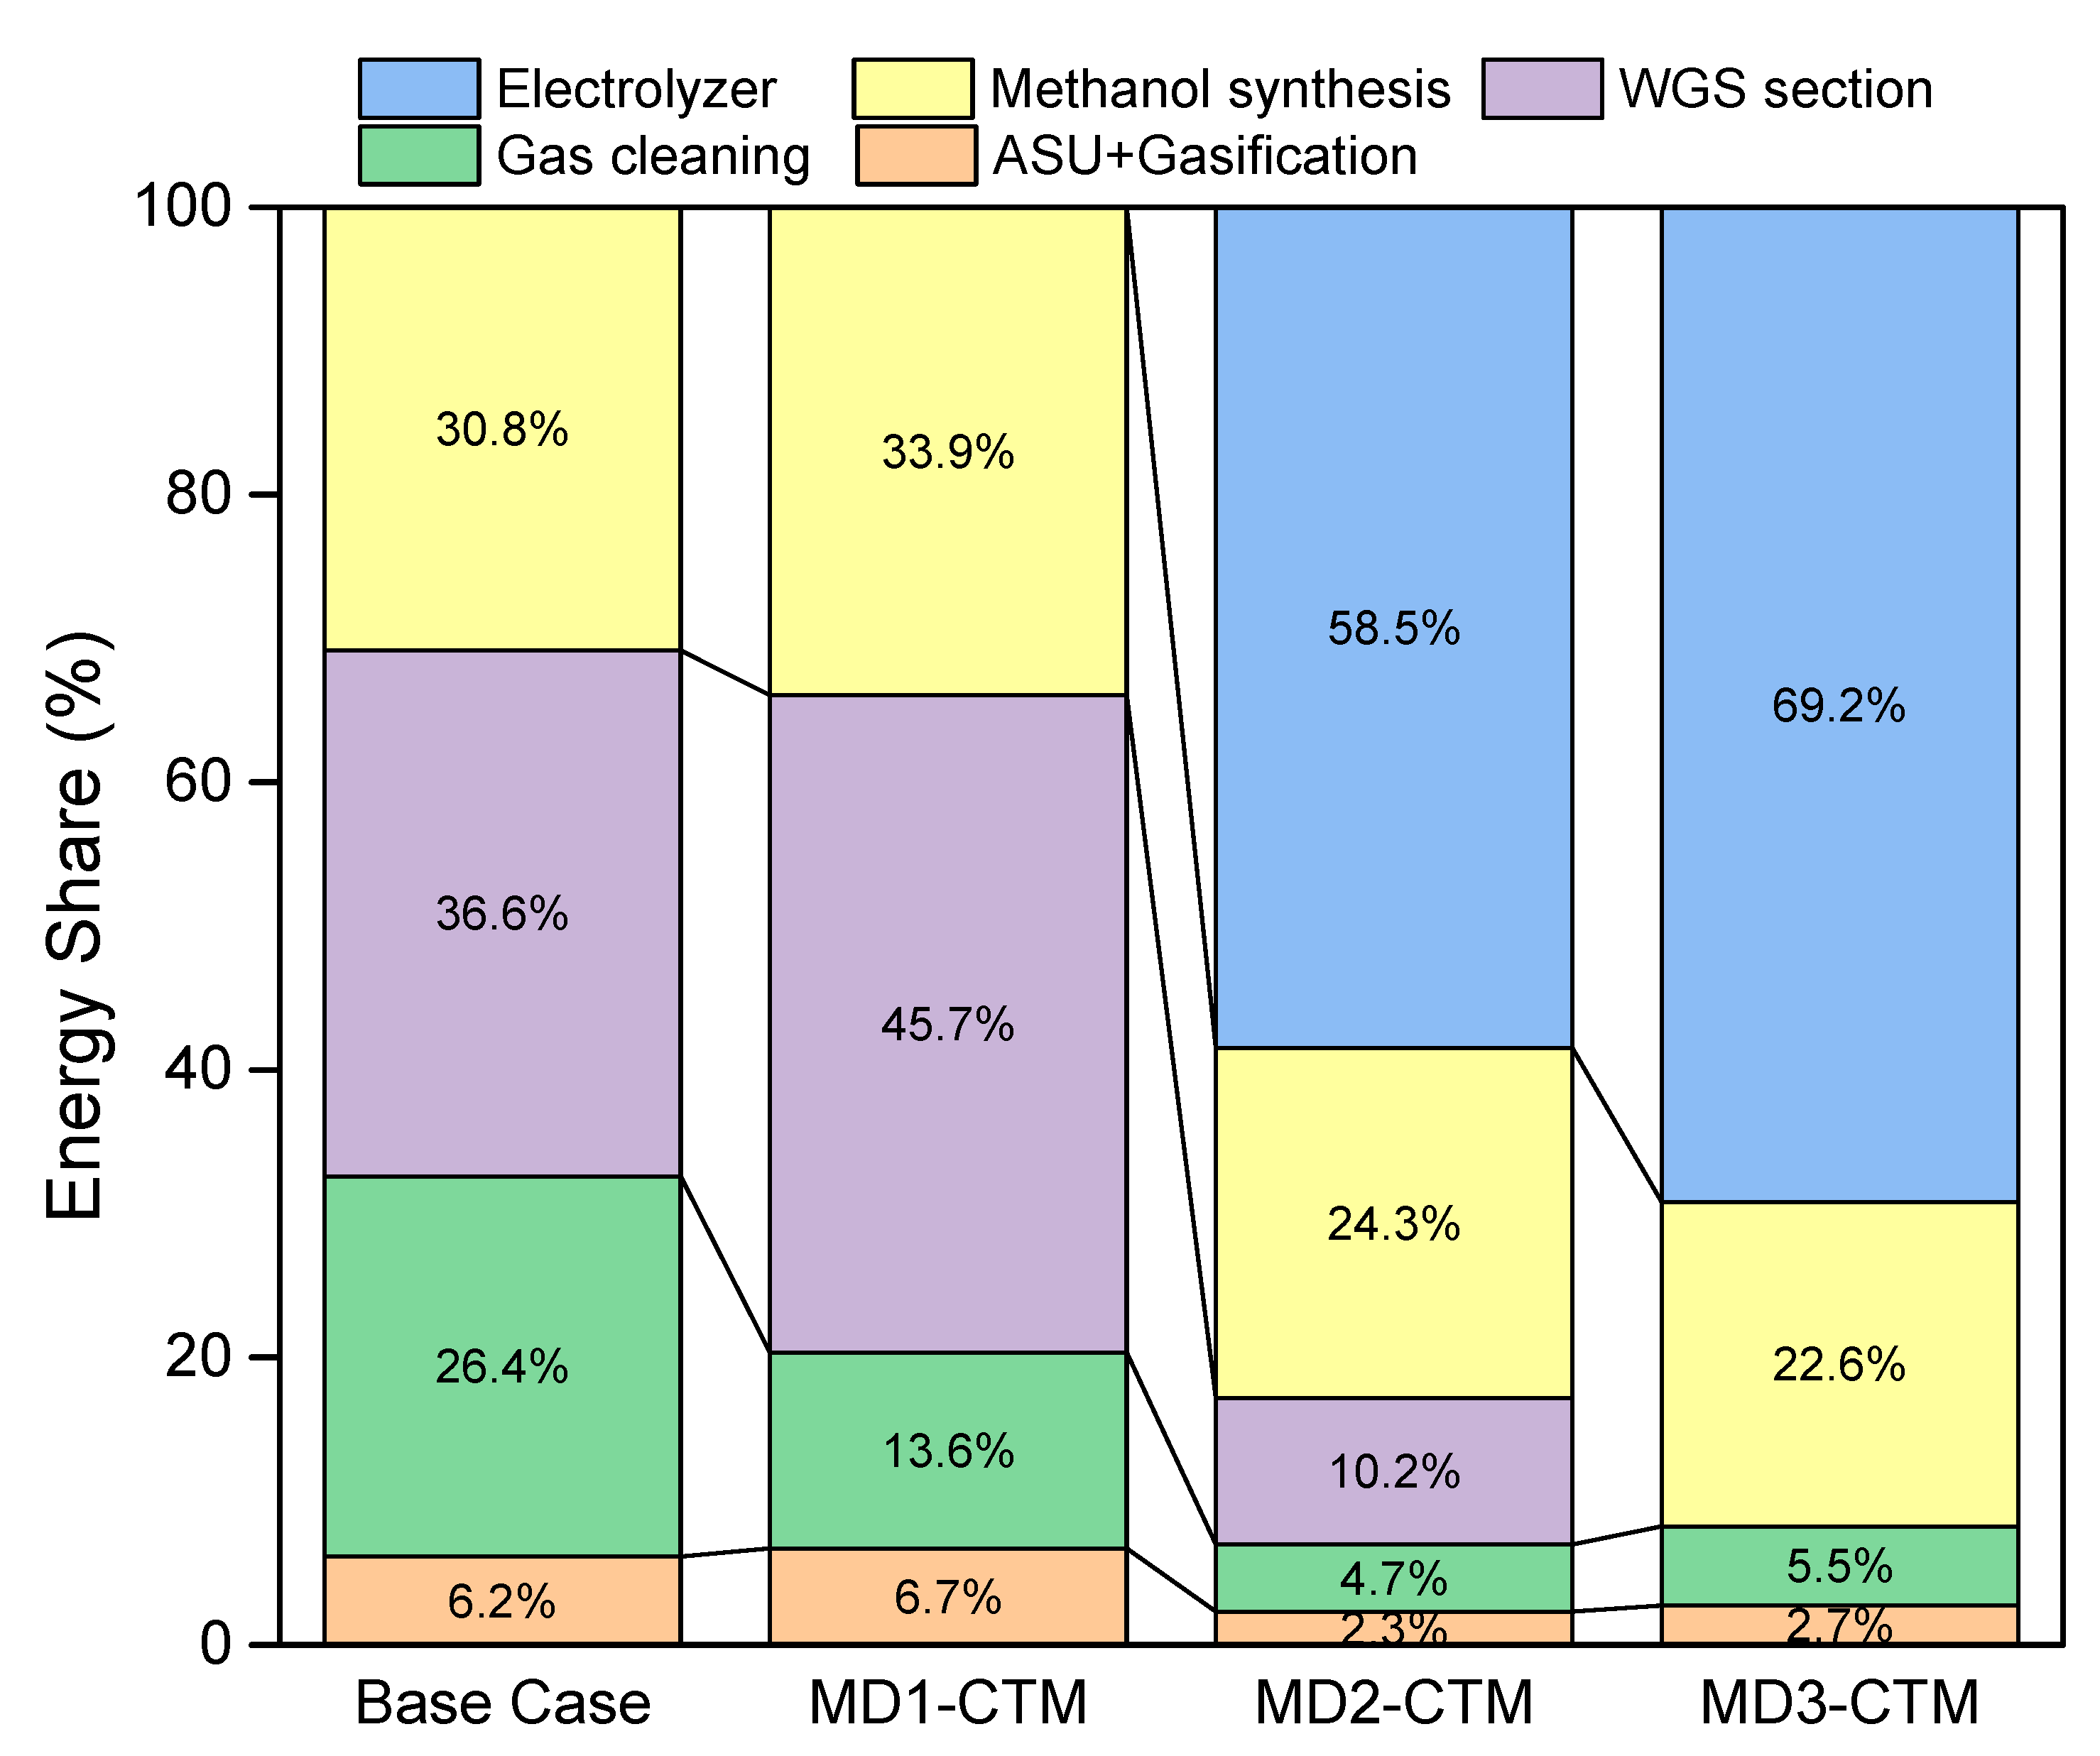
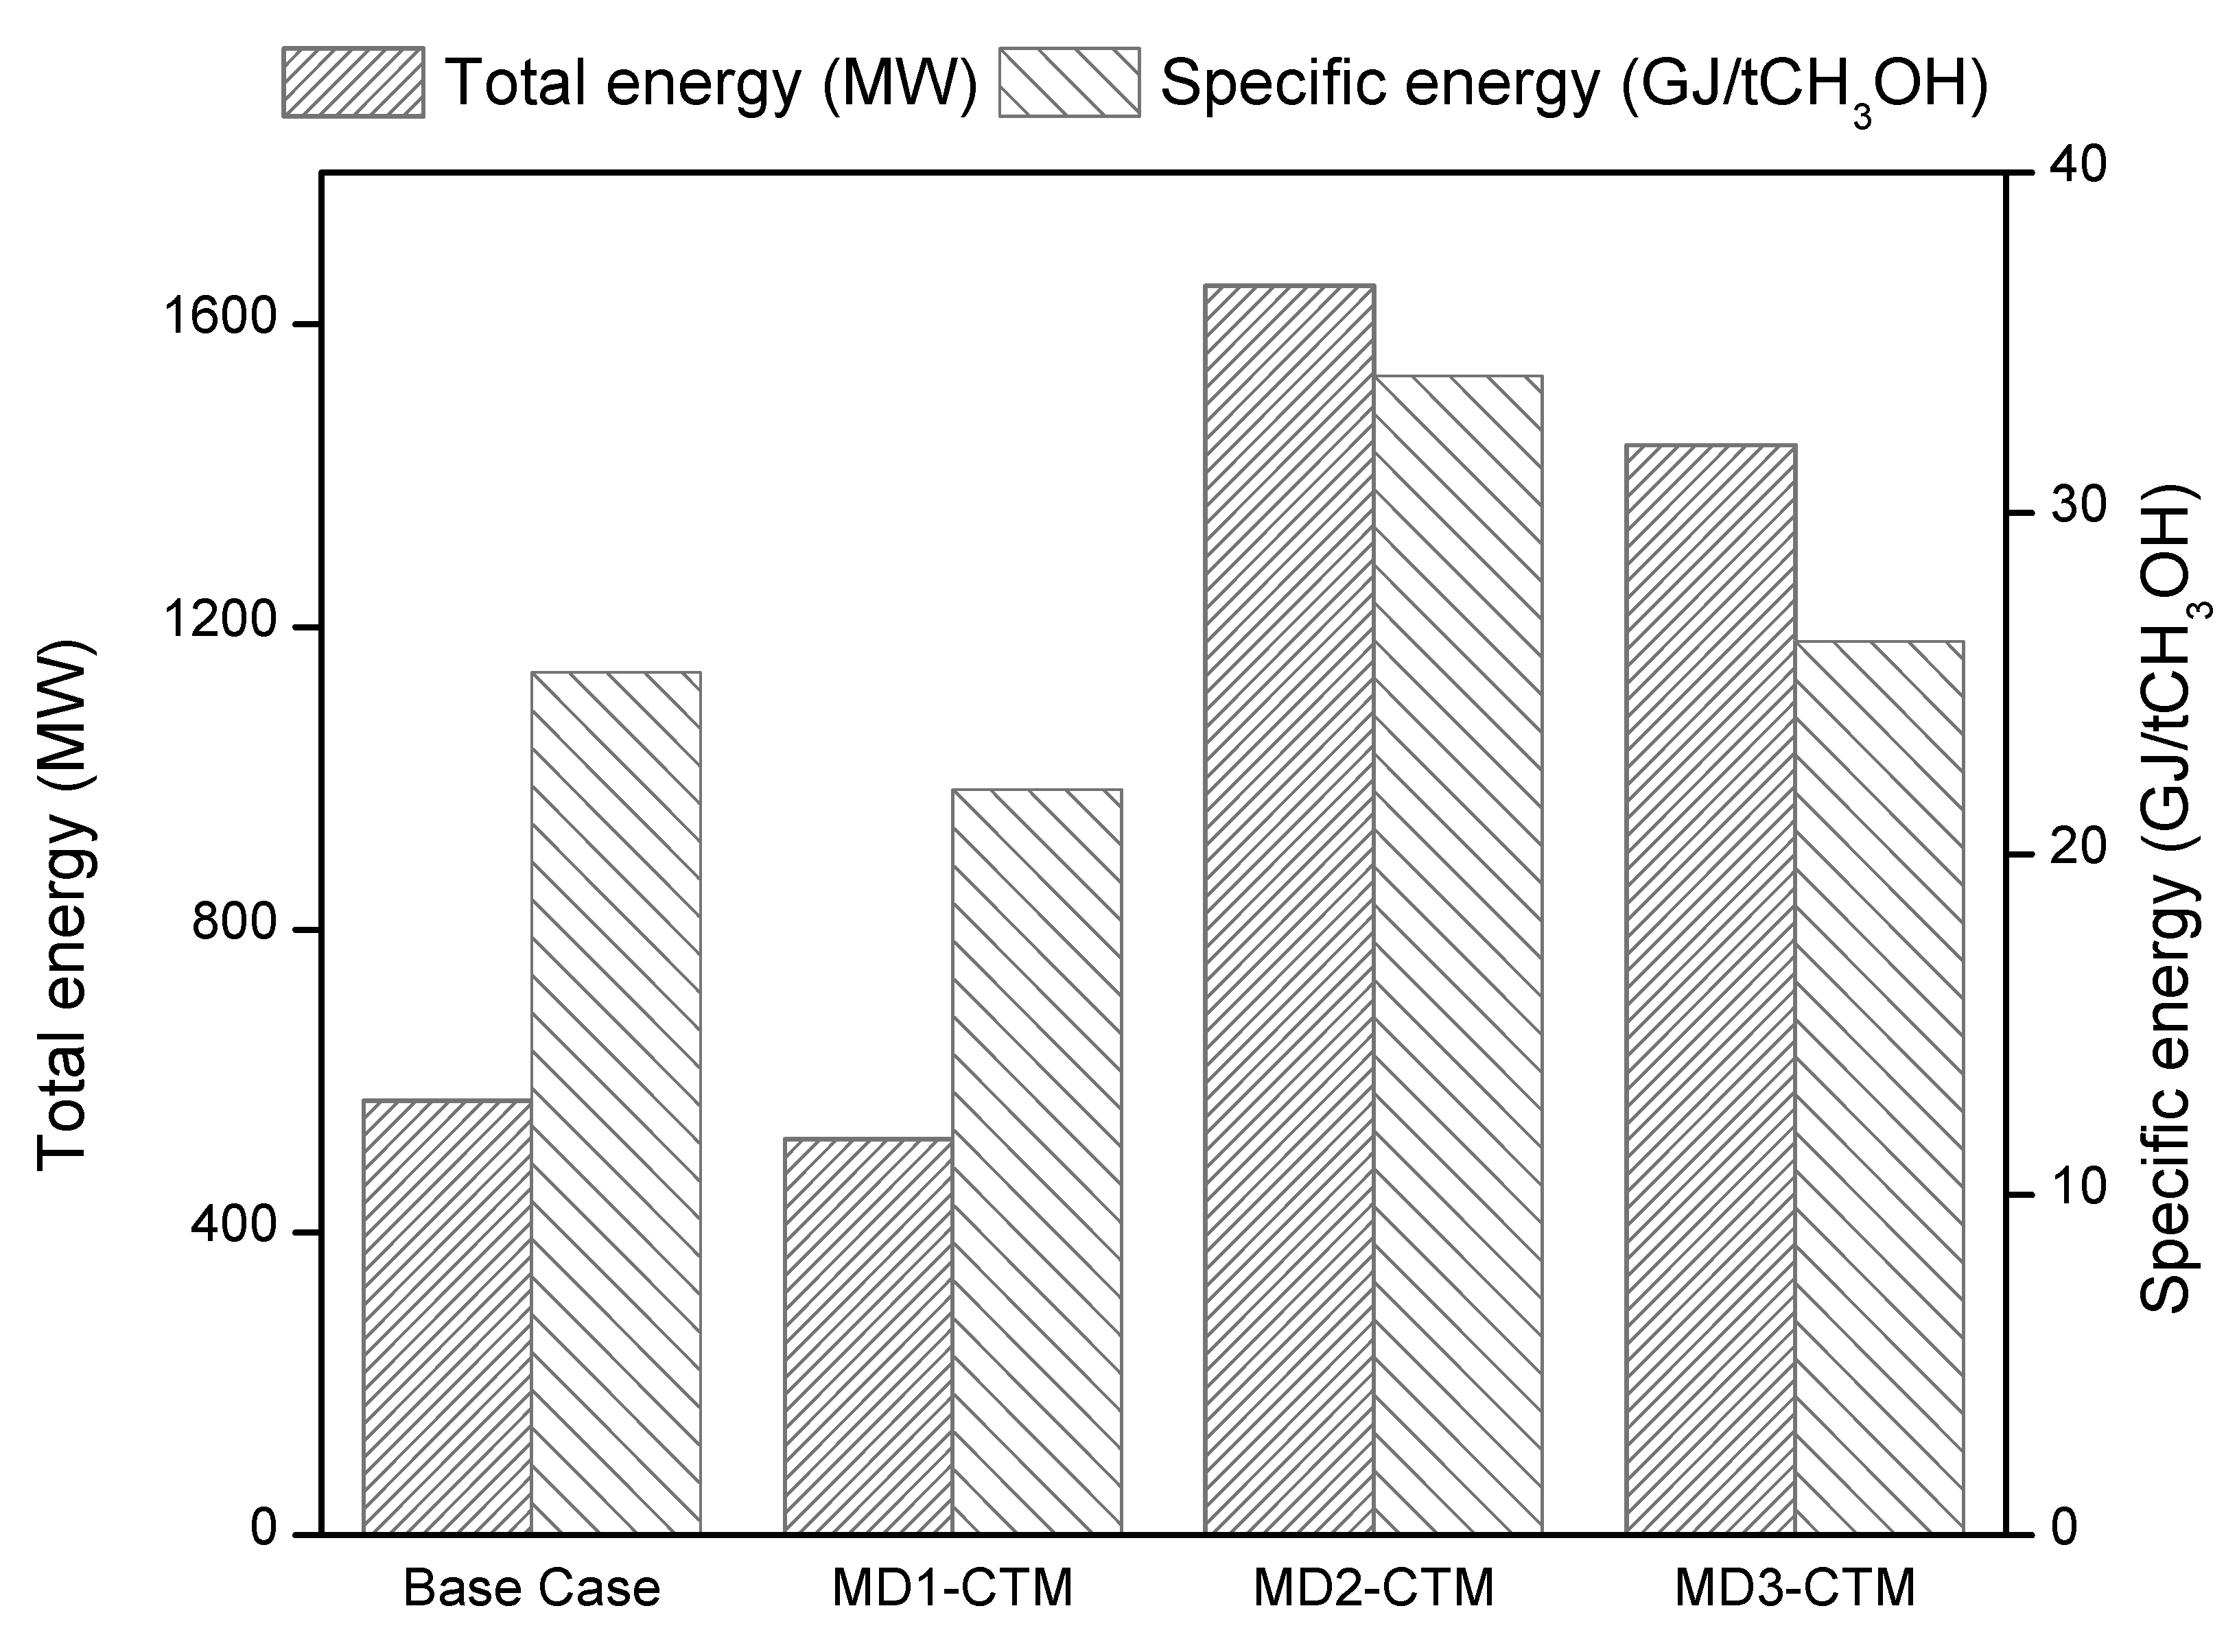
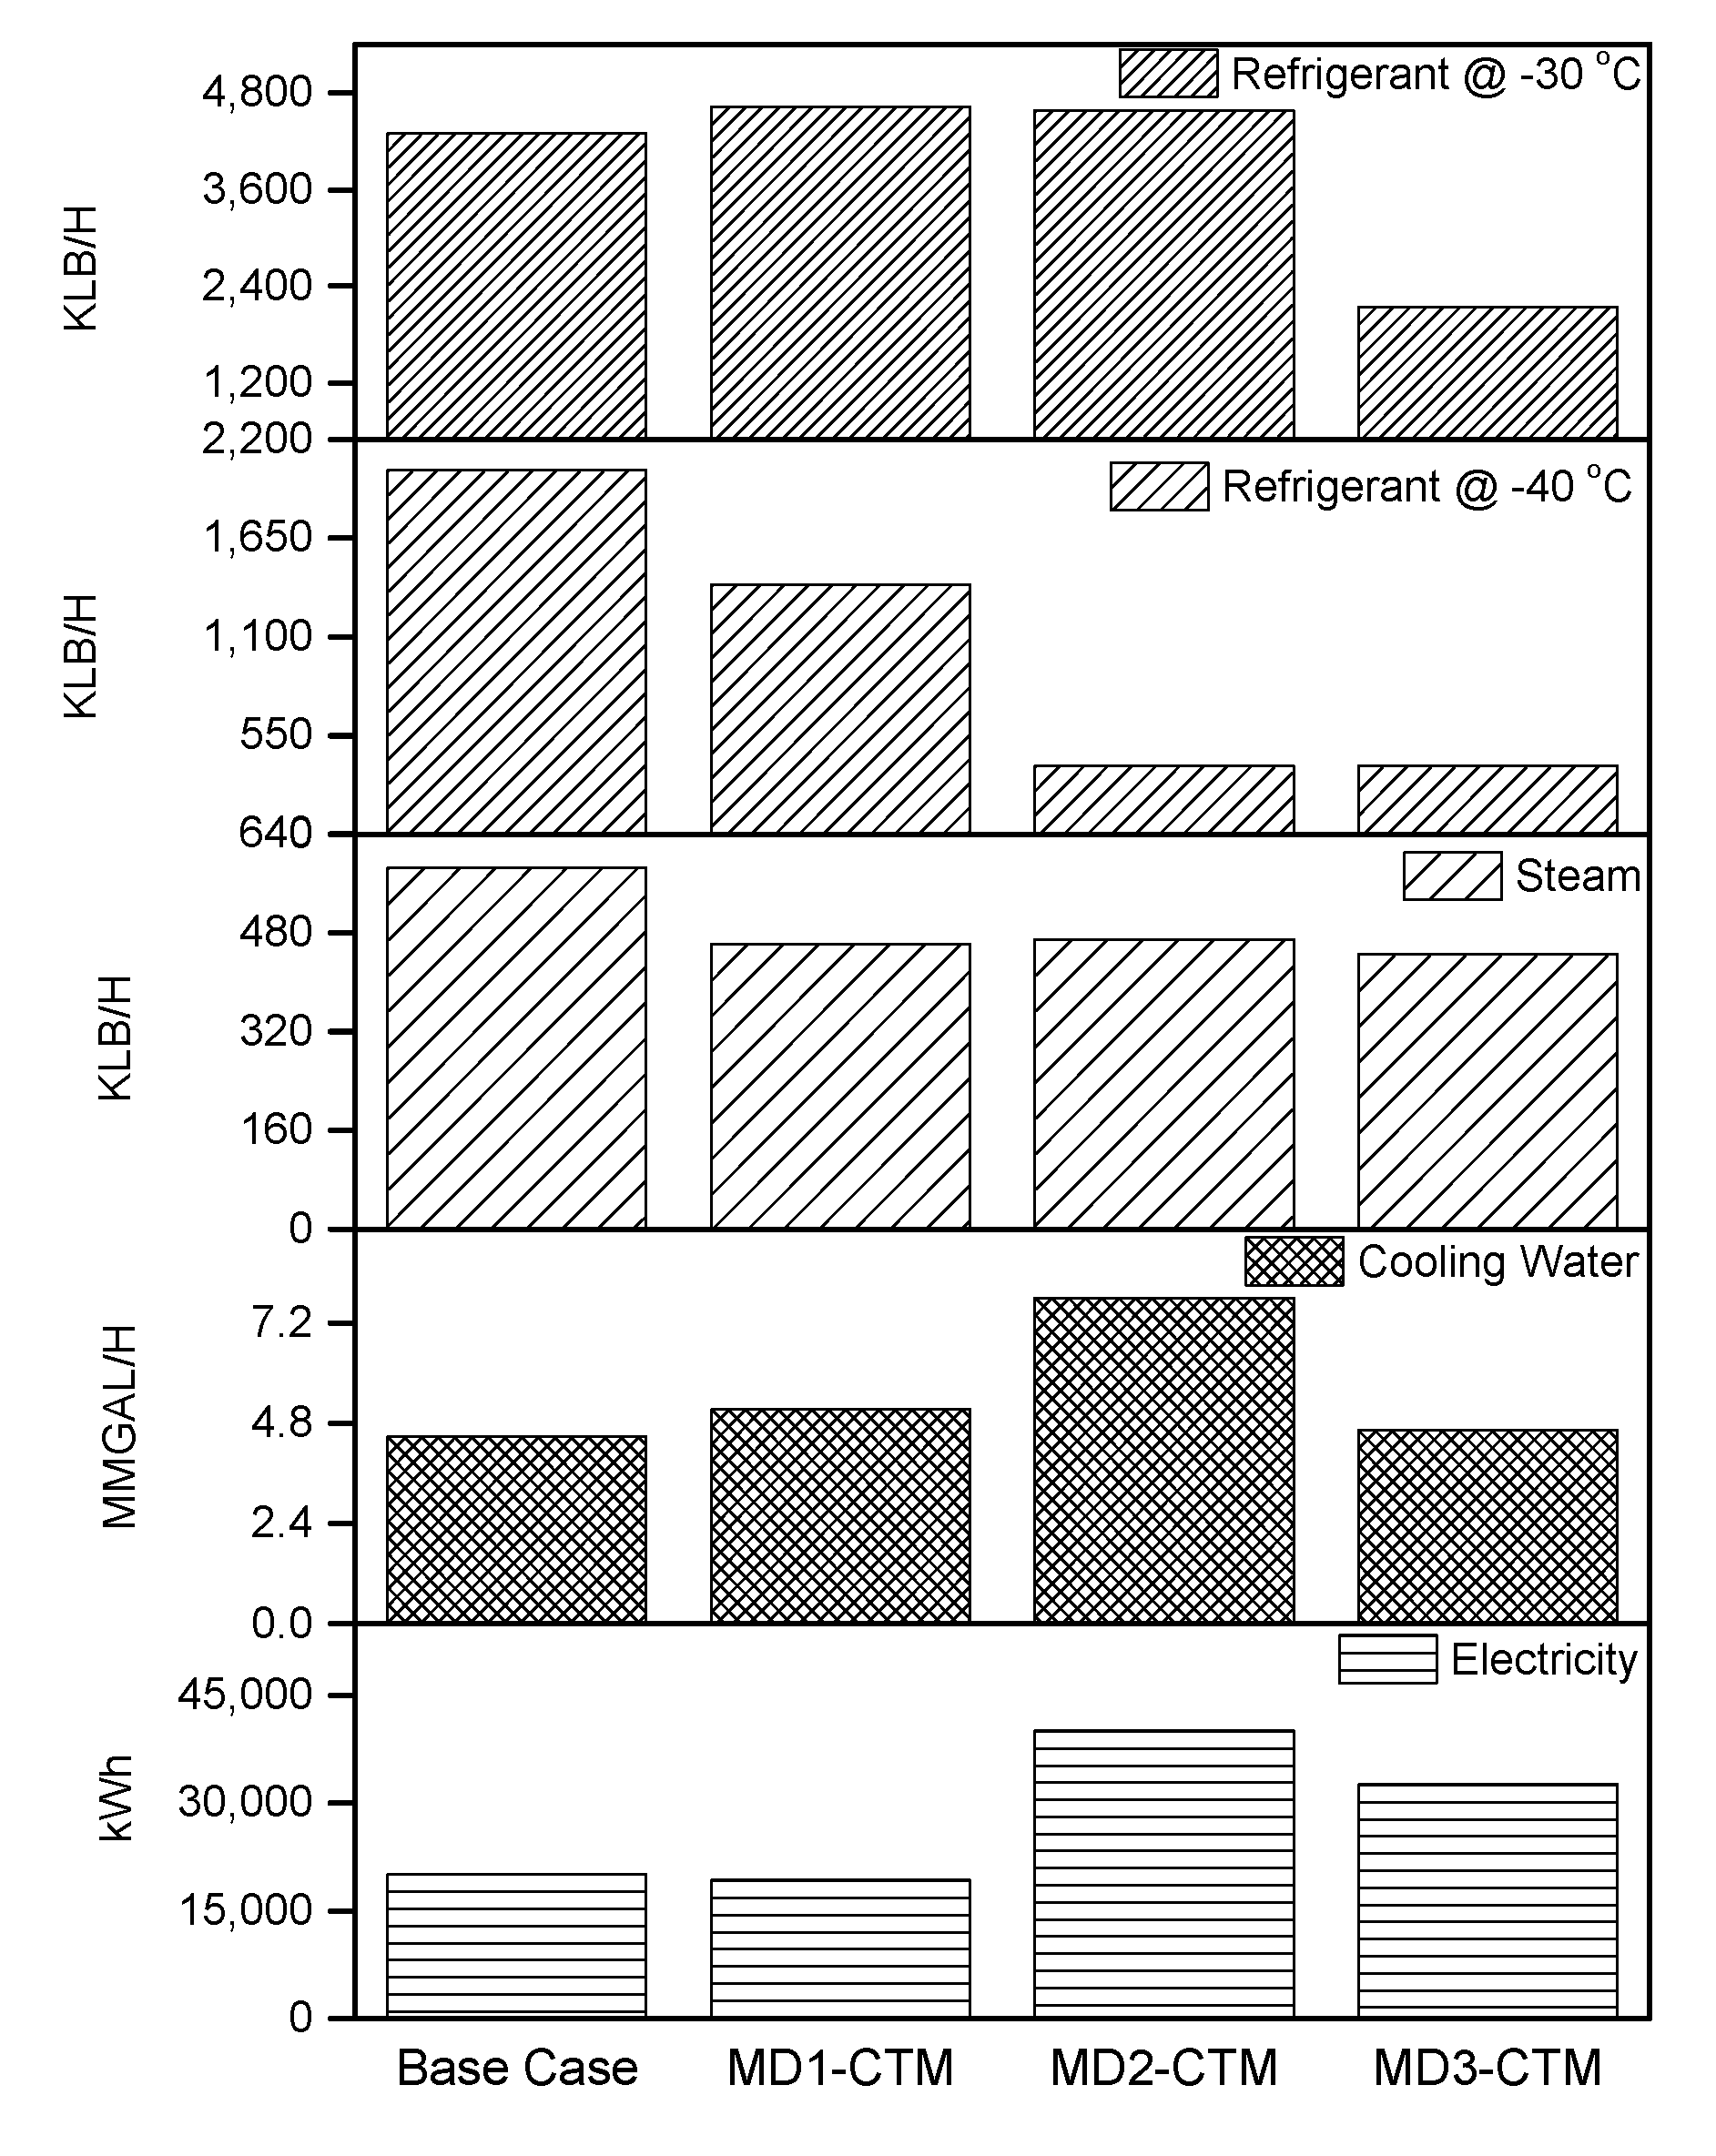
4.1. Energy Analysis

Energy efficiency is calculated for the developed designs based on the first law of thermodynamics as shown in Equation (5).
Energy   Efficiency = Energy   content   in   MeOH + Heat   &   Power Feed   heating   value   +   Energy   Consumed × 100   [ % ]
The calculated energy efficiencies for the four configurations are shown in Figure 6. The results show that base case design has the lowest efficiency among all the designs while MD3 has the highest efficiency. Feedstock heating value is same for all the cases, however, amount of methanol produced and energy requirement for each design is different. A detailed energy analysis has been performed in order to identify and improve the most energy consuming sections. Figure 7 shows the breakdown of energy requirement in terms of percent energy share for the base case and modified designs. For the base case and MD1, WGS section is the most energy consuming part of the plant contributing to 36% and 45% respectively, of the total energy requirement. The second most energy consuming section for the base case and MD1 is methanol synthesis section. Methanol synthesis is one of the energy intensive sections in the CTM process because of the severe operating conditions required in the methanol reactor. The methanol reactor operates at a high temperature and high pressure for the conversion of feed gas streams to the methanol product. In this study, the reactor effluent stream is at 270 °C and 76 bar. In order to have an efficient separation structure, the reactor effluent stream is cooled down and the pressure is reduced to near atmospheric pressure conditions. The single pass conversion of methanol reactor is low, which requires the huge recycle stream to be compressed back to the reactor pressure. Therefore, the above-mentioned reactor feed preparation and separator feed preparation steps require significant energy, with cooling being the most contributing utility in the methanol synthesis section. The energy requirement in the gas cleaning section for MD1 is almost reduced to half compared to the base case because of no CO2 capture unit. However, the consequence of this change is visible in the WGS section of MD1, where the energy requirement increased significantly, since CO2 removal unit is installed downstream of WGS reactor. Since, the coal feed rate and gasification process is same for all the cases, the energy requirement for (ASU + Gasification) for all the designs is 42.47 MW. In the case of MD2 and MD3, the energy requirement share in the cleaning section reduces significantly, since only H2S is removed from the syngas and no CO2 capture unit is installed. However, in order to maintain the stoichiometric ratio of 2 at the inlet of methanol synthesis reactor, external H2 is supplied for MD2 and MD3, which is assumed to be supplied by the electrolysis plant. The results show that, electrolyser plant contributes more than 58% and 69% of the energy requirement in the case of MD2 and MD3 respectively. An insight into the methanol synthesis section reveals that around 70% of the energy requirement is from the cooling utilities, while the heating utilities and electricity to operate compressors contribute around 20% and 10%, respectively.
Figure 8 shows the total energy requirement and energy requirement per ton of methanol produced. The results show that MD1 requires the least amount of energy per unit production of methanol, while the MD2 consumes the most energy per unit of methanol product. In the case of MD1 where CO2 capture unit is only located in the WGS section, around 9% energy savings are achieved compared to the base case design. This improvement is mainly attributed to the better resource utilization and optimizing the CO2 capture rate. The energy requirement per unit ton of methanol production reported in the literature based on the various reforming technologies range between 33.4–37.2 GJ [39]. As evident from the results, energy consumption per unit ton of methanol production for all the designs is competitive compared to the reforming technologies.

4.2. Methanol Production Rate

All the designs for the methanol production developed in this study assume an identical coal feed rate of 125.8 ton/h. Hence, the composition of raw syngas produced at the outlet of the gasifier is same for all the designs. However, due to different design configurations based on the availability and location of CO2 removal unit, WGS unit and external H2 supply, the amount of methanol production varies for all the designs. Figure 9 shows the methanol production rates for the base case, MD1, MD2 and MD3. Methanol production increases around 5% for the MD1 compared to the base case because of an optimized CO2 removal rate. On the other hand, methanol production for MD2 and MD3 increased around 2.1 and 2.4 times compared to the base case design. The significant increase in the methanol production is due to the presence of an extra amount of carbon in the methanol reactor which has not been removed in the CO2 capture unit. The results show that the single pass conversion for the base case, MD1, and MD2 is 19.6%, 22.5%, and 20.2% respectively. On the other hand, in the case of MD3 where the feed at the inlet of methanol synthesis reactor contains CO in addition to H2 and CO2, the production of methanol is positively impacted by the CO presence. Single pass conversion is calculated to be 13.5% and 57.8% for the CO2 and CO, respectively.

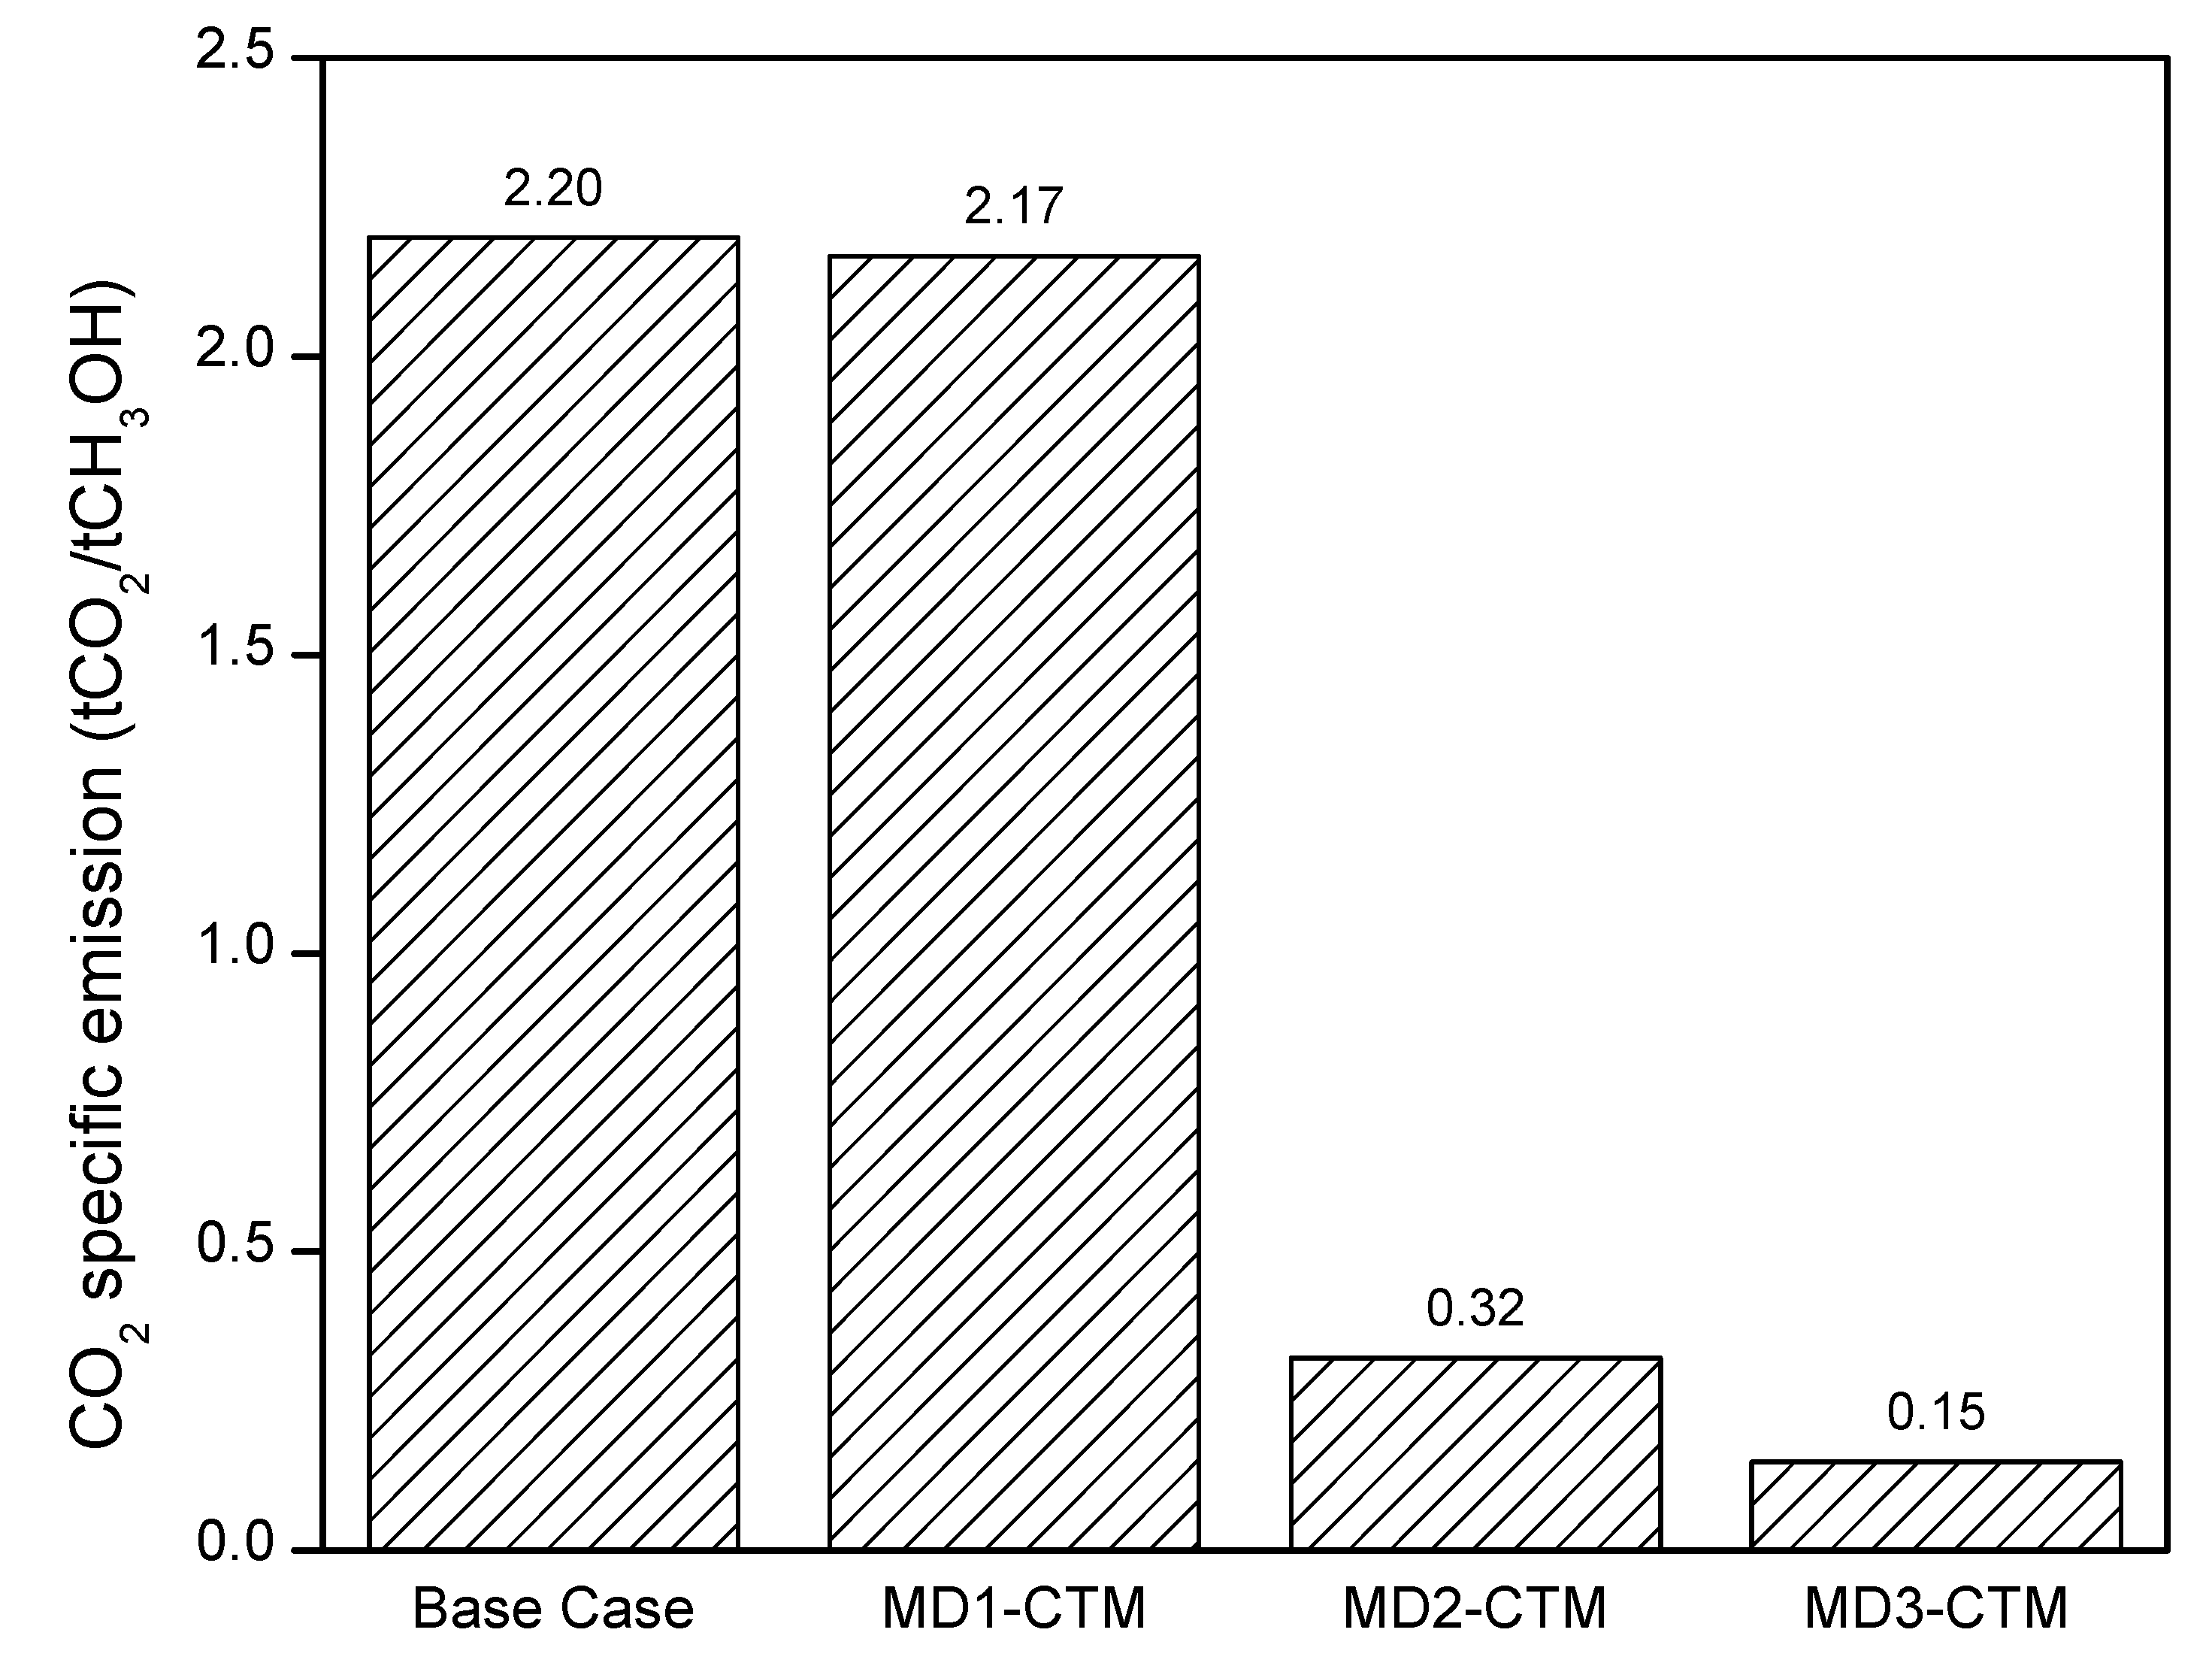
4.3. Carbon Emissions

The main aim of various designs developed in this study is to utilize the CO2 emissions produced from the CTM process. Therefore, it is pertinent to investigate the amount of CO2 emissions produced from the proposed designs. Some of the standard environmental performance indicators such as CO2 specific emissions and carbon efficiency are investigated in this section. CO2 specific emission is the defined as the amount of emitted CO2 from the process per unit of the methanol production as shown in Equation (6).
CO 2   specific   emissions = CO 2   emissions   ( kg h ) Methanol   production   ( kg h )
Figure 10 shows the CO2 specific emissions for the four cases. The results show that base case and MD1 have almost the same CO2 specific emissions, however, the CO2 specific emissions for MD2 and MD3 are approximately 85% and 93% lower compared to the base case design. The significant reduction in the CO2 specific emissions is due to the higher utilization of carbon content by the addition of external H2.
Carbon efficiency is another variable which shows the amount of carbon present in the feed to the desired product. The carbon present in the coal is mainly converted to CO2 and CO with small quantities of CH4, COS and ash. Equation (7) shows the relation for the calculation of carbon efficiency (ηC), which is defined as the ratio of carbon content in the methanol to the carbon content in all the components of the feed stream.
η C = Carbon MeOH Carbon feed   [ % ]
The results show that the carbon efficiency for the MD2 and MD3 is around 41% and 51% higher respectively compared to the base case design as shown in Figure 11. The higher carbon efficiency is directly related to the lower carbon specific emission and higher methanol production rate, as shown previously.

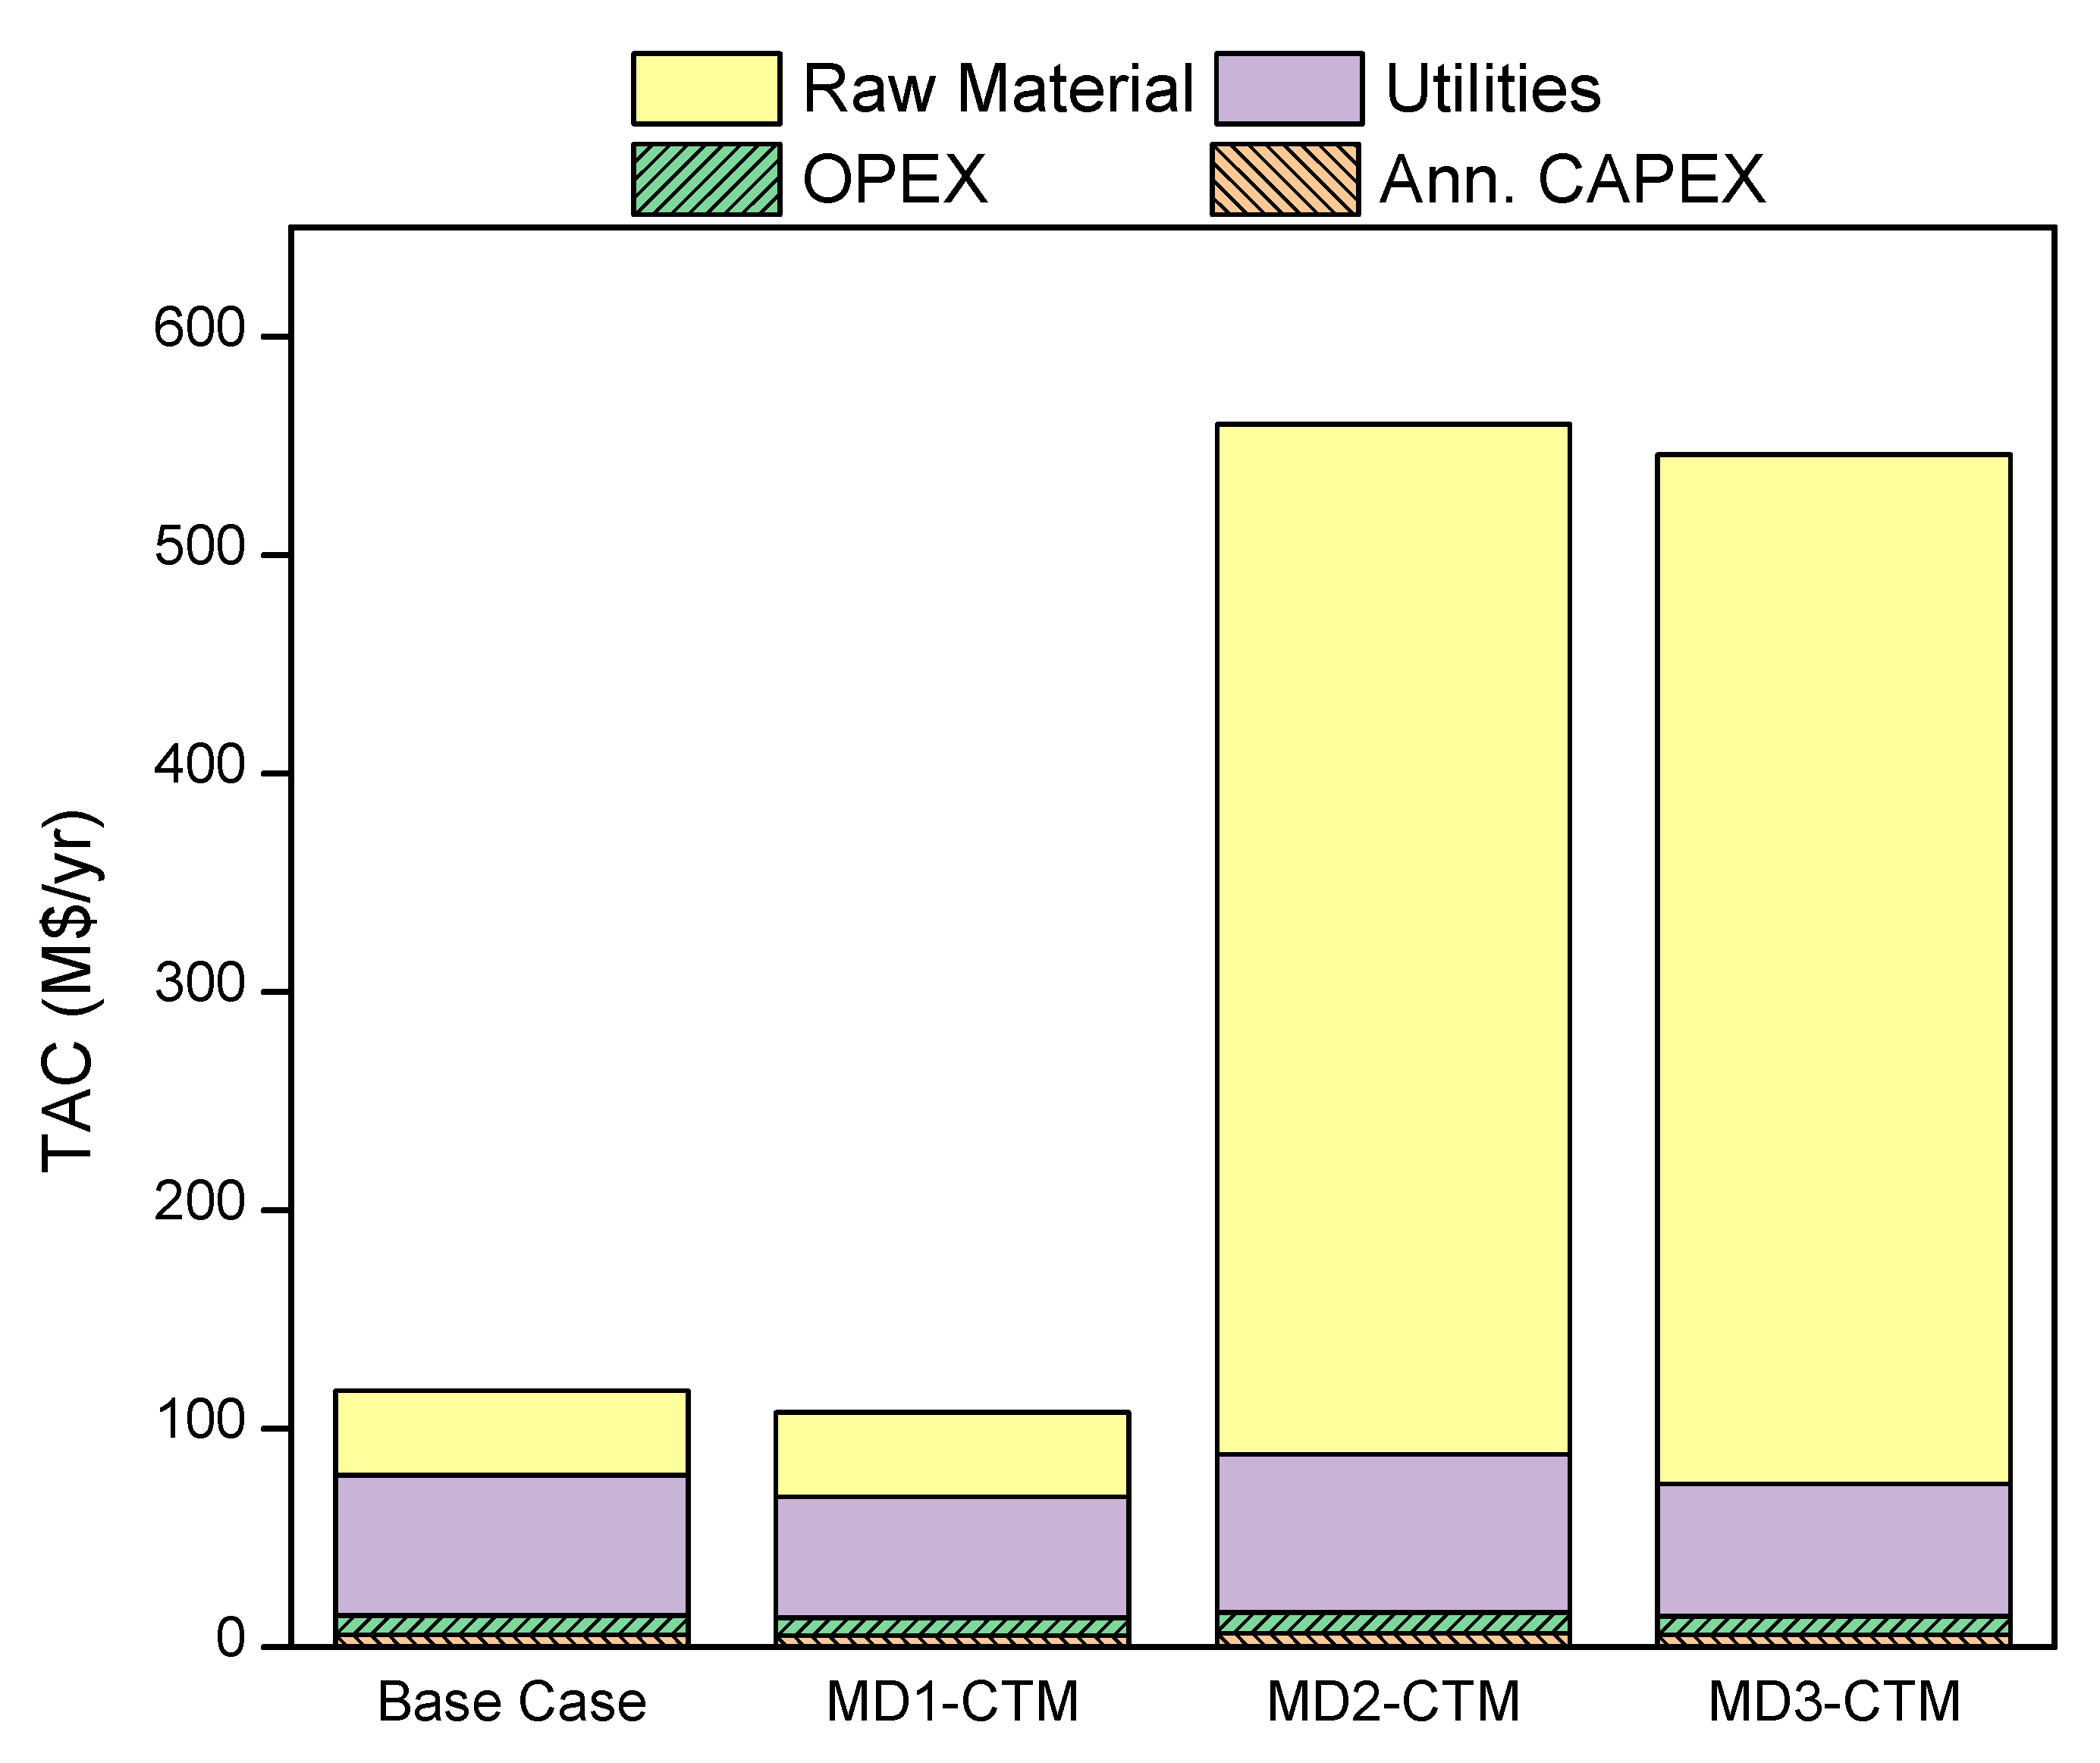
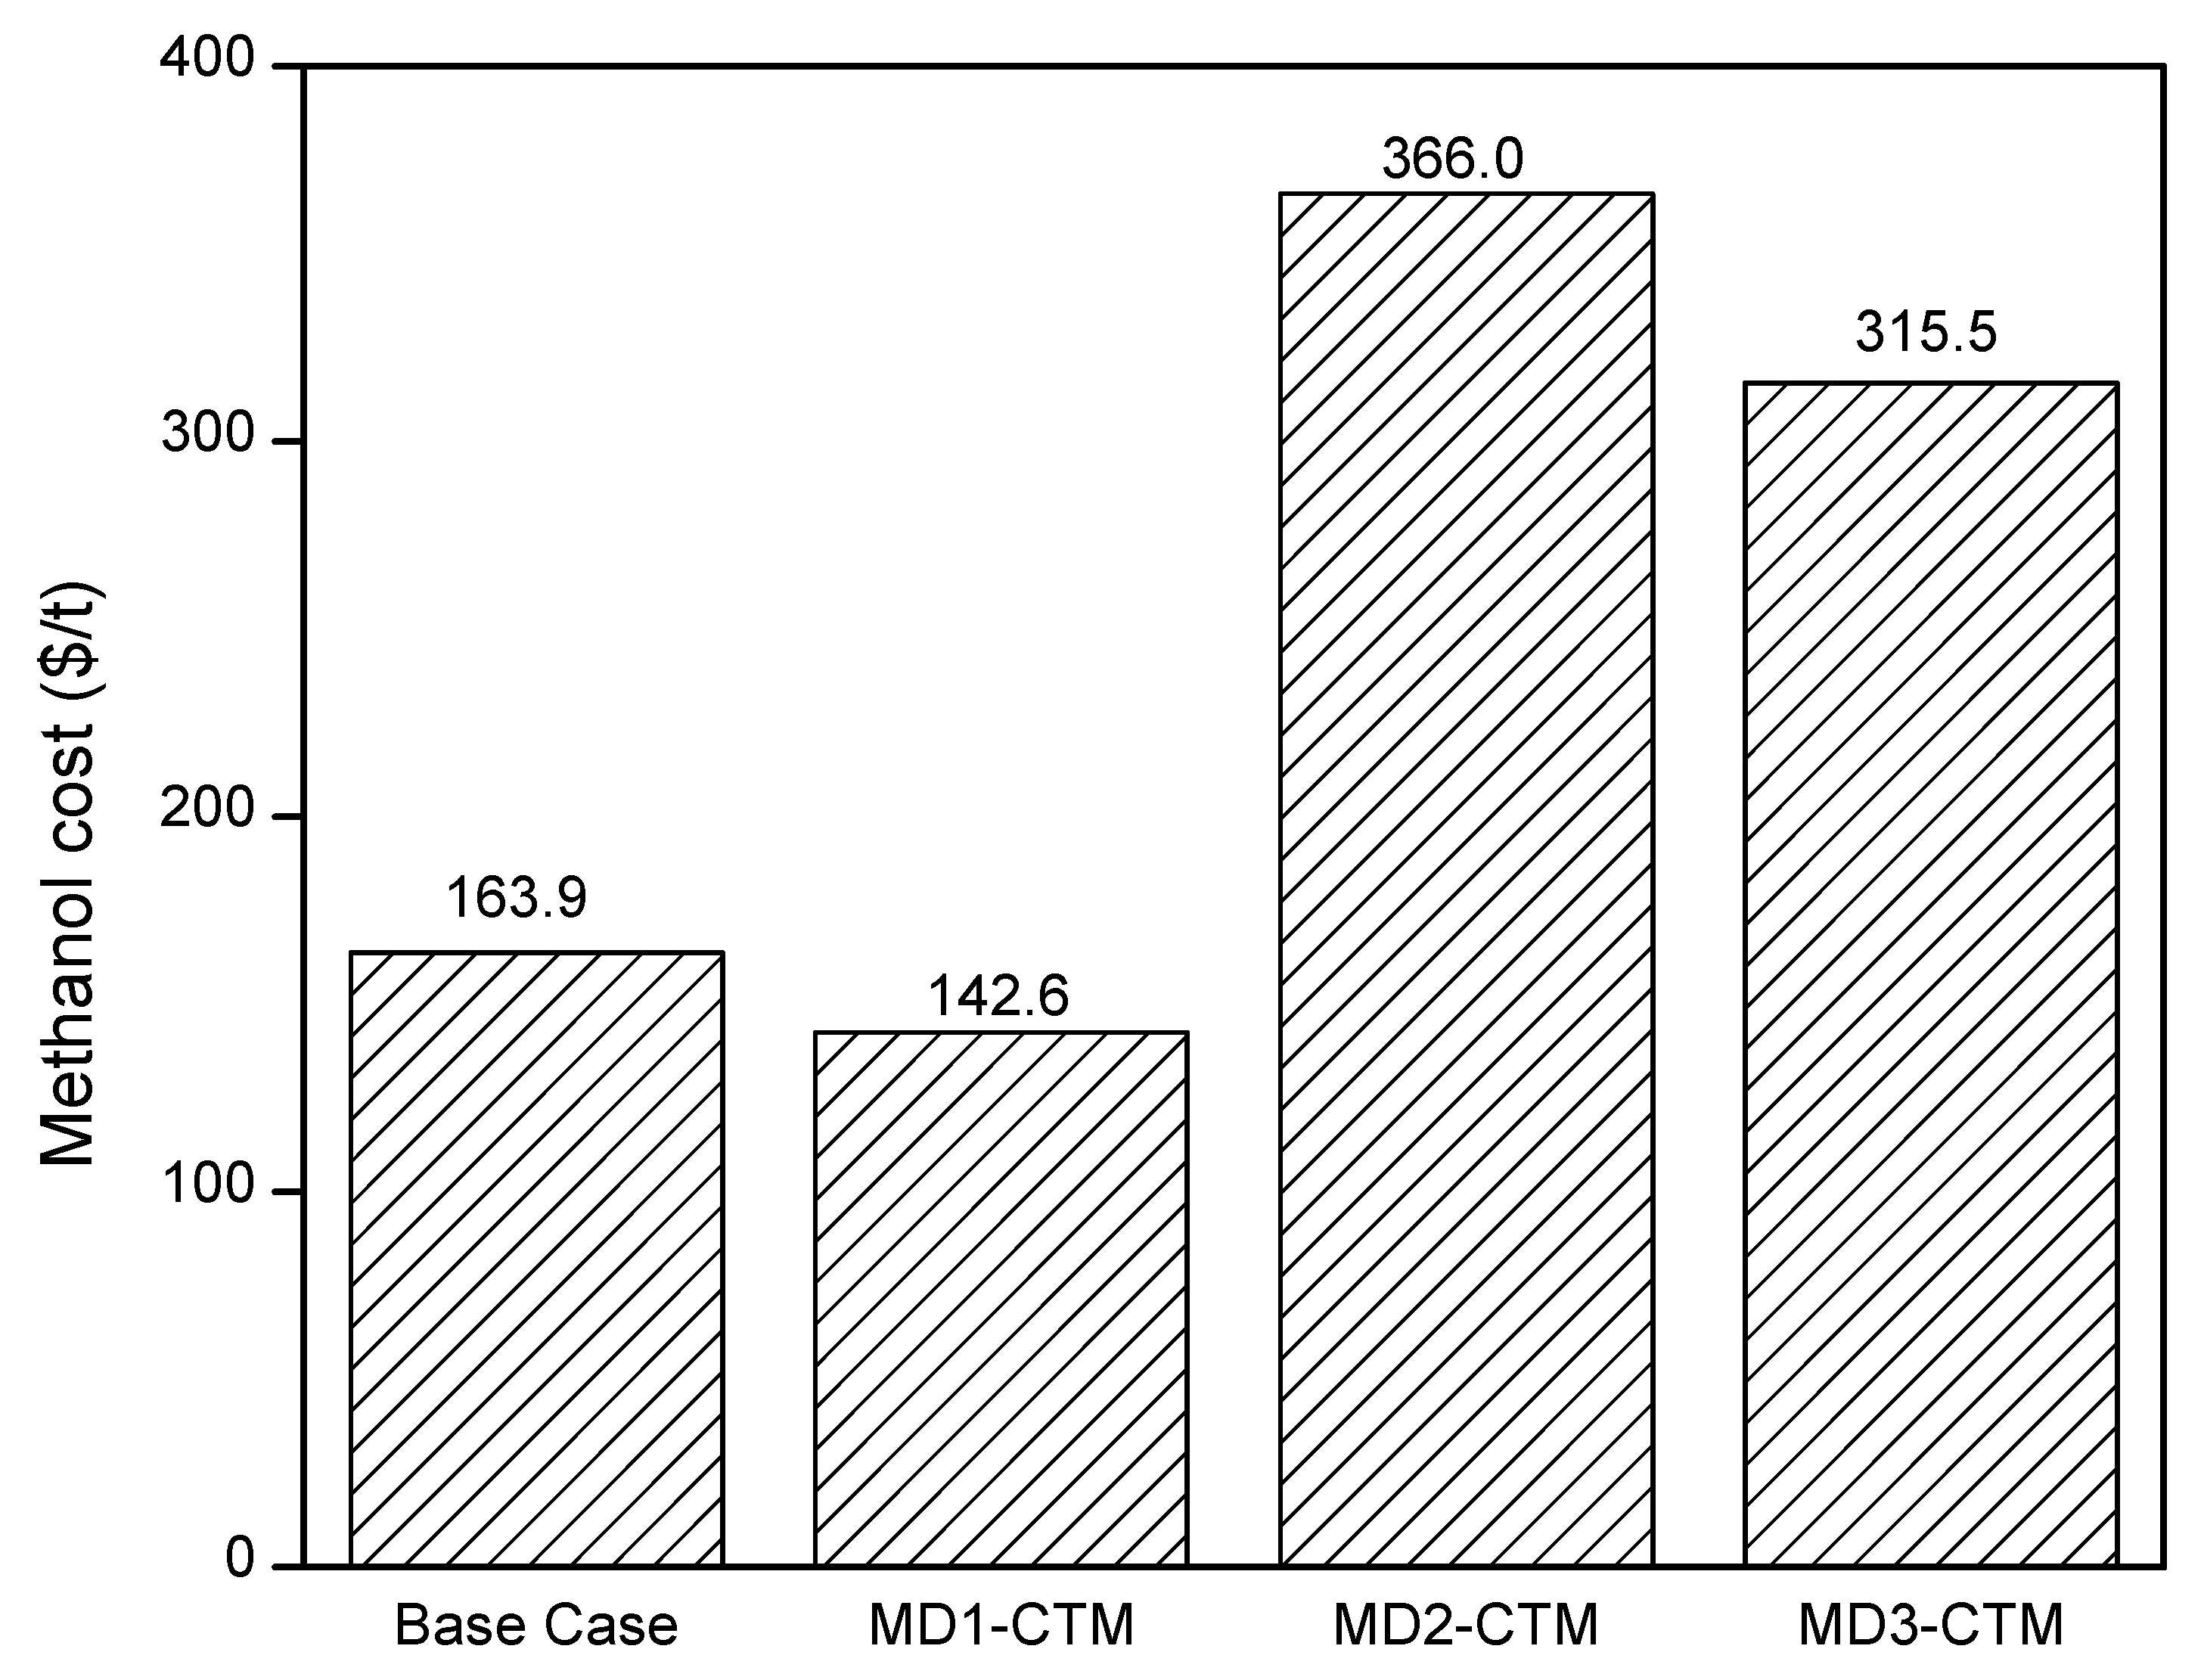
4.4. Economic Analysis

The results discussed in the previous sections clearly show that the MD2 and MD3 configurations perform considerably better compared to the base case design in terms of methanol production rate and emissions. However, these improved results are achieved at the cost of additional H2 supplied from an electrolyser plant. Therefore, an economic analysis is performed to investigate the impact of different design configurations on the product cost. Aspen Economic Analyzer V10 has been used for the purpose of economic analysis along with other literature resources. The key economic assumptions in this study are shown in Table 4 [13,40,41]. The methodology employed for the calculation of product cost is a standard procedure described in the literature [34].
Figure 12 shows the required capital expenditure (CAPEX) and annual operating cost (OPEX) for the developed cases. The results show that the CAPEX of MD1 is 4 M$ less than the base case design due to the intensification of CO2 removal unit. The CAPEX required for the MD2 is the highest among all the designs because of the larger equipment size and addition of an electrolyser plant. The results also reveal that around 9.2 M$ per year can be saved in the case of MD1 by slight modification of the base case design. Overall, MD3 has the highest CAPEX and OPEX among all the designs. Figure 13 shows the TAC breakdown in terms of annualized CAPEX and OPEX (including utilities and raw materials) for the four designs. As evident from the results, OPEX is the main cost contributor for all the cases. In the case of base case and MD1, utilities contribute to more than 50% of the TAC. However, in the case of MD2 and MD3, around 80% and 86% of the TAC respectively is contributed because of an external H2 supply. Figure 14 shows the utilities consumption rate for the four designs. The electricity consumption for MD2 and MD3 is higher compared to base case and MD1 because of increase in compression energy required for an additional H2 compression in the methanol synthesis section. Since all the four designs have different methanol production rates, therefore, in order to have fair comparison, utilities cost per unit of methanol is calculated. The results show that utility cost per unit ton of methanol product for the base case, MD1, MD2, and MD3 configurations is $89.7, $73.8, $47.4, and $34.9 respectively. The results further reveal that in order for MD3 to be competitive with the MD1, the maximum price of external H2 should be $0.71 per kg or below. Figure 15 shows the product cost per unit ton of methanol. MD1 offers the lowest methanol production cost. On the other hand, MD2 has the highest per unit cost.

4.5. Comparative Analysis with the Literature

In order to ascertain the performance of simulation models developed in this study, a qualitative comparison has been made to the other recent studies. Table 5 shows the comparative results in terms of energy efficiency, carbon efficiency, CO2 emissions, and methanol product price. The energy efficiencies of the models in this study range between 43.3% and 57.9%. Depending on the feedstock, the practical efficiencies range between 40% and 55% for the CTM process, while in the case of natural gas feed, the energy efficiency is 50–65% [42]. The results show that the energy efficiencies of the proposed CTM processes agree with the practical efficiencies. Carbon efficiency reported in the recent studies is 37–38% [43,44,45], which indicates a good match with the results of base case and MD-1 design. Moreover, MD-2 and MD-3 alternative designs have shown that the carbon efficiency can be increased to 77.6% and 87.6% respectively by utilizing more CO2 for the methanol production. As stated earlier that the goal of this study is to propose a CTM design with minimal CO2 emissions. Literature has widely reported CO2 emissions of about 2.6 t/t-CH3OH for the CTM process [46]. The results show that the calculated CO2 emissions for the base case and MD-1 are relatively lower compared to the recent works. In addition, the MD-2 and MD-3 designs have the potential to significantly reduce the CO2 emissions to 0.32 t and 0.15 t respectively per ton of methanol production. The comparison of methanol cost with the recent works show that the per unit ton product cost for the base case and MD-1 design is lower, leading to the higher profit margins.

5. Conclusions and Recommendations

CTM is a commercial process emitting large amount of emissions. The goal is to reduce the carbon emissions while utilizing the existing fossil fuels without adding significant process complexities. In this study, three CTM process designs are proposed and compared with the base case design employing process intensification techniques while utilizing the CO2 emissions produced from the coal gasification process. The major findings are summarized here:
  • CTM production with CCUS is technically and economically feasible process. The MD1-CTM offers the best results with an energy requirement of 21.9 GJ/tCH3OH and a product cost of 142.5 $/tCH3OH.
  • CTM process is complex process with many energy intensive equipment including gasification section, gas cleaning section, WGS section and methanol synthesis section. However, the process development based on intensification concepts can simplify the process, leading to significant CAPEX and OPEX savings.
  • CO2 emissions from the CTM process can be curtailed up to a certain limit. In order to further minimize the CO2 emissions from the process, H2 supply from an external source is required. In the case of CTM process integration with an electrolysis plant for the supply of clean H2, the overall economics are not feasible.
  • The proposed MD2 and MD3 configurations have 8.6% and 14.6% higher process efficiency respectively compared to the base case design. However, the economics of these designs are not feasible. In particular, MD3 can become economically attractive if, (a) the carbon tax is implemented due to its low emission benefits; (b) technological advancement in the electrolysis process are made for the supply of clean and cheap H2.
Despite the advancements made in CTM plants focusing on CO2 utilization, the single pass conversion of the methanol synthesis reactor is still low, requiring efforts to develop new catalyst materials and improved reactor configurations. As shown in this study for the case of MD-2 and MD-3, design intensification is technically feasible but would require a cheap source of H2 supply for higher CO2 utilization and methanol production. Therefore, further investigation is needed to study the feasibility of design integration between the renewable H2 units and conventional methanol plants. Currently, acid gas cleaning technologies offer a wide range of options for the efficient removal of H2S and CO2. There is a further need to assess gas cleaning options, including various physical and chemical solvents, ionic liquids, membranes, adsorption, and other methods that may perform better in the CTM processes. Economies of scale can affect the project’s profitability. Therefore, additional case studies are required to explore the impact of methanol production capacities on the process economics.

Author Contributions

Conceptualization, U.Z.; Data curation, S.S.K.; Formal Analysis, S.S.K., U.Z., A.G.A.J., U.A. and F.S.A.; Funding acquisition, C.-J.L.; Investigation, S.S.K., A.G.A.J. and U.A.; Methodology, S.S.K. and U.A.; Software, S.S.K. and U.Z.; Supervision, U.Z. and C.-J.L.; Validation, S.S.K. and C.-J.L.; Visualization, A.G.A.J. and F.S.A.; Writing—original draft, S.S.K., U.Z. and C.-J.L.; Writing—review & editing, S.S.K., U.Z., A.G.A.J., U.A., F.S.A. and C.-J.L. All authors have read and agreed to the published version of the manuscript.

Funding

This research was supported by the Chung-Ang University Research Grants in 2018.

Conflicts of Interest

The authors declare no conflict of interest.

Nomenclature

ASUAir separation unit
CAGRCompound annual growth rate
CAPEXCapital expenditure
CCUSCarbon capture, utilization and storage
DMRDry methane reforming
EOSEquation of state
GHGGreenhouse gas
IGCCIntegrated gasification combined cycle
IPCCIntergovernmental panel on climate change
IRRInternal rate of return
LNGLiquefied natural gas
MD1Modified Design 1
MD2Modified Design 2
MD3Modified Design 3
MOFsMetal-organic frameworks
MTOMethanol to olefins
NETLNational energy technology laboratory
OPEXOperating expense
PR-BMPeng-Robinson with Boston Mathias
SNStoichiometric number
SRUSulfur recovery unit
TACTotal annual cost
TCITotal capital investment
WGSWater gas shift

References

  1. Hulme, M. Is it too late (to stop dangerous climate change)? An editorial. Wiley Interdiscip. Rev. Clim. Chang. 2020, 11, e619. [Google Scholar] [CrossRef] [Green Version]
  2. Helgason, R.; Cook, D.; Davíðsdóttir, B. An evaluation of the cost-competitiveness of maritime fuels—A comparison of heavy fuel oil and methanol (renewable and natural gas) in Iceland. Sustain. Prod. Consum. 2020, 23, 236–248. [Google Scholar] [CrossRef]
  3. Bazooyar, B.; Ghorbani, A.; Shariati, A. Combustion performance and emissions of petrodiesel and biodiesels based on various vegetable oils in a semi industrial boiler. Fuel 2011, 90, 3078–3092. [Google Scholar] [CrossRef]
  4. Turaga, U. Small-scale methanol technologies offer flexibility, cost effectiveness. Gas Process. News 2017. Available online: http://www.gasprocessingnews.com/features/201510/small-scale-methanol-technologies-offer-flexibility,-cost-effectiveness.aspx (accessed on 13 November 2020).
  5. IHS Markit. Chemical World Analysis Long-Term Chemical Market Trends; IHS Markit: London, UK, 2019. [Google Scholar]
  6. Unnasch, S.; Lawrence, M.; Pont, J. Kalama Manufacturing and Marine Export Facility Supplemental GHG Analysis; Life Cycle Associates Report: Washington, DC, USA, 2018. [Google Scholar]
  7. Nguyen, T.B.H.; Zondervan, E. Methanol production from captured CO2 using hydrogenation and reforming technologies-environmental and economic evaluation. J. CO2 Util. 2019, 34, 1–11. [Google Scholar] [CrossRef]
  8. Leonzio, G.; Zondervan, E.; Foscolo, P.U. Methanol production by CO2 hydrogenation: Analysis and simulation of reactor performance. Int. J. Hydrogen Energy 2019, 44, 7915–7933. [Google Scholar] [CrossRef]
  9. Tamnitra, R.; Jitwung, R.; Puangpetch, T.; Patthaveekongka, W.; Leeheng, K. Kinetic modeling and simulation of bio-methanol process from biogas by using aspen plus. MATEC Web Conf. 2018, 192, 4–7. [Google Scholar] [CrossRef]
  10. Šetinc, M.; Levec, J. On the kinetics of liquid-phase methanol synthesis over commercial Cu/ZnO/Al2O3 catalyst. Chem. Eng. Sci. 1999, 54, 3577–3586. [Google Scholar] [CrossRef]
  11. Lee, H.W.; Kim, K.; An, J.; Na, J.; Kim, H.; Lee, H.; Lee, U. Toward the practical application of direct CO2 hydrogenation technology for methanol production. Int. J. Energy Res. 2020. [Google Scholar] [CrossRef]
  12. Xiang, D.; Li, P.; Yuan, X. System optimization and performance evaluation of shale gas chemical looping reforming process for efficient and clean production of methanol and hydrogen. Energy Convers. Manag. 2020, 220, 113099. [Google Scholar] [CrossRef]
  13. Kim, S.; Kim, M.; Kim, Y.T.; Kwak, G.; Kim, J. Techno-economic evaluation of the integrated polygeneration system of methanol, power and heat production from coke oven gas. Energy Convers. Manag. 2019, 182, 240–250. [Google Scholar] [CrossRef]
  14. Ahmed, U. Techno-economic feasibility of methanol synthesis using dual fuel system in a parallel process design configuration with control on green house gas emissions. Int. J. Hydrogen Energy 2020, 45, 6278–6290. [Google Scholar] [CrossRef]
  15. Agarwal, R.A. Methanol Hydrogenation Synthesis Using from Metal–Organic CO2 Frameworks. CO2 Sep. Purif. Convers. Chem. Fuels 2018, 79. [Google Scholar] [CrossRef]
  16. Ting, K.W.; Toyao, T.; Siddiki, S.M.A.H.; Shimizu, K. Low-temperature hydrogenation of CO2 to methanol over heterogeneous TiO2-Supported Re catalysts. ACS Catal. 2019, 9, 3685–3693. [Google Scholar] [CrossRef]
  17. Li, S.; Guo, L.; Ishihara, T. Hydrogenation of CO2 to methanol over Cu/AlCeO catalyst. Catal. Today 2020, 339, 352–361. [Google Scholar] [CrossRef]
  18. Van-Dal, É.S.; Bouallou, C. Design and simulation of a methanol production plant from CO2 hydrogenation. J. Clean. Prod. 2013, 57, 38–45. [Google Scholar] [CrossRef]
  19. Asif, M.; Gao, X.; Lv, H.; Xi, X.; Dong, P. Catalytic hydrogenation of CO2 from 600 MW supercritical coal power plant to produce methanol: A techno-economic analysis. Int. J. Hydrogen Energy 2018, 43, 2726–2741. [Google Scholar] [CrossRef]
  20. Charoensuppanimit, P.; Kitsahawong, K.; Kim-Lohsoontorn, P.; Assabumrungrat, S. Incorporation of hydrogen by-product from NaOCH3 production for methanol synthesis via CO2 hydrogenation: Process analysis and economic evaluation. J. Clean. Prod. 2019, 212, 893–909. [Google Scholar] [CrossRef]
  21. Kiss, A.A.; Pragt, J.J.; Vos, H.J.; Bargeman, G.; de Groot, M.T. Novel efficient process for methanol synthesis by CO2 hydrogenation. Chem. Eng. J. 2016, 284, 260–269. [Google Scholar] [CrossRef] [Green Version]
  22. Luu, M.T.; Milani, D.; Bahadori, A.; Abbas, A. A comparative study of CO2utilization in methanol synthesis with various syngas production technologies. J. CO2 Util. 2015, 12, 62–76. [Google Scholar] [CrossRef]
  23. Puig-Gamero, M.; Argudo-Santamaria, J.; Valverde, J.L.; Sánchez, P.; Sanchez-Silva, L. Three integrated process simulation using aspen plus®: Pine gasification, syngas cleaning and methanol synthesis. Energy Convers. Manag. 2018, 177, 416–427. [Google Scholar] [CrossRef]
  24. Liu, Z. Economic analysis of methanol production from coal/biomass upgrading. Energy Sources Part B Econ. Plan. Policy 2018, 13, 66–71. [Google Scholar] [CrossRef]
  25. Herdem, M.S.; Mazzeo, D.; Matera, N.; Wen, J.Z.; Nathwani, J.; Hong, Z. Simulation and modeling of a combined biomass gasification-solar photovoltaic hydrogen production system for methanol synthesis via carbon dioxide hydrogenation. Energy Convers. Manag. 2020, 219, 113045. [Google Scholar] [CrossRef]
  26. Rivarolo, M.; Bellotti, D.; Magistri, L.; Massardo, A.F. Feasibility study of methanol production from different renewable sources and thermo-economic analysis. Int. J. Hydrogen Energy 2016, 41, 2105–2116. [Google Scholar] [CrossRef]
  27. Wang, X.; Demirel, Y. Feasibility of Power and Methanol Production by an Entrained-Flow Coal Gasification System. Energy Fuels 2018, 32, 7595–7610. [Google Scholar] [CrossRef]
  28. Ye, C.; Wang, Q.; Zheng, Y.; Li, G.; Zhang, Z.; Luo, Z. Techno-economic analysis of methanol and electricity poly-generation system based on coal partial gasification. Energy 2019, 185, 624–632. [Google Scholar] [CrossRef]
  29. Kler, A.M.; Tyurina, E.A.; Mednikov, A.S. A plant for methanol and electricity production: Technical-economic analysis. Energy 2018, 165, 890–899. [Google Scholar] [CrossRef]
  30. Gu, Y. Kokossis Modeling and Analysis of Coal-Based Lurgi Gasification for LNG and Methanol Coproduction Process. Processes 2019, 7, 688. [Google Scholar] [CrossRef] [Green Version]
  31. McDonell, V. Key combustion issues associated with syngas and high-hydrogen fuels. In The Gas Turbine Handbook; Gulf Professional Publishing: Oxford, UK, 2006. [Google Scholar]
  32. Mondal, P.; Dang, G.S.; Garg, M.O. Syngas production through gasification and cleanup for downstream applications—Recent developments. Fuel Process. Technol. 2011, 92, 1395–1410. [Google Scholar] [CrossRef]
  33. Summers, W. Baseline Analysis of Crude Methanol Production from Coal and Natural Gas. Natl. Energy Technol. Lab. 2014. [Google Scholar] [CrossRef]
  34. Aspen Technology, Inc. Aspen Physical Property System-Physical Property Methods; Aspen Technology, Inc.: Burlington, MA, USA, 2013. [Google Scholar]
  35. Vanden Bussche, K.M.; Froment, G.F. A steady-state kinetic model for methanol synthesis and the water gas shift reaction on a commercial Cu/ZnO/Al2O3 catalyst. J. Catal. 1996, 161, 1–10. [Google Scholar] [CrossRef]
  36. Bozzano, G.; Manenti, F. Efficient methanol synthesis: Perspectives, technologies and optimization strategies. Prog. Energy Combust. Sci. 2016, 56, 71–105. [Google Scholar] [CrossRef]
  37. Samimi, F.; Rahimpour, M.R.; Shariati, A. Development of an efficient methanol production process for direct CO2 hydrogenation over a Cu/Zno/Al2O3 catalyst. Catalysts 2017, 7, 332. [Google Scholar] [CrossRef] [Green Version]
  38. Santos, D.M.F.; Sequeira, C.A.C.; Figueiredo, J.L. Hydrogen production by alkaline water electrolysis. Quim. Nova 2013, 36, 1176–1193. [Google Scholar] [CrossRef]
  39. M. Pérez-Fortes, E.T. Techno-Economic and Environmental Evaluation of CO2 Utilisation for Fuel Production. Synthesis of Methanol and Formic Acid; JRC Science Hub: ZG Petten, The Netherlands, 2016; ISBN 9789279591334. [Google Scholar]
  40. Calise, F.; D’Accadia, M.D.; Santarelli, M.; Lanzini, A.; Ferrero, D. Solar Hydrogen Production: Processes, Systems and Technologies; Academic Press: Cambridge, MA, USA, 2019; ISBN 0128148543. [Google Scholar]
  41. Turton, R.; Bailie, R.C.; Whiting, W.B.; Shaeiwitz, J.A.; Bhattacharyya, D. Analysis, Synthesis and Design of Chemical Processes, 4th ed.; Turton, R., Ed.; Pearson Education: London, UK, 2008. [Google Scholar]
  42. Reed, T.B. Efficiencies of methanol production from gas, coal, waste or wood. Am. Chem. Soc. Div. Fuel Chem. Prepr. 1976, 21, 2–21. [Google Scholar]
  43. Chen, J.; Yang, S.; Qian, Y. A novel path for carbon-rich resource utilization with lower emission and higher efficiency: An integrated process of coal gasification and coking to methanol production. Energy 2019, 177, 304–318. [Google Scholar] [CrossRef]
  44. Xiang, D.; Li, P.; Yuan, X.; Cui, P.; Huang, W. Highly efficient carbon utilization of coal-to-methanol process integrated with chemical looping hydrogen and air separation technology: Process modeling and parameter optimization. J. Clean. Prod. 2020, 258, 120910. [Google Scholar] [CrossRef]
  45. Zhang, D.; Duan, R.; Li, H.; Yang, Q.; Zhou, H. Optimal design, thermodynamic, cost and CO2 emission analyses of coal-to-methanol process integrated with chemical looping air separation and hydrogen technology. Energy 2020, 203, 117876. [Google Scholar] [CrossRef]
  46. Yi, Q.; Li, W.; Feng, J.; Xie, K. Carbon cycle in advanced coal chemical engineering. Chem. Soc. Rev. 2015, 44, 5409–5445. [Google Scholar] [CrossRef]
  47. Qin, Z.; Zhai, G.; Wu, X.; Yu, Y.; Zhang, Z. Carbon footprint evaluation of coal-to-methanol chain with the hierarchical attribution management and life cycle assessment. Energy Convers. Manag. 2016, 124, 168–179. [Google Scholar] [CrossRef]
Figure 1. Simplified block flow diagram of the natural gas reforming process for the methanol production.
Energies 13 06421 g001
Figure 2. Block flow diagram for the base case CTM process.
Energies 13 06421 g002
Figure 3. Block flow diagram for the modified design-1 (MD1-CTM) process.
Energies 13 06421 g003
Figure 4. Block flow diagram for the modified design-2 (MD2-CTM) process.
Energies 13 06421 g004
Figure 5. Block flow diagram for the modified design-3 (MD3-CTM) process.
Energies 13 06421 g005
Figure 6. Energy efficiencies based on the first law of thermodynamics.
Energies 13 06421 g006
Figure 7. Breakdown of percent energy requirement for the four CTM processes.
Energies 13 06421 g007
Figure 8. Total and specific energy requirement for the four CTM processes.
Energies 13 06421 g008
Figure 9. Methanol production rates for the four CTM processes.
Energies 13 06421 g009
Figure 10. CO2 specific emissions for the four CTM processes.
Energies 13 06421 g010
Figure 11. Carbon efficiencies for the four CTM processes.
Energies 13 06421 g011
Figure 12. CAPEX and OPEX for the four CTM processes.
Energies 13 06421 g012
Figure 13. Total annual cost (TAC) for the four CTM processes.
Energies 13 06421 g013
Figure 14. Utilities consumption rates for the four CTM processes.
Energies 13 06421 g014
Figure 15. Methanol production cost for the four CTM processes.
Energies 13 06421 g015
Table 1. Composition of coal used in the study.
Proximate AnalysisUltimate AnalysisSulfur Content
ElementValueElementValueElementValue
Moisture9.53Ash9.66Pyritic100
Fixed Carbon50.91Carbon74.45Sulfate0
Volatile matter39.45Hydrogen4.95Organic0
Ash9.64Nitrogen1.58
Chlorine0.065
Sulfur2.44
Oxygen6.84
Table 2. Key specifications used in the simulation.
EquipmentDescriptionAspen Model
Coal flowrateCoal = 34.95 kg/s
(65% coal, 35% water)
-
GasifierTemperature = 1300 °C
Pressure = 50 bar
Carbon conversion = 99%
RYield, RGibbs
Water gas shiftReactor configuration = 2 stage
Overall CO conversion = 99.5%
REquil
Methanol reactorTemperature = 210 °C
Pressure = 76 bar
Cu-based catalyst
Catalyst density = 1725 kg/m3
Bed voidage = 0.4
RPlug
Methanol distillationProduct purity ≥ 99 mol.%
Reflux ratio = 1.5
Radfrac
Table 3. Main stream information for the four cases.
Coal FeedRaw SyngasH2S to SRUCO2Sweet SyngasShifted SyngasExt. H2Methanol
BC/MD1/MD2/MD3BC/MD1/MD2/MD3BC/MD1/MD2/MD3BCMD1BCMD1/MD2/MD3BCMD1MD2MD2/MD3BCMD1MD2MD3
Temp.°C55152.5−9.5−31.6−27.693.393.3−1.2−2.40.025.052.552.352.533.1
Pressurebar5027.61.11.01.027.627.624.124.124.130.01.01.01.01.0
Mass flowratet/h193.6284.713.0148.1157.3169.5224.3165.2165.7322.421.581.686.0174.6197.6
Mole flowratekmol/h 13,92431433873588971410,97012,81512,85016,42010,6602552269354636168
Comp.mole.fr
N2 -0.0090.0020.0010.0000.0120.0110.0090.0090.0070.0000.0000.0000.0000.000
Ar -0.0090.0020.0010.0010.0120.0110.0090.0090.0070.0000.0000.0000.0000.000
H2O -0.1900.0000.0000.0000.0000.0000.0000.0000.0000.0000.0080.0080.0080.005
CO -0.3940.0250.0060.0000.5610.4990.0020.0020.0020.0000.0000.0000.0000.000
CO2 -0.1070.7830.9850.9920.0020.1130.2440.2440.4070.0000.0020.0020.0020.005
H2S -0.0040.1620.0000.0000.0000.0000.0000.0000.0000.0000.0000.0000.0000.000
H2 -0.2880.0050.0030.0030.4130.3660.7360.7360.5761.0000.0000.0000.0000.000
CH3OH -0.0000.0160.0030.0040.0000.0000.0000.0000.0000.0000.9900.9890.9900.990
Table 4. Economic assumptions used in the analysis [13,40,41].
ParameterValue
Project life30 year
Tax rate25%
Interest rate10%
Stream factor0.95
Salvage value10% of TCI
DepreciationStraight line method
Coal price35 $/t
External Hydrogen price2.3 $/kg
Operating labor rate$20/operator/h
Electricity cost$0.0775/kWh
LP steam cost$14.05/GJ
MP steam cost$14.83/GJ
HP steam cost$17.70/GJ
Refrigeration cost$13.11/GJ
Table 5. Comparison of key results with the literature findings.
Base CaseMD-1MD-2MD-3Literature
Energy efficiency (%)43.345.751.945.741–55 [42]
51.0 [43]
45.5 [45]
Carbon efficiency (%)36.338.277.687.637.3 [43]
38.4 [44]
37.0 [45]
CO2 emissions (t/t CH3OH)2.202.170.320.152.6 [43,46]
2.3 [44]
5.31 [45]
2.97 [47]
Methanol cost (US $/t)163.9142.6366.0315.5267.0 [43]
290.0 [44]
272.6 [45]
Publisher’s Note: MDPI stays neutral with regard to jurisdictional claims in published maps and institutional affiliations.

