Statistical Evaluation of the Level of Development of Circular Economy in European Union Member Countries


Economics and Finance Institute, University of Rzeszów, 35-601 Rzeszów, Poland
*
Author to whom correspondence should be addressed.
Energies 2020, 13(23), 6401; https://doi.org/10.3390/en13236401
Submission received: 9 November 2020
/
Revised: 26 November 2020
/
Accepted: 1 December 2020
/
Published: 3 December 2020
Abstract
:In this paper, we have analysed the level of advancement in circular economy (CE) in the EU-28 countries. First, we used a synthetic measure to examine CE advancement in EU countries in each of the Eurostat CE distinguished areas, i.e., production and consumption, waste management, secondary raw materials, and competitiveness and innovation. For the empirical analysis, we applied 17 Eurostat indicators to the CE areas. To find the synthetic measure in 2010, 2012, 2014 and 2016, we used multidimensional comparative analysis, i.e., a zero unitarisation method. Second, based on the synthetic measures of the CE areas, we created a general synthetic measure of the CE advancement of the EU-28 countries as well as the countries’ rankings. Third, we classified the countries into groups according to their level of advancement in CE, i.e., high level, medium–high level, medium–low level and low level groups. Finally, we applied a similarity measure to evaluate the correlation between obtained rankings in two most extreme moments in the period of analysis (2010, 2016). Our analysis covers all EU member states, as well as “old” and “new” EU countries separately. Our results confirm that highly developed Benelux countries, i.e., Luxembourg, the Netherlands and Belgium, have the highest CE advancement level. Malta, Cyprus, Estonia and Greece are the least advanced in CE practice. Apart from that, on average, there is some progress in CE implementation, significant disproportions between the EU countries were observed, especially among the “new” member states.
1. Introduction
Current environmental, economic and social observations of the continued exhaustion of natural resources reveal the need for humans, companies and governments to change their attitudes towards the natural environment. Issues related to globalisation, increasing demand for limited resources and aging of societies are among the critical problems of a highly developed European Union (EU). The concept of circular economy (CE) offers a new approach to understanding the relationship between humans and the natural environment.
The currently dominant linear economic system is a process based on production, use and making of waste, which is regarded as the last stage of a product lifecycle. CE is the opposite concept to the traditional, linear and non-sustainable economy [1]. It is based on the “3R” approach, which stands for “reduce, reuse and recycle”, resulting in the reusing and recycling of materials and the prevention of waste generation [2,3] (Figure 1).
The Ellen MacArthur Foundation [4] defined CE as a “system that is restorative or regenerative by intention and design, that can be achieved by eliminating waste through the superior design of materials, products, systems and, within this, business models”. CE is based on three shared principles: (i) design out waste and pollution, (ii) keep products and materials in use and (iii) regenerate natural systems. CE is thus a restructuring of whole economic and social systems, which implies a redesign of products and services offered from their conception phase [5].
CE represents a paradigm to foster resource efficiency in industrial production and consumption processes and aims to prevent resource depletion, close production and consumption loops, and facilitate sustainable development (SD) [6].
CE is frequently viewed as an operationalisation to implement the concept of SD on the micro- and macro-scale [7,8,9]. In the same vein, the authors of [10] described CE as an economic system characterised by SD principle, which is less dependent on exhausting natural resources than traditional economies. In this context, the issue of fulfilling SD objectives by implementing the principles of CE is of special importance.
Supporting SD is among the top priorities of the EU cohesion policy and one of its implementation instruments [11,12,13]. A territorial approach, leading to a reduction in disproportions in levels of development among economies and to improvement in the quality of life, is emphasised in the cohesion improvement process [14]. The EU Action Plan for CE underlines that product and material value is maintained for as long as possible, waste and resource use are minimised and resources are kept within the economy when a product has reached the end of its life, to be used again and again to create further value [15].
The CE is generally linked to large projects implemented at the level of national economies. Meanwhile, the “3R” approach affects citizens’ lives because their everyday purchasing decisions regarding a particular food item, piece of clothing or daily household product, affect CE adoption. Individual consumer decisions determine whether problems such as enormous food wastage [16], overproduction of clothing or the use of very popular, easy-to-use but environmentally burdensome plastic packaging will deepen [17]. Although excessive consumption affects many European countries, including highly developed Western countries, he highlighted problems are more deeply felt in Central and Eastern European (CEE) countries [18]. Promoting rational consumption and production might be helpful in solving these problems. Giordano et al. [19] stress that the first step in reducing the amount of wasted food in the EU is preventive action. Producers should take responsibility for the management and disposal of products they produce once those products are no longer useful [20]. Plastic waste, together with textile waste, pose a real threat to life for both humans and animals [21]. These examples show that the concept of CE is present not only in the economic sphere but also in the social and ethical spheres.
Although there is still no consensus on the definition of CE [7,8,22,23], scientists, industrialists and politicians worldwide agree on the need to adopt CE and identify its evaluation indicators [24,25]. In recent years, there has been an emergence of a greater number of CE indicators (including indicators related, for example, to the management of waste, energy, water and greenhouse gas emissions, and to recycling and proper use of recyclable resources), but there are no universal indicators which would enable comparison of different countries or regions of the world [26].
A need to monitor CE is also emphasised, for example, in intelligent specialisations, indicating a necessity to include interregional and international links and connections [27]. Nevertheless, although the measurement of circularity is considered crucial, there is no prevailing opinion on which operationalisation of CE to use [23,28,29]. Stahel [30] also reported the problem with CE measurement. He argued that the concept of CE has not yet reached any universal implementation stage, because policy-makers and economic actors know neither the basic principles of CE nor their impact on the economy.
The main purpose of this paper is thus to perform a statistical evaluation of the level of CE advancement in the EU-28 countries. We expressed this level with the use of a general synthetic measure based on the synthetic measures calculated for each of the distinguished Eurostat CE area, i.e., production and consumption, waste management, secondary raw materials and competitiveness and innovation [25,31]. We applied a zero unitarisation method to find the synthetic measure of each CE area using indicators assigned to the area.
Because the European Commission (EC) has recently passed several ambitious policies and practices related to CE implementation, e.g., the “Circular Economy Package” (started in 2015 and updated in 2018) [15,32] in the EU, we decided to include all EU member countries. The necessity to diagnose and evaluate the implementation of the objectives set in the part of the world regarded as one of the global leaders in the promotion of the CE model seems justified [33]. The years between 2010 and 2016 are the study period; this period was selected because of the intention to cover the largest possible group of member countries but was also determined by the availability and comparability of reliable statistical data.
We classified the EU-28 countries into “old” and “new” member states. The “old” countries which make up the EU core, i.e., the European Economic Community (EEC), later called the “EU-15”, include Belgium, France, Germany, Italy, Luxembourg and the Netherlands (accession in 1958); Ireland, Denmark and Great Britain (accession in 1973); Greece (1981), Portugal (1986) and Spain (1986); and Sweden, Austria and Finland (1995). The “new” member states include Cyprus, the Czech Republic, Estonia and Latvia; Lithuania, Malta, Poland, Slovakia, Slovenia and Hungary (2004); Bulgaria and Romania (2007); and Croatia (2013). We presented research results both for all the countries in total and for the two groups of countries.
For 2010 to 2016, we classified the member countries into four groups, each group made up of members with similar levels of CE development. Then, we applied a similarity measure to evaluate the compliance of rankings of all member states and for the group of “old” and “new” EU countries. The conducted research allowed us to verify the following research hypotheses.
Hypothesis 1 (H1).
The studied period, 2010–2016, saw an increase in CE mean advancement level in the EU-28 member countries.
Hypothesis 2 (H2).
Disproportions in CE development level in the EU-28 countries gradually reduced in the period 2010–2016.
Hypothesis 3 (H3).
A greater progress in CE development in the reference period was observed in the “new” than in the “old” member countries.
This paper is structured as follows. Section 2, which follows the introduction, presents a literature review of the development of the concept of CE in Europe and worldwide. A review of the available study results attempting to evaluate and diagnose the level of CE advancement has been made against this background. Section 3 presents the applied data and variables, and briefly discusses the assumptions of the research method used for CE measurement. Section 4 presents the results of the study on the changes in CE implementation in the EU-28 countries and verifies the research hypotheses. The paper closes with a discussion and conclusions section which quotes the results obtained, presents conclusions and formulates recommendations and guidelines for decision-makers dealing with the implementation of policies fostering CE development in the EU.
2. Literature Review
Although the practice of CE dates back to the industrialisation period and the 19th century [34], only in recent years have there been scientific studies of CE [5,28,29]. Still, there is a concern about how to measure progress and results on various levels, taking into consideration both the complexity and fuzziness of the concept of CE [28,35,36,37].
In response to the need for CE monitoring, attempts to identify CE indicators are undertaken. In the subject literature, we can find both complex (containing different aspects of CE) and detailed (focused on a select aspect of CE) analyses. Some are theoretical and based on a literature study [35,38,39,40], others are empirical [5,41]. Some treated the concept at a micro-level [39], others at a macro-level [5,41], but some of the research combined both approaches [25,29].
Moraga et al. [29] presented an in-depth review of indicators to measure CE both at the micro- and macroeconomic levels. The main research result was a proposal of a classification framework to categorize CE indicators. They observed that most of the indicators, both at a micro- and macro-scale, focus on the preservation of materials, with strategies such as recycling. They concluded that because of the complex characteristics as well as the fuzziness of CE, a set of indicators should be used to assess CE instead of a single indicator.
Saidani et al. [25] identified 55 sets of CE indicators, developed by scholars, consulting companies and governmental agencies, covering different objectives, scopes and potential applications. Furthermore, Elia et al. [28] confirmed the necessity to adopt a complex view in CE assessment.
A narrower approach to CE measurement was presented by Iacovidou et al. [42]. However, their conclusions were close to those of the abovementioned studies. While focusing on resource recovery from waste, the authors of [42] also pointed out the need for a holistic view dealing with the environmental, economic, social and technical dimensions of CE. Similarly, Smol et al. [40] pointed out the links between CE and eco-innovations. They stressed the role of eco-innovations in connecting technological development with the environmental aspects of CE. Based on eco-innovation factors, the authors of [40] proposed a way to measure regional CE-eco-innovations.
Haupt and Hellweg [43] also underlined the environmental aspect of CE. Contrary to the mass-based indicators, such as recycling rates used to assess the circularity of individual products, firms and the entire countries, they proposed and tested complementary environmental impact-based indicators that measure the environmental value retained through the “4R” approach (reuse, recycle, remanufacture and repair). In this way, CE changes the economic logic because it replaces the production of new goods with the usage of already existing ones. This is possible by carrying out actions to reuse what you can, recycle what cannot be reused, repair what is broken and remanufacture what cannot be repaired [44].
The “3R” or “4R” idea is valid both at the macro- and the micro-level. The micro-level analysis is reflected in the next study. Sassanelli et al. [39] proposed a framework for measuring and assessing the circularity of a company. Apart from the theoretical context, the framework also has practical value. The author of another theoretical framework for CE measurement is Avdiushchenko [38]. She argued that the effective monitoring of CE is still at an early stage, and thus further research is urgently needed to propose indicators at different operational levels to evaluate CE progress.
This view can be explained by the high complexity of the circularity phenomenon, which was also underlined by Căutișanu et al. [41]. Their research covered the following CE areas: economic growth, R&D, education and recycling. The obtained results reflect the classification of countries for a set of indicators of CE areas and the links and dependencies between the indicators analysed.
While the authors of [41] grouped OECD countries in homogeneous classes with respect to each of the selected indicators, there is still a lack of complex classification covering the impact of each of the examined indicators.
In the light of the research presented having mainly the characteristics of empirical studies, a research gap was noticed. Despite the availability of many studies on CE, there is a lack of studies that use one indicator, having included the information of single indicators, to express the general level of advancement in CE. Such a study would facilitate ranking the countries as well as making comparisons between them, as using only one value gives such opportunities.
Our study, using the already existing Eurostat classification of CE indicators [31], suggests a method to examine the level of CE in the EU-28 countries. In particular, we compared the “old” and “new” EU countries, making possible the assessment of future cohesion in CE. The analysis covers the following areas of CE; production and consumption, waste management, secondary raw materials, and competitiveness and innovation. Each area is a component of the general synthetic measure developed to determine the CE level. Such an approach allows the extension of research in the next years, enables us to conduct a similar analysis in other parts of the world, e.g., OECD countries, and compare results among examined objects (countries, regions, etc.). The applied method may also be used for the analyses of other complex phenomena such as SD, green growth and others.
3. Materials and Methods
3.1. Data and Variables
We carried out a comparative analysis of EU member countries based on their CE advancement degree, using variables representing the four areas identified by Eurostat:
- Production and consumptionX1—generation of municipal waste per capita (kg per capita) (D)X2—generation of waste (excluding major mineral wastes) per GDP unit (kg per thousand euro, chain-linked volumes (2010)) (D)X3—generation of waste (excluding major mineral wastes) per domestic material consumption (%) (D)
- Waste managementX4—recycling rate of municipal waste (%) (S)X5—recycling rate of all waste (excluding major mineral waste) (S)X6—recycling rate of packaging waste by type of packaging (%) (S)X7—recycling rate of packaging waste by type of packaging (plastic packaging) (%) (S)X8—recycling rate of packaging waste by type of packaging (wooden packaging) (%) (S)X9—recycling rate of e-waste (%) (S)X10—recycling of biowaste (per capita) (S)X11—recovery rate of construction and demolition waste (% of construction and demolition mineral waste recycled) (S)
- Secondary raw materialsX12—circular material use rate (% of total material use) (S)X13—trade in recyclable raw materials (imports from non-EU countries) in tons per thousand inhabitants (S)X14—trade in recyclable raw materials (exports to non-EU countries) in tons per thousand inhabitants (S)X15—trade in recyclable raw materials (imports from EU countries) in tons per thousand inhabitants (S)X16—trade in recyclable raw materials (exports to EU countries) in tons per thousand inhabitants (S)
- Competitiveness and innovationX17—patents related to recycling and secondary raw materials per million inhabitants (S).
Among the 17 CE-designated variables, the majority were stimulants (S)—14 variables—while the group of destimulants (D) included three variables. A stimulant is a variable whose high values are favourable for a studied phenomenon, but low values are unfavourable. A destimulant is a variable for which low values are favourable, while high ones are unfavourable [45].
The first area of CE describes “production and consumption”. The area applies to EU self-sufficiency within raw materials, environmentally friendly public procurement, waste generation as well as wasting food [46]. Production is aimed at producing consumer goods (and investment goods, which generate future consumption), and waste is produced on each stage of production. All indicators measuring waste level (X1–X3) were assumed to be destimulants. Although waste can be recycled and transformed into resources to a certain extent, it depends on the assimilation capacity of our planet and the process conditions [47].
The area concerning “waste management” is one of the CE components. The policy related to waste handling is gradually shifting its focus from waste generation prevention to regarding waste as resources and sustainable raw materials [48]. The indicators X4–X11 represent the area focused on the recycled waste share in the whole economy and specific waste streams. Recycling substantially reduces the ultimate volume of waste and usually also the demand for virgin raw materials. Increasing recycling rates have a direct impact on employment in the waste management sector as well as indirect impact in fields such as construction, maintenance, and administration of the recycling facilities [49]. This is a justification of the treatment of “waste management” variables as stimulants.
Another CE area, “secondary raw materials”, measures the share of recycled materials in demand as raw materials and for recyclable raw materials trading [46]. It is represented by the X12 indicator—circular material use rate—and (X13–X16) indicators measuring trade in recyclable raw materials. A higher circularity rate (X12) value indicates means that more secondary materials substitute for primary raw materials thus reducing the environmental impacts of extracting primary material, thus in the analysis we found the indicator to be stimulant [31]. The next indicators in this CE area show the amount and the monetary value of total waste shipped across intra and extra-EU borders (X13–X16). When environmental conditions are equal between member states, because both comply with the European provisions and both have an equal or similar national level of ambition, borders could be opened for waste shipments and markets could benefit from adequate price settings and from removing market inefficiencies [50]. As the proper image of the European raw materials sector needs to cover the traffic of waste raw materials, i.e., recyclable raw materials, across the European borders through export and import, as well as within the EU, X13–X16 indicators (similarly to X12) were treated as stimulants.
The last CE area, i.e., “competitiveness and innovation”, specifies private investments, jobs and gross added value, as well as patents applying to CE areas [46]. The area is represented in the studies by the X17 indicator—patents related to recycling and secondary raw materials per million inhabitants—which was approached as a stimulant.
3.2. Method
The synthetic measure of the level of CE development level was determined using zero unitarisation methods for all EU member countries in the period 2010–2016. The method assumptions and its subsequent stages included [51] the following.
- Presenting of diagnostic variable values Xj (j = 1, 2, …, m) describing the studied objects (EU countries) Oi (i = 1, 2, …, n) in each of the studied periods (2010, 2012, 2014, 2016) in the form of a two-dimensional matrix:
- Normalisation of the variables to maintain comparability of statistical data, according to the following Equationswhere
- zij—the normalised value of a jth variable for the ith object,
- xij—the value of a jth variable for the ith object,
- Rj—range for the jth variable. Normalisation was carried out for “object-periods”, i.e., , , and values were identified for all four studied years.
- Calculating the synthetic measure values for the distinguished CE areas as an arithmetical mean of normalised variable values, using Equation (4):where
- MSi—synthetic measure for the distinguished CE areas (I–IV),
- zij—the normalized value of the jth variable for the ith object. Thus, the value of the general synthetic measure of the level of CE development for the ith object (EU country) is the arithmetic mean of the synthetic measures calculated for the CE areas (I–IV):where—the general synthetic measure of the level of CE,—the synthetic measure of area I of CE,—the synthetic measure of area II of CE,—the synthetic measure of area III of CE,—the synthetic measure of area IV of CE.
The synthetic measure takes values from the [0,1] range. The higher the general synthetic measure value, the higher the level of development of the country’s CE.
- 4.
- Classifying the EU-28 countries with similar levels of development of CE, according to the following Equations (6)–(9):where
- —the mean value of the general synthetic measure,
- —standard deviation of the general synthetic measure.
- 5.
- Checking the similarity of results of the linear ordering of the countries in time (2010 vs. 2016), using the following Equation [52],where
pir, pis—values of synthetic measure for the ith country in the compared periods r and s, n—number of countries. The measure helps to compare the values of the general synthetic measure at the beginning and end of the studied period. Its value is 0 when there are no differences in the values of synthetic measures in the compared periods. The square root of Equation (10) informs about the average order of deviation in the compared synthetic values in the periods r (2010) and s (2016). An important feature of measure is that it can be presented as a sum of three partial measures, which enables more precise identification of the “order” and “nature” of the differences in the synthetic measure values, in the following form,
Individual partial measures provide information about the following,
- –
- difference between mean values of synthetic measures:
- –
- difference in the dispersion of synthetic measures:
- –
- a non-conformity of the direction of changes in synthetic measures:
where
, Sr (, Ss) stand, respectively, for the arithmetic mean and standard deviation of the rth (sth) synthetic feature value, and stands for Pearson’s coefficient of linear correlation between the vectors p.r = (p1r,… pnr) and p.s = (p1s,… pns). The application of the similarity measure Equation (10) and the partial measures Equations (11)–(14) provided the statistical grounds for the verification of the research hypotheses and the fulfilment of the purpose of the study.
4. Results
4.1. Descriptive Statistics
For the preliminary analysis, we performed a statistical evaluation of CE indicators for 2010 and 2016. We applied basic descriptive measures, i.e., maximum, minimum, mean, coefficient of variation (CV) and coefficient of asymmetry (CA) (Table 1).
In 2010, the highest quantity of waste per capita was produced in Denmark (762 kg), while the lowest was produced in Estonia (305 kg). The mean value for the EU was about 490.29 kg per capita, and the differentiation level among countries for the value of the X1 indicator was low. Estonia dominated the next two indicators, i.e., X2—generation of waste, excluding major mineral waste, per GDP unit (in kg per thousand euro)—and X3—generation of waste, excluding major mineral waste, per domestic material consumption (%). This cannot be perceived as a favourable situation for this country considering the nature of the variables (destimulants). In the case of the X2 variable value, a significant differentiation among countries was observed (CV = 122.16%), and a high CA level (3.84) is the evidence that in the majority of EU member countries, the value of X2 variable was below the average.
In the II group of variables identifying the CE area, “waste management”, the best situation in 2010 was observed for Germany, Luxembourg, Denmark, Slovenia, Sweden, Austria and the Netherlands. The lowest values of X4–X11 (being the evidence of low waste recycling activity) were observed for Croatia, Greece, Malta, Poland and Cyprus. Some member states attained maximum or minimum in more than one variable. They were, for example, Sweden, Croatia, Malta and Cyprus. It should be emphasised that within the variables that make up the II group, the EU member countries were most diversified for X10 variable—recycling of bio-waste (per capita)—for which the CV was 102.30%.
In the third CE area, “secondary raw materials”, the only countries that attained the maximum of individual indicators were the Netherlands, Sweden and Luxembourg. EU member countries were also strongly diversified for X12–X16 variables, which was suggested by the CV value ranging between 78.13% and 337.10%. The values of the indicators were characterised by a strong right-sided asymmetry (CA from 1.23 to 5.15), which implies that the majority of member countries reached values below the average.
The X17 indicator—patents related to recycling and secondary raw materials per million inhabitants—represented the fourth area of CE, i.e., “competitiveness and innovation”. X17 amounted to 0 for Cyprus, Malta, Slovenia and Slovakia up to 3.69 for Luxembourg. However, the mean value for the EU countries was 0.63. The studied countries were also strongly diversified for the X17 variable (CV = 122.68%). In the majority of the member states, the level of competitiveness and innovativeness was lower than the average. The situation cannot be deemed favourable because such a strong polarisation in the CE area, being essential for development, can aggravate the disproportions observed between the member states.
For 2016, compared to 2010, we observed changes in countries that produced the highest quantities of waste per capita. In this area of CE, Denmark and Estonia still dominated. However, it is positive that the values of two indicators (X2 and X3) reduced for these countries. The mean values of the following variables also reduced for all EU member countries: X1 (generation of municipal waste per capita) and X2 (generation of waste, excluding major mineral waste per GDP unit).
Important favourable changes in 2016, compared to 2010, were also observed in the second area of CE, i.e., “waste management”. The mean values of seven out of eight variables went up for the whole EU. Only the mean value for the X8 variable, recycling rate of packaging waste by type of packaging (wooden packaging) (%), slightly decreased (from 43.09 to 41.73). Diversification between countries regarding X8 went down significantly (from 77.98% to 59.94%). It is positive that the majority of the member states attained values of X11, recovery rate of construction and demolition waste (% of construction and demolition mineral waste recycled), above the average, which was confirmed by the CA of −2.75 in 2016.
In 2016 compared to 2010, countries with the highest values of the third area of CE, i.e., “secondary raw materials”, did not change significantly. Among the leaders in this area in 2010 were the Netherlands, Sweden and Luxemburg. In 2016, in the case of the X13 indicator, Slovenia replaced Sweden. We observed that the mean values of X12 variable, circular material use rate (% of total material use), and X14 variable, trade in recyclable raw materials (exports to non-EU countries) in tons per thousand inhabitants, increased slightly, while for the other three variables (X13, X15 and X16), the mean values dropped in 2016 compared to 2010.
Despite a decrease in the diversification level of X12–X16 indicators, in 2016, compared still to 2010, high values of CV were noticed (from 76.16% for X12 to 306.32% for X15). Moreover, high CA values suggest that the majority of the countries reached lower levels than the EU-28′s average for X12–X16 indicators.
In 2016, Luxembourg was still the leader in patents concerning recycling and secondary raw materials. The mean value for the EU-28 was 0.74 patent per 1 million inhabitants. The diversification of the EU member countries for the indicator (X17) we found to be high (CV = 151.69%), and the majority of the studied countries reached levels below the average (CA = 4.40).
4.2. Rankings
The statistical evaluation of CE development, carried out with the descriptive measures, presented a detailed picture of the implementation of the concept of CE in the member countries. It allowed to distinguish winners and losers in the selected CE area. However, based on individual indicators, it is difficult to identify CE leaders, countries with a medium-advanced level or those poorly involved in the concept implementation among the studied countries. The proposed method with one aggregated measure can be used in studies on CE advancement may facilitate solving this issue. The suggested general synthetic measure allows consideration of a simultaneous impact of all 17 variables. The results obtained through the measure for each EU member country in the period 2010–2016 are presented in Table 2.
From the data presented in Table 2, we observe that the values of the general synthetic measure in subsequent study years fell within the following ranges,
- in 2010: from 0.207 for Malta to 0.530 for Luxembourg,
- in 2012: from 0.228 for Greece to 0.555 for Luxembourg,
- in 2014: from 0.222 for Greece to 0.668 for Luxembourg, and
- in 2016: from 0.241 for Greece to 0.552 for Luxembourg.
The presented values of the general synthetic measure in the examined years reveal the ranges of the general synthetic measure and its changes in individual years. The increase in the value of the lower and upper limits of the range indicates the improvement of EU countries in CE implementation. The lowering of the upper limit of the measure in 2016, compared to previous years, indicates some weakening of the implementation of the CE concept in some countries, e.g., Sweden and Germany. In eight of the countries, an increase in the general synthetic measure was observed in all examined years. The countries include Bulgaria, the Czech Republic, Lithuania, Poland, Portugal, Slovakia, Spain and the United Kingdom. Minor fluctuations (upwards or downwards) in the general synthetic measure value were observed in the other countries in subsequent study years.
The following stage of the study involved the evaluation of the EU similarity measures related to CE level in 2010 and 2016. We calculated similarity measures with Equations (10)–(14) and obtained the following results,
The mean deviation in the general synthetic measure values in 2010 and 2016 was 0.00116. It mainly resulted from an increase in the mean value of the general synthetic measure (from 0.332 in 2010 to 0.358 in 2016). High compliance of the direction of changes in values of the general synthetic measure was observed (0.950) for the compared periods. It means that the great majority of the countries improved their CE levels in the compared years, 2010 and 2016. Moreover, a minor drop in the synthetic measure differentiation was observed (from 0.068 to 0.064), being the evidence of a minor reduction in the disproportions between the EU-28 countries.
From the value, the rankings of the EU-28 countries were made for 2010, 2012, 2014 and 2016, and later used to determine each country’s position (Table 3).
In the period 2010–2016, the following countries maintained their leading positions for CE practice, Luxembourg and the Netherlands. Among the countries which mostly improved their situations in the reference period were Lithuania (moving from the 15th place in 2010 to the 6th place in 2016) and Slovenia (progressing from the 9th to the 4th place). The greatest drop in the compared years was observed for Sweden (moving down from the 3rd place in 2010 to the 9th place in 2016).
4.3. Classification
Based on the general synthetic measure calculated for 2010 and 2016, we classified the EU-28 countries into four groups depending on the CE level. The results of the classification are presented in Table 4.
Group 1. This group is composed of representatives of the “old” EU member countries with high levels of CE development in 2010 and 2016. The group in 2010 included Luxembourg and the Benelux countries (the Netherlands, Sweden and Belgium). However, in 2016 Sweden dropped to Group 2. The values of synthetic measure for this group ranged from 0.530 for Luxemburg to 0.409 for Belgium in 2010, and from 0.552 for Luxemburg to 0.434 for Belgium in 2016. Countries classified as belonging to Group 1 were leaders in CE implementation.
Group 2. This group includes countries whose values of measure ranged in 2010 from 0.396 for Austria to 0.337 for France, and in 2016 from 0.417 for Slovenia to 0.358 for Poland. Both in 2010 and 2016, in this group with a medium–high level of CE, there were “old” and “new” member states. In 2016, the composition of Group 2 was higher and included also Lithuania, Sweden and Poland. However, in 2016 France fell back to Group 3.
Group 3. This group, the medium–low level group, in 2010 was mainly composed of “new” member states, but the South European countries (Spain and Portugal) were also classified as part of this group, together with Finland, which ranked the lowest among the Nordic countries. The year 2016 saw an improved CE situation in Portugal (moving up to Group 2) but also a deterioration of the situation in France. measure for this group in 2010 reached the highest value for Finland (0.328), and in 2016 for France (0.358). The lowest value of the general synthetic measure in 2010 was recorded for Croatia (0.287), and in 2016 for Bulgaria (0.305).
Group 4. In 2010, this group, the low-level group, was made up majorly of countries in Southern Europe, including Bulgaria, Estonia, Greece, Cyprus and Malta. Most of these countries are characterised by a high revenue from tourism in their GDPs. It should be however noted that tourism generates high quantities of waste, which can prevent the transformation of the economies to CE. In 2016, the composition of Group 4 changed because Bulgaria moved up to Group 3. Bulgaria and Romania are among the poorest EU member states and their recycling level indicators were also among the lowest. The unfavourable situation of Estonia could have been caused by the deterioration in the value of production, consumption, and waste management indicators. In this group with the lowest level of CE development, the values of indicator in 2010 ranged from 0.252 to 0.207, while in 2016 the values ranged from 0.274 to 0.241
Taking into account the average values of X1–X17 indicators for the countries classified into particular groups, we determined the variables for which the countries of a given group achieved the most favourable average values The most favourable average values are the highest values for stimulants and the lowest values for destimulants. In 2016, a group of countries with high levels of CE achieved the most favourable average values for 13 variables, i.e., X2, X4, X5, X6, X8, X10, X11, X12, X13, X14, X15, X16 and X17. The group of countries with medium-high CE levels had the most favourable average values for two variables, i.e., X3 and X7. The group of countries with medium levels of CE achieved the most favourable average values for X1 and X9 variables. However, the countries of Group 4, which had low levels of CE, did not record the most favourable average values for any of the variables.
For the sake of comparison, in 2010, countries in the given groups achieved the most favourable average values for the following variables: X4, X5, X6, X7, X8, X9, X10, X12, X13, X14, X15, X16 and X17 (for Group 1); X2 and X11 (for Group 2); X1 and X3 (for Group 3); and no variables (for Group 4).
Taking into account the individual indicators (X1–X17), we noticed the following changes in the period 2010–2016.
- Production and consumption. In most EU countries, the situation regarding the amount of waste generated improved. Sixteen countries saw a reduction in the values of X1 indicator (most notably Bulgaria, Spain, and Luxembourg), the values of X2 indicator for 17 countries reduced (most notably Estonia, Finland, and Romania) and the values of X3 indicator for 11 countries reduced (most notably Finland, Luxembourg, and Hungary).
- Waste management. In 2016, countries generally showed better waste management than in 2010, i.e., 26 countries recorded improvements in X4 (most notably Lithuania, Slovenia and Poland), 21 countries recorded improvements in X5 (most notably Slovenia, Latvia and Croatia), 19 countries recorded improvements in the values of X6 (most notably Slovakia, Poland and Malta), 21 countries saw improvements in X7 indicator (most notably Lithuania, Poland and the United Kingdom), improvements in X8 were recorded for 10 countries (most notably Slovakia, Portugal and the Czech Republic), 27 countries recorded improvements in the values of X9 (most notably Bulgaria, Croatia, and Estonia), and 22 countries saw improvements in the values of X10 (most notably Lithuania, Slovenia and Portugal).
- Secondary raw materials. Most of the EU countries improved their results in this area, i.e., 17 countries improved in X12 (most notably Belgium, Italy and the Netherlands), 17 countries improved in X13 (most notably Greece, Portugal and Bulgaria), 17 countries improved in X14 (most notably Lithuania, Latvia, and Malta), 12 countries improved their X15 results (most notably Slovenia, Portugal, and Estonia) and nine countries improved their X16 results (most notably Slovakia, Slovenia, and Croatia).
- Competitiveness and innovation. More than a half (16) of the countries improved the values of their X17 indicator (most notably Luxembourg, Denmark and Slovenia).
The EU-28, both in 2010 and 2016, were dominated by the countries with medium–low levels of CE development (Group 3), i.e., CEE countries, countries from the Iberian Peninsula and Finland. Unfortunately, these countries do not belong to the EU top economic countries, and mainly include member states which joined the EU in 2004 or later. The EU economic leaders were classified as belonging to Groups 1 and Group 2. Despite favourable classification and high positions in the rankings (Table 4), the problem of highly developed countries is that they generated large quantities of waste, compared to poorer or less developed countries. This is also true for countries with low level of CE development, i.e., Greece, Cyprus and Malta. Tourism has a high share in the development of these countries’ GDP, which justifies the observed situation.
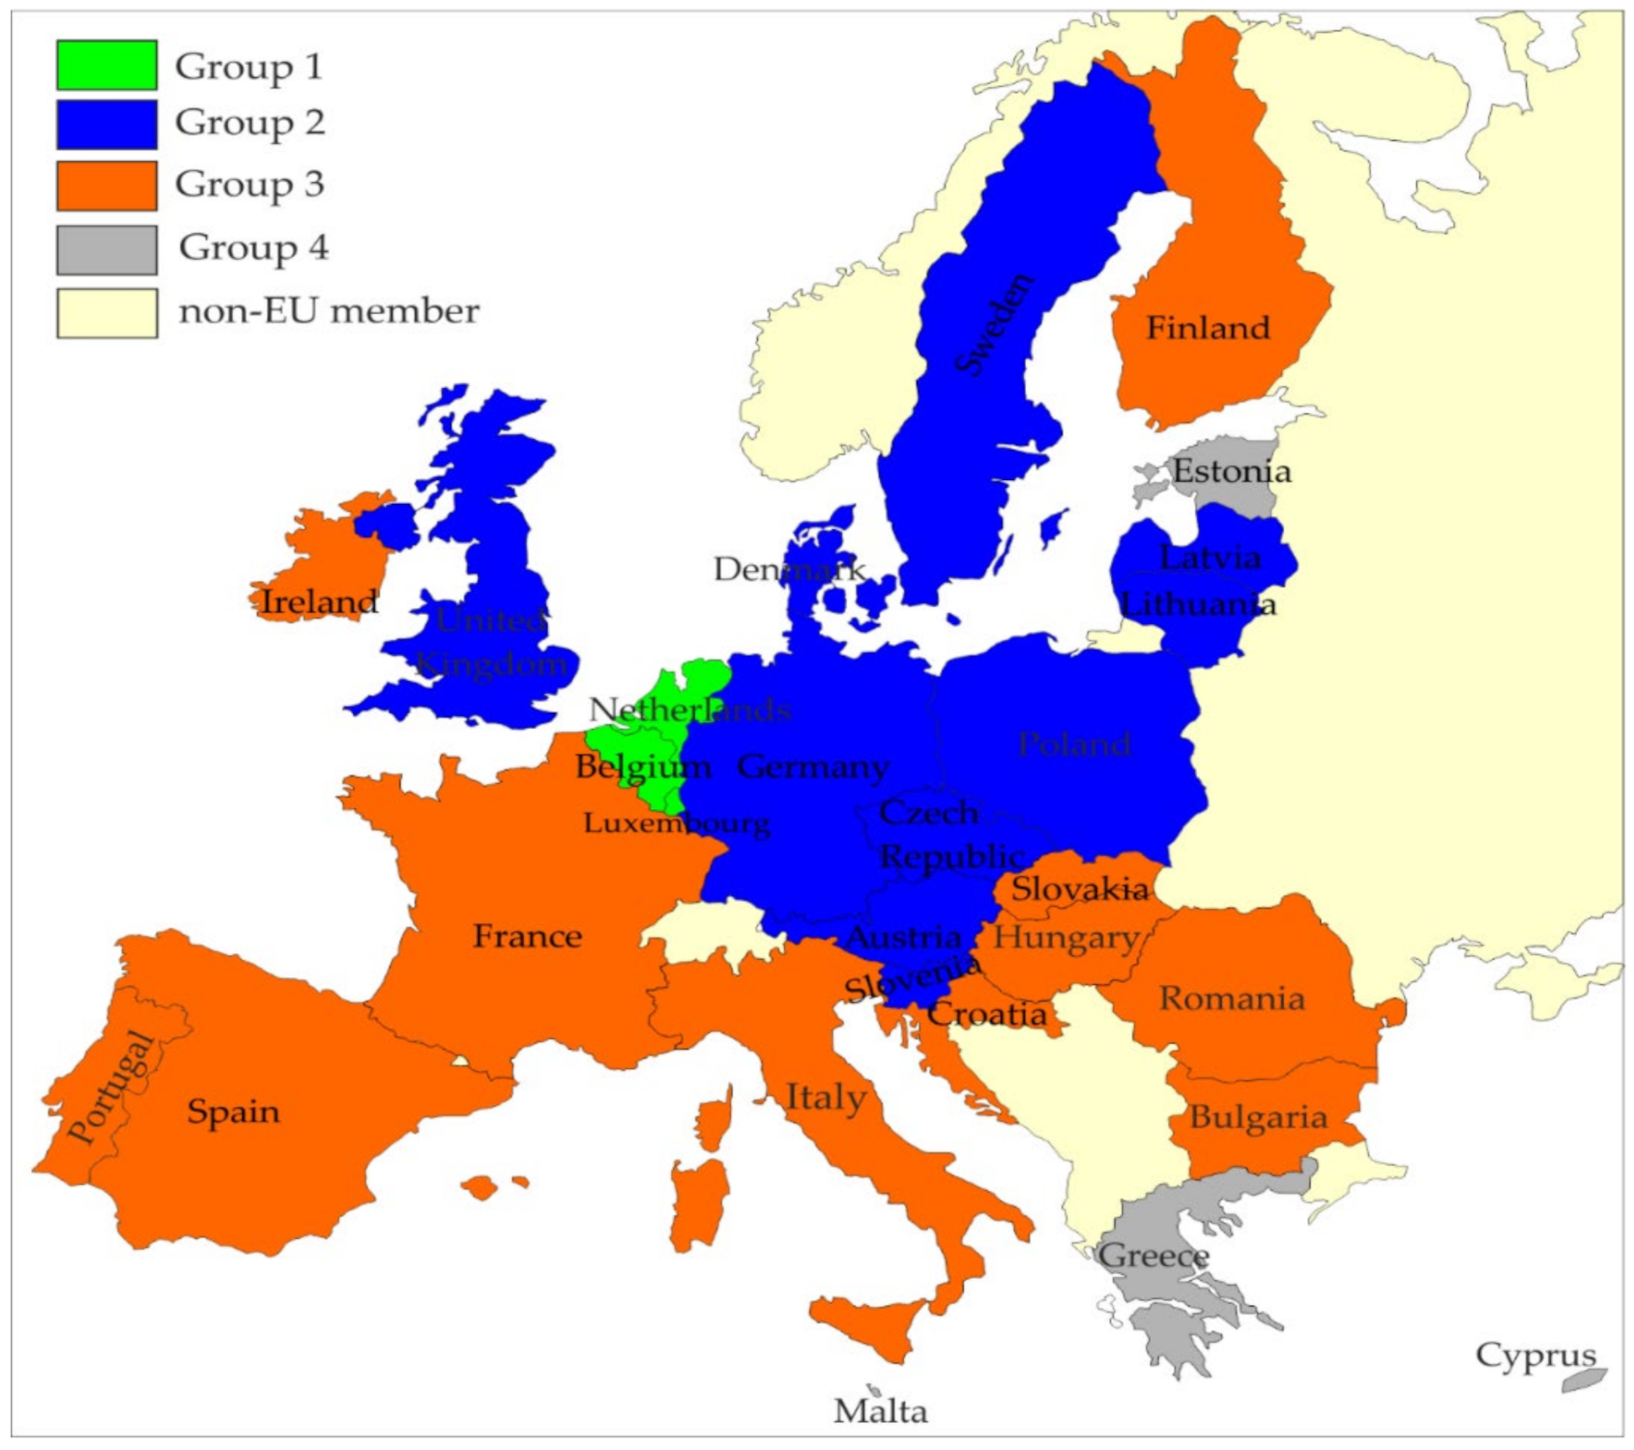
The year 2016, in comparison with 2010, did not show significant improvement in the CE situation of the EU-28 countries (Figure 2 and Figure 3).
In 2016, Bulgaria improved on its low level of CE, and thus a slight improvement in Group 4 was observed. In 2016, compared to 2010, the number of CE leaders reduced as Sweden moved to Group 2. Lithuania and Poland improved their situation in the classification, while the position of France decreased.
Apart from general classification of EU countries we also classified the countries in each of CE area for 2010 and 2016 (Table 5).
The variables from production and consumption area constituted of destimulants (X1–X3 indicators). Both in 2010 and 2016 the majority of “new” EU countries were in the waste generation (law amount of waste generation) in the better situation than “old” EU states. However, in 2010 in both rankings on the lowest positions were Estonia together with Bulgaria. In 2016, Bulgaria improved slightly its position and finally was replaced by the Netherlands. Of the “old” EU countries, only four of them had relatively low waste generation, i.e., Portugal, Finland, Austria and Ireland. In 2016, Belgium generated the highest amount of waste in the EU.
The opposite situation was in the waste management area. Both in 2010 and 2016 among the leaders were “old” EU members. From the “new countries”, Lithuania, Slovenia and the Czech Republic were relatively good at recycling (Table 6).
A similar situation was in the next CE area, i.e., secondary raw materials. Favourable waste exchange conditions prevailed both in 2010 and in 2016 mainly in the “old” member countries. Among the “new” countries” were only Slovenia and Estonia (Table 7).
Because the standard deviation of was higher than the average there are no countries in 2010 in Group 4. The last CE area, i.e., competitiveness and innovation had the leaders among “old” member states. In 2010 they were Luxemburg and Finland, and in 2016 it was only Luxemburg. The medium–high in competitiveness and innovation in 2016 were highly developed “old” member states and Poland which represented “new” EU members. The level of competitiveness and innovation of none of the countries was considered low (Table 8).
Because the standard deviation of was higher than the average there are no countries both in 2010 and 2016 in Group 4.
4.4. Hypothesis Verification
The formulated research hypotheses concerned the evaluation of the progress of all EU member states as regards CE, and according to the division into “old” and “new” member states. The identified values of synthetic measures for subsequent study years (2010, 2012, 2014 and 2016) set the criteria to rank countries and to evaluate the similarity of ordering in most extreme moments in the period of analysis.
The research results confirmed the first hypothesis that, in the studied period 2010–2016, a minor increase in the mean level of CE advancement in the EU-28 countries was observed. Progress in CE adoption resulted in an increase in the general mean synthetic measure value (from 0.332 in 2010 to 0.358 in 2016). The ranking results also confirmed an improvement in the situation of some countries (Table 3). The greatest progress was recorded by Lithuania, Slovenia, Poland and Portugal, which saw their ranking positions improve by +9, +5, + 4 and +4 positions, respectively. The greatest drops in the ranking affected Sweden, Germany and Spain, who moved down by −6, −4 and −4 positions, respectively.
For the whole EU, it is important to level imbalances and differences between member states, especially in the aspect of CE. Maintaining cohesion within the EU is important not only for individual member states, but also for the whole EU community.
We examined the imbalance in the level of CE within EU member states with partial measures (12–14). To achieve this, we used average values of the general synthetic measures and their standard deviations. The application of the above-mentioned indicators made it possible to verify the second research hypothesis about disproportions in the level of CE development in the member states. We verified the hypothesis by calculating the difference between the general synthetic measure dispersion values ( and ), which amounted to −0.004. Therefore, we observed a drop in diversification between the EU-28 countries for the level of CE, verifying positively the second hypothesis.
Application of the same partial indicators about “old” and “new” member states formed the basis for the verification of the third hypothesis referring to the progress of the “new” and “old” EU member states in CE. The use of Equations (10)–(14) yielded the following results.
“Old” member states
“New” member states
The obtained results suggest some changes in the general synthetic measures for 2010 and 2016 among “old” and “new” EU member countries. For the “old” member states, the mean of the general synthetic measure increased (from 0.3633 to 0.3781), while the diversification of the general synthetic measure decreased (from 0.0669 to 0.0659). For the “new” member states, an increase in the mean of the general synthetic measure was observed (from 0.2957 to 0.3357) at a simultaneous increase in diversification (from 0.0497 to 0.0522). In both cases, high compliance in the direction of the general synthetic measure value changes was noticed in the compared years, which means that the majority of both the “old” and “new” member states improved their CE levels. The growth scale of the mean general synthetic measure was noticeably more for the “new” member states than for the “old” states. This was likely caused by the diversification in the CE initial status for both groups of countries, which was higher for the “old” member states. In such a situation, further progress, from a relatively high level, requires greater expenditure and usually is not as dynamic as it initially was.
Furthermore, for the “old” member states, a decrease in CE development differentiation was observed, which means that these countries were at similar levels of CE development. As for the “new” member states, disproportions in CE development increased. The difference in dispersion confirmed not only the value of the partial indicator determined by (13) but also by significant changes in the ranking positions of the selected countries. The greatest shifts in ranking positions were observed for the “new” member states.
5. Discussion and Conclusions
CE has recently attained the status of a key option of economic growth and development for many regions in the world, including the EU. According to the concept of CE, economic activities should be responsible, should exert minimal negative impact on the natural environment, and should not strain natural resources. The well-being of contemporary generations depends on economic development directly linked to CE, which assumes no space for wastefulness, ineffectiveness or destruction of the natural environment.
CE implementation proceeds through a set of actions that fall within its aforementioned areas. The CE areas are related just like the actions taken are. Production and consumption are closely linked to the generation of waste. From an environmental point of view, the priority in waste treatment should be to first limit the generation of waste, then to recycle and recover what is generated, and finally to dispose of what remains [53]. Waste treatment thus contributes to lower consumption of raw materials because secondary resources produced from waste replace raw materials. In this way, the CE system loop “closes”, which would not be possible save for the fourth CE area, competitiveness and innovativeness. Both competitiveness and innovativeness are driving forces in the search for better engineering and process solutions that would enable closing the loops of production cycles.
To ensure dynamic CE development, due to the interrelations between the analysed CE areas, a fairly uniform development of each area is necessary. Despite the gradual elimination of the imbalance in CE adoption, there are still significant differences in CE levels between member states. These differences are generally observed in each of the CE areas, which are related to the specificity of individual countries, in force production and consumption patterns, waste treatment and levels of economic development closely related to the level of innovativeness [54].
This study has presented a statistical evaluation of the advancement of the EU-28 countries with respect to their implementation of the concept of CE. The analysis covered the period from 2010 to 2016. An initial evaluation of the concept implementation in EU member countries was performed using the set of descriptive measures (mean, maximum and minimum, CV and CA) for individual indicators. Individual indicators allowed us to describe in detail the CE situation in the EU-28 countries in the two most extreme moments in the period of analysis (2010, 2016).
However, the conclusions formulated on the basis of this evaluation presented only a particular image of CE implementation in the different EU member countries. That was why a multi-feature evaluation of the EU member countries was performed in the following stage of the studies, taking all indicators into account (17 variables assigned to four CE areas) and using zero unitarisation method. The method allowed us to obtain multi-criteria evaluations of the concept, enabling us to carry out a comparison between the EU countries using only one synthetic measure.
As a result of the study, a ranking of EU member countries was obtained for the level of development of CE in the years 2010, 2012, 2014 and 2016, and then the countries were classified into four groups depending on their level of development of CE in most extreme moments in the period of analysis. The use of the similarity measure of the countries’ linear ordering helped to evaluate the changes in the member states related to their adoption of CE.
Both in 2010 and 2016, the high levels of implementation of CE were associated with the countries’ prosperity. In 2016, among the leaders in CE were Northern European countries of Luxemburg, the Netherlands, and Belgium. The biggest losers in the implementation of the concept were, in 2016, the Southern European countries of Cyprus, Malta and Greece, but also Estonia, which is a CEE country. Estonia was struggling in the examined period of 2010–2016 with the unsolved problem of waste generation along with low recycling rates. Both in 2010 and 2016, most EU members belonged to the medium–low level group of CE adoption. Among them were mostly countries that joined the EU in 2004 or later. The group of countries with a medium–high CE level was characterized by a similar number of members as the medium-low level group.
In 2010, among the countries with medium-high level of CE were large “old” member states such as Germany, France, Austria, and the United Kingdom. These countries have highly developed economies, but also large populations. Our research shows that these countries, perhaps besides France, coped well with the implementation of CE and can serve as a benchmark to other less prosperous EU countries, e.g., Poland, Bulgaria and Romania.
Among the CEE countries, the Czech Republic, Slovenia and Latvia had also a strong position in CE implementation. The Czech and Slovenian economies are mentally closest to those of the highly developed Western European countries hence the implementation of CE could have been easier there than in other post-communist countries. We should also note that Lithuania, which, like the Czech Republic and Slovenia, is a post-communist country, achieved the greatest progress in CE adoption.
What we have noticed from this research is the gradual alignment of CE development levels within the Union. Furthermore, CE growth dynamics in the “new” member states was higher than in the “old” members. The level of CE will, therefore, gradually equalize among EU countries. The “new” EU countries should, thus, avoid natural environmental destruction of the extent observed in Germany or the United Kingdom at the time of their dynamic socio-economic development. To achieve this, the new EU countries should focus more on competitiveness and innovations, developing safety technologies, but also on changing production and consumption patterns.
The need to improve competitiveness and innovativeness in the countries lagging in R&D is also of great importance, so that the countries could respond to the challenges they face. Development of the R&D sector fosters the creation of modern technologies indispensable in every stage of the production cycle resulting in a specific product. A higher technological level of the economy means a higher waste processing degree, a higher recovery level, including recycling, and consequently a lower consumption level of resources. There is need to trigger actions targeted at the group of countries mentioned in the study (especially countries in the 3rd and 4th classification group), with the aim of enhancing effective use of resources and boosting the degree of waste processing. The strengthening of innovativeness and competitiveness is of great importance. Once stimulated by R&D, they help in CE implementation and boost the perception of waste as potential raw materials in another closed cycle. This applies, in particular, to new member countries but also countries in southern Europe. To enjoy reasonable progress in CE, the countries have to deal with the modernisation of their production systems.
Based on the research, we conclude that there is some chance that differences in CE development between the “old” and “new” member states would gradually decrease. Moreover, representatives of the “new” member states will soon belong to the leaders of CE. Gradually, the “new” countries are dynamically closing in on the “old” member states. Owing to the applied dynamic approach, the results provide information about the past situation, the present status quo, but also allow the prediction of future directions and possibilities of CE development.
Our research relates with the subject literature on the measurement of the adoption of CE. However, there are no studies before ours dedicated to the CE assessment of all the EU-28 countries. Most of the research focused on assessing the situation of a particular country from the EU or from outside the EU, and mainly presented some select aspects of CE. Our study stands out by attempting to assess the CE level of all EU countries, in four CE areas.
The current study is not, however, flawless. A limitation of the research is the limited number of indicators, particularly in the area of competitiveness and innovation. Another limitation is the lack of indicators covering the social aspect of CE. These limitations can be removed by expansion of the Eurostat database or by using other existing databases, e.g., the World Bank’s [55] or OECD’s [53] database. However, none of these databases include CE indicators for all EU member countries.
Author Contributions
Conceptualization, B.F.; methodology, M.S. and B.F.; formal analysis, M.S.; writing original draft preparation, B.F., M.S. and T.M.; writing—review and editing, B.F., M.S. and T.M.; visualisation, M.S. and B.F., supervision, B.F., M.S. and T.M., funding acquisition, B.F. All authors have read and agreed to the published version of the manuscript.
Funding
This work has been supported by the funds of the Ministry of Science and Higher Education granted to the University of Rzeszów, Poland.
Conflicts of Interest
The authors declare no conflict of interest.
References
- Ormazabal, M.; Prieto-Sandoval, V.; Puga-Leal, R.; Jaca, C. Circular Economy in Spanish SMEs: Challenges and opportunities. J. Clean. Prod. 2018, 185, 157–167. [Google Scholar] [CrossRef]
- de Mattos, C.A.; de Albuquerque, T.L.M. Enabling Factors and Strategies for the Transition Toward a Circular Economy (CE). Sustainability 2018, 10, 4628. [Google Scholar] [CrossRef] [Green Version]
- Huang, C.-C.; Chuang, H.-F.; Chen, S.-Y. Corporate Memory: Design to better reduce, reuse and recycle. Comput. Ind. Eng. 2016, 91, 48–65. [Google Scholar] [CrossRef]
- Ellen MacArthur Foundation (EMF) 2012. Available online: https://www.ellenmacarthurfoundation.org/circular-economy/what-is-the-circular-economy (accessed on 23 September 2019).
- Tantau, A.D.; Maassen, M.A.; Fratila, L. Models for Analyzing the Dependencies between Indicators for a Circular Economy in the European Union. Sustainability 2018, 10, 2141. [Google Scholar] [CrossRef] [Green Version]
- Prieto-Sandoval, V.; Jaca, C.; Ormazabal, M. Towards a consensus on the circular economy. J. Clean. Prod. 2018, 179, 605–615. [Google Scholar] [CrossRef]
- Ghisellini, P.; Cialani, C.; Ulgiati, S. A review on circular economy: The expected transition to a balanced interplay of environmental and economic systems. J. Clean. Prod. 2016, 114, 11–32. [Google Scholar] [CrossRef]
- Kirchherr, J.; Reike, D.; Hekkert, M. Conceptualizing the circular economy: An analysis of 114 definitions. Resour. Conserv. Recycl. 2017, 127, 221–232. [Google Scholar] [CrossRef]
- Rogall, H. Ekonomia Zrównoważonego Rozwoju. Teoria i Praktyka; Wydawnictwo Zysk i Spółka: Poznań, Poland, 2010; pp. 31–53. [Google Scholar]
- Liu, J.Y. Circular economy and environmental efficiency—The case of traditional Hakka Living System. Procedia Soc. Behav. Sci. 2012, 57, 255–260. [Google Scholar] [CrossRef] [Green Version]
- Fura, B.; Wang, Q. The level of socioeconomic development of EU countries and the state of ISO 14001 certification. Qual. Quant. 2017, 51, 103–119. [Google Scholar] [CrossRef] [PubMed] [Green Version]
- Grzebyk, M.; Stec, M. Sustainable development in EU countries: Concept and rating of levels of development. Sustain. Dev. 2015, 23, 110–123. [Google Scholar] [CrossRef]
- Hinterberger, F.; Omann, I.; Stocker, A. Employment and Environment in a Sustainable Europe. Empirica 2002, 29, 113–130. [Google Scholar] [CrossRef]
- Lambregts, B.; Janssen-Jansen, L.; Haran, N. Effective governance for competitive region in Europe: The difficult case of the Randstad. GeoJournal 2008, 72, 45–57. [Google Scholar] [CrossRef] [Green Version]
- European Commission (EC). Closing the Loop—An EU Action Plan for the Circular Economy 2015. Available online: https://eur-lex.europa.eu/resource.html?uri=cellar:8a8ef5e8-99a0-11e5-b3b7-01aa75ed71a1.0012.02/DOC_1&format=PDF (accessed on 15 January 2019).
- Schanes, K.; Dobering, K.; Gözet, B. Food waste matters—A systematic review of household food waste practices and their policy implications. J. Clean. Prod. 2018, 182, 978–991. [Google Scholar] [CrossRef]
- Filho, W.L.; Saari, U.; Fedoruk, M.; Iital, A.; Moora, H.; Klöga, M.; Voronova, V. An overview of the problems posed by plastic products and the role of extended producer responsibility in Europe. J.Clean. Prod. 2019, 214, 550–558. [Google Scholar] [CrossRef]
- Marino, A.; Pariso, P. Comparing European countries’ performances in the transition towards the Circular Economy. Sci. Total Environ. 2020, 729, 138–142. [Google Scholar] [CrossRef]
- Giordano, C.; Falasconi, L.; Cicatiello, C.; Pancino, B. The role of food waste hierarchy in addressing policy and research: A comparative analysis. J. Clean. Prod. 2020, 252, 119–617. [Google Scholar] [CrossRef]
- Surak, S.M. Extended Producer Responsibility. Encyclopedia Britannica. 5 December 2018. Available online: https://www.britannica.com/topic/extended-producer-responsibility (accessed on 21 November 2020).
- Shirvanimoghaddam, K.; Motamed, B.; Ramakrishna, S.; Naebe, M. Death by waste: Fashion and textile circular economy case. Sci. Total Environ. 2020, 718, 137–317. [Google Scholar] [CrossRef]
- Andersen, M.S. An introductory note on the environmental economics of the circular economy. Sustain. Sci. 2007, 2, 133–140. [Google Scholar] [CrossRef]
- Geisendorf, S.; Pietrulla, F. The circular economy and circular economic concepts—A literature analysis and redefinition. Thunderbird Int. Bus. Rev. 2017, 60, 771–782. [Google Scholar] [CrossRef]
- Virtanen, M.; Manskinen, K.; Uusitalo, V.; Syvänne, J.; Cura, K. Regional material flow tools to promote circular economy. J. Clean. Prod. 2019, 235, 1020–1025. [Google Scholar] [CrossRef]
- Saidani, M.; Yannou, B.; Leroy, Y.; Cluzel, F.; Kendall, A. A taxonomy of circular economy indicators. J. Clean. Prod. 2019, 207, 542–559. [Google Scholar] [CrossRef] [Green Version]
- Park, K.; Kremer, G. Text mining-based categorization and user perspective analysis of environmental sustainability indicators for manufacturing and service systems. Ecol. Indicat. 2017, 72, 803–820. [Google Scholar] [CrossRef]
- Foray, D. Smart Specialization: Opportunities and Challenges for Regional Innovation Policy; Routledge: Abingdon, UK; New York, NY, USA, 2015; pp. 21–30. [Google Scholar]
- Elia, V.; Gnoni, M.G.; Torense, F. Measuring circular economy strategies through index methods: A critical analysis. J. Clean. Prod. 2017, 142 Pt 2, 2741–2751. [Google Scholar] [CrossRef]
- Moraga, G.; Huysveld, S.; Mathieux, F.; Blengini, G.A.; Alaerts, L.; Van Acker, K.; de Meester, S.; Dewulf, J. Circular economy indicators: What do they measure. Resour. Conserv. Recycl. 2019, 146, 452–461. [Google Scholar] [CrossRef] [PubMed]
- Stahel, W.R. Policy for material efficiency—Sustainable taxation as a departure from the throwaway society. Phil. Trans. R. Soc. A 2013, 371, 20110567. [Google Scholar] [CrossRef] [PubMed]
- Eurostat Database. Available online: https://ec.europa.eu/eurostat/data/database (accessed on 15 December 2019).
- European Commission (EC). Circular Economy: Implementation of the Circular Economy Action Plan 2018. Available online: http://ec.europa.eu/environment/circular-economy/index_en.htm (accessed on 15 January 2019).
- Domenech, T.; Bleischwitz, R.; Doranova, A.; Panayotopoulos, D.; Roman, L. Mapping Industrial Symbiosis Development in Europe_ typologies of networks, characteristics, performance and contribution to the Circular Economy. Resour. Conserv. Recycl. 2019, 141, 76–98. [Google Scholar] [CrossRef]
- Desrochers, P. Regional development and inter-industry recycling linkages: Some historical perspectives. Entrep. Reg. Dev. 2002, 14, 49–65. [Google Scholar] [CrossRef]
- Millar, N.; McLaughlin, E.; Börger, T. The Circular Economy: Swings and Roundabouts? Ecol. Econ. 2019, 158, 11–19. [Google Scholar] [CrossRef] [Green Version]
- García-Barragán, J.F.; Eyckmans, J.; Rousseau, S. Defining and Measuring the Circular Economy: A Mathematical Approach. Ecol. Econ. 2019, 157, 369–372. [Google Scholar] [CrossRef]
- Reike, D.; Walter, J.V.; Vermeulen, W.J.V.; Witjes, S. The circular economy: New or Refurbished as CE 3.0?—Exploring Controversies in the Conceptualization of the Circular Economy through a Focus on History and Resource Value Retention Options. Resour. Conserv. Recycl. 2018, 135, 246–264. [Google Scholar] [CrossRef]
- Avdiushchenko, A. Toward a Circular Economy Regional Monitoring Framework for European Regions: Conceptual Approach. Sustainability 2018, 10, 4398. [Google Scholar] [CrossRef] [Green Version]
- Sassanelli, C.; Rosa, P.; Rocca, R.; Terzi, S. Circular economy performance assessment methods: A systematic literature review. J. Clean. Prod. 2019, 229, 440–453. [Google Scholar] [CrossRef]
- Smol, M.; Kulczycka, J.; Avdiushchenko, A. Circular economy indicators in relation to eco-innovation in European regions. Clean. Technol. Environ. Policy 2017, 19, 669–678. [Google Scholar] [CrossRef] [Green Version]
- Căutișanu, C.; Asandului, L.; Borza, M.; Turturean, C. Quantitative Approach to Circular Economy in the OECD Countries. Amfiteatru Econ. 2018, 20, 262–277. [Google Scholar] [CrossRef]
- Iacovidou, E.; Velis, C.A.; Purnell, P.; Zwiner, O.; Brown, A.; Hahladakis, J.; Millward-Hopikins, J.; Williams, P.T. Metrics for optimising the multi-dimensional value of resources recovered from waste in a circular economy: A critical review. J. Clean. Prod. 2017, 166, 910–938. [Google Scholar] [CrossRef]
- Haupt, M.; Hellweg, S. Measuring the environmental sustainability of a circular economy. Environ. Sustain. Indic. 2019, 1–2, 100005. [Google Scholar] [CrossRef]
- Stahel, W.R. The circular economy. Nature 2016, 531, 435–438. [Google Scholar] [CrossRef] [Green Version]
- Pociecha, J.; Zając, K. Cluster analysis methods and regression modelling. Control. Cybern. 1989, 18, 69–80. [Google Scholar]
- European Commission (EC). How Is the EU Progressing towards the Circular Economy? 2018. Available online: https://ec.europa.eu/eurostat/documents/2995521/8587408/8-16012018-AP-EN.pdf/aaaaf8f4-75f4-4879-8fea-6b2c27ffa1a2 (accessed on 15 January 2019).
- Morone, P.; Navia, R. New consumption and production models for a circular economy. Waste Manag. Res. 2016, 36, 489–490. [Google Scholar] [CrossRef] [Green Version]
- Silva, A.; Rosano, M.; Stocker, L.; Gorissen, L. From waste to sustainable materials management: Three case studies of the transition journey. Waste Manag. 2017, 61, 547–557. [Google Scholar] [CrossRef]
- European Commission (EC). Sustainable Supply of Raw Materials. Optimal Recycling Business Innovation Observatory Contract No 190/PP/ENT/CIP/12/C/N03C01 2016. Available online: https://ec.europa.eu (accessed on 5 June 2020).
- European Commission (EC). The Efficient Functioning of Waste Markets in the European Union, 2016. Available online: https://ec.europa.eu/environment/waste/studies/pdf/waste_market_study.pdf (accessed on 5 June 2020).
- Kukuła, K. Metoda Unitaryzacji Zerowanej; Wydawnictwo Naukowe PWN: Warszawa, Poland, 2000; pp. 189–190. [Google Scholar]
- Walesiak, M. The application of multidimensional scaling to measure and asses changes in the level of social cohesion of the lower Silesia region in the period 2005–2015. Econometrics 2007, 3, 9–25. [Google Scholar] [CrossRef] [Green Version]
- Organisation for Economic Co-operation and Development (OECD). Business Models for the Circular Economy: Opportunities and Challenges for Policy; OECD Publishing: Paris, France, 2019; Available online: https://www.oecd-ilibrary.org/environment/business-models-for-the-circular-economy_g2g9dd62-en (accessed on 24 September 2019). [CrossRef]
- Derej, W. Eco-innovations and European Union development based on the example of the municipal waste economy. Studia Ekonomiczne. Zeszyty Naukowe Uniwersytetu Ekonomicznego w Katowicach 2017, 324, 20–32. [Google Scholar]
- World Bank. Little Green Data Book 2016. Available online: http://data.worldbankorg/products/data-books/little-data-book/little-green-data-book (accessed on 24 September 2019).
Figure 1.
Linear vs. circular economy.
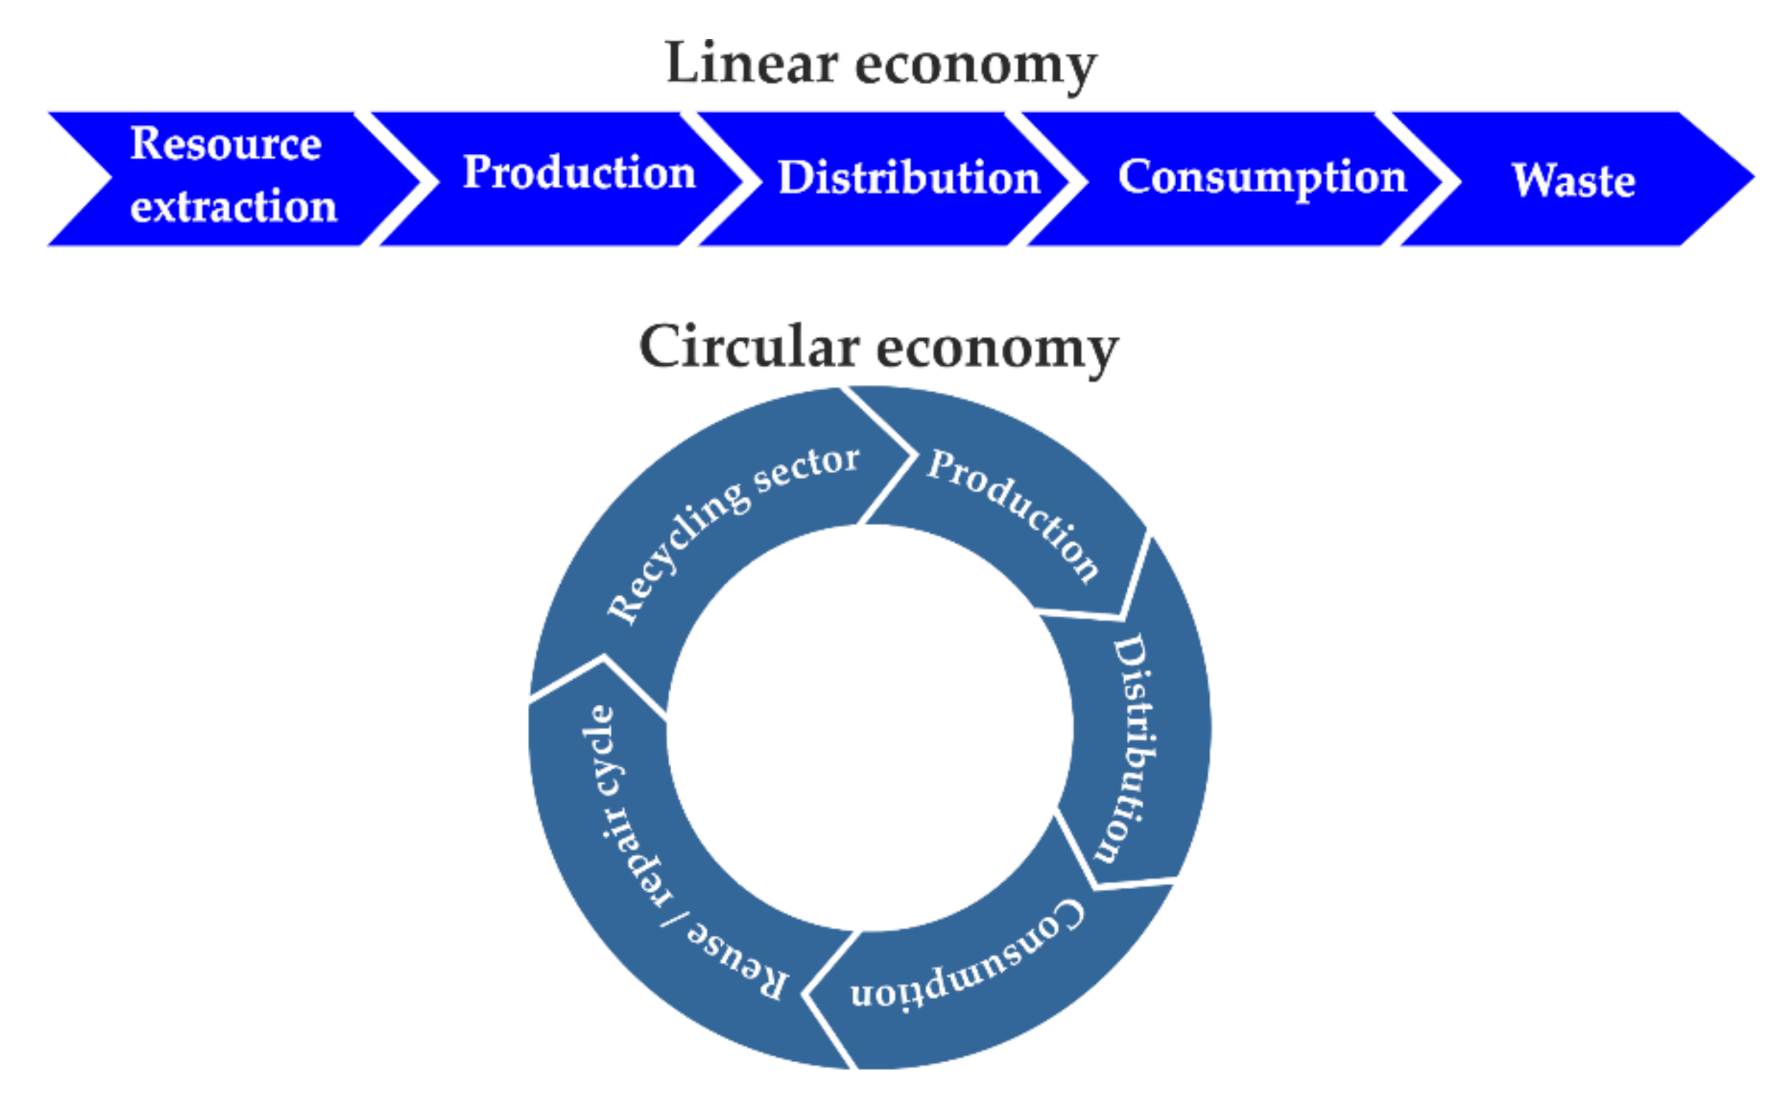
Figure 2.
EU countries CE classification (2010).
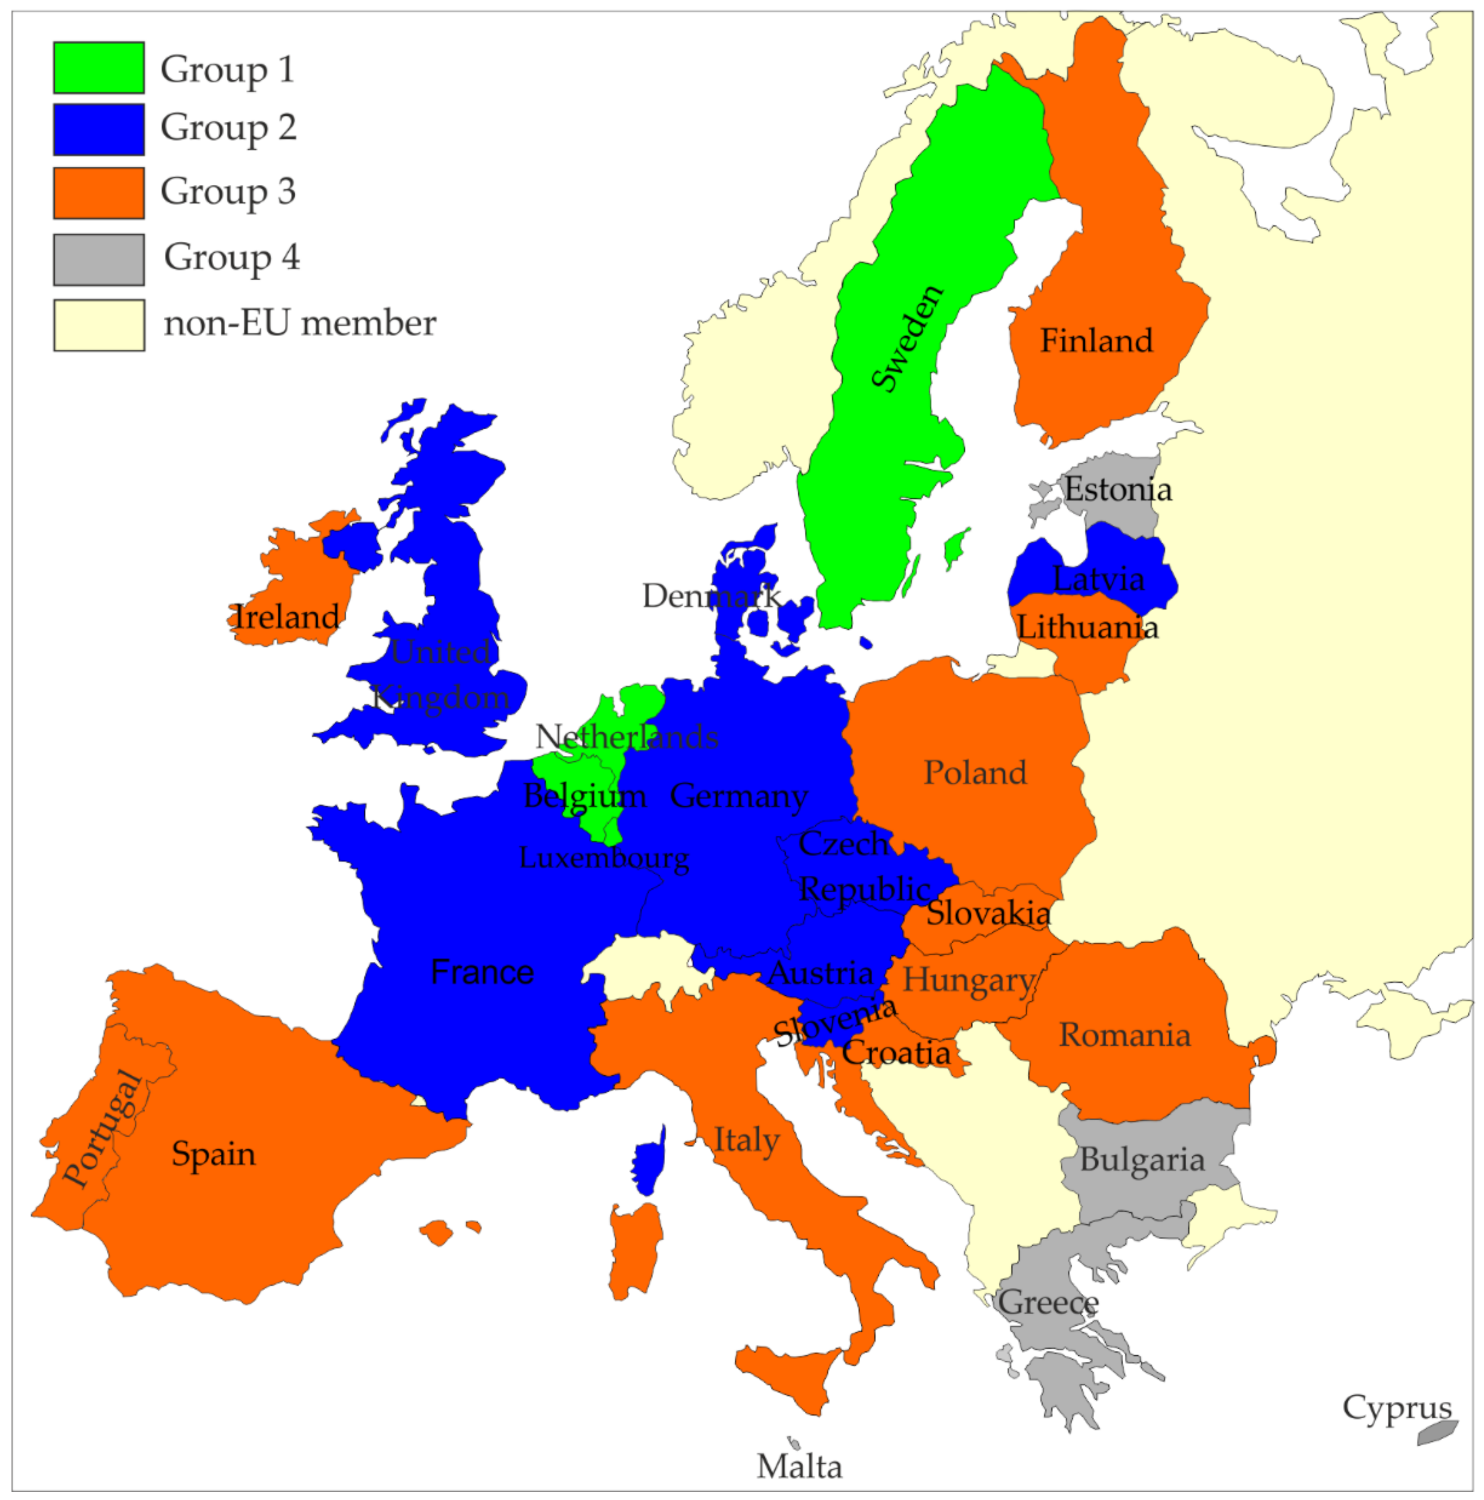
Figure 3.
EU countries CE classification (2016).

Table 1.
Descriptive statistics of variables in 2010 and 2016.
| Indicator | Maximum Value | Minimum Value | Mean | Coefficient of Variation (CV) in % | Coefficient of Asymmetry (CA) | ||
|---|---|---|---|---|---|---|---|
| 2010 | |||||||
| X1 | Denmark | 762.00 | Estonia | 305.00 | 490.29 | 25.28 | 0.13 |
| X2 | Estonia | 779.00 | Luxembourg | 38.00 | 118.00 | 122.16 | 3.84 |
| X3 | Estonia | 34.40 | Latvia | 3.60 | 12.02 | 52.67 | 1.87 |
| X4 | Germany | 62.50 | Croatia | 4.00 | 27.73 | 61.58 | 0.46 |
| X5 | Luxembourg | 87.00 | Greece | 18.00 | 46.11 | 35.01 | 0.36 |
| X6 | Denmark | 84.00 | Malta | 28.50 | 59.96 | 19.57 | −0.50 |
| X7 | Slovenia | 67.30 | Poland | 20.10 | 34.59 | 30.87 | 1.15 |
| X8 | Sweden | 167.20 | Croatia | 0.40 | 43.09 | 77.98 | 1.80 |
| X9 | Sweden | 55.30 | Cyprus | 11.50 | 26.83 | 37.94 | 0.59 |
| X10 | Austria | 182.00 | Bulgaria Cyprus Malta | 0.00 | 49.32 | 102.30 | 1.01 |
| X11 | Netherlands | 100.00 | Grece Cyprus | 0.00 | 67.07 | 52.05 | −0.95 |
| X12 | Netherlands | 25.40 | Latvia | 0.70 | 8.15 | 78.13 | 1.23 |
| X13 | Sweden | 86.83 | Cyprus | 0.07 | 19.29 | 127.17 | 1.73 |
| X14 | Netherlands | 360.45 | Luxembourg | 0.11 | 81.14 | 116.17 | 1.97 |
| X15 | Luxembourg | 5651.45 | Cyprus | 0.73 | 307.72 | 337.10 | 5.15 |
| X16 | Luxembourg | 536.56 | Malta | 9.27 | 140.42 | 88.34 | 1.57 |
| X17 | Luxembourg | 3.69 | Cyprus Malta Slovenia Slovakia | 0.00 | 0.63 | 122.68 | 2.71 |
| 2016 | |||||||
| X1 | Denmark | 777.00 | Romania | 261.00 | 476.25 | 23.51 | 0.52 |
| X2 | Estonia | 646.00 | Luxembourg | 33.00 | 108.81 | 115.40 | 3.49 |
| X3 | Estonia | 33.80 | Romania | 4.10 | 12.58 | 56.30 | 1.52 |
| X4 | Germany | 66.10 | Malta | 7.10 | 37.19 | 39.22 | −0.14 |
| X5 | Luxembourg | 75.33 | Greece | 13.67 | 48.11 | 32.90 | −0.37 |
| X6 | Belgium | 81.90 | Malta | 38.73 | 63.69 | 14.27 | −0.48 |
| X7 | Lithuania | 74.40 | Estonia | 24.60 | 42.01 | 27.62 | 0.72 |
| X8 | Portugal | 103.40 | Croatia | 3.00 | 41.73 | 59.94 | 0.61 |
| X9 | Bulgaria | 105.20 | Malta | 11.50 | 43.11 | 46.60 | 1.29 |
| X10 | Austria | 181.00 | Malta | 0.00 | 63.89 | 73.64 | 0.73 |
| X11 | Luxembourg | 100.00 | Greece | 0.00 | 85.25 | 24.50 | −2.75 |
| X12 | Netherlands | 29.00 | Romania | 1.50 | 8.87 | 76.16 | 1.3 |
| X13 | Slovenia | 54.59 | Malta | 0.09 | 13.36 | 108.40 | 1.47 |
| X14 | Netherlands | 312.73 | Luxembourg | 0.07 | 84.30 | 108.19 | 1.35 |
| X15 | Luxembourg | 4100.46 | Cyprus | 0.45 | 245.89 | 306.32 | 5.05 |
| X16 | Luxembourg | 391.36 | Malta | 3.65 | 120.40 | 82.83 | 1.00 |
| X17 | Luxembourg | 6.23 | Greece | 0.03 | 0.74 | 151.69 | 4.40 |
Table 2.
Values of a synthetic measure () for EU countries.
| EU Countries | 2010 | 2012 | 2014 | 2016 |
|---|---|---|---|---|
| Austria | 0.396 | 0.396 | 0.399 | 0.396 |
| Belgium | 0.409 | 0.407 | 0.419 | 0.434 |
| Bulgaria | 0.252 | 0.260 | 0.275 | 0.305 |
| Croatia | 0.287 | 0.316 | 0.315 | 0.330 |
| Cyprus | 0.231 | 0.275 | 0.273 | 0.274 |
| Czech Republic | 0.376 | 0.390 | 0.406 | 0.406 |
| Denmark | 0.377 | 0.355 | 0.390 | 0.391 |
| Estonia | 0.242 | 0.295 | 0.297 | 0.253 |
| Finland | 0.328 | 0.325 | 0.365 | 0.352 |
| France | 0.337 | 0.345 | 0.362 | 0.358 |
| Germany | 0.381 | 0.383 | 0.377 | 0.379 |
| Greece | 0.241 | 0.228 | 0.222 | 0.241 |
| Hungary | 0.305 | 0.293 | 0.328 | 0.336 |
| Ireland | 0.312 | 0.336 | 0.350 | 0.337 |
| Italy | 0.328 | 0.339 | 0.331 | 0.345 |
| Latvia | 0.356 | 0.412 | 0.369 | 0.362 |
| Lithuania | 0.327 | 0.352 | 0.365 | 0.405 |
| Luxembourg | 0.530 | 0.555 | 0.668 | 0.552 |
| Malta | 0.207 | 0.265 | 0.314 | 0.258 |
| Netherlands | 0.437 | 0.444 | 0.436 | 0.449 |
| Poland | 0.312 | 0.329 | 0.349 | 0.358 |
| Portugal | 0.303 | 0.329 | 0.351 | 0.351 |
| Romania | 0.290 | 0.334 | 0.325 | 0.321 |
| Slovakia | 0.301 | 0.335 | 0.338 | 0.339 |
| Slovenia | 0.358 | 0.411 | 0.432 | 0.417 |
| Spain | 0.310 | 0.316 | 0.325 | 0.330 |
| Sweden | 0.415 | 0.411 | 0.388 | 0.389 |
| United Kingdom | 0.346 | 0.350 | 0.355 | 0.364 |
Note: Calculations were conducted with the use of MS Excel.
Table 3.
EU countries rank positions.
| EU Countries | 2010 | 2012 | 2014 | 2016 | Position Change 2016 vs. 2010 |
|---|---|---|---|---|---|
| Austria | 5 | 7 | 6 | 7 | −2 |
| Belgium | 4 | 6 | 4 | 3 | +1 |
| Bulgaria | 24 | 27 | 26 | 24 | 0 |
| Croatia | 23 | 21 | 23 | 21 | +2 |
| Cyprus | 27 | 25 | 27 | 25 | +2 |
| Czech Republic | 8 | 8 | 5 | 5 | +3 |
| Denmark | 7 | 10 | 7 | 8 | −1 |
| Estonia | 25 | 23 | 25 | 27 | −2 |
| Finland | 13 | 20 | 12 | 15 | −2 |
| France | 12 | 13 | 13 | 14 | −2 |
| Germany | 6 | 9 | 9 | 10 | −4 |
| Greece | 26 | 28 | 28 | 28 | −2 |
| Hungary | 19 | 24 | 20 | 20 | −1 |
| Ireland | 16 | 15 | 16 | 19 | −3 |
| Italy | 14 | 14 | 19 | 17 | −3 |
| Latvia | 10 | 3 | 10 | 12 | −2 |
| Lithuania | 15 | 11 | 11 | 6 | +9 |
| Luxembourg | 1 | 1 | 1 | 1 | 0 |
| Malta | 28 | 26 | 24 | 26 | +2 |
| Netherlands | 2 | 2 | 2 | 2 | 0 |
| Poland | 17 | 19 | 17 | 13 | +4 |
| Portugal | 20 | 18 | 15 | 16 | +4 |
| Romania | 22 | 17 | 22 | 23 | −1 |
| Slovakia | 21 | 16 | 18 | 18 | +3 |
| Slovenia | 9 | 4 | 3 | 4 | +5 |
| Spain | 18 | 22 | 21 | 22 | −4 |
| Sweden | 3 | 5 | 8 | 9 | −6 |
| United Kingdom | 11 | 12 | 14 | 11 | 0 |
Table 4.
Classification of EU countries for CE development level () in 2010 and in 2016.
| Group | Level of CE | Classification of EU Countries | |
|---|---|---|---|
| 2010 | 2016 | ||
| Group 1 | high | Luxembourg, Netherlands, Sweden, Belgium | Luxembourg, Netherlands, Belgium |
| Group 2 | medium-high | Austria, Germany, Denmark, Czech Republic, Slovenia, Latvia, United Kingdom, France | Slovenia, Czech Republic, Lithuania, Austria, Denmark, Sweden, Germany, United Kingdom, Latvia, Poland |
| Group 3 | medium-low | Finland, Italy, Lithuania, Ireland, Poland, Spain, Hungary, Portugal, Slovakia, Romania, Croatia | France, Finland, Portugal, Italy, Slovakia, Ireland, Hungary, Croatia, Spain, Romania, Bulgaria |
| Group 4 | low | Bulgaria, Estonia, Greece, Cyprus, Malta | Cyprus, Malta, Estonia, Greece |
Table 5.
Classification of EU countries for CE development level () in 2010 and in 2016.
| Group | Level of CE | Classification of EU Countries (I. Production and Consumption) | |
|---|---|---|---|
| 2010 | 2016 | ||
| Group 1 | high | Latvia, Czech Republic, Croatia Slovakia, Romania | Romania, Czech Republic, Latvia |
| Group 2 | medium–high | Lithuania, Poland, Sweden, Hungary, Portugal, Spain, Austria, Slovenia, Cyprus | Croatia, Hungary, Slovakia, Sweden, Poland, Lithuania, Portugal, Finland, Slovenia, Cyprus, Austria, Ireland |
| Group 3 | medium–low | France, Finland, Greece, Germany, Malta, Italy, United Kingdom, Ireland, Luxembourg, Denmark, Belgium | France, Spain, Luxembourg, Malta, Greece, Germany, United Kingdom, Italy, Denmark, Bulgaria |
| Group 4 | low | Netherlands, Bulgaria, Estonia | Belgium, Netherlands, Estonia |
Table 6.
Classification of EU countries for CE development level () in 2010 and in 2016.
| Group | Level of CE | Classification of EU Countries (II. Waste Management) | |
|---|---|---|---|
| 2010 | 2016 | ||
| Group 1 | high | Netherlands, Austria, Sweden, Denmark, Germany, Luxembourg | Netherlands, Lithuania, Belgium, Denmark |
| Group 2 | medium–high | Belgium, United Kingdom, Italy, Ireland, Slovenia, Czech Republic | Germany, Slovenia, Austria, Luxembourg, Italy, Czech Republic, United Kingdom, Portugal, Sweden, Bulgaria |
| Group 3 | medium–low | France, Portugal, Spain, Estonia, Bulgaria, Lithuania, Hungary, Poland, Slovakia, Latvia, Finland | Ireland, Spain, Poland, France, Slovakia, Finland, Latvia, Hungary, Croatia, Estonia |
| Group 4 | low | Romania, Croatia, Greece, Cyprus, Malta | Romania, Cyprus, Malta, Greece |
Table 7.
Classification of EU countries for CE development level () in 2010 and in 2016.
| Group | Level of CE | Classification of EU Countries (III. Secondary Raw Materials) | |
|---|---|---|---|
| 2010 | 2016 | ||
| Group 1 | high | Luxembourg, Netherlands, Belgium | Netherlands, Luxembourg, Belgium |
| Group 2 | medium–high | Estonia, Denmark, Slovenia, Sweden, United Kingdom, France | Slovenia, Estonia, Denmark, United Kingdom, France, Sweden, Austria |
| Group 3 | medium–low | Latvia, Germany, Austria, Finland, Czech Republic, Lithuania, Italy, Spain, Ireland, Poland, Malta Bulgaria, Hungary, Slovakia, Romania, Greece, Cyprus, Croatia, Portugal | Germany, Lithuania, Italy, Latvia, Czech Republic, Malta, Slovakia, Poland, Hungary, Croatia, Spain, Ireland, Finland, Greece, Bulgaria, Portugal, Cyprus |
| Group 4 | low | − | Romania |
Table 8.
Classification of EU countries for CE development level () in 2010 and in 2016.
| Group | Level of CE | Classification of EU Countries (IV. Competitiveness and Innovation) | |
|---|---|---|---|
| 2010 | 2016 | ||
| Group 1 | high | Luxembourg, Finland | Luxembourg |
| Group 2 | medium–high | Austria, Belgium, Germany, Poland, Czech Republic, France, Hungary, Latvia, Lithuania | Finland, Austria, Germany, Poland, Belgium, Netherlands, France |
| Group 3 | medium–low | Netherlands, Italy Ireland, United Kingdom, Romania, Spain, Portugal, Croatia, Estonia, Bulgaria, Denmark, Sweden, Greece, Cyprus, Malta, Slovenia, Slovakia | Czech Republic, Denmark, Estonia, Ireland, Latvia, Italy, Slovenia, Spain, Sweden, United Kingdom, Hungary, Lithuania, Cyprus, Malta, Romania, Portugal, Bulgaria, Slovakia, Croatia, Greece |
| Group 4 | low | − | − |
Publisher’s Note: MDPI stays neutral with regard to jurisdictional claims in published maps and institutional affiliations. |
© 2020 by the authors. Licensee MDPI, Basel, Switzerland. This article is an open access article distributed under the terms and conditions of the Creative Commons Attribution (CC BY) license (http://creativecommons.org/licenses/by/4.0/).
Share and Cite
MDPI and ACS Style
Fura, B.; Stec, M.; Miś, T. Statistical Evaluation of the Level of Development of Circular Economy in European Union Member Countries. Energies 2020, 13, 6401. https://doi.org/10.3390/en13236401
AMA Style
Fura B, Stec M, Miś T. Statistical Evaluation of the Level of Development of Circular Economy in European Union Member Countries. Energies. 2020; 13(23):6401. https://doi.org/10.3390/en13236401
Chicago/Turabian StyleFura, Barbara, Małgorzata Stec, and Teresa Miś. 2020. "Statistical Evaluation of the Level of Development of Circular Economy in European Union Member Countries" Energies 13, no. 23: 6401. https://doi.org/10.3390/en13236401
Note that from the first issue of 2016, this journal uses article numbers instead of page numbers. See further details here.