Article

Quantitative Limit State Assessment of a 3-Inch Carbon Steel Pipe Tee in a Nuclear Power Plant Using a Damage Index

Seismic Research and Test Center, Pusan National University, 49 Busandaehak-ro, Yangsan 50612, Korea
*
Authors to whom correspondence should be addressed.
Energies 2020, 13(23), 6395; https://doi.org/10.3390/en13236395
Submission received: 28 October 2020 / Revised: 29 November 2020 / Accepted: 1 December 2020 / Published: 3 December 2020

Abstract

:
Seismic motions are likely to cause large displacements in nuclear power plants because the main mode of their piping systems is dominated by the low-frequency region. Additionally, large relative displacement may occur in the piping systems because their supports are installed in several places, and each support is subjected to different seismic motions. Therefore, to assess the seismic performance of a piping system, the relative displacement repeated by seismic motions must be considered. In this study, in-plane cyclic loading tests were conducted under various constant amplitudes using test specimens composed of SCH 40 3-inch pipes and a tee in the piping system of a nuclear power plant. Additionally, an attempt was made to quantitatively express the failure criteria using a damage index based on the dissipated energy that used the force–displacement and moment–deformation angle relationships. The failure mode was defined as the leakage caused by a through-wall crack, and the failure criteria were compared and analyzed using the damage index of Park and Ang and that of Banon. Additionally, the method of defining the yield point required to calculate the damage index was examined. It was confirmed that the failure criteria of the SCH 40 3-inch carbon steel pipe tee can be effectively expressed using the damage index.

1. Introduction

Energy plants, including nuclear power plants, have many piping systems that transport fluids and gases. The integrity of these piping systems has a very important impact on the service life of nuclear power plants. Because nuclear power plants require a high level of safety, damage to their piping systems may cause significant environmental and economic losses.
Piping systems may be seriously damaged due to their excessive relative displacement caused by external forces, such as seismic motions. Such displacement may occur between the structures of the piping systems when seismic isolation systems are installed. As the supports of piping systems are installed in several places, each support has different input seismic motions. For most piping systems, the primary natural frequency, which is the main dynamic characteristic, appears approximately between 1–10 Hz. Consequently, piping systems are likely to suffer from large relative displacements.
As piping systems have complicated structures, including components with various specifications, considerable time and effort are required to assess their seismic performance using the finite element method (FEM). In several studies, component tests are conducted on the vulnerable elements of piping systems. Based on the component test results, the seismic capacity of a piping system was assessed using FEM. Such studies have resulted in damage to the piping system, particularly in its elbow and tee fittings, which are structurally vulnerable elements [1,2,3]. Therefore, to reliably assess the seismic capacity of a piping system using FEM, various conditions must be considered in its component tests.
Since the Fukushima Daiichi nuclear disaster in 2011, studies to reassess and improve the seismic performance of nuclear power plant piping systems have been actively conducted on seamless pipes. In Japan, various experiments on elbow and tee fittings have been performed to examine the margin of seismic design for nuclear power plant piping systems. The elastic–plastic behavior, failure mode, and limit load were also analyzed using FEM [4,5]. Experiments have also been carried out to investigate the failure modes of major nuclear power plant piping components under cyclic loading [6], and to define the failure criteria of piping systems using the shaking table test [7]. Based on the results of these studies, the existing design methods that use linear analysis and stress-based criteria have been changed to methods that use inelastic analysis and strain-based criteria [8].
To examine the failure mode and failure criteria for low-cycle fatigue behavior, studies have analyzed the nonlinear behavior of pipe elbows under cyclic loading [9,10,11,12]. The seismic performance of carbon steel pipes and stainless steel pipes has also been assessed using the shaking table test and finite element analysis based on existing research results to examine the suitability of the seismic design criteria for various materials [2,13]. A study was conducted to examine the out-of-plane failure behavior of pipe tees using component tests and finite element analysis [14]. These studies highlighted the importance of defining the limit state, which is the actual failure of the vulnerable parts of piping systems, to ensure the safety of nuclear power plants [15,16].
In South Korea, studies have been conducted to improve the seismic performance of nuclear power plant piping systems and pressure vessels. Strain-based criteria have been developed for cases in which plastic deformation occurs in the major components of nuclear power plant piping systems under large seismic load conditions that exceed the design basis earthquake [17]. Additionally, studies have been conducted to assess the seismic fragility of nuclear power plant piping systems. Based on the results of the component test and the shaking table test, nonlinear finite element analysis was conducted to present seismic fragility curves [18,19,20]. Studies to examine the failure modes of the vulnerable parts of piping systems and to quantify leakage, which is the actual failure, have also been conducted based on the results of component tests to increase the reliability of seismic fragility analysis. As for the limit state of pipe elbows, the failure strain and the failure deformation angle, which were difficult to measure using conventional sensors, were measured using a non-contact measurement method based on image processing [21]. For pipe elbows, leakage lines and low-cycle fatigue curves for the moment–deformation angle relationship were presented using an image measurement system [22]. A study was conducted to examine the effect of the T/D ratio of the thickness (T) of a pipe elbow to its outer diameter (D) on the failure behavior [23]. The damage index of Park and Ang and that of Banon were used to quantitatively express the limit state of a pipe elbow [24]. A study was conducted to define the limit state of a pipe elbow using the damage index based on the dissipated energy [25]. Recently, studies have been conducted to present leakage lines and low-cycle fatigue curves under in-plane cyclic loading conditions of pipe tees [26,27].
The results of the previous studies revealed that the actual failure of a piping system is the leakage caused by a through-wall crack and that the structural damage mechanism due to an earthquake is the low-cycle fatigue due to large relative displacement that may cause plastic deformation. Therefore, the damage to a piping system under strong cyclic loading conditions, such as earthquakes, is the leakage caused by a through-wall crack that occurs due to damage accumulation.
In this study, in-plane cyclic loading tests were conducted via displacement control using test specimens composed of a tee and pipes in the piping system of a nuclear power plant. The tests were conducted using various constant amplitudes until leakage occurred due to a through-wall crack. From the test results, the cumulative dissipated energy based on the force–displacement (P–D) and moment–deformation angle (M–R) relationships were obtained, and the damage index was calculated using the damage indices presented by Park and Ang [28,29] and Banon [30,31], which can express cumulative damage. To calculate the damage index of Park and Ang and that of Banon, the yield point, which is the limit load, must be defined. Among the various methods of defining the yield point, the tangent intersection (TI) method [32] defines the point at which the tangent of the elastic slope meets the tangent of the plastic slope in the P–D curve as the limit load. This method is well established in the general P–D relationship and was used to calculate the damage index for pipe elbows [20,25]. However, it can be difficult to use if the general slope does not appear in the plastic region. Therefore, in this study, the yield point of a pipe tee, which is its limit load, was defined using the twice-elastic slope (TES) method [33] presented by the American Society of Mechanical Engineers (ASME) Boiler and the Pressure Vessel Code (Section III, Appendix II). The damage index for the P–D and M–R relationships was calculated using the defined yield point, as well as using the damage index of Park and Ang and that of Banon, and their differences were analyzed.

2. Test Specimen and Test Configuration

2.1. Test Specimen

In this study, test specimens were fabricated using pipes with dimensions widely used for piping in nuclear power plants. The test specimen had three ASME B36.10 M SA106 Grade B SCH 40 3-inch standard pipes welded to one ASTM A234 Grade WPB SCH 40 3-inch tee, and plastic deformation was concentrated on the central tee [34,35]. The pipes had an outer diameter of 88.9 mm and were 5.5 mm thick. As shown in Figure 1, three straight pipes with a length of approximately 4.3 times their outer diameter were connected to the tee through welding. The end of the vertical straight pipe had a steel plate that was 150 mm long and 25 mm thick so that it could be fixed to the chuck of a universal testing machine (UTM). To implement hinge points at both ends of the horizontal straight pipe, 25 mm thick steel materials with a ϕ30 hole was welded so that they could be connected to connection jigs using a pin. At the end of the vertical pipe of the test specimen, ϕ15 coupling taps were machined on both sides so that the pipe could be filled with water, so that internal pressure could be applied to it. These coupling taps were located at different heights to facilitate the injection of water. To apply the internal pressure, one coupling tap was connected to an air pump, and the other was sealed using a valve.

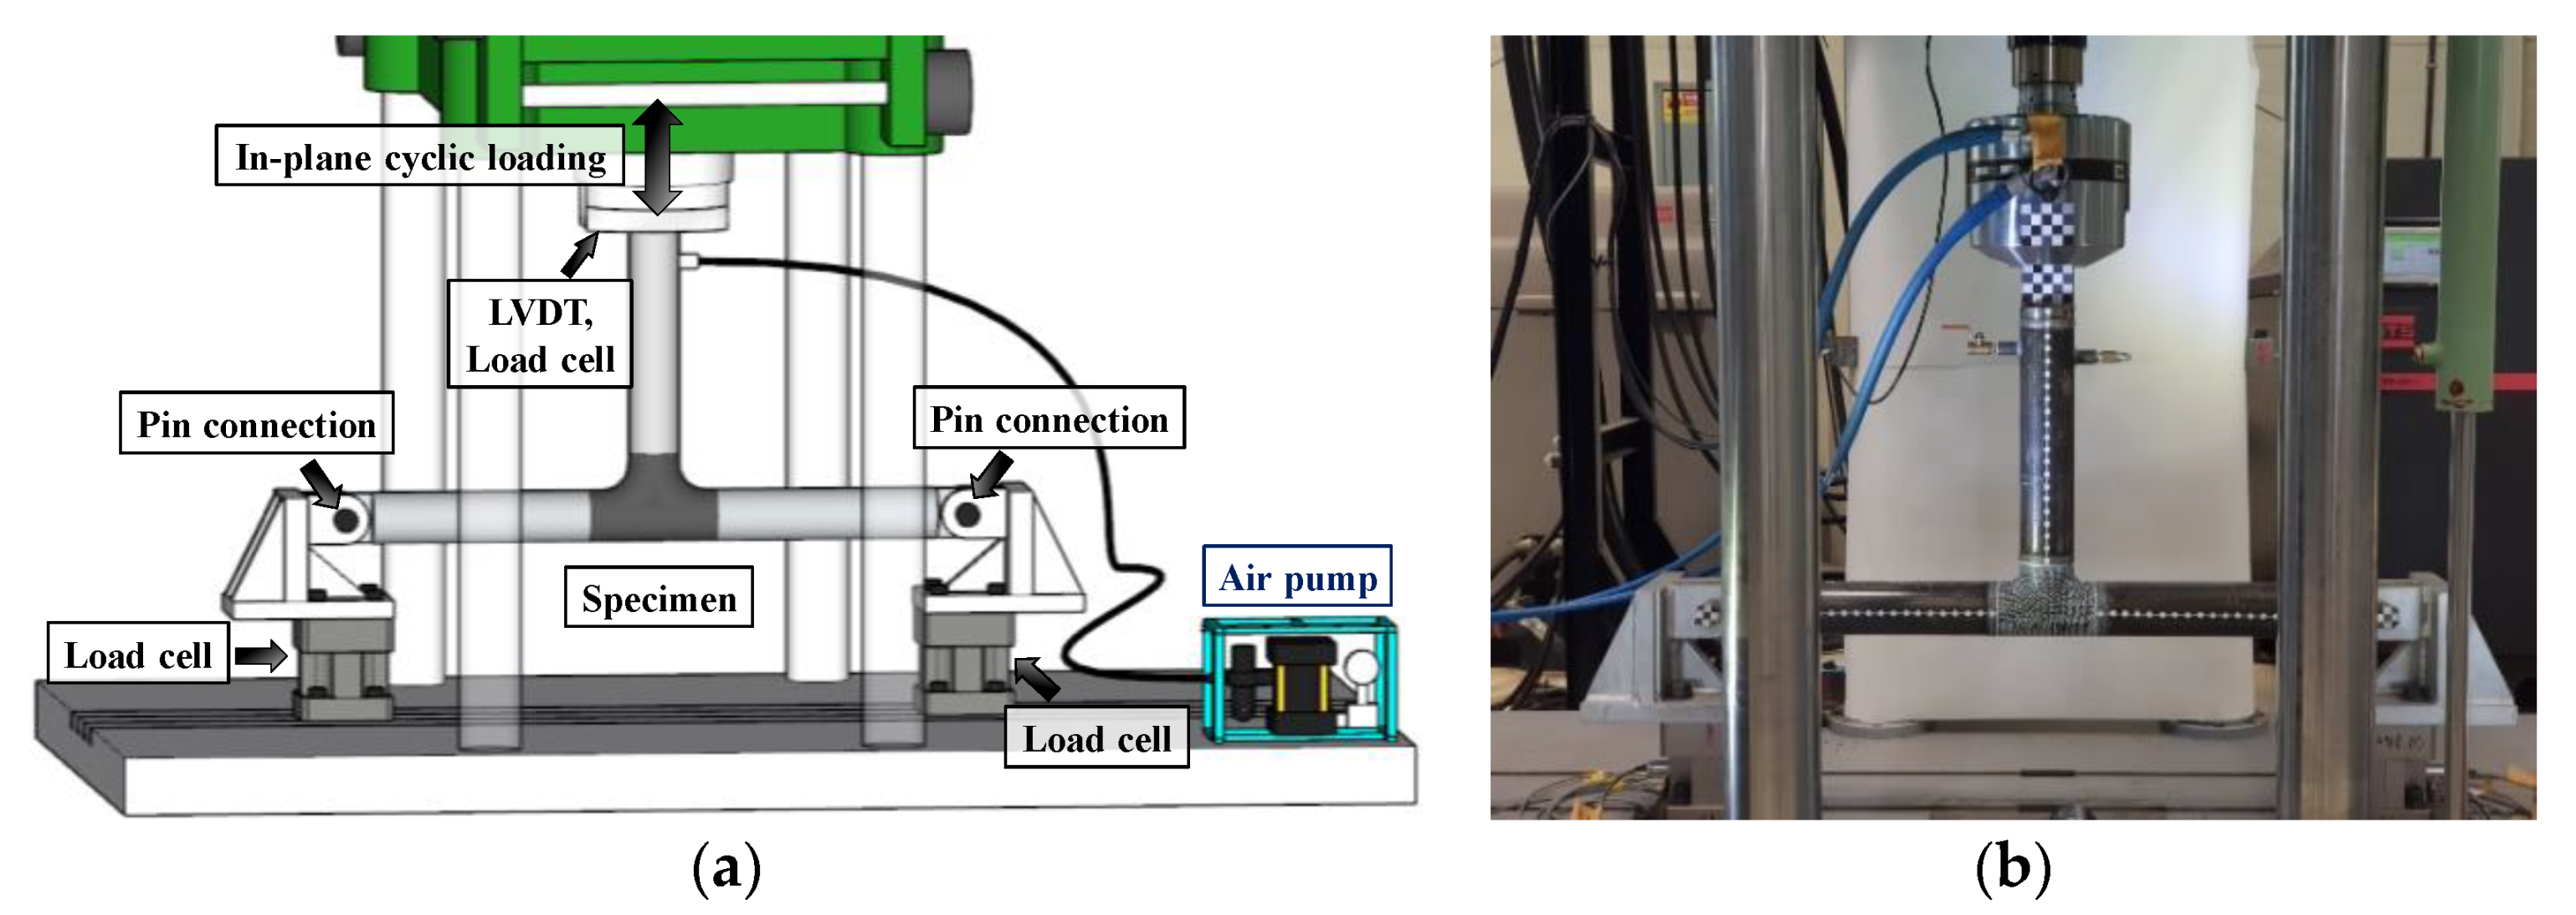
2.2. Test Configuration

In-plane cyclic loading tests were conducted using a 250 kN UTM. The maximum stroke was 250 mm. The lower part of the UTM had a grooved surface plate so that the upper structure could be fixed using a T-nut. The upper part of the test specimen was fixed to the chuck of the UTM, and its ends were connected to connection jigs using a pin, as shown in Figure 2a. Each connection jig was connected to a 3-axis load cell (Dacell, 3-axis, 200 kN), which was fixed to the surface plate of the UTM using four M20 bolts. Figure 2b shows the test specimen installed in the UTM.
All the tests were conducted under sine wave loading by displacement control, and the constant-amplitude displacement range was applied as the input load. The tests were conducted in the in-plane direction to prevent the occurrence of moment and torsion at the supports of the test specimen and to concentrate the nonlinear behavior on the tee. In-plane cyclic loading tests were conducted until leakage caused by a through-wall crack occurred in the test specimen. To confirm the leakage, the inside of the test specimen was filled with water, and an internal pressure of 3 MPa was applied using an air pump. The internal pressure was maintained during the test. The loading amplitude was considered to be ±20 mm or higher so that the collapse load point could be exceeded and sufficient plastic behavior could occur in the tee. Tests were also conducted for a ±10 mm loading amplitude to additionally consider the elastic–plastic behavior below the collapse load point. Therefore, in-plane cyclic loading tests were conducted using three test specimens for loading amplitudes of ±10, ±20, ±40, ±50, and ±80 mm.

3. Low-Cycle Fatigue Test

3.1. Failure Mode

In the in-plane cyclic loading tests, the failure mode of the pipe tee was leakage caused by a through-wall crack. Figure 3 shows a representative test specimen that exhibited leakage for a loading amplitude of ±80 mm. In all the test specimens, the leakage caused by a through-wall crack occurred slightly above the position in the tee, at which the transverse neutral axis met the vertical neutral axis. The through-wall crack propagated in the longitudinal direction along the vertical neutral axis.

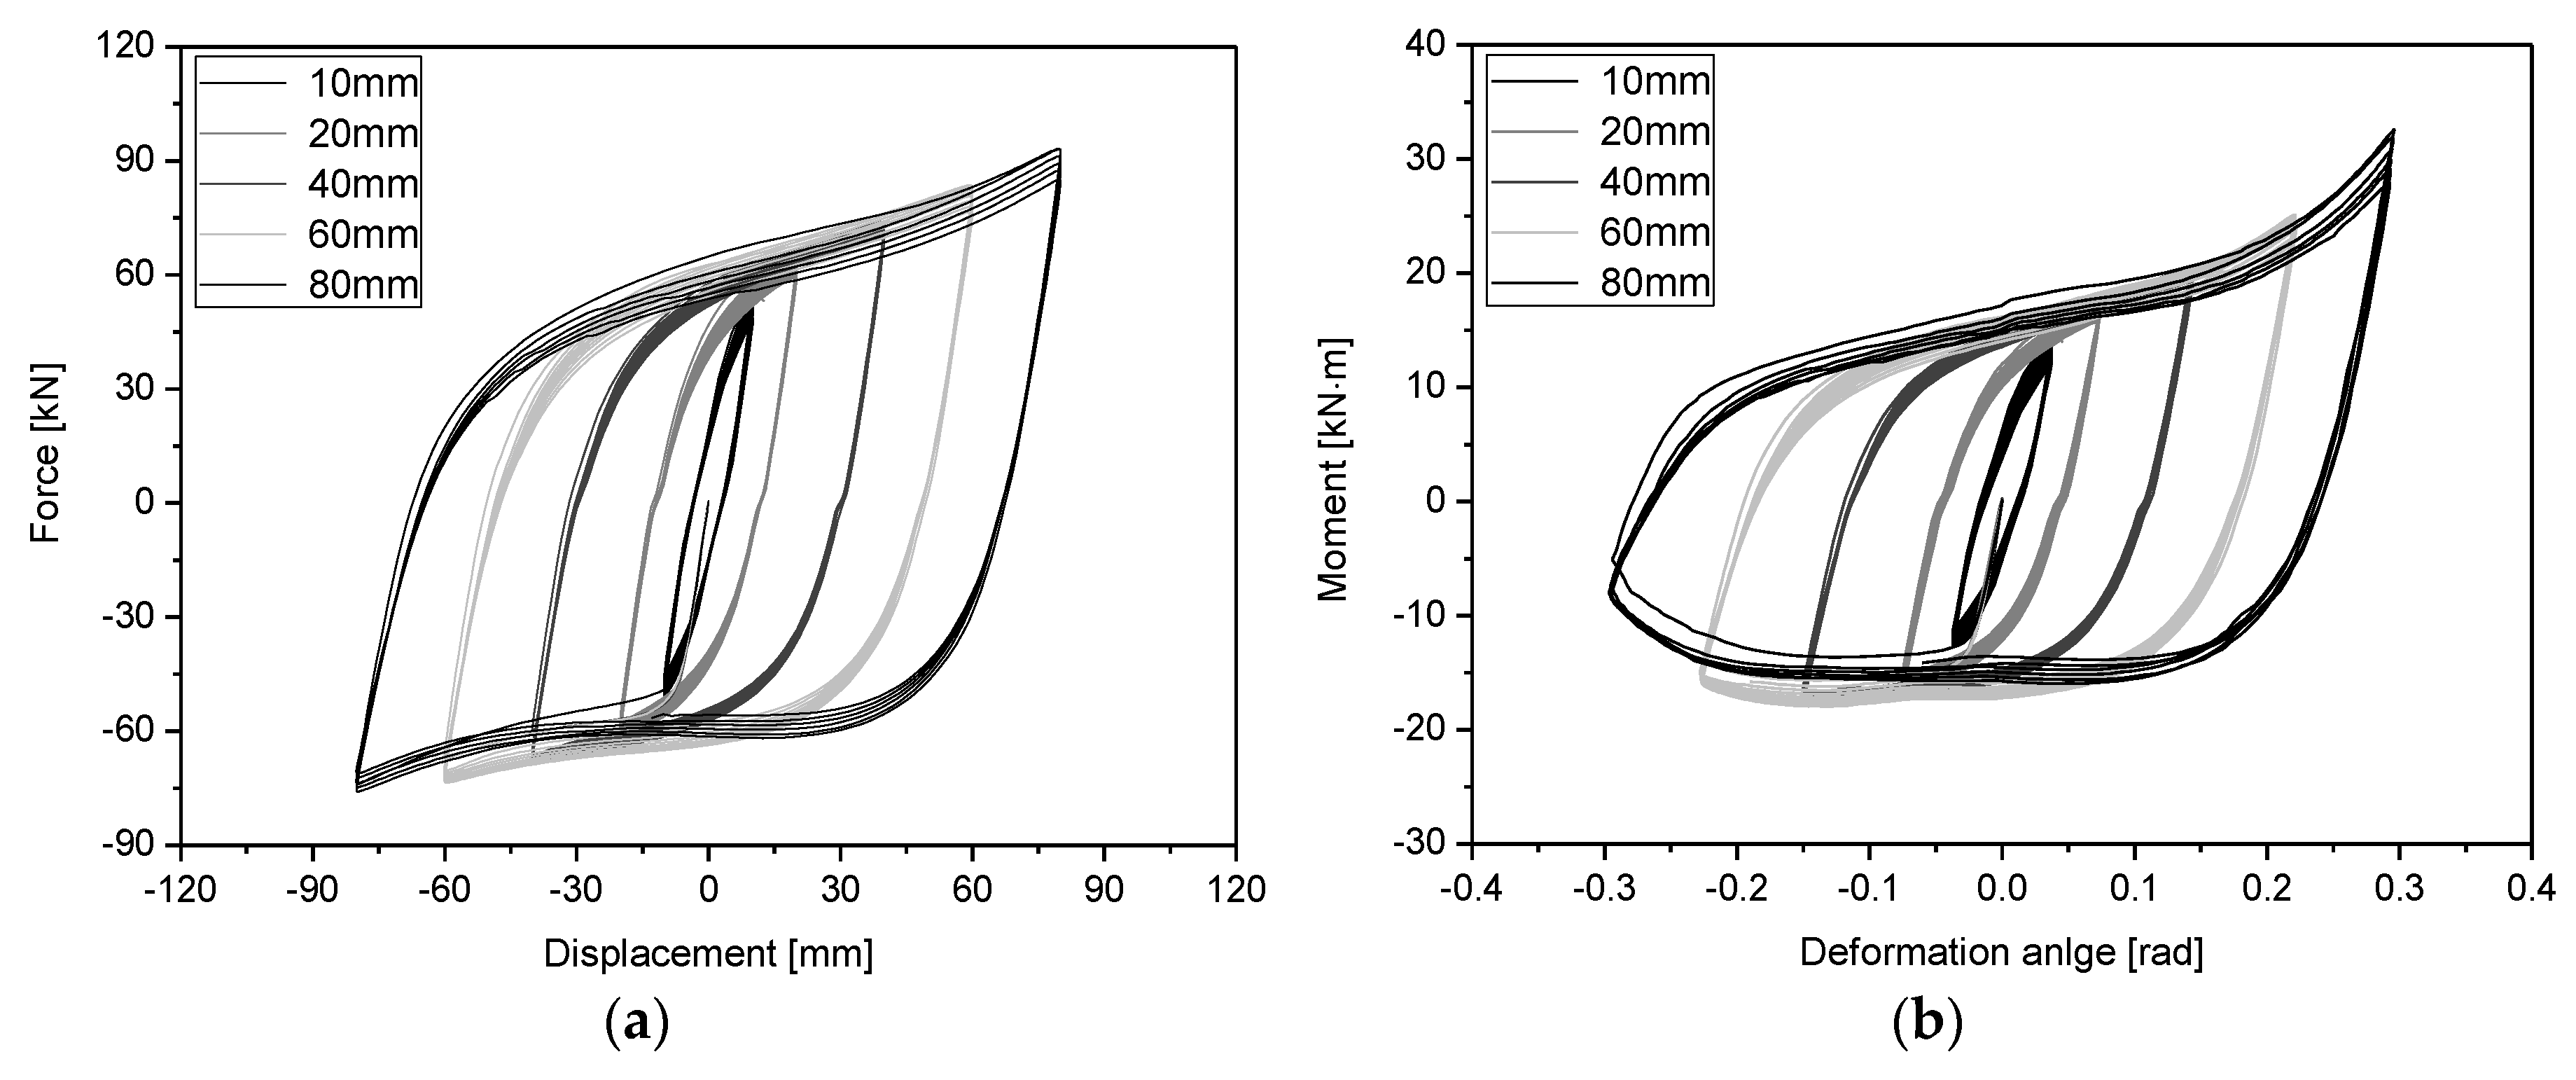
3.2. Hysteresis Loop

This study attempted to analyze the nonlinear behavior and failure criteria of a pipe tee using the P–D and M–R relationships. For force and displacement, the feedback signals of the response measured by the load cell and the linear variable differential transformer (LVDT) installed in the UTM were used, as depicted in Figure 4. Additionally, as it is difficult to measure the moment and deformation angle using conventional sensors, the nonlinear behavior of the tee deformed by external force was measured using an image measurement system [27]. In-plane cyclic loading tests were conducted using the UTM through displacement control. As shown in Figure 4, the displacement response measured using the image signal acquired by installing Target 1 on the connection jig of the UTM was synchronized with the displacement response measured by the LVDT installed in the UTM using the cross-correlation function [36,37]. The deformation angle was calculated using the displacement responses measured at the following four points: the pin points on both sides (Target 2 and Target 4), the tee center point (Target 3), and the loading displacement point (Target 1). The moment ( M = p d + q e ) at each point was acquired using the horizontal distance (d) of the left pin and the vertical distance (e) from the center of the tee as well as the vertical reaction force (p) and the horizontal reaction force (q) was measured by the load cell installed at Target 2.
Figure 5 shows the hysteresis loop of the representative test specimen for each loading displacement for the P–D and M–R relationships measured in the in-plane cyclic loading tests. As shown in the figure, the shapes of the hysteresis loops in the positive and negative directions were almost symmetrical, and the P–D and M–R relationships exhibited similar tendencies for loading amplitudes of ±10 to ±40 mm. However, when the loading amplitude was ±60 mm or higher, the hysteresis loops showed different shapes for the P–D and M–R relationships, and the shapes in the positive and negative directions were different.

3.3. Dissipated Energy

The case in which a failure occurs at a low cycle, as plastic deformation is caused by external forces in a stress state that exceeds the yield strength, is referred to as low-cycle fatigue. The Japan Nuclear Energy Safety Organization (JNES) and the Nuclear Power Engineering Corporation (NUPEC) conducted a study to identify the elastic–plastic behavior of the simplified model of nuclear power plant piping systems. In this study, the low-cycle fatigue life under large earthquake conditions was less than 300 cycles [1]. Table 1 shows the number of cycles to failure ( N f ) for each loading amplitude and energy for each cycle in the in-plane cyclic loading tests. In Table 1, the N f ranged from 252–306 cycles when the loading amplitude was ±10 mm, which indicates that the loading amplitude can represent the low-cycle fatigue life of piping elements, considering elastic–plastic deformation. At a loading amplitude of ±20 mm or higher to consider the seismic anchor motion (SAM) due to relative displacement, the limit load, which is the collapse load point, was exceeded. Therefore, the N f sharply decreased to less than 61 cycles when the loading amplitude was ±20 mm and to less than 13 cycles when the loading amplitude was ±60 mm or higher. Additionally, the energy for each cycle was similar for P–D and M–R, as the difference was less than 4%, as shown in Table 1.
Figure 6 shows the energy for each cycle for P–D and M–R. Equations (1) and (2) show the linear regression lines calculated using the least squares method. As shown in Figure 6, the energy for each cycle linearly increased for both P–D and M–R, and the linear regression lines were similar. The coefficients ( R 2 ) of determination for Equations (1) and (2) were 0.99 or higher, which indicates linear relationships.
( P D )   y = 0.22 x 2.07 ,   R 2 = 0.99
( M R )   y = 0.21 x 1.97 ,   R 2 = 0.99

3.4. Damage Index

Various damage indices have been proposed to quantitatively express the damage to structures caused by seismic motions. One of them is an energy dissipation index that considers cumulative plastic deformation to reliably express damage quantitatively [38]. The two others include a damage index that considers different weights of plastic deformation of various cycles [39], and a damage index to consider cumulative work [40]. In this study, the damage index of Park and Ang and that of Banon, which can simply express cumulative damage, were considered among various damage indices.
The damage index of Park and Ang can be expressed as shown in Equations (3) and (4). It was proposed to consider the influence of the maximum deformation and cyclic loading. Equation (3) is the damage index for the P–D relationship, and Equation (4) is the damage index for the M–R relationship. The damage index of Park and Ang is based on the linear combination of ductility and energy dissipation and can simply express damage. It was proposed for reinforced concrete structures, but it can also be applied to steel structures depending on the situation [28,29]. The proposed value of constant b in Equations (3) and (4) is 0.025 [41]. This damage index was used to express the damage to the carbon steel pipe elbows [24]. However, this damage index is less reliable for steel structures [42].
D P D = m a x ( D i D y ) + b i = 1 N ( E i F y D y )
D M R = m a x ( θ i θ y ) + b i = 1 N ( E i M y θ y )
The damage index of Banon, which is expressed as shown in Equations (5) and (6), is based on the nonlinear combination of ductility and energy dissipation [30,31]. Similarly, Equation (5) is the damage index for the P–D relationship, and Equation (6) is the damage index for the M–R relationship. For Equations (5) and (6), 1.1 and 0.38 were proposed for constants c and d [42]. This damage index was used to express the seismic capacity of carbon steel pipe elbows together with the damage index of Park and Ang [24,25].
D P D = ( m a x ( D i D y 1 ) ) 2 + ( i = 1 N c ( E i F y D y ) d ) 2
D M R = ( m a x ( θ i θ y 1 ) ) 2 + ( i = 1 N c ( E i M y θ y ) d ) 2
In Equations (3)–(6), D y and F y are the yield displacement and yield force, respectively; D i and E i are the displacement amplitude and the dissipated energy of the i-th cycle, respectively; M y and θ y are the yield moment and yield deformation angle and θ i and E i are the deformation angle amplitude and the dissipated energy of the i-th cycle, respectively.

3.5. Yield Point

In this study, the failure mode was defined as the leakage caused by a through-wall crack for low-cycle fatigue failure, and an attempt was made to quantify the failure criteria using the damage index of Park and Ang and that of Banon. To calculate these damage indices, the yield points ( D y , F y , M y , and θ y ), which are the limit loads, need to be defined. There are various methods for defining the yield point. In general, the TI method and the TES method presented by ASME can be used for the yield point required to calculate the damage index in in-plane cyclic loading tests [43]. The TI method [32] uses the point at which the tangent of the elastic slope meets that of the plastic slope in the P–D curve, as shown in Figure 7. This method can be well established in the general P–D relationship. Figure 8 shows an example of the application of the TI method in the curve of the closing mode (compression) of the first cycle. As shown in Figure 8a, at a loading amplitude of ±20 mm, the TI method is well established owing to the typical P–D relationship. However, at a loading amplitude of ±60 mm, as shown in Figure 8b, different yield points are calculated depending on the method of defining the tangent of the slope because the P–D curve in the plastic region is not typical. This indicates that the position of the yield point may vary depending on the subjective judgment of the engineer. In previous studies that quantified the failure criteria of SCH 40 3-inch carbon steel pipe elbows, it was possible to apply the TI method because the first cycle of P–D and M–R had a typical slope in the plastic region [20,25]. However, in this study, the TES method was used for the yield point required to calculate the damage index because it is difficult to determine the yield point using the TI method for SCH40 3-inch carbon steel pipe tees.
The TES method [33] was proposed to induce the limit load, which is the collapse load point for assessing the seismic performance of piping and pressure vessels. In this method, a regression line is obtained using the least squares method in the elastic region of the P–D curve (Figure 9). In this instance, the angle is defined as θ . Then, a line is drawn to create angle θ , which, using Equation (7), becomes 2 t a n θ . The point at which this line meets the P–D curve is referred to as the collapse load point, which is used as the limit load for seismic design.
ϕ = t a n 1 ( 2 t a n θ )
Figure 10 shows the use of the TES method to calculate the representative yield point. This method can be applied when the loading amplitude exceeds ±20 mm, as shown in Figure 10b. However, this method is difficult to apply when the loading amplitude is ±10 mm, as shown in Figure 10a because the value of 2tanθ cannot be calculated. Therefore, a method for determining the yield point is required to calculate the damage index in the same way for all test results. Thus, in this study, a method of applying the TES method to all experimental results were examined. As shown in Figure 10b, the yield points ( D y , F y , M y , and θ y ) were calculated in the curves (P–D and M–R) for the first cycle of cases in which the loading amplitude was ±20 mm or higher using each curve: mean regression curve, maximum curve, and minimum curve. The method of using each curve has different yield points. The mean regression curve, maximum curve, and minimum curve each lead to one representative yield point. In Figure 10b, the maximum curve is colored dark gray, the minimum curve is light gray, and the mean regression curve is gray.

3.6. Damage Index for the Yeild Point

Figure 11 and Figure 12 show the calculation of the average damage index for P–D and M–R when the loading amplitude ranges from ±20 to ±80 mm. Figure 11 shows the average damage index of Park and Ang, and Figure 12 shows that of Banon. Because a method of calculating the damage index for all test results using the TES method was required, the representative yield points were examined. Therefore, the yield points ( D y , F y , M y , and θ y ) were calculated using the TES method in each curve: mean regression curve, maximum curve, and minimum curve. Additionally, Figure 11 and Figure 12 show the difference between the average damage index calculated using each curve and the average damage index calculated using other yield points. Table 2 and Table 3 show the average damage index calculated when the loading amplitude ranged from ±20 to ±80 mm for P–D and M–R. The maximum difference between the average damage index of Park and Ang calculated using the representative yield point of the mean regression curve in Figure 11, and the average damage index calculated using the yield points of each curve were 5.33% for P–D and 6.31% for M–R. The maximum difference in the average damage index of Banon in Figure 12 was 2.25% for P–D and 2.51% for M–R. Therefore, it was confirmed that the average damage index calculated using the yield point of the mean regression curve was similar to that calculated from each curve. However, the average damage indices calculated using the yield points of the maximum and minimum curves significantly differed from those calculated using each curve.
Table 2 and Table 3 show that the average values of the average damage indices calculated using the yield points of each curve were similar to those of the average damage indices calculated using the yield points of the mean regression curves. At a loading amplitude of ±10 mm, wherein the TES method could not be used; subsequently, it was found that the damage index could be calculated using the yield points obtained from the mean regression curves of the cases with representative values of ±20 to ±80 mm.
In this study, in-plane cyclic loading tests were conducted until leakage occurred because the failure mode of the SCH 40 3-inch carbon steel pipe tee was defined as the leakage caused by a through-wall crack. Therefore, the damage index for leakage, which is the failure mode, must be similar for all loading amplitudes. In Table 4, the standard deviation for the average damage index of Banon ranged from 0.35 to 0.61, and the variation was between 0.14 and 0.38. In Table 5, the standard deviation for the average damage index of Park and Ang ranged from 1.64 to 2.13, and the variation was between 2.70 and 4.52. The average damage index of Banon exhibited a smaller standard deviation and variation than that of Park and Ang, which indicates that the average damage index of Banon was distributed closer to the average value. Therefore, it was reasonable to use the damage index of Banon, which was distributed closer to the average value, as this study deals with the damage index for leakage, which is the failure mode.
Figure 13 shows the damage index of Banon calculated at all loading amplitudes using the yield point of the mean regression curve in Figure 10b. Figure 13a shows the damage index of Banon for P–D, and Figure 13b shows the damage index of Banon for M–R. Figure 13 shows that the damage index is located between ± 2 σ of the average line. This confirms that the damage index can be calculated for the case of ±10 mm, which involves cyclic loading that causes cumulative plastic deformation, even though the yield point cannot be defined using the TES method. Table 6 shows the damage index calculated at each loading amplitude, which confirms that a maximum difference of 2.52% may occur between the damage indices calculated using P–D and M–R. For each loading amplitude, the damage indices converged to a certain level, and the standard deviation for the damage index was less than 0.6. These indicate that the average damage indices presented in Table 6 can be used as representative values of the leakage caused by a through-wall crack.

4. Concluding Remarks

In this study, the failure criteria for an SCH 40 3-inch carbon steel pipe tee in a nuclear power plant piping system were quantified using the damage index based on the force–displacement (P–D) and moment–deformation angle (M–R) relationships.
The failure mode of the SCH 40 3-inch carbon steel pipe tee was defined as the leakage caused by a through-wall crack. In-plane cyclic loading tests were conducted at constant amplitudes until leakage occurred. The loading amplitude varied from ±10 to ±20, ±40, ±60, and ±80 mm in the in-plane cyclic loading tests to consider the elastic–plastic behavior and the SAM. For all the test specimens, leakage caused by a through-wall crack occurred in the upper neutral axis of the tee, and the crack propagated in the neutral axis direction.
To quantitatively define the failure criteria, the damage index of Park and Ang and that of Banon, which can express cumulative damage, were used. For the yield point required to calculate the damage index, the TI method and the TES method were considered. It was found that different yield points can be calculated in the TI method depending on the method of defining the tangent of the slope if the P–D curve is not typical. Therefore, in this study, the TES method presented by the ASME Boiler and Pressure Vessel Code was used to determine the yield point. There may be cases in which the yield point cannot be defined using the TES method. This means that the TES point may not exist owing to the small loading displacement, in which case a method of defining the yield point is required. Therefore, in this study, damage indices were calculated using the yield points obtained from each curve and the yield point (one representative value) obtained from the mean regression curve, and the calculated damage indices were compared. It was confirmed that there was a small difference between the damage indices calculated using the yield points of each curve and the damage index calculated using the yield point of the mean regression curve. Therefore, when the yield point cannot be defined using the TES method because of the small loading amplitude, the representative value of the yield point calculated from the mean regression curve of other experimental results can be used.
At a loading amplitude of ±20 mm or higher, the standard deviation for the average damage index of Park and Ang ranged from 1.64–2.13, and the standard deviation for the average damage index of Banon ranged from 0.12–0.38. In this study, the failure mode of the SCH40 3-inch carbon steel pipe tee was defined as the leakage caused by a through-wall crack. In the limit state, damage indices must be distributed with a small standard deviation from the average value. Therefore, it was reasonable to use the damage index of Banon rather than that of Park and Ang to express the failure criteria for the SCH40 3-inch carbon steel pipe tee.
The damage index of Banon was calculated for all loading amplitudes using the yield point of the mean regression curve. There was a maximum difference of 2.52% between the damage indices of Banon for the P–D and M–R relationships, and all the damage indices were within ± 2 σ . The standard deviation for the damage indices calculated using the P–D and M–R relationships was less than 0.6. This indicates that the damage index of Banon is suitable for quantifying the failure criteria for the SCH 40 3-inch carbon steel pipe tee. Therefore, the method of calculating the damage index proposed in this study can be used to calculate the quantitative failure criteria that can express the leakage of nuclear power plant piping systems.

Author Contributions

Conceptualization, S.-W.K.; methodology, S.-W.K.; software, S.-W.K.; validation, S.-W.K., D.-W.Y., S.-J.C., D.-U.P., and B.-G.J.; visualization, S.-W.K. and D.-W.Y.; investigation, S.-W.K., D.-W.Y., S.-J.C., D.-U.P., and B.-G.J.; writing—original draft, S.-W.K., D.-W.Y., and B.-G.J.; writing—review and editing, S.-W.K., D.-W.Y., and B.-G.J.; funding acquisition, D.-U.P. All authors have read and agreed to the published version of the manuscript.

Funding

This work was supported by the Korea Institute of Energy Technology Evaluation and Planning (KETEP) and the Ministry of Trade, Industry and Energy (MOTIE) of the Republic of Korea (No. 20201510100010). Moreover, the authors would like to thank the KOCED Seismic Research and Test Center for their assistance with the test equipment.

Conflicts of Interest

The authors declare no conflict of interest.

References

  1. DeGrassi, G.; Hofmayer, C. Seismic Analysis of Simplified Piping Systems for the NUPEC Ultimate Strength Piping Test Program; Division of Engineering Technology, Office of Nuclear Regulatory Research, U.S. Nuclear Regulatory Commission: Washington, DC, USA, 2005. [Google Scholar]
  2. Watakabe, T.; Nakamura, I.; Otani, A.; Morishita, M.; Shibutani, T.; Shiratori, M. Seismic Qualification of Piping Systems by Detailed Inelastic Response Analysis: Part 4—Second Round Benchmark Analyses with Stainless Steel Piping Component Test. In Proceedings of the ASME 2017 Pressure Vessels and Piping Conference, Waikoloa, HI, USA, 16–20 July 2017. [Google Scholar]
  3. Soroushian, S.; Zaghi, A.E.; Maragakis, E.M.; Echevarria, A.; Tian, Y.; Filiatrault, A. Seismic fragility study of fire sprinkler piping systems with grooved fit joints. J. Struct. Eng. 2015, 141, 04014157. [Google Scholar] [CrossRef]
  4. Yoshino, K.; Sakakida, T.; Yokota, H.; Asada, Y.; Endou, R.; Fujiwaka, T.; Suzuki, K. Study on seismic design of nuclear power plant piping in japan part 3: Component Test Results. Am. Soc. Mech. Eng. Press. Vessel. Pip. Div. 2000, 407, 131–137. [Google Scholar]
  5. Sakakida, T.; Kawabata, M.; Yokota, H.; Asada, Y.; Endou, R.; Fujiwaka, T.; Suzuki, K. Study on seismic design of nuclear power plant piping in japan part 4: Analytical evaluation of piping component tests. Am. Soc. Mech. Eng. Press. Vessel. Pip. Div. 2000, 407, 139–146. [Google Scholar]
  6. Hasegawa, K.; Miyazaki, K.; Nakamura, I. Failure mode and failure strengths for wall thinning straight pipes and elbows subjected to seismic loading. J. Press. Vessel Technol. 2008, 130, 011404. [Google Scholar] [CrossRef]
  7. Nakamura, I.; Otani, A.; Sato, Y.; Takada, H.; Takahashi, K.; Shibutani, T. Investigation of the Seismic Safety Capacity of Aged Piping System-Shake Table Test on Piping Systems with Wall Thinning by E-Defense. In Proceedings of the ASME 2011 Pressure Vessels and Piping Conference, Baltimore, MD, USA, 17–21 July 2011. [Google Scholar]
  8. Watakabe, T.; Izumi, N.; Otani, A.; Morishita, M.; Shibutani, T.; Shiratori, M. Second Round Benchmark Analyses with Stainless Steel Piping Component Tests for a JSME Code Case. In Proceedings of the MECOS BENCHMARK Workshop 2, Paris, France, 29–30 November 2016. [Google Scholar]
  9. Varelis, G.E.; Karamanos, S.A. Low-cycle fatigue of pressurized steel elbows under in-plane bending. J. Press. Vessel Technol. 2015, 137, 011401. [Google Scholar] [CrossRef]
  10. Hassan, T.; Rahman, M.; Bari, S. Low-cycle fatigue and ratcheting responses of elbow piping components. J. Press. Vessel Technol. 2015, 137, 031010. [Google Scholar] [CrossRef]
  11. Takahashi, K.; Ando, K.; Matsuo, K.; Urabe, Y. Estimation of low-cycle fatigue life of elbow pipes considering the multi-axial stress effect. J. Press. Vessel Technol. 2014, 136, 041405. [Google Scholar] [CrossRef]
  12. NEA (Nuclear Energy Agency)/CSNI (Committee on the Safety of Nuclear Installations). Integrity of Structures, Systems and Components under Design and Beyond Design Loads in Nuclear Power Plants; Final Report of the Project on Metallic Component Margins Under High Seismic Loads (MECOS); NEA (Nuclear Energy Agency): Paris, France, 2018. [Google Scholar]
  13. Otani, A.; Shibutani, T.; Morishita, M.; Nakamura, I.; Watakabe, T.; Shiratori, M. Seismic Qualification of Piping Systems by Detailed Inelastic Response Analysis: Part 2—A Guideline for Piping Seismic Inelastic Response Analysis. In Proceedings of the ASME 2017 Pressure Vessels and Piping Conference, Waikoloa, HI, USA, 16–20 July 2017. [Google Scholar]
  14. Papatheocharis, T.; Diamanti, K.; Varelis, G.E.; Perdikaris, P.C.; Karamanos, S.A. Experimental and Numerical Investigation of Pipe T-junctions under Strong Cyclic Loading. In Proceedings of the ASME 2013 Pressure Vessels and Piping Conference, Paris, France, 14–18 July 2013. [Google Scholar]
  15. Berkovski, A. New Trends in the Seismic Design of Pressurized Piping under the Beyond Design Basis Earthquake. In Proceedings of the JASMiRT Workshop: Towards Innovative Systems Performance and Safety of Nuclear Power Plants under Extreme Events, Charlotte, NC, USA, 4–9 August 2019. [Google Scholar]
  16. Needs of Actual Failure Evaluation for Safety Improvement. In Proceedings of the JASMiRT Workshop: Towards Innovative Systems Performance and Safety of Nuclear Power Plants under Extreme Events, Charlotte, NC, USA, 4–9 August 2019.
  17. Koo, G.H.; Kim, J.S.; Kim, Y.J. Feasibility study on strain-based seismic design criteria for nuclear components. Energies 2020, 13, 4435. [Google Scholar] [CrossRef]
  18. Hahm, D.G.; Park, J.H.; Choi, I.K. Seismic performance evaluation of piping system crossing the isolation interface in seismically isolated NPP. J. Earthq. Eng. Soc. Korea 2014, 18, 141–150. [Google Scholar] [CrossRef]
  19. Kwag, S.Y.; Eem, S.H.; Kwak, J.S.; Oh, J.H. Evaluation model of seismic response behavior and performance of nuclear plant piping systems. J. Korean Soc. Adv. Compos. Struct. 2020, 11, 54–62. [Google Scholar] [CrossRef]
  20. Kim, S.W.; Jeon, B.G.; Hahm, D.G.; Kim, M.K. Seismic fragility evaluation of the base-isolated nuclear power plant piping system using the failure criterion based on stress-strain. Nucl. Eng. Technol. 2019, 51, 561–572. [Google Scholar] [CrossRef]
  21. Kim, S.W.; Choi, H.S.; Jeon, B.G.; Hahm, D.G.; Kim, M.K. Strain and deformation angle for a steel pipe elbow using image measurement system under in-plane cyclic loading. Nucl. Eng. Technol. 2018, 50, 190–202. [Google Scholar] [CrossRef]
  22. Kim, S.W.; Park, D.U.; Jeon, B.G.; Hahm, D.G. Low-cycle fatigue behaviors of the elbow in a nuclear power plant piping system using the moment and deformation angle. Eng. Fail. Anal. 2019, 96, 348–361. [Google Scholar] [CrossRef]
  23. Kim, S.W.; Chang, S.J.; Park, D.U.; Jeon, B.G. Failure criteria of a carbon steel pipe elbow for low-cycle fatigue using the damage index. Thin Walled Struct. 2020, 153, 106800. [Google Scholar] [CrossRef]
  24. Salimi Firoozabad, E.; Jeon, B.G.; Choi, H.S.; Kim, N.S. Failure criterion for steel pipe elbows under cyclic loading. Eng. Fail. Anal. 2016, 66, 515–525. [Google Scholar] [CrossRef]
  25. Jeon, B.G.; Kim, S.W.; Choi, H.S.; Park, D.U.; Kim, N.S. A failure estimation method of steel pipe elbows under in-plane cyclic loading. Nucl. Eng. Technol. 2017, 49, 245–253. [Google Scholar] [CrossRef] [Green Version]
  26. Kim, S.W.; Park, D.U.; Jeon, B.G.; Yun, D.W. Fatigue behaviors of the steel pipe tee in a nuclear power plant piping system under in-plane cyclic loading. Energy Rep. 2020, 6, 521–525. [Google Scholar] [CrossRef]
  27. Kim, S.W.; Jeon, B.G.; Hahm, D.G.; Kim, M.K. Ratcheting fatigue failure of a carbon steel pipe tee in a nuclear power plant using the deformation angle. Eng. Fail. Anal. 2020, 114, 104595. [Google Scholar] [CrossRef]
  28. Park, Y.J.; Ang, A.H.S. Mechanistic seismic damage model for reinforced concrete. J. Struct. Eng. 1985, 111, 722–739. [Google Scholar] [CrossRef]
  29. Park, Y.J.; Ang, A.H.S.; Wen, Y.K. Damage-limiting a seismic design of buildings. Earthq. Spectra 1987, 3, 1–26. [Google Scholar] [CrossRef]
  30. Banon, H.; Biggs, J.M.; Irvine, H.M. Seismic damage in reinforced concrete frames. J. Struct. Eng. 1981, 107, 1713–1729. [Google Scholar]
  31. Banon, H.; Veneziano, D. Seismic safety of reinforced concrete members and structures. Earthq. Eng. Struct. Dyn. 1982, 10, 179–193. [Google Scholar] [CrossRef]
  32. Save, M. Experimental verification of plastic limit analysis of torispherical and toriconical heads. In Pressure Vessels and Piping: Design and Analysis; American Society of Mechanical Engineers: New York, NY, USA, 1972; Volume 1, pp. 382–416. [Google Scholar]
  33. American Society of Mechanical Engineers. Section III, Rules for Construction of Nuclear Facility Components. In ASME Boiler and Pressure Vessel Code; American Society of Mechanical Engineers: New York, NY, USA, 2004. [Google Scholar]
  34. American Society of Mechanical Engineers. ASME B36.10 M—2015, Welded and Seamless Wrought Steel Pipe; American Society of Mechanical Engineers: New York, NY, USA, 2015. [Google Scholar]
  35. American Society for Testing and Materials. ASTM A234/A234—15, Standard Specification for Piping Fittings of Wrought Carbon Steel and Alloy Steel for Moderate and High Temperature Service; American Society for Testing and Materials: West Conshohocken, PA, USA, 2015. [Google Scholar]
  36. Kim, S.W.; Choi, H.S.; Park, D.U.; Baek, E.R.; Kim, J.M. Water level response measurement in a steel cylindrical liquid storage tank using image filter processing under seismic excitation. Mech. Syst. Signal Process. 2018, 101, 274–291. [Google Scholar] [CrossRef]
  37. Kim, S.W.; Park, D.U.; Jeon, B.G.; Chang, S.J. Non-contact water level response measurement of a tubular level gauge using image signals. Sensors 2020, 20, 2217. [Google Scholar] [CrossRef] [Green Version]
  38. Darwin, D.; Nmai, C.K. Energy dissipation in RC beams under cyclic load. J. Struct. Eng. 1986, 112, 1829–1846. [Google Scholar] [CrossRef]
  39. Krawinkler, H. Performance assessment of steel components. Earthq. Spectra 1987, 3, 27–41. [Google Scholar] [CrossRef]
  40. Gosain, N.K.; Brown, R.H.; Jirsa, J.O. Shear requirements for load reversals on RC members. J. Struct. Eng. 1977, 103, 1461–1476. [Google Scholar]
  41. Cosenza, E.; Manfredi, G. Classificazione e Comportamento Sismico di Modelli Ciclici Degradanti. In Proceedings of the Danneggiamento Ciclico e Prove Pseudo-Dinamiche, Napoli, Italy, 2–3 June 1944. [Google Scholar]
  42. Castiglioni, C.A.; Pucinotti, R. Failure criteria and cumulative damage models for steel components under cyclic loading. J. Constr. Steel Res. 2009, 65, 751–765. [Google Scholar] [CrossRef]
  43. Patel, D.M.; Kumar, D.B. Pressure vessel limit load estimation by FEM and experimental method. Int. J. Innov. Res. Adv. Eng. 2014, 1, 109–114. [Google Scholar]
Figure 1. Test specimen and connection jig.
Energies 13 06395 g001
Figure 2. Test configuration: (a) Experimental setup; (b) Test specimen installed in the universal testing machine (UTM).
Energies 13 06395 g002
Figure 3. Position of the leakage caused by a through-wall crack.
Energies 13 06395 g003
Figure 4. Measurement positions for the calculation of the moment and the deformation angle.
Energies 13 06395 g004
Figure 5. Hysteresis loop for force–displacement (P–D) and moment–deformation angle (M–R) relationships: (a) P–D; (b) M–R.
Energies 13 06395 g005
Figure 6. Energy line in each cycle for P–D and M–R.
Energies 13 06395 g006
Figure 7. Calculation of the yield point using the tangent intersection (TI) method.
Energies 13 06395 g007
Figure 8. Use of the TI method to calculate the yield point: (a) ±20 mm; (b) ±60 mm.
Energies 13 06395 g008
Figure 9. Calculation of the yield point using the twice-elastic slope (TES) method.
Energies 13 06395 g009
Figure 10. Calculation of the representative yield point using the TES method: (a) 10 mm; (b) 20–80 mm.
Energies 13 06395 g010
Figure 11. Average damage index of Park and Ang: (a) P–D; (b) M–R.
Energies 13 06395 g011
Figure 12. Average damage index of Banon: (a) P–D; (b) M–R.
Energies 13 06395 g012
Figure 13. Damage index of Banon for P–D and M–R: (a) P–D; (b) M–R.
Energies 13 06395 g013
Table 1. Number of cycles to failure and energy for each cycle.
Loading Amplitude (mm) N f Energy/Cycle
P–DM–RDifference (%)
±10252.500.480.492.73
306.500.470.462.75
267.750.460.451.44
±2050.752.032.001.04
60.501.951.902.65
57.751.951.940.65
±4019.506.686.561.82
20.756.716.660.71
26.005.945.930.22
±6010.2511.3511.270.70
11.0010.4710.173.02
12.7510.1110.001.12
±807.5015.4015.012.58
6.0015.6115.123.24
7.5015.4815.023.09
Table 2. Average damage index of Park and Ang.
Loading Amplitude (mm)Average Damage Index (Park and Ang)
P–DM–R
EachMeanMax.Min.EachMeanMax.Min.
206.005.686.965.026.185.797.024.73
408.288.3310.087.428.378.5210.237.03
609.019.0610.788.179.229.2010.867.70
809.9110.1411.919.229.9810.2411.978.66
Table 3. Average damage index of Banon.
Loading Amplitude (mm)Average Damage Index (Banon)
P–DM–R
EachMeanMax.Min.EachMeanMax.Min.
2010.2310.0010.959.4610.3510.0910.999.24
4011.0511.1312.2010.5111.1011.2512.2810.28
6010.8710.9011.9810.2810.9910.9612.009.96
8011.0011.1212.2610.4711.0611.1812.2810.10
Average10.7910.7911.8510.1810.8810.8711.899.90
Table 4. Comparison of statistical data for the average damage index (Banon).
StatisticsDamage Index (Banon)
EachMeanMax.Min.
P–DM–RP–DM–RP–DM–RP–DM–R
Average10.7910.8810.7910.8711.8511.8910.189.90
Standard deviation0.380.350.540.530.610.610.490.46
Variation0.140.120.290.290.370.380.240.21
Table 5. Comparison of statistical data for the average damage index (Park and Ang).
StatisticsDamage Index (Park and Ang)
EachMeanMax.Min.
P–DM–RP–DM–RP–DM–RP–DM–R
Average8.308.448.308.449.9310.027.467.03
Standard deviation1.671.641.901.901.642.131.781.67
Variation2.802.703.613.624.504.523.192.80
Table 6. Damage index of Banon based on the yield point calculated from the mean regression curve.
Loading Amplitude (mm)Damage Index (Banon)Difference (%)
P–DM–R
±1010.3210.582.52
11.0511.090.36
10.4110.490.77
±209.729.821.03
10.2310.270.39
10.0710.181.09
±4010.8110.890.74
11.0811.211.17
11.5111.661.30
±6010.7810.921.30
10.7510.680.65
11.1611.281.08
±8011.3411.420.71
10.6610.700.38
11.3611.410.44
Average10.7510.840.84
Standard deviation0.520.520.01
Variance0.270.270.01
Publisher’s Note: MDPI stays neutral with regard to jurisdictional claims in published maps and institutional affiliations.

