Article

Evaluation of Energy Transition Pathways to Phase out Coal for District Heating in Berlin

1
Vattenfall Wärme Berlin AG, 13353 Berlin, Germany
2
B E T Büro Für Energiewirtschaft und Technische Planung GmbH, 52070 Aachen, Germany
3
Senate Department for the Environment, Transport and Climate Protection, 10179 Berlin, Germany
*
Author to whom correspondence should be addressed.
Energies 2020, 13(23), 6394; https://doi.org/10.3390/en13236394
Submission received: 3 November 2020 / Revised: 30 November 2020 / Accepted: 1 December 2020 / Published: 3 December 2020
(This article belongs to the Section G: Energy and Buildings)

Abstract

:
As Germany struggles to meet its near-term emissions reduction targets in lagging sectors like heating or transport, the need to identify energy transition pathways beyond power generation is urgent. This paper presents an investigation of tangible and climate-friendly transformation paths to replace the existing coal-fired units used for heat and power generation in Berlin with a largely CO2-free innovative technology mix. Although the literature has extensively covered the decarbonization of the power generation sector on different geographic scales, few studies have focused on the decarbonization of the heat sector in cities with large district heating networks, like Berlin. This paper aims to fill this gap. The proposed methodology combines three key elements: (1) scenario analysis including high-fidelity models of the European power market and the heat demand in Berlin, (2) evaluation of energy potential from low-carbon alternative sources, and (3) a techno-economic portfolio optimization. The results suggest that a coal phase-out by 2030 is feasible without any discontinuities in the provision of heat. Although low-carbon sources could partially substitute coal-based heat, they would not be sufficient to replace it completely. Thus, a gas-based hydrogen-ready combined heat and power plant linked with a power-to-heat plant would be required to fill the gap.

1. Introduction

The Paris Agreement has turned climate change mitigation and energy decarbonization into global priorities. A number of studies have concluded that a reduction of at least 75% of the energy-related emissions is needed by 2050 to limit global temperature increase to below 2 °C [1,2,3]. Although unprecedent progress has been achieved in the power sector [4,5,6] (with thorough reviews in [7,8,9]), significant efforts are still required to decarbonize the transport and heating sectors [2]. The European Union (EU) long-term vision for a prosperous, modern, and climate-neutral economy by 2050 stresses the importance of the heating and cooling sectors in achieving significant emissions reductions. Heating and cooling sectors have become priorities for the EU, as they account for 40% of the total final energy demand in Europe and 75% is currently being supplied by fossil fuels [10]. Apart from being fossil-fuel based, the current energy system is characterized by low efficiencies, a significant amount of waste heat, and a large decoupling between heat and power segments [10,11].
Decarbonizing the heating sector requires a shift in the current paradigm toward a future energy system based on cost-effective multi-sectorial coupling, deployment of efficient technologies, and exploitation of low-carbon energy sources. This new paradigm has been addressed in various studies with different approaches, scopes, and levels of maturity. These studies have proposed various measures to achieve significant emissions reductions, including an increased use of district heating (DH) and combined heat and power generation (CHP) [10,11,12,13,14]; a higher penetration of renewables [10,15] viz. biomass [16] and geothermal energies [17]; increasing use of industrial heat [18] and unconventional heat sources [19]; an increased coupling of power and heating sectors [11]; heat storage [18] and demand-side management [20]; and decreasing operating temperatures of the district heating networks [21,22,23], among others.
In Germany, the situation is not much different than in the rest of the EU. Germany struggles to meet its near-term emissions reduction targets in lagging sectors, like heating or transport [24], and to identify energy transition pathways beyond power generation. In Germany, fossil fuels represent the highest share (75%) of the fuel mix in the heating sector, while the remaining share relies on low-carbon technologies, such as district heating (10%), renewables (10%), and electric heating (5%) [10,25]. The prevalence of fossil fuels combined with the large demand has turned Germany into the largest producer of heating-related CO2 emissions in the EU (120 Mio tons CO2 in 2015) [10]. Various studies have addressed the decarbonization of the heat supply in Germany at country [26,27,28,29,30,31] and municipality [32] scales. However, little research has focused on decarbonizing large district heating networks in Germany, even though their potential to cost-effectively reduce emissions is significantly larger than in decentralized heating systems [10,33].
In this context, a relevant city is Berlin, not only because it hosts the largest district heating in Germany (2000 km, 10.7 TWh per year) and the third largest in the EU-27 [33], but also because of its ambitious climate goals. Berlin has set the goal of becoming climate-neutral by 2050 at the latest (Berlin Energy Turnaround Act, EWG Bln. [34]), which means reducing its CO2 emissions by 95% compared to 1990. With its climate protection goal, Berlin is much more ambitious than the German government, which has only set a reduction range of 80% to 95% by 2050 [35]. Early on, Berlin recognized that the heat supply is a major contributor to the city’s high CO2 emissions. Heating accounts for 50% of the total final energy demand in the city (66 TWh per year), which is 90% supplied by fossil fuels [36]. Electricity and renewables supply the remaining 10%. While district heating contributes to one-third of the heating demand (10.7 TWh per year), it is mainly generated from coal (45%) and natural gas (45%) [36]. Three coal-based CHP units are operated in the city, which emitted 3 Mio tons CO2 in 2017, representing 18% of Berlin’s total emissions [36]. Therefore, an important field of action is the sustainable and climate-neutral heat supply in the future in Berlin. An essential key component of accomplishing this is the future design of the district heating systems [37,38]. Phasing out coal for supplying district heating is one of the most important milestones on Berlin’s path to a decarbonized future. Phasing out of coal already started in 2017, firstly, when the lignite-fired steam generators in Klingenberg were decommissioned and, secondly, when Berlin became the first German state to legally define the coal phase-out by 2030 in the Berlin Energy Turnaround Act (2017, § 15 para. 1 EWG Bln. [34]). It was not until July 2020 that the German government decided to phase out coal by 2038.
Motivated by the ambitious goal to reduce 95% emissions by 2050, we address the challenge of decarbonizing the Berlin’s district heating network from the combined perspective of the state administration and the system operator. Berlin’s Senate Administration for the Environment, Transport and Climate Protection (SenUVK), together with Vattenfall and B E T, conducted a two-year feasibility study on tangible and climate-friendly transformation paths to replace coal-fired power units in Berlin [39]. Low-carbon supply options for substituting coal-based heat have been analyzed in detail with regard to their technical and economic feasibility. A monitoring group consisting of representatives of the Berlin parliament, NGOs, local, business, and scientific communities was convened to support, challenge, and monitor the study. This paper presents the methodology employed in the abovementioned study [39] in a more extensive and detailed way and highlights key findings. The employed methodology combines three key elements: (1) scenario analysis including high-fidelity models of the European power market and the heat demand in Berlin, (2) evaluation of energy potential from low-carbon alternative sources, and (3) a techno-economic portfolio optimization. This combination is advantageous compared to existing studies, which focused only on some of these components. Previous studies typically combined methods for estimating the heat demand and supply, but did not always include sectoral integration or the potential from alternative sources. Methods for estimating the heat demand include those based on historical data, predictive time-series methods, and simulation-based models [40]. Historical data are preferred but not always available, requiring the use of predictive or simulation methods. Here, we used a high-fidelity simulation model of the entire stock of buildings in Berlin that leverages historical data. Methods used for estimating the heat supply include integrated assessment modeling (IAM), dispatch optimization, merit order allocation, and process simulation. IAM and dispatch optimization offer a wide sectoral and technology coverage at the expense of higher computational intensity. Merit order allocation and process simulation offer faster responses but limited sectoral coverage. Here, we combined a state-of-the-art heat dispatch optimization model with a high-fidelity model of the European power market to consider the integration of heat and power sectors in detail. Additionally, we performed a detailed analysis of the availability of low-carbon alternative heat sources that could replace coal.
We aimed to provide guidelines for similar studies in other cities or regions with similar characteristics or seeking comparable decarbonization goals. This paper is structured as follows: Section 2 discusses the characteristics of the district heating network in Berlin. Section 3 explains the methodology used in this investigation. Section 4 explains the scenario analysis viz. how scenarios describing different climate policy goals are defined; it also describes models of the European power market and the heat demand in Berlin. Section 5 provides an evaluation of the energy potential from different alternative sources to replace coal units and defines transformation paths. Section 6 discusses the heat supply model for evaluating the optimal operation of the different transformation paths (feeding the district heating network) and of decentralized solutions. This section also describes how the dispatch, costs, and emissions are evaluated. Finally, Section 7 presents the most significant results of the investigation followed by discussion in Section 8 and main conclusions in Section 9.

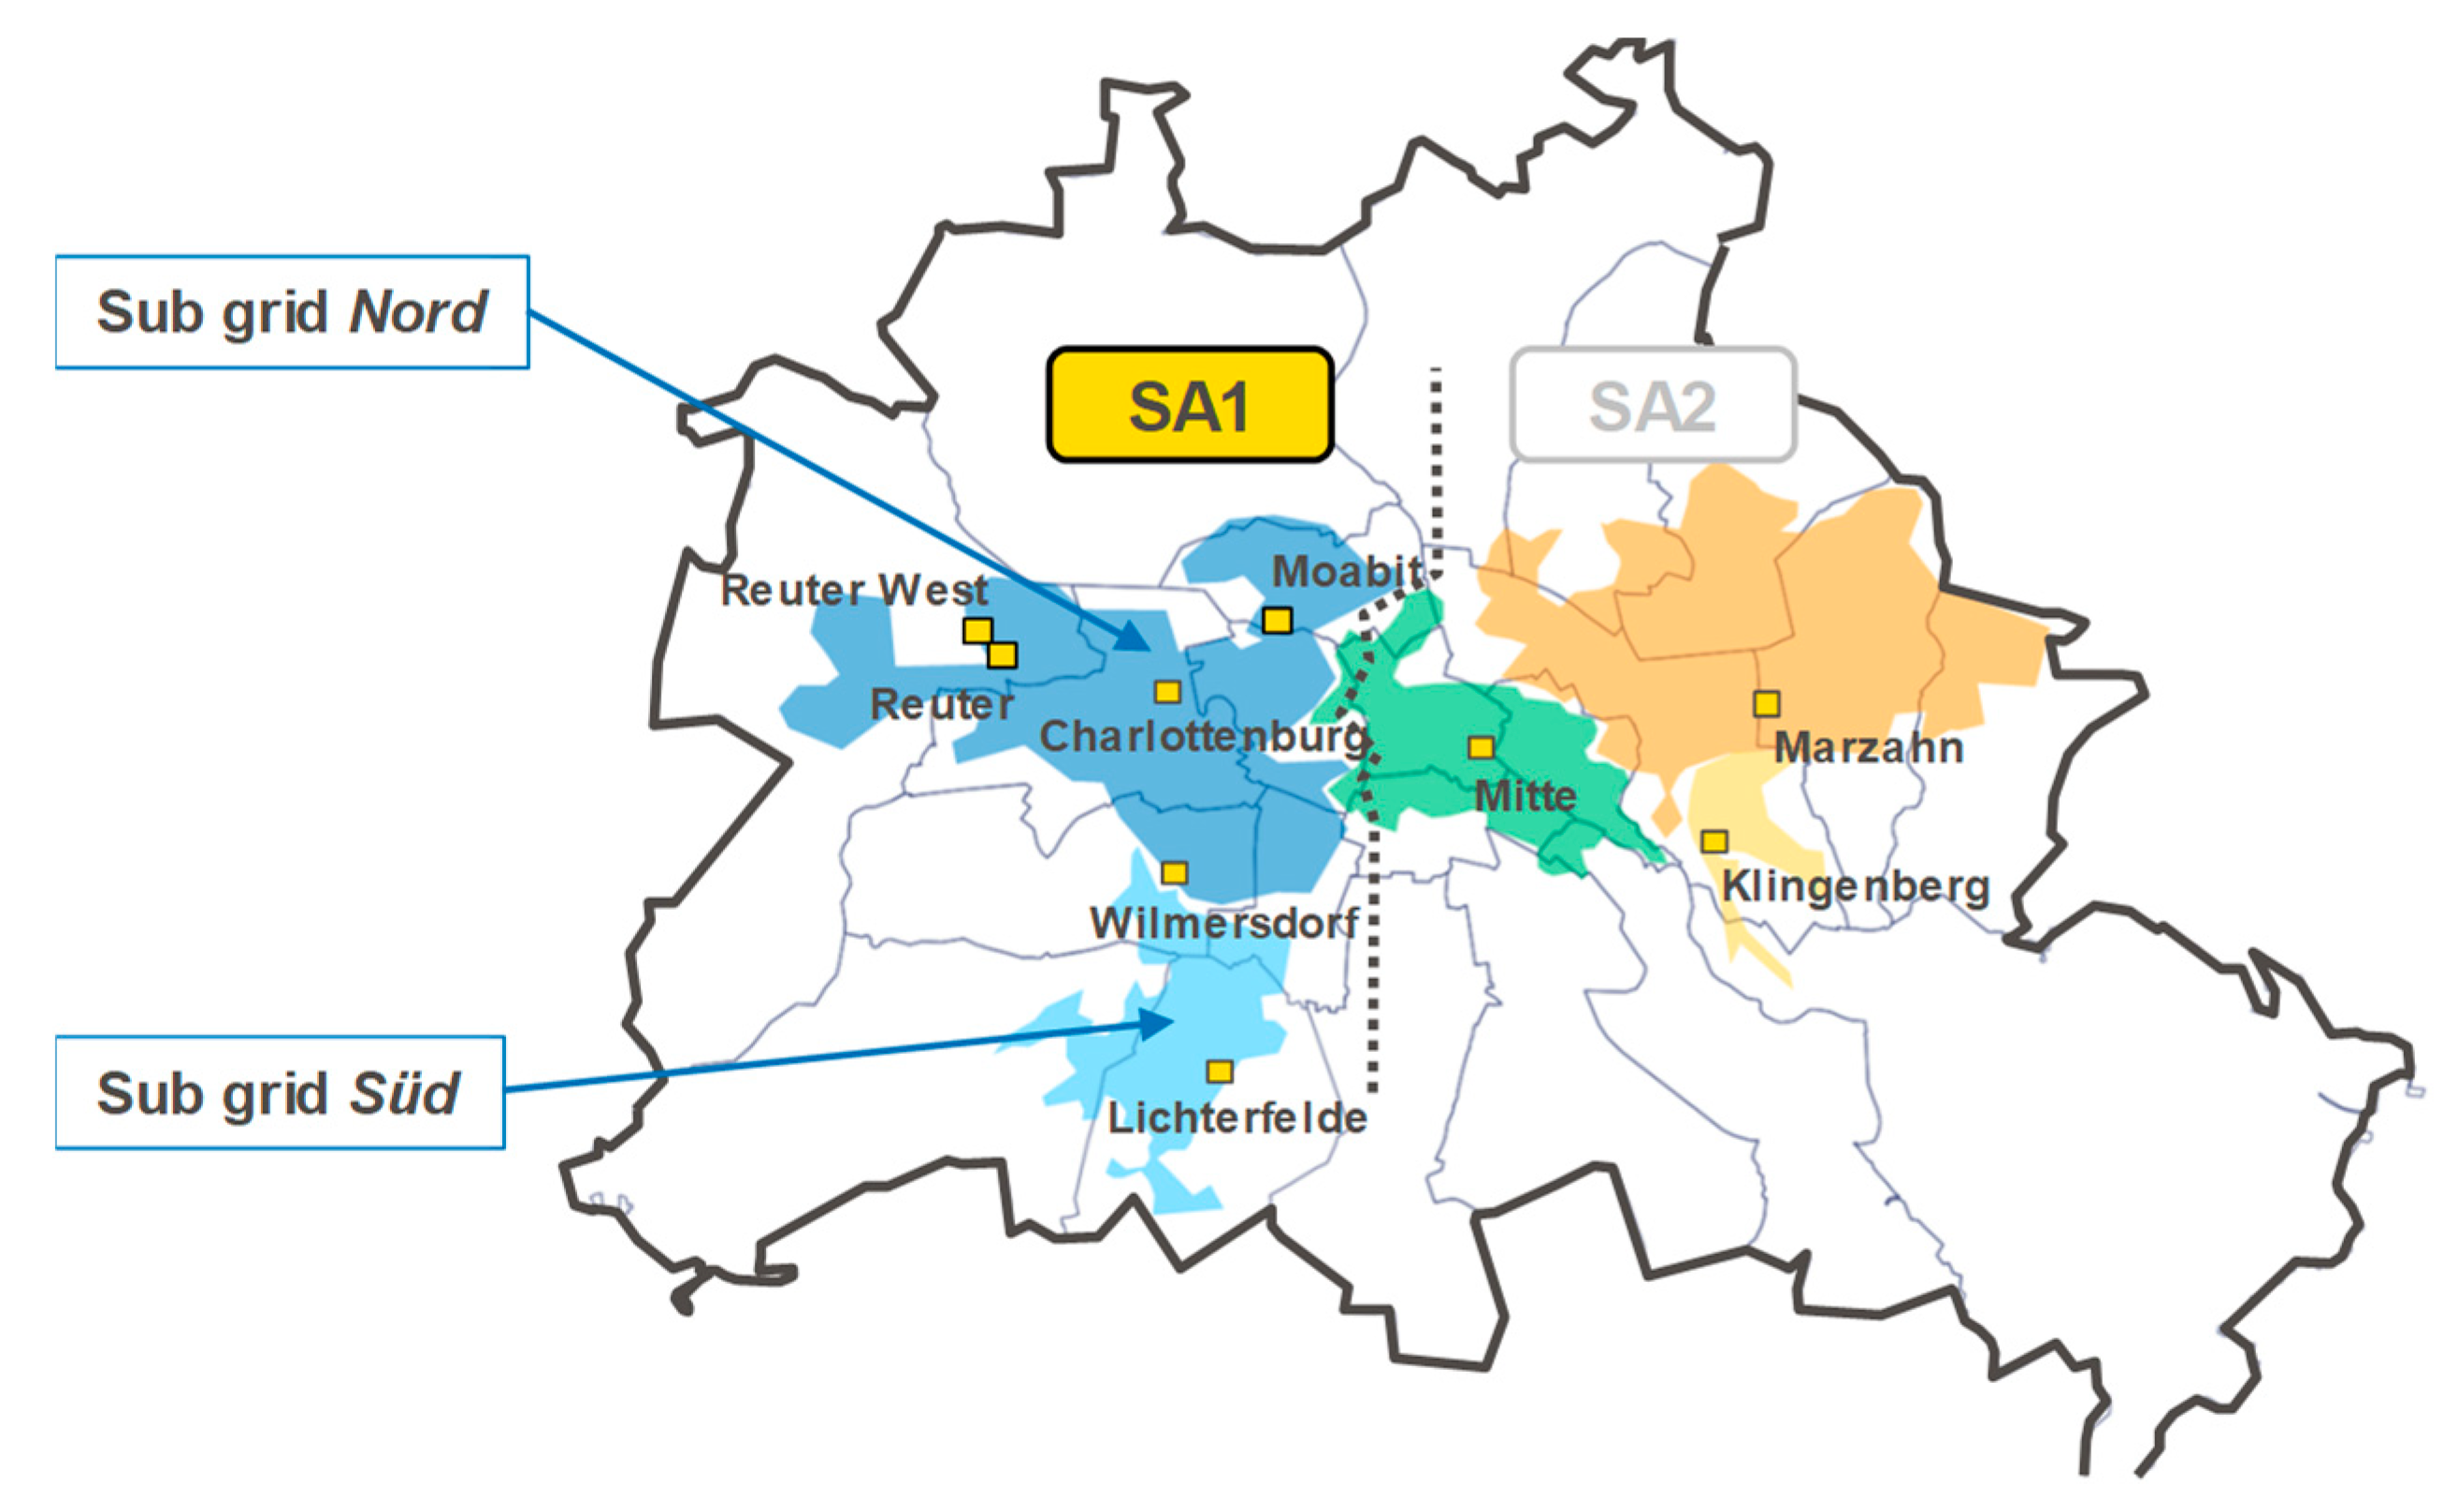
2. District Heating Network in Berlin

Various companies operate district heating networks and generation units in the city. Vattenfall operates the largest network [33,41], which supplies 90% of the district heating demand (10 TWh per year) and around 1.3 million household equivalents [36]. This district heating system consists of an interconnected district heating grid and heat generation assets. The installed capacity of generation assets totals 5.6 GWth for heat generation and 2.3 GWel for power generation, which are spread across the city in nine main sites and various smaller sites. The district heating system has a total grid length of 2000 km, which is divided into two supply areas: SA1 and SA2 (Figure 1). Although hydraulically connected, the two supply areas have developed differently for historical reasons and are therefore largely decoupled from each other in operation. Supply area 1 (SA1) extends over the western part of Berlin and demands 4.7 TWh per year of district heat, while SA2 covers the eastern part of the city and demands 5.3 TWh per year of district heating. SA1 can be subdivided into northern and southern sub-grids, with two coal-fired cogeneration units at Reuter West and one unit at Moabit, adding a thermal capacity of 856 MW (2.3–2.8 TWh annual heat output) to the northern sub-grid. These two sites generate 60% of district heating in SA1. We focused on supply area 1 and especially on the northern sub-grid because the three coal-fired units to be replaced are located in that supply area. Further characteristics of the supply area 1, including supply temperatures, capacities, and producing units, are presented in Appendix A.

3. Methodology

The approach used in this study to evaluate the feasibility of different pathways to phase out coal in Berlin is shown in Figure 2. In the first step, a framework and a set of plausible future scenarios describing different climate policy goals in Germany were defined. In a second step, a model of the European electricity market was created to analyze how generation shares by technology, electricity prices, and emissions vary for the different scenarios. In a third step, a model of the energy demand for the entire stock of buildings in Berlin was created to assess how the demand changes over time for the different scenarios. The scenario framework, the electricity market, and heat demand models are described in Section 4. In a fourth step (Section 5), the technical potential of alternative low-carbon resources and technologies as substitutes for heat-based coal was evaluated for Berlin and transformation paths were defined. These transformation paths are portfolios of technologies including existing and new potential supply options. Finally, a heat supply model (Section 6) was used to investigate the optimal dispatch of the defined transformation paths feeding the district heating network in SA1 as well as the operation of decentralized units (typically apartment buildings). The method focuses largely on the district heating network in SA1 and, to a lesser extent, on that of decentralized sites. The heat supply model estimates not only generation volumes, but also associated investments, operational costs, and emissions.

4. Scenario Framework

4.1. Scenario Definition

Three scenarios with different climate policy objectives were defined in this study:
  • A reference scenario named “current policies”, assuming a continuation of currently implemented policies and measures. This scenario may lead to a situation where policy objectives (e.g., the share of renewables or the reduction in greenhouse gas emissions) cannot be reached.
  • A scenario called “KS 80” (KS is an abbreviation of Klimaschutz (in German) meaning climate mitigation), assuming the adoption of policies and measures for reaching a reduction of 80% in emissions of greenhouse gases in 2050 relative to 1990.
  • A scenario called “KS 95”, assuming the adoption of policies and measures for reaching a reduction of 95% in emissions of greenhouse gases in 2050 relative to 1990.
All scenarios assume a continuation of the current economic and demographic development in Germany. Policy objectives on greenhouse gas emission reductions for KS 80 and KS 95 scenarios are fully in line with the German Climate Action Plan, which aims to reduce emissions in greenhouse gases by at least 80% and at most 95% [42]. An overview of the implications of these scenarios is shown in Appendix B.

4.2. Model of the Electricity Market

A model of the electricity market (EuroMOD) is the fundamental component of the scenario framework. EuroMOD is a merit-order model of the German electricity market and 13 neighboring regions of the European electricity market. The model determines the economically optimal future power plant fleet as well as its optimal dispatch. This optimization is performed with an hourly resolution, following a classical merit-order approach, as described in detail in the literature (e.g., [43,44,45,46,47,48]). Key inputs of the EuroMOD model include fuel prices, power demand profiles, demand profiles for heat pumps and electric vehicles, characteristics of power plants and storage facilities, capacities and costs of industrial load management facilities, and international transmission capacities, among others. Regarding fuel prices, the model starts with actual prices for the period 2018–2025 and then assumes the absolute development of commodity prices of the current policies and sustainable development scenarios published by the World Energy Outlook from 2025 onward [49]. The prices for coal, natural gas, and emission allowances used as inputs in EuroMOD are shown in Figure 3. It is assumed that from 2031 onward, gas suppliers must deliver a mix of synthetic fuels and natural gas. Here, the share of synthetic fuels rises linearly up to 100% in 2050. Further inputs are taken from three studies describing possible transformation paths for Germany that envision 80% and 95% emission reductions in the future [50,51,52]. Topics covered by these studies include the spread of electric vehicles and power to heat applications, the increasing share of renewables, and the generation of synthetic fuels. A detailed comparison of the results of these studies and the derived assumptions was published [39]. The output of EuroMOD consists of detailed time series of power generation volumes disaggregated by resource and technology, marginal costs, and electricity prices with an hourly resolution. The bottom right chart in Figure 3 shows the resulting baseload electricity price, which rises in all three scenarios from 2023 onward. However, in both climate protection scenarios, electricity prices decrease from around 2030 onwards. The reason for this is that the availability of electricity from renewable energy sources (RES) grows faster than the demand, which results in electricity prices decreasing to almost zero.

4.3. Model of the Heat Demand

A Berlin building energy model was developed as part of the Climate-neutral Berlin 2050 study [53], which was further used in this study. The model covers the entire stock of buildings in Berlin in 2010 and offers a large set of information in a georeferenced format including year of erection, type of building, demand for heating and hot water, total floor area, etc. In this study, buildings were aggregated into blocks to reduce complexity. The Climate-neutral Berlin 2050 study considered three different scenarios regarding how the energy demand for heating and hot water may develop until 2050:
  • In the Reference scenario, the current trends continue in the future. The rate of renovation would remain at 0.8% of buildings per year, while the living surface per capita would rise from 39 to 42 m2.
  • The “Ziel 1” (Ziel meaning objective in German) scenario assumes a rate of renovation of 1.5% of buildings per year, while the current living surface per capita (39 m2) remains constant in the future.
  • The “Ziel 2” scenario assumes a rate of renovation of 2.2% of buildings per year combined with a living surface per capita of 36 m2 in the future. This is further combined with the assumption that whenever a building is renovated, the renovation will lead to very high reductions in the energy demand for heating.
Then, it is assumed that policy scenarios CP, KS 80, and KS 95 match the abovementioned Reference, Ziel 1, and Ziel 2 heat demand scenarios, respectively. However, one adjustment is made: the heat demand is scaled up to a population of 4 million inhabitants as currently expected by the Senate of Berlin. The Berlin building energy model results in estimations of the future energy demand of buildings but does not calculate the fraction of those supplied with district heating. Thus, some assumptions are made: Firstly, the area that is already supplied with district heating is identified (blue line in Figure 4a). It is assumed that in the future, district heating will continue being available in this area. The market share for this area is ~30%; it is assumed that through network densification, this share will grow to 40% by 2050 in the CP scenario and to 60% in KS 80 and KS 95 scenarios (in line with the Climate-neutral Berlin study). Regarding grid expansion, scenarios KS 80 and KS 95 assume that the network will expand in the future to those blocks with a heat density higher than 400 kWh/year/m2 that are located at a maximum of 1 km away from the current network. In the CP scenario, there is no extension of the grid. The heat demand in the south sub-grid was evaluated similarly to that in the north sub-grid.
Figure 4b shows the development of the estimated heat demand in all three scenarios. In the current policies scenario, unchanged renovation rates and living surface per capita lead to an increase in the heat demand of 12% in 2050 compared to current levels. In KS 95, higher renovation rates combined with lower living surface per capita overcompensate for the higher demand for district heating from 2025 onward and result in a reduction of 14% in the heat demand by 2050 compared to current levels. In KS 80, this overcompensating effect can be observed from 2040 onward, which results in an overall increase in heat demand of 9% compared to current levels.

5. Evaluation of the Energy Potential from Different Sources

The energy potential from different resources for heat production was evaluated. Conversion routes proposed in the BEK 2030 Climate Protection Programme for a sustainable supply of heat in Berlin [54] were used as starting point. These include: biomass CHP/heating plant, solar thermal heat, geothermal heat, industrial and commercial excess heat, river water heat, gas-based CHP, and power-to-heat. These conversion routes were analyzed for specific locations in SA1 in Berlin and their associated technical energy potential was estimated. Firstly, the site-specific space and resource availability was qualitatively evaluated (Table 1). Secondly, the availability of energy resources required in the conversion process was quantified for the most suitable locations. This is described in detail in the following sub-sections. Generally, the key objective in KS 80 and KS 95 is to replace coal-based heat with as much low-carbon heat as possible, whereas in scenario CP, the objective is to phase out coal as cost-effectively as possible.

5.1. Biomass CHP/Heating Plant

In the current portfolio, only two sites have the infrastructure to handle solid fuels and sufficient space to store biomass: Reuter and Moabit. For the CP scenario, the conversion is proposed of the existing coal CHP in Moabit (136 MWth co-firing 40% biomass [55]) into a unit burning 100% biomass with outputs of 58 MWel and 60 MWth. For KS 80 and KS 95, the construction of dedicated biomass boiler is proposed with a thermal output of 90 MWth. In these two cases, assuming 5000 full operating hours annually and using wood chips with an higher heating value (HHV) of 12 GJ/Ton (35% moisture), the estimated annual demand for biomass would range between 130,000 and 200,000 tons (dry matter). The next step was to investigate whether sufficient biomass would be available around Berlin to feed these units. Then, the technical energy potential from forestry residues and landscape management was evaluated for a radius of 250 km around the city. The primary information source was the German Biomass Resource Database [56,57,58]. Estimations are shown in Figure 5. The technical potential that is currently unused ranges between 0.3 and 4 million tons of dry matter (DM), for radiuses of 50 and 250+ km around Berlin, respectively. This shows that there is sufficient biomass available within a radius of 50–100 km around Berlin to feed either a refurbished-heat-only boiler or a new dedicated facility.

5.2. Heat from Municipal Solid Waste (MSW) and Sewage

Municipal solid waste has been burned since 1967 in the Ruhleben waste incineration plant operated by the public cleaning company Berliner Stadtreinigung (BSR). This site annually combusts 520,000–580,000 tons of municipal waste from 2 million households in Berlin, which corresponds to 60% of the total waste produced in the city [59]. Steam produced from the combustion of waste amounts to 1.3 million tons per year and is delivered via pipeline to the neighboring Reuter CHP power unit operated by Vattenfall. The Reuter CHP power unit is advantageously located, as it offers not only integration with the neighbor waste incineration plant but also with the public water treatment plant operated by the public water supply company Berliner Wasserbetriebe (BWB), also located in Ruhleben. Three options to exploit synergies between these three closely located plants have been identified: (1) installation of new steam CHP turbines, (2) use of an absorption heat pump to exploit the low temperature heat available in the flue gas from the waste incineration plant, and (3) use of a compression heat pump to exploit the low temperature heat available at the sewage treatment plant. Assuming that the amounts of waste incinerated and water treated would continue in the future, these options would contribute to 100, 48, and 19 MWth, respectively (167 MWth in total).

5.3. Industrial and Commercial Excess Heat

Data on waste heat from 124 industrial and commercial companies were collected. In total, a theoretical annual potential of 700 GWh with an output of approximately 135 MW was estimated. However, heat amounts and temperatures from the different companies are heterogeneous and often do not match the requirements of the district heating network. In some cases, additional heating is necessary to achieve the feeding temperature. Costs associated with exploiting this excess heat mainly arise from extending the district heating network to the different sources. Therefore, the shorter distance of the source to the network, the larger the cost-effectiveness. Industrial sources with a potential output of 0.5 MWth and connection costs below 3 cents/kWh are considered highly attractive. Commercial sources like hospitals and hotels with similar outputs and connection costs are considered to be of medium attractiveness. The rest is considered low attractiveness. The technical economic potential, associated with industrial sources with high attractiveness only, results in 300 GWh a year from 27 different sources (Table 2).

5.4. Geothermal Heat

Previous studies have found that the geothermal potential for heat supply in Berlin exists in deep layers of up to 2000 m [60,61,62,63,64,65]. However, the uncertainty regarding the spatial distribution of rock strata, the local characteristics, and their suitability for geothermal use is large. From the different production sites in SA1, only Moabit and Reuter have available area for geothermal exploitation. General geothermal conditions at these sites are shown in Table 3. While the hydraulic properties for conveying heat from the earth’s layers to the surface are expected to be more advantageous at the Reuter site, higher temperatures are likely to be reached due to the greater depth at the Moabit site. The potential extraction at the two locations would occur via a distracted well with a horizontal section in the Delfurth lower bank of the Buntsandstein, where maximum temperatures between 60 and 70 °C can be expected. While these temperatures are not sufficient for generating power, they could be increased to 80–110 °C with a heat pump to feed the district heating network. By integrating a heat pump and an aquifer, a thermal output of 8.8 MWth could be achieved.

5.5. Solar Thermal Heat

No areas for a solar thermal system could be identified in the closer urban area. Therefore, at this stage, only the potential of a hypothetical system was evaluated. Solar thermal systems with collector areas of up to 1 million m2, seasonal heat storage of up to 3 million m3, and an electrically-driven heat pump of 75 MWth capacity were examined. Due to the fluctuating intensity of solar radiation, the usable heat from such systems varies significantly between summer and winter. This results in an opposing behavior between heat generation potential and demand from the district heating network. Heat production costs are significantly high (100–700 cents/kWh) and, to a large extent, depend on the solar collector area, the distance to the district heating network, and the land prices (details in [39]). In conclusion, large-scale solar thermal heat plants appear unfeasible for heat production in Berlin as they are costly and require large surfaces that are currently unavailable within the city.

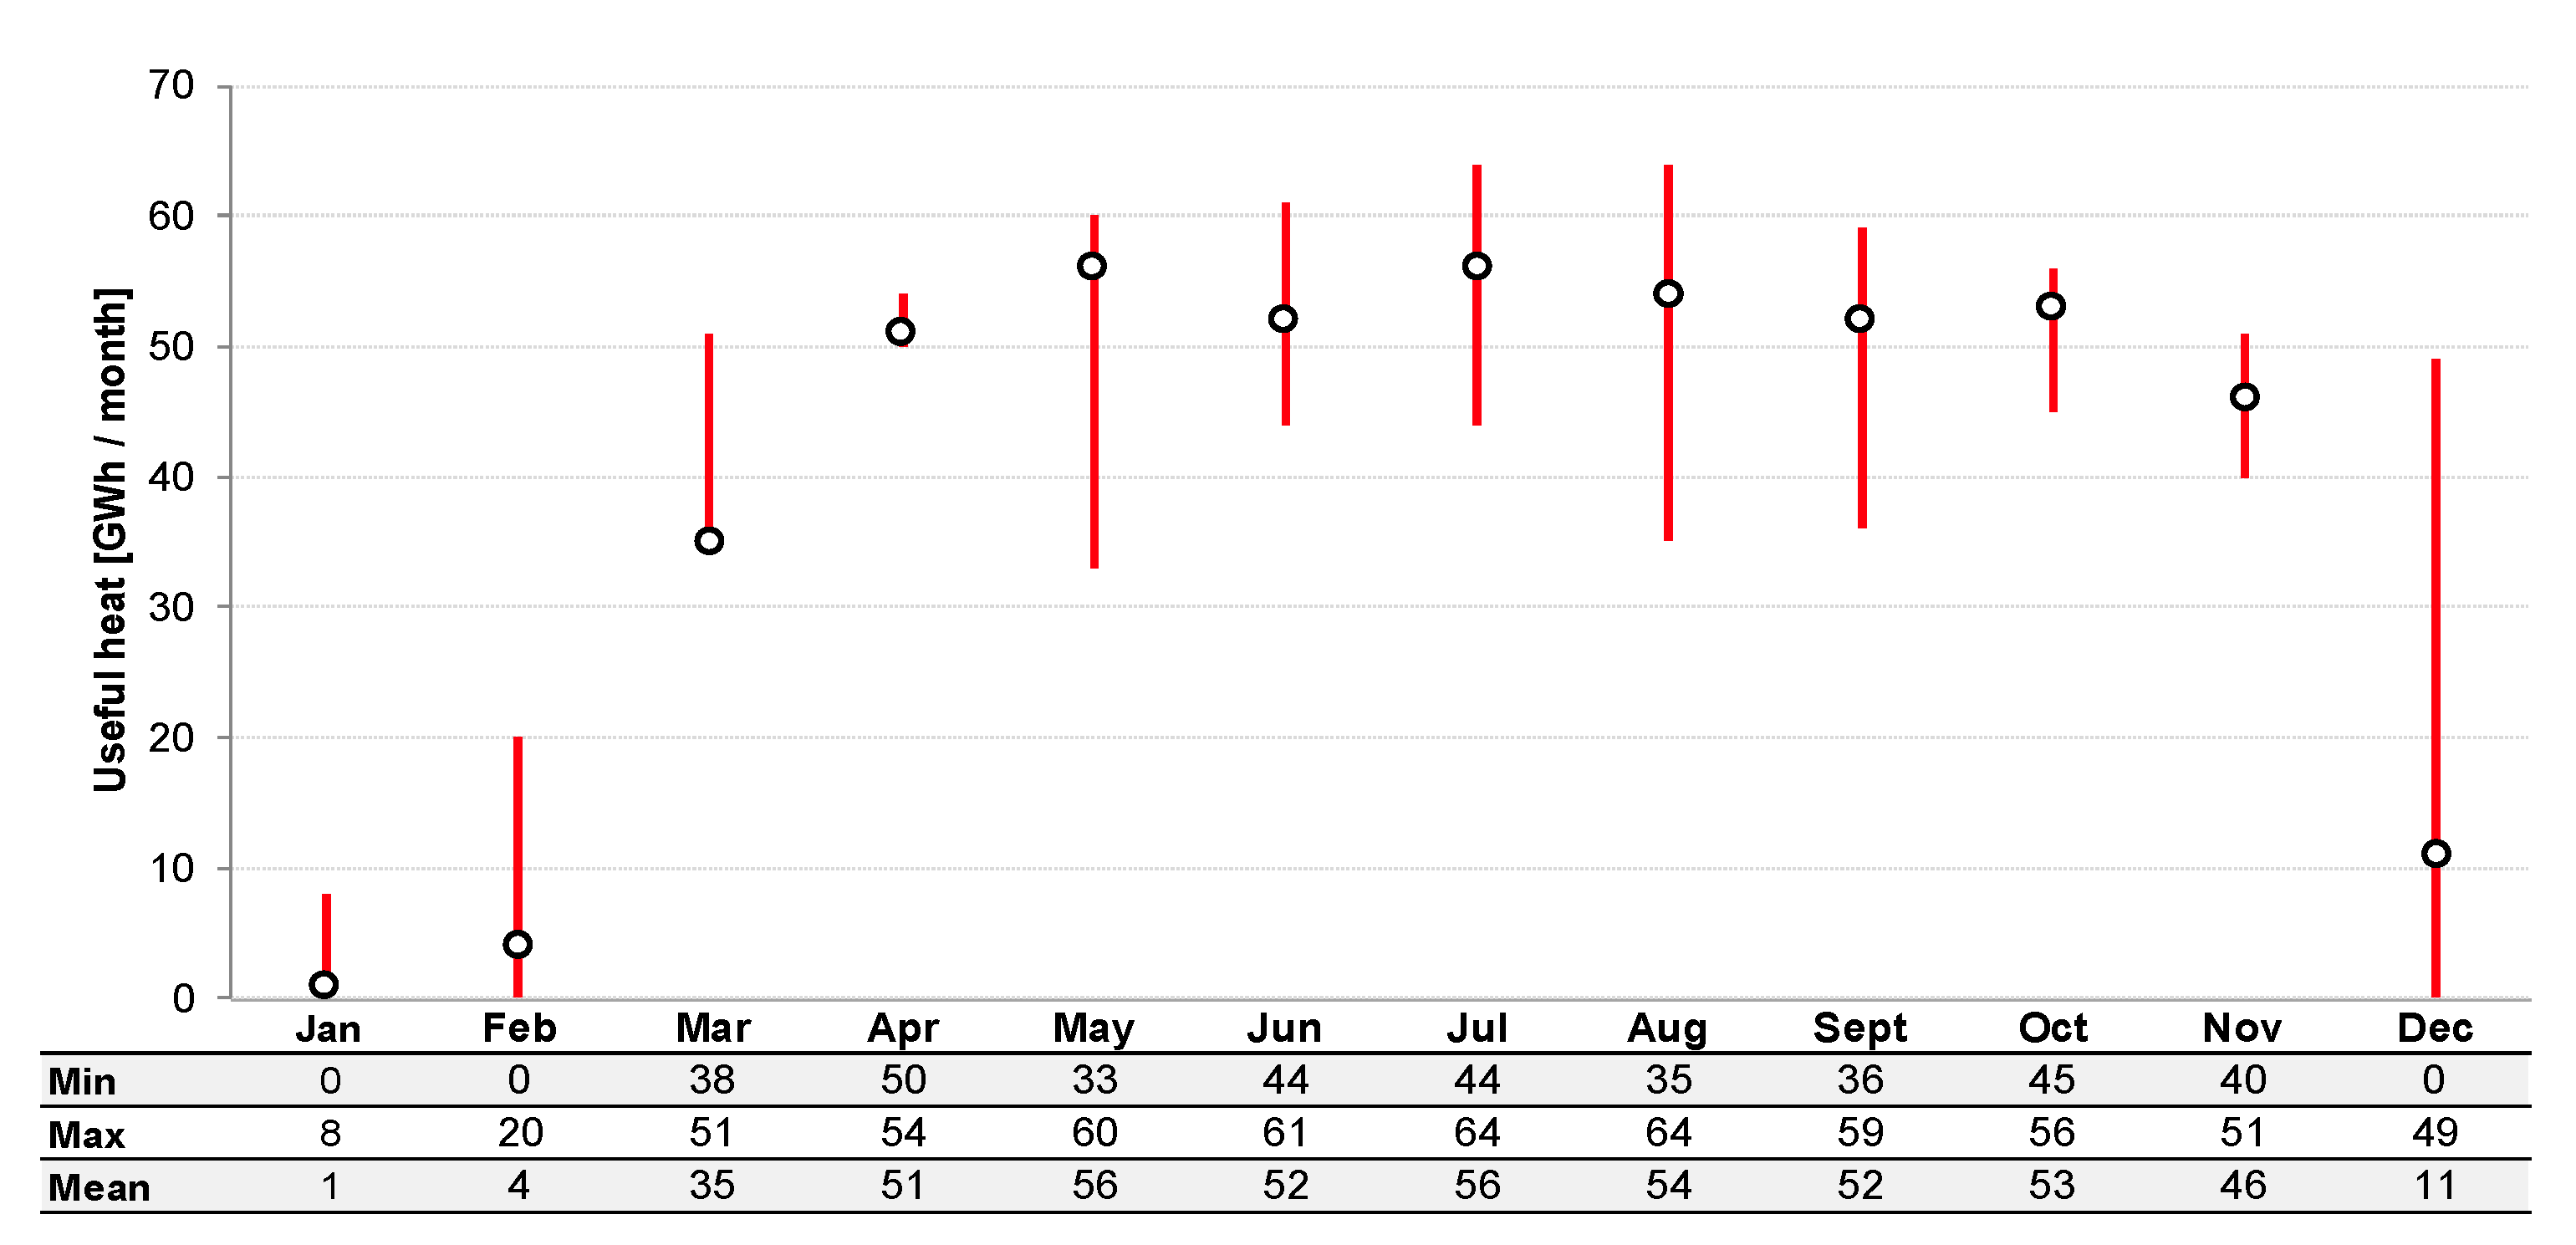
5.6. River Water Heat

The concept of exploiting the heat available in the water of the Spree River and increase its temperature with an electrical heat pump was evaluated. The Reuter and Reuter West sites were identified as the most suitable locations. The heat pump could feed heat at a temperature of 80–88 °C and a boiler could increase the temperature if needed. Over the course of the year, both the water temperature and volume flow of the Spree River change significantly. Whereas the water temperature varies between an average of 5 °C in winter and 23 °C in summer, the opposite occurs to the water flow, with an average flow rate of 50 m3/s in winter and about 20 m3/s in summer. Figure 6 shows the resulting heat output throughout the year for a heat pump with an output of 90 MW and a required flow temperature of 80 °C. The heat output reaches a maximum during summer months with up to 64 GWh per month, while it decreases to zero in winter months. This is contrary to the variation in the heat demand of the system, which is maximal during winter and minimal during summer. Additionally, investment costs (including a fish protection system and seasonal storage) and operating costs (if electricity from the public grid is used) are expected to be significantly high. In conclusion, exploiting the heat from the Spree River appears unfeasible, not only because of the strong imbalance between seasonal potential and seasonal demand, but also because of the expected high costs.

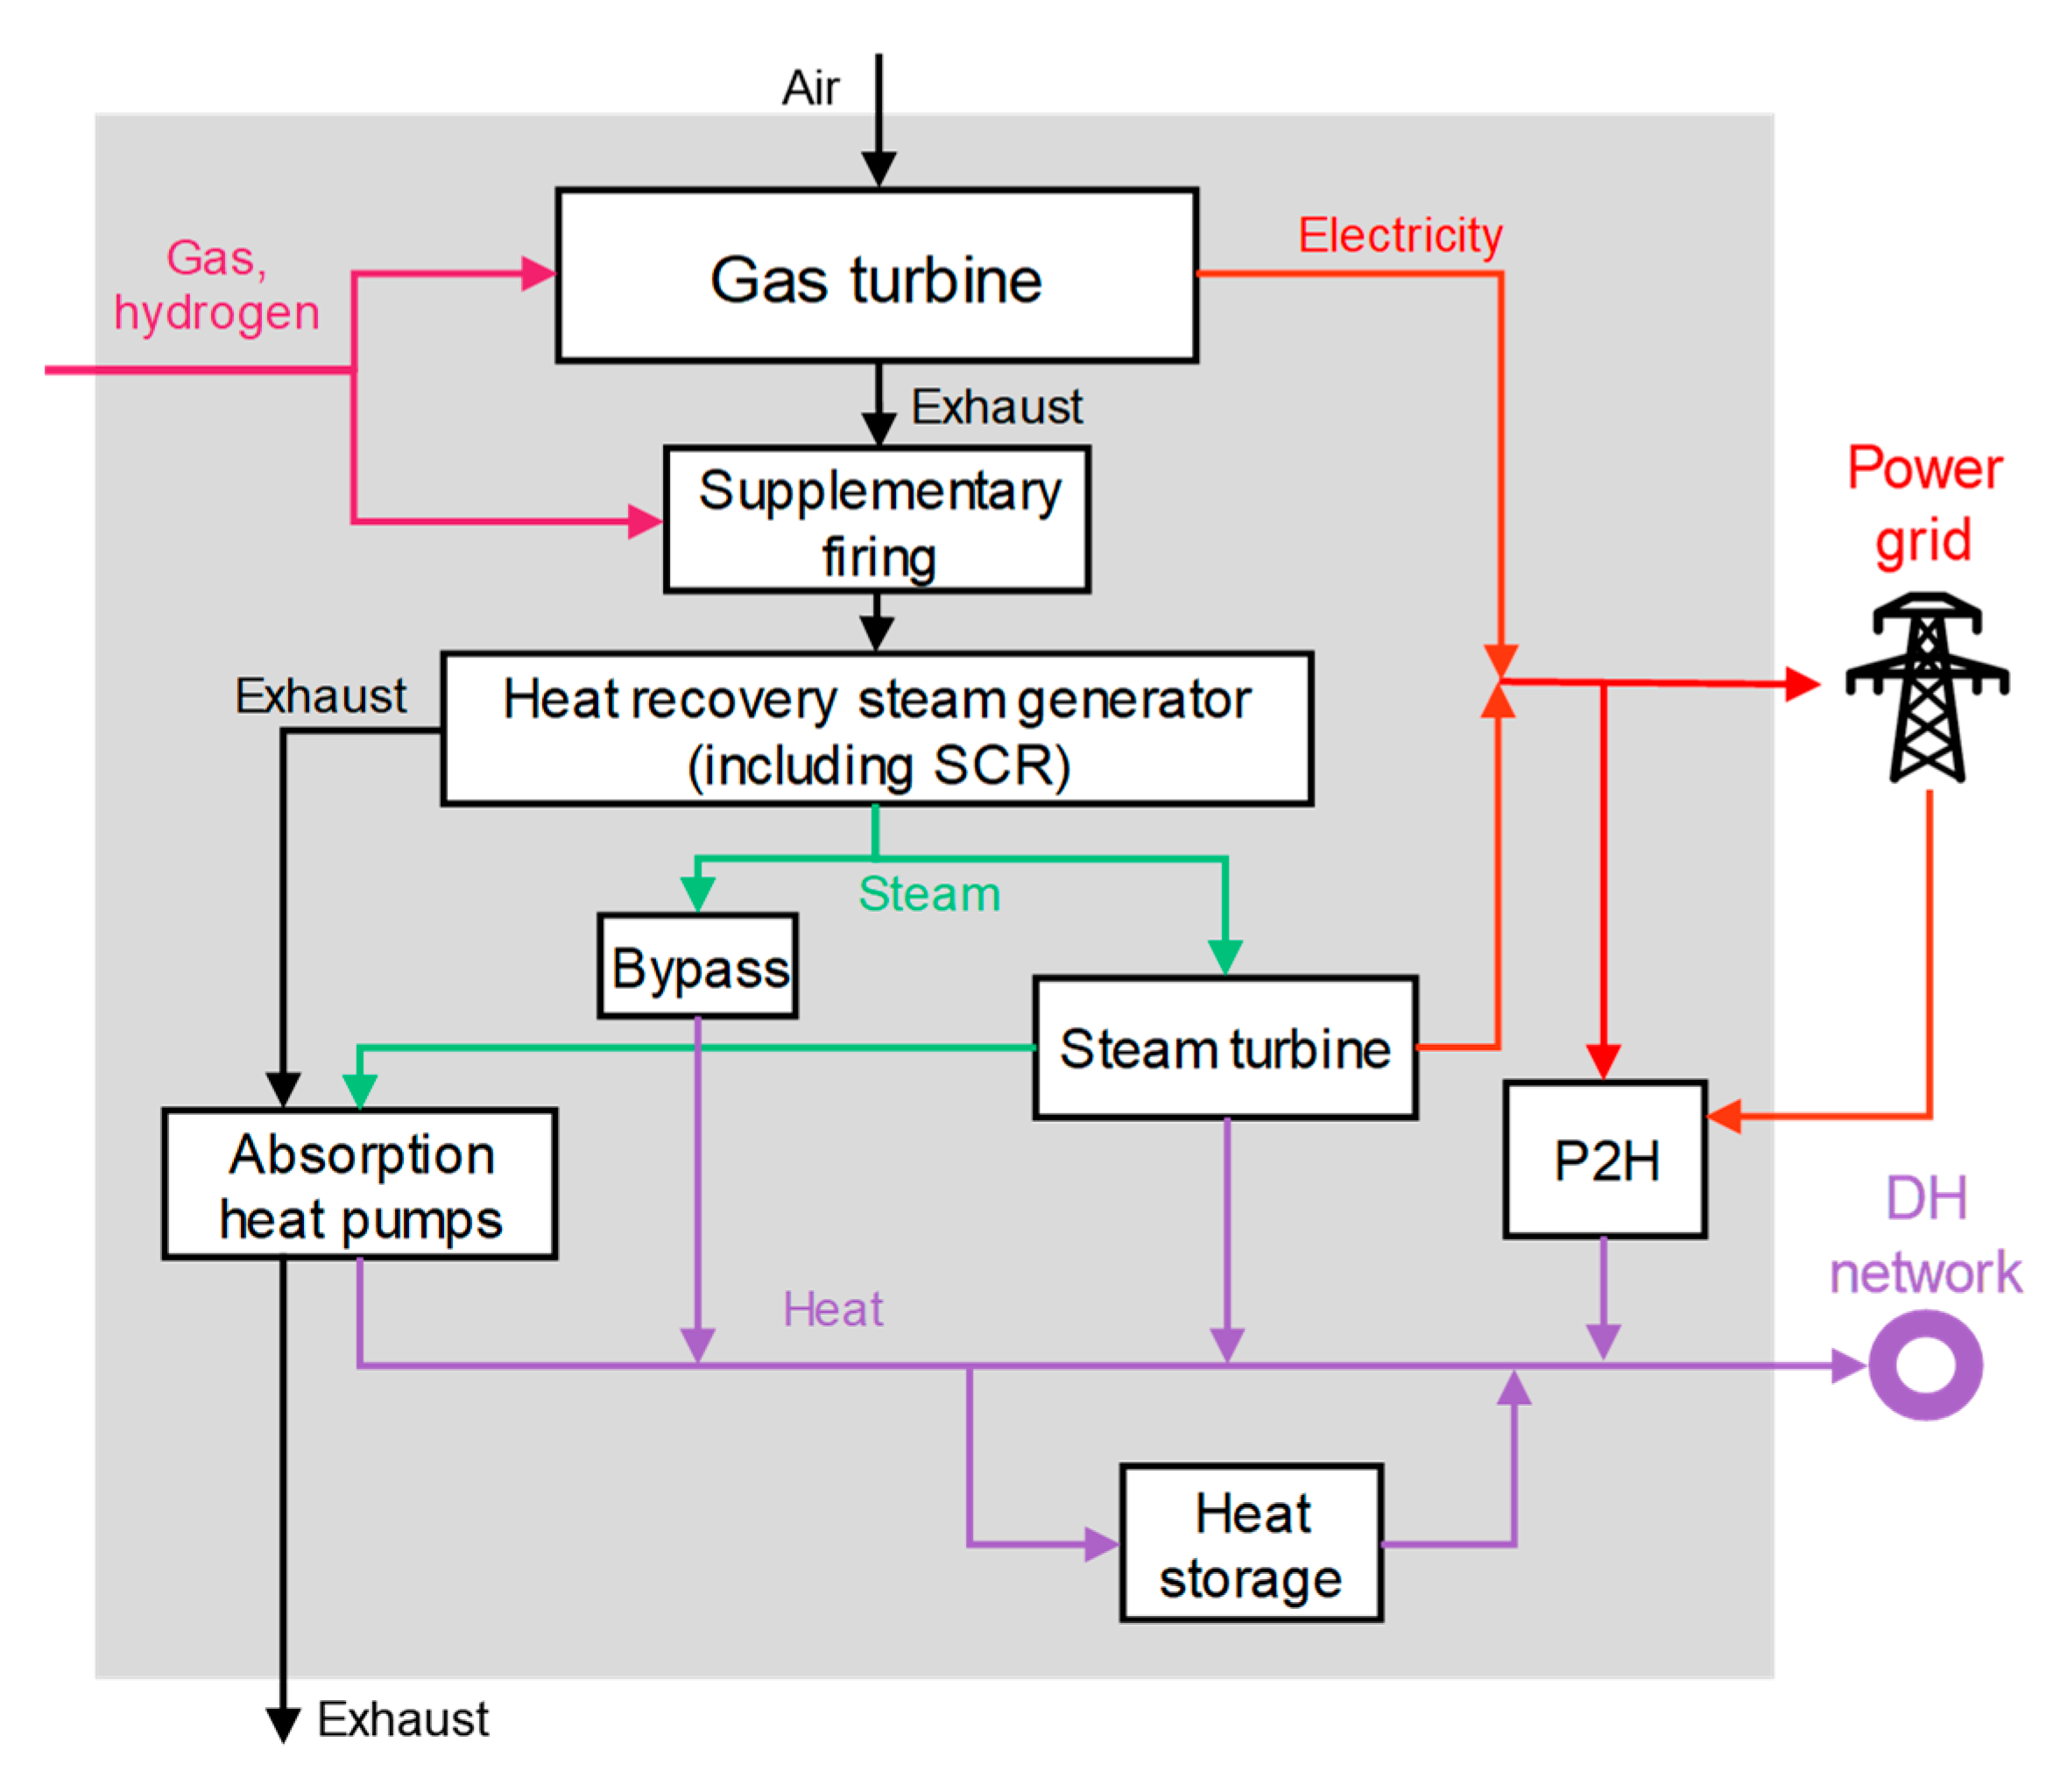
5.7. Hybrid CHP Plant: Combining Power-To-Heat and a Gas-Based CHP

The limited heat potential from the low-carbon sources described above suggests that additional capacity from other sources is needed to meet the future demand. A combination of gas- and electricity-based technologies appears to be the most feasible option to close this gap as they could leverage the existing infrastructure and flexibly and cost-effectively supply heat. Power-to-heat refers here to boilers using electrodes to efficiently generate hot water from electricity (efficiency ~99% [66]). As the feed-in patterns of wind and solar are only partly correlated with the electricity demand [67], power-to-heat could integrate growing amounts of variable renewable energy for producing heat. This could lead to a reduction in emissions in the heat sector and an increased flexibility of the power grid [29,68,69,70]. For the current policies scenario, it is assumed that the current power-to-heat (P2H) capacity (120 MWth, [71]) remains unchanged. For KS 80 and KS 95, it is assumed that the capacity would grow to 220 MWth from 2030 onward.
The gas-based CHP plant is a modular and highly flexible unit able to burn mixtures of natural gas, synthetic natural gas (SNG), and hydrogen. This plant is envisaged only for scenarios KS 80 and KS 95. In contrast, for the CP scenario, a standard gas-based CHP plant with limited flexibility that is unable to burn hydrogen (thus, not labeled here as a hybrid CHP plant) is used. The proposed CHP plant is a combined cycle gas turbine (CCGT), consisting of multiple gas turbines and heat recovery steam generators (HRSG; including selective catalytic reduction -SCR- for NOx control) and a single steam turbine (Figure 7). The system includes supplementary firing and the option to use steam only for heat generation (i.e., by-pass the steam turbine). Additionally, absorption heat pumps are included in each HRSG to exploit the heat available from condensing flue gas.
The key advantages of this concept include its ability to change the power-to-heat ratio from zero to more than one and a relatively low minimum complaint load. The system was modelled using the process engineering software EBSILON Professional v13 [72]. Estimated capacities of this plant for KS 80 and KS 95 are 644 and 503 MWth, respectively. The combination of power-to-heat and the gas-based CHP plant enables a high level of flexibility in power and heat generation. The CHP plant is operated especially when the supply of renewables is low. Once the supply of renewables increases, the CHP plant reduces or even stops generating power. Then, P2H can extract surplus power from the grid to generate heat, if necessary. The described hybrid system could lead to a significant reduction in emissions compared to a conventional coal-fired power plant, particularly if high amounts of P2H from renewable sources and green SNG/hydrogen are used. Due to hydraulic and space restrictions, the construction of a hybrid CHP plant would only be feasible at the Reuter West site.

5.8. Overview

An overview of the potential capacity of the different sources to replace coal for the different scenarios is presented in Table 4 and Figure 8. The analysis shows that significant potential exists in power-to-heat, municipal solid waste incineration, sewage, biomass, and, to a lesser extent, from geothermal and industrial and commercial waste heat. Conversely, exploiting heat from solar thermal resources and from the Spree River was found to be unfeasible. The former requires large surface areas that are currently not available, whereas the latter presents a strong imbalance between seasonal potential and seasonal demand.
Total capacity for producing heat from low-carbon sources amounts to 279, 521, and 521 MWth in scenarios CP, KS 80, and KS 95, respectively. However, since the maximal capacity demand in SA1 (1437, 1556, and 1415 MWth, respectively) is higher than this potential, additional capacity is required. To close this gap, gas-based solutions are proposed. In KS 80 and KS 95 scenarios, a gas-based hybrid CHP is proposed. This is a highly efficient and flexible combined cycle gas turbine plant producing heat and power from natural gas, hydrogen, or SNG. In the CP scenario, a standard CCGT system is proposed. Additionally, existing gas-based CHP plants and heat-only boilers are further used to cover this maximal demand, as shown in Figure 8. The optimal operation of the portfolio of assets to minimize associated costs while meeting the demand is analyzed in the next section.

6. Model of the Heat Supply

6.1. Simulation of the Portfolio Feeding the District Heating Network

The dispatch of all generation assets feeding the district heating network was simulated through a bottom-up optimization algorithm called SysMOD, which finds the operation mode of all portfolio assets with lowest possible costs that satisfies the heat demand on an hourly basis for the different scenarios. The optimization algorithm used was a mixed integer linear program (MILP), which considers real and integer variables for every generation unit on an hourly basis. There were about 438,000 integer variables ((35 generation units + 15 additional variables) × 8760 h) and the same amount of real variables per year. The objective function is described by
M i n   i = 0 8760 0 n [ v a r i a b l e   c o s t i , n r e v e n u e s i , n ] H e a t ,   e l e c t r i c i t y
where n is the number of generation units and i represents the hours in a year. The variable costs and revenues are linear equations depending firstly on the heat and electricity generation volumes and secondly on prices, which vary every hour. The objective function was solved for each year individually for the period 2021–2050. To reduce the computational effort, only 15 years out of this evaluation period were computed. The optimization problem was subject to various constraints that can be grouped into three groups: technical constraints of the (1) generation units, (2) the grid, and (3) the modeling. The technical constraints of the generation units include the minimum and maximum generation capacity, the minimum number of operating hours per year, and the minimum downtime. Regarding constraints of the grid, the most important one is that the heat supply must meet the heat demand at all times. Additional grid restrictions include the grid capacities for interconnecting the different locations and the upper limits of the heat generation of particular subsets of generation units, which limit the capacity of the grid. These upper limits vary over time because changing ambient temperatures lead to changing grid temperatures and transmission capacities of the grid. Constraints of the last type are model-inherent and relate to cases where one generation unit is decomposed into several modules, e.g., modeling the hybrid CHP plant, which consists of different modules for P2H, gas and steam turbines, the absorption heat pumps, etc.
SysMOD consists of a user interface, based on Microsoft Excel and Visual Basic for Applications (VBA), into which all parameters are entered and transformed into the general algebraic modeling system (GAMS)-readable format [73]. The SysMOD interface and its core solving capabilities are similar to other state-of-the-art bottom-up tools like TIMES [45], TIMES-VEDA [74], and the models proposed by Christidis et al. [75,76], having a stronger focus on modeling large-scale district heating networks. Finally, the mathematical optimization solver Gurobi [77] was used to find the optimal solutions. The outputs of SysMOD include annual costs, revenues, generation volumes of heat and electricity, volumes of fuels, and emission allowances disaggregated by generation unit and hour.

6.2. Simulation of Decentralized Supply Options

In addition to the portfolio feeding the district heating network, three decentralized supply options were evaluated. These options are as climate-friendly as possible to compare their cost-effectiveness and potential to reduce emissions against the district heating system. These decentralized supply options were evaluated for existing as well as for new buildings. Notably, existing buildings predominate in the stock under consideration. Since a new building is more energy-efficient than an old building, a smaller thermal output is required to supply the demand of a new building. In addition, the portion of the energy demand for hot water is higher in a new building than in an old one. The three investigated decentralized supply options are shown in Figure 9:
-
Decentralized gas engine CHP and boiler: A gas engine CHP coupled with a heat storage tank is dimensioned such that it generates electricity and heat in a fixed ratio throughout the year. An additional gas boiler supplements the heat supply on cold days when the heat needs cannot be covered exclusively by the CHP unit or when the CHP unit fails. The CHP unit generates approx. 60% of the heat on an annual basis.
-
Solar thermal unit and gas boiler: A solar thermal unit on the roof of an apartment building combined with a hot water storage tank generates 50% of the hot water supply and 13–17% of the space heating. The solar thermal unit generates about 13% of the heat in an old building and 17% in a new building. However, there is no seasonal storage due to lack of space in a densely built-up inner-city environment. The factor limiting solar thermal energy is the lack of seasonal storage, not the roof area. The gas boiler generates the rest of the required heat.
-
Air source heat pump, photovoltaic (PV) system, and gas boiler: An electrically-driven bivalent air source heat pump extracts ambient heat from the air and generates heat for hot water and space heating. The system is operated all year round and, in conjunction with a heat storage tank, generates 66% of the heat required. The PV system generates electricity, which is largely consumed by the heat pump. The gas boiler generates additional heat on particularly cold days.
All relevant regulatory framework conditions in Germany for the decentralized supply options were considered. This included investment subsidies, CHP bonus payments, as well as special features such as the tenant electricity model for the option with CHP. However, the decentralized supply options cannot be used in Berlin with full ground coverage due to the following technical restrictions: Firstly, most buildings in inner-city areas are characterized by very high heat load densities (heat requirement per floor area: 500 to over 3000 kWh/m2; Figure 4a). The potential of air source heat pumps and solar thermal systems is often insufficient, especially in old buildings. Secondly, the structural conditions for installing solar thermal systems, air source heat pumps, or block-type CHP units are not available everywhere. Often, there is not enough space, roofs fail to have the required stability, or the noise emissions are too high.

6.3. Evaluation of Costs

A particular challenge was defining indicators that comprehensively describe the costs while not disclosing confidential information. For this reason, costs for generating heat (€/MWth) are not shown in absolute terms but relative to the costs of the reference year 2021. Firstly, the total variable costs were calculated for the reference year and the revenues were subtracted. This equals the sum of the fixed costs and the profit margin. In all the years following 2021, several terms were added to the baseline:
-
Variable costs for generating heat subtracting the revenues from selling electricity for CHP plants.
-
Investments for new generation units and for the densification of the district heating grid (Figure 10). Investments costs were transformed into annuities over the technical lifetime of the generation units. For the calculation of the annuities, a weighted average cost of capital (WACC) was used, which was derived using a standard capital asset pricing model.
-
Variations in fixed costs (e.g., operating costs, staff costs) associated with the operation of new generation units or shut-down of old units.
This calculation led to total costs of heat in real terms for every year. As a last step, these total costs were divided by the sales volume of heat to obtain the cost per MWh of heat relative to 2021 as the key indicator.

6.4. Evaluation of Emissions

Two key aspects limited the boundaries for the estimation of the emissions. Firstly, all upstream emissions that occur during the production and transport of fuels were omitted from the calculation. Secondly, all emissions that result from the incineration of waste were omitted the calculation. This is in line with the recommendations from the AGFW (the German District Heating Association) [78]. AGFW’s reasoning for this is that emissions of waste incineration are emissions associated with the waste management sector or, alternatively, to those sectors that produce the goods that end up as waste. Two different types of indicators were computed: (1) absolute emissions for generating heat and electricity in Berlin, including (a) indirect emissions of electricity usage of power-to-heat units and (b) adjustment terms for changes in the volumes of heat and electricity generated; and (2) emissions per unit of heat generation calculated according to the Carnot method described previously [78].

7. Results

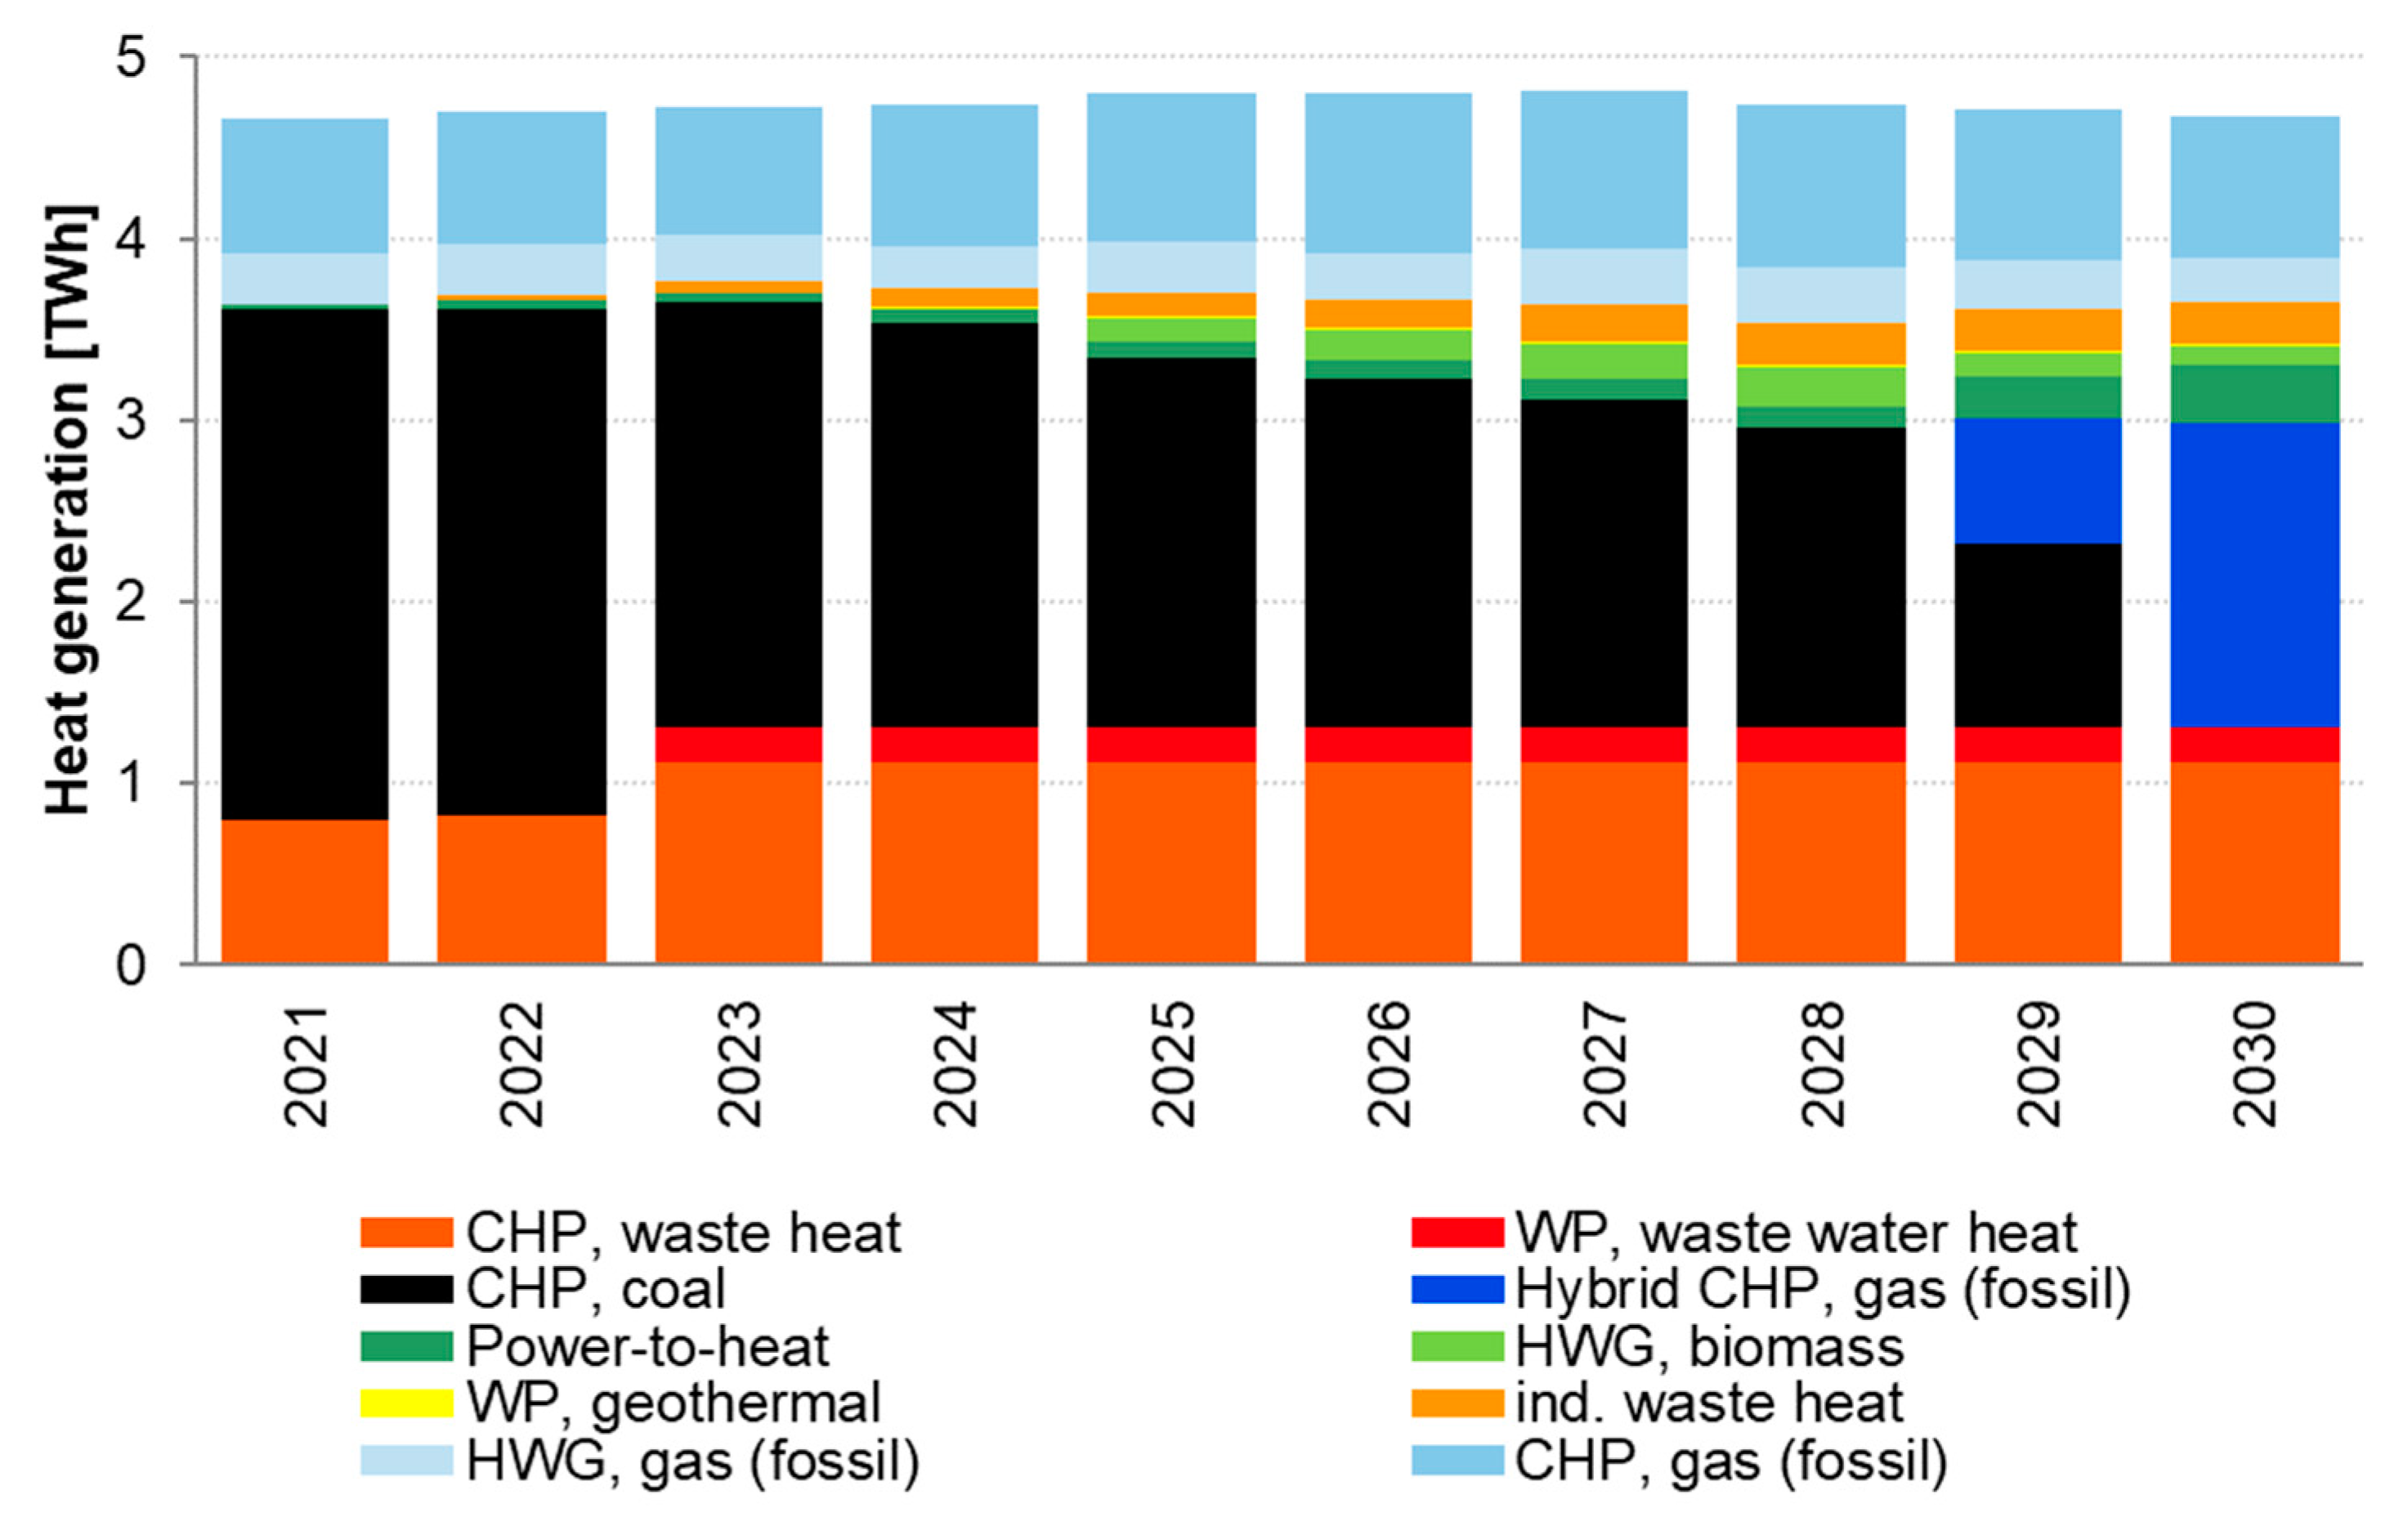
7.1. Heat Generation

The results showed that all three transformation scenarios are technically feasible to phase out coal by 2030 at the latest. Figure 11 shows the heat generation by resource in 2021 and 2030, and how heat generation from coal-fired power plants could be substituted. In 2021, 60% of the heat in SA1 will be generated by the coal-fired power plants at the Moabit and Reuter West sites. The remaining heat is generated on the basis of waste heat and natural gas. In all scenarios, the shares of renewable resources (biomass in the CP scenario and biomass and geothermal in KS80 and KS95 scenarios) and power-to-heat for heat generation increase. The heat generated from P2H is predominantly renewable heat. This is because the conversion of power to heat occurs almost exclusively when there are electricity surpluses in the European electricity market and prices are low. In the two climate protection scenarios, renewable heat sources could replace approx. 16% of coal-based heat. In the CP scenario, the corresponding value is only 3.5%.
In the two climate protection scenarios, heat generation from municipal solid waste incineration increases. This is due to the rise in the efficiency of waste heat use based on unchanged municipal solid waste volumes at the Ruhleben (KS80 and KS96 scenarios assume for incineration a total 580,000 t of solid waste, according to Berliner Stadtreinigung [59]) waste-to-energy plant and the installation of a heat pump for effluents from the Ruhleben sewage treatment plant. In addition, industrial and commercial excess heat gradually increasingly fed into the district heating network during the considered period. The additional heat from waste incineration substitutes approx. 11% of the coal-based heat, while industrial excess heat substitutes 8%, and the heat from the sewage water, 7%. In the current policies scenario, however, no expansion of waste heat use is planned.
Heat from renewable or low-carbon sources cannot entirely substitute coal-based heat, and the gap is filled with gas-based technologies. In the two climate protection scenarios, the gap is covered with a hybrid CHP plant, initially on the basis of natural gas. This highly flexible hybrid CHP plant consists of a modular and highly efficient CHP section, heat storage, and a power-to-heat plant. The components of the CHP section can burn natural gas, hydrogen, and synthetic gas. This plant can be used flexibly and enables cross-sectoral integration of renewable energy. When surplus electricity from renewable sources is available, it allows its integration through power-to-heat technologies. The heat output of the power-to-heat plant is considered as renewable energy in Figure 11. When renewables are not available, the CHP part can produce heat and electricity at high fuel use rates. In the climate protection scenarios, hybrid CHP substitutes approx. 58% of the coal-based heat in 2021. In the current policies scenario, it is assumed that a new natural gas-fired CHP plant consisting of a combined-cycle gas turbine power plant (CCGT) and several gas engines are built. This plant has also a modular design. However, it offers significantly less flexibility than a hybrid CHP plant. The CHP plant generates a large part of the heat. In the CP scenario, the power output from the CHP plant exceeds the output of the hybrid CHP plant due to a higher power-to-heat ratio. Therefore, in the climate protection scenarios, more electricity needs to be generated by other electricity generation plants in the European electricity market. These effects were considered in calculating the overall emissions.
The existing natural gas-fired plants contribute about 22% of the heat generation in KS 80 and KS 95, whereas in the CP scenario, they contribute about 40%. The majority of this heat generation occurs in the existing combined heat and power plant at Lichterfelde, which went into operation in 2019, and in the Lichterfelde heat-only boiler. These two plants feed into the south sub-grid (Figure A2). The total heat output varies in the three transformation scenarios due to the different heat demand scenarios. Due to significantly higher densification and more extensions in the two climate protection scenarios, the number of apartments and buildings supplied in these scenarios is significantly higher than in the current policies scenario.
In all scenarios, coal is gradually phased out without heat supply being interrupted. The path of decommissioning the coal-fired power plants is staggered. The Moabit combined heat and power plant will be shut down in 2025; the two units at the Reuter West site will be shut down with a time lag in 2028 and 2029. The development of heat generation is shown in Figure 12 for KS 95. For KS 80, the trend is the same, but with different absolute heat generation volumes. Waste heat is the most important in terms of heat generation volume, followed by industrial excess heat and heat from sewage. As far as renewables are concerned, power-to-heat plays a more important role than biomass from 2028 onward. The contribution of geothermal energy remains marginal.

7.2. CO2 Emissions

Figure 13 shows the trajectory and the total carbon dioxide emissions for 2021–2030. The adjustment terms are necessary, as described above, to consider effects resulting from increased use of electricity for heat generation from a change in the amount of electricity generated by CHP plants and from a change in heat generation as a result of densification and extension of the heating systems. Carbon emissions including adjustment terms would decrease by 1.4 million tons (KS 80) and 1.5 million tons (KS 95, CP) in 2030 compared to 2021.

7.3. Economic Analysis

The climate friendliness of district heating was also analyzed in comparison to the three decentralized supply options (Figure 14, top). In all scenarios, district heating is the most climate-friendly option among the different supply options in 2030. District heating presents emissions per unit of generated heat ranging between 64 and 91 g/kWh in the different scenarios. The decentralized supply option, consisting of the bivalent air source heat pump and the gas boiler, is the second most climate-friendly supply option, with emissions between 103 and 117 g/kWh. These emissions mainly come from the gas boiler, which is still required for heat supply in winter. The decentralized supply option consisting of a solar thermal system and a gas condensing boiler has emissions of approx. 190 g/kWh. This is the highest value of all supply options under scrutiny. Here, too, the emissions are attributable to the use of gas in the boiler. The supply option with a gas engine CHP unit and boiler causes the second highest unit-based emissions. This is once again caused by the combustion of gas in the boiler. All shown unit-based emission values were calculated according to the calorific method of the AGFW (also called the Carnot method [78]).
The bottom diagram in Figure 14 shows the increases in unit-based heat production costs relative to the average of the unit-based district heating costs in 2021. In the KS 95 scenario, the costs of district heating generation (excluding inflation) are 1.7 cents/kWh higher in 2030 than in 2021. The decentralized supply option with a heat pump costs 2.5 cents/kWh more in 2030 than district heating in 2021. The decentralized option with heat pump therefore costs 0.8 cents/kWh more than district heating in scenario KS 95 in 2030. Relative to a 65 m2 apartment in an old building, 1.7 cent/kWh additional costs in the KS 95 transformation scenario translate into an absolute cost increase of €147 per year or €12 per month at 8580 kWh annual heat demand. If energy efficiency improvements in the buildings are considered, the additional costs would drop. Due to the significantly reduced demand (6950 kWh = −19% vs. 2021, average decrease in KS 95), costs would reduce to 6 € per year or 50 cent per month. In the KS 80 scenario, the costs of district heating grow by 0.9 cents/kWh (€77 per year), while in the current policies scenario, the costs increase by 0.7 cent/kWh. The absolute additional costs for the 65 m2 apartment are €77 per year in scenario KS 80 and €60 per year in the CP scenario.
As shown in Figure 14, all supply options experience an increase in costs in 2030 compared to 2021. However, the cost increase for district heating is less than that of two of the decentralized supply options (i.e., the gas engine/boiler and heat pump/boiler solution) but slightly higher than solar thermal/boiler in all scenarios. Notably, in the current policies scenario, decentralized options do not pay for emission allowances, while district heating does, which translates in an unjustified economic advantage. Cost increases for all supply options in climate protection scenarios are higher than in the current policies scenario, which is a consequence of higher prices for green fuels and carbon emission allowances.

8. Discussion

The challenge of decarbonizing the Berlin’s district heating network was investigated in this study from the combined perspective of the state administration and the system operator. Specifically, the feasibility of phasing out coal as a resource for supplying heat to supply area 1 in Berlin was evaluated under technical, economic, and environmental conditions. For this purpose, a combination of high-fidelity models of the heat demand and supply, the power market, and the energy potential from alternative resources was used. The results showed that phasing out coal for heat generation is feasible, although it can only be partially substituted by carbon- neutral sources by 2030. Unlike other cities in Europe, the potential for heat generation from low-carbon sources like geothermal, biomass, or waste heat is limited. Therefore, a significant contribution from power-to-heat and gas-based technologies will be required to fill the gap. While this result is not unexpected and is fully aligned with recent studies (e.g., [11,29,76]), it has profound implications for envisioning and planning future energy systems. Firstly, the availability of cost-effective dispatchable low-carbon sources like biomass, geothermal, MSW, and excess heat is site-specific and limited and is unlikely to cover large portions of the demand. Secondly, non-dispatchable options like power-to-heat (mostly based on renewable power) are necessary but subject to uncertainties, like being available when there is power surplus and prices are low. Thirdly, the residual load not covered by low-carbon sources and power-to-heat needs to be supplied by flexible technologies able to ramp up and down quickly, and follow the load rapidly and efficiently. Combined cycle gas turbines and cogeneration technologies can accomplish this currently by burning natural gas and in the future by burning carbon-neutral fuels. The availability of carbon-neutral fuels like hydrogen, biomethane, and biogas is of paramount importance for the future energy system, as identified by energy roadmaps in Germany and the EU, but involves various uncertainties that need to be addressed. Fourthly, district heating remains more cost effective and has a lower environmental impact than most of the decentralized heat solutions mainly because of its economies of scale. Finally, some technologies like solar thermal, even though they were not found feasible in this study, might substantially contribute to the decarbonization of the heat sector. An acknowledged limitation of this study is the exclusion of seasonal storage (typically in combination with solar thermal) and a deeper analysis of the availability, costs, and implications of hydrogen for fueling CHP plants. However, this will not affect the validity of the findings by 2030. These topics require further investigation and reveal further gaps in knowledge.

9. Conclusions

In this paper, a methodology combining high-fidelity models of the heat demand and supply, the power market, and the energy potential from alternative resources is proposed, which offers a suitable method of analyzing and evaluating possible energy transition pathways for complex district heating systems. This methodology is envisioned to be sufficiently broad to be employed for other systems or countries.
A scenario frame was developed to comprehensively and transparently consider uncertainties regarding future heat and energy market developments. Then, the technical energy potential for heat generation options in SA1 in Berlin was evaluated, considering technical, environmental, and economic criteria. This allowed a clear estimate of the feasibility and the strategic fit of these options for particular sites and in combination with the rest of the portfolio. Three scenarios with specific transformation paths based on combinations of feasible heat generation options were considered. To evaluate the cost-effectiveness of these transformation paths, various models for dispatch simulation, portfolio optimization, and decentralized supply were created. These models provided an estimation of the power and heat portfolio dispatch with an hourly resolution (considering the hydraulic restrictions of the district heating grid) and the associated CO2 emissions.
Applying this methodology to the example of SA1 in the district heating network in Berlin led to various conclusions. The results showed that a coal phase-out by 2030 at the latest is feasible without any discontinuities in the provision of heat or heating services. While low-carbon sources (including biomass, geothermal energy, municipal solid waste, sewage water heat, and excess heat from industrial and commercial sectors) could partially substitute coal-based heat, they would not be sufficient to replace it completely. Thus, a gas-based (including natural gas, renewable synthetic gas, hydrogen) combined heat and power (CHP) plant linked with a power-to-heat plant would be required to fill the gap between future heat capacity requirements and the potential provided by the renewable heat sources mentioned above. This transformation could reduce CO2 emissions by 2.15 million tons in 2030, which is equivalent to 13% of the emissions of the State of Berlin. District heating offers carbon dioxide emissions per unit that are equal to or even lower than those of the decentralized heat supply options.
The results showed that in the longer term (after 2030), the complete decarbonization of the district heating network is possible, but it is dependent, firstly, on the further decarbonization of the electricity sector and, secondly, on the availability of a national or EU-wide infrastructure transporting hydrogen or renewable gas. Regardless, the proposed generation portfolio for the different scenarios was designed for enabling complete decarbonization by 2050.
From an economic perspective, district heating remains the most cost-effective option compared to decentralized heat supply options, even though costs could rise by a value ranging between 0.7 and 1.7 cents/kWh by 2030, i.e., during the period of gradual substitution of coal-based heat. This indicates that low-carbon district heating networks supplying heat to large cities are feasible and cost-effective, although largely dependent on prices (fuels, electricity, CO2) and the regulatory framework.

Author Contributions

Conceptualization, M.G.-S., T.L., and C.K.; methodology, analysis, and investigation, all authors; data analysis and visualization, T.L., M.R., and A.M.; writing, M.G.-S., T.L., and C.K.; project leading T.L., C.K., A.N.; supervision, J.S. and M.W. All authors have read and agreed to the published version of the manuscript.

Funding

This research received no external funding.

Acknowledgments

The authors would like to express their gratitude to all members of the monitoring circle, to Tsatsaronis from TU Berlin for encouraging us to submit this paper, and to Mauro Venturini, Andreas Christidis, Elisa Papadis, and Sebastian Triebs for the constructive comments to improve its quality.

Conflicts of Interest

Vattenfall Wärme Berlin AG owns and operates the district heating network and generation units in the supply area described in the paper.

Appendix A. Description of the Supply Area 1

Supply area 1 (SA1) is a three-pipe-system (Figure A1). A heating pipeline with a variable supply temperature ranging from 80 to 110 °C depending on ambient temperature is operated during the heating season. A smaller second pipeline with a constant supply temperature of 110 °C is operated throughout the year. The third pipeline is the return flow with temperatures ranging between 50 and 60 °C. SA1 consists of several sub-grids, which have developed around the generation sites (Figure A2). The main parts are the north sub-grid and the south sub-grid with an interface at site Wilmersdorf. Grid constraints exist due to hydraulic restrictions and differences in capacities between generation sites and supply areas. Grid supply and generation capacities require continuous adaptation to ensure a reliable heat supply at all times. This means that every customer can be supplied at an ambient temperature of −14 °C even if an outage of the largest generation asset in the specific grid occurs (n−1). Figure 3 shows the interaction between the sites and the heating sub-grids in SA1 in a simplified representation. The red dots represent the options for feeding heat into the network, while the yellow boxes represent generation sites. Black arrows represent feeding options, which are generally subject to restrictions Red arrows represent a coupling between sub-grids, i.e., a certain amount of heat can be transferred from one network to another.
Six assets supply heat to supply area 1, including Reuter, Reuter West, Moabit, Charlottenburg, Wilmersdorf, and Lichterfelde. The electric and thermal capacities of these assets are summarized in Table A1. The Reuter and Reuter West sites are located in the northwest of SA1. At the Reuter site, a steam turbine converts steam from the Ruhleben waste incineration plant operated by the city-owned Berliner Stadtreinigung (BSR) into electricity and heat. An additional CHP unit namely Reuter M operated at this location until 2019, when it was put out of operation. Currently, gas-fired hot water boilers are under construction and it is planned to add 120 MWth to the site (latest it will start operation in 2021). The Reuter West hard-coal-fired CHP unit, consisting of two identical blocks D and E (in operation since 1987 and 1989, respectively), has the largest generation capacity in SA1 (564 MWel and 720 MWth). In addition, gas- and oil-fired reserve boilers as well as electric boilers are available at this location. The Moabit site is located in the northeast of SA1 and consists of a hard-coal-fired power station that allows 40% biomass cofiring and oil- and gas-fired heat-only boilers. At the Charlottenburg site in the center of SA1, two gas-fired gas turbines have been operated since 1975, mainly covering peak loads. The Wilmersdorf site, located at the southern end of the north sub-grid, has gas-fired heat-only boilers and oil-fired peaking gas turbines for covering peaks. These gas turbines date from 1977 and are planned to be decommissioned in the next few years. The Lichterfelde site mainly supplies heat to the south sub-grid in SA1 and consists of a combined cycle gas turbine power plant (CCGT) in operation since 2019 and gas-fired heat-only boilers.
Figure A1. Feed and return temperature of the district heating water as a function of ambient temperature.
Energies 13 06394 g0a1
Figure A2. Production sites of the district heating network in supply area 1 (SA1).
Energies 13 06394 g0a2
Table A1. Electric and thermal capacity by site and technology in SA1.
SiteTechnologyEnergy InputElectricalThermal
ReuterSteam turbine CHPMSW3699
Heat only boilerGas 120
Reuter WestSteam turbine CHPCoal564720
Heat only boilerOil 38
Electric boiler (P2H)Electricity 120
MoabitSteam turbine CHPCoal, biomass89136
Heat only boilerGas 60
Heat only boilerOil 105
CharlottenburgGas turbine CHPGas144300
WilmersdorfGas turbine CHPGas194110
Heat only boilerGas 120
LichterfeldeGas turbine combined cycle CHPGas300230
Heat only boilerGas 360
Total 13272518

Appendix B. Implications of the Different Scenarios

In KS 95, a highly ambitious climate protection policy is pursued in Germany. Greenhouse gas emissions across all sectors in Germany are reduced by 95% by 2050 vs. 1990. In this scenario, gross electricity demand will increase significantly by 2050 (750 TWh), partly because of extensive sector coupling, i.e., the use of excess electricity from renewable energy sources (RES) for heat generation and the production of synthetic fuels (e.g., synthetic natural gas (SNG) and hydrogen). The policy objective of increasing the share of RES in power generation to more than 80% is exceeded (95% in 2050). In this scenario, SNG and hydrogen are produced in facilities within Germany and abroad. The price of emission allowances will rise from €15 to 126 per metric ton (in real terms). In the Berlin heating market, significantly more buildings will be renovated per year than today. The reduction in energy demand per renovation increases significantly compared to current levels. The district heating network in SA1 will be densified and extended to replace current heating systems based on natural gas and oil.
In the KS 80 scenario framework, an ambitious climate protection policy is implemented in Germany. Emissions are reduced by 80% vs. 1990 levels across all sectors in Germany. The measures required for achieving this are less demanding than those for KS 95; in particular, less sector coupling is necessary. As a result, gross electricity demand rises less sharply than in KS 95 (680 TWh in 2050). Consequently, the policy objective for increasing the share of RES in power generation to 80% can be achieved with significantly less RES. The use of SNG from renewables is not assumed. In the Berlin heating market, the renovation rate of buildings is lower and the district heating network is densified marginally less than in the KS 95 scenario. However, the district heating extension areas are the same as in the KS 95 heating demand scenario. The current policies scenario represents a continuation of the current political developments in the German and European energy markets. Gross electricity demand increases slightly compared with today’s levels (620 TWh in 2050). The share of renewable energy sources in power generation rises although at a lower speed. Consequently, this scenario is the only one in which the intermediate policy objective for the share of RES in power generation in 2030 (65%) in Germany is not met, even though the objective for 2050 is reached (83%). In the Berlin heating market, the current renovation rate and renovation depth remain constant. Densification of the district heating network follows the same trend as today, and there are no extensions. Table A2 summarizes the key figures describing the scenarios.
Table A2. Overview of the characteristics of the different scenarios. GHG: greenhouse gas; RES: renewable energy sources.
CharacteristicsScenarios
KS 95KS 80Current Policies
General descriptionHighly ambitious climate protection policyLess ambitious climate protection policy than KS 95Continuation of current policies
Model of the energy marketGHG reduction in 2050 vs. 1990 (%)958060
Electricity demand in 2050 (TWh)750680620
Share of RES in power generation (%)968883
CO2 price in 2050 (€/t)1269339
Model of the heat demandDistrict heating market penetration (%)606040
Renovation rate (%/year)2.21.50.6
Heat demand in SA1 in 2030 (TWh)4.754.7
Heat demand in SA1 in 2050 (TWh)3.94.85

References

  1. Rogeli, J.; Shindell, D.; Jiang, K.; Fifita, S.; Forster, P.; Ginzburg, V.; Handa, C.; Kheshgi, H.; Kobayashi, S.; Kriegler, E.; et al. Mitigation pathways compatible with 1.5 °C in the context of sustainable development. In Global Warming of 1.5 °C: An IPCC Special Report on the Impacts of Global Warming of 1.5 °C above Pre-Industrial Levels and Related Global Greenhouse Gas Emission Pathways; Intergovernmental Panel on Climate Change (IPCC): Geneva, Switzerland, 2018. [Google Scholar]
  2. IRENA. Global Energy Transformation: A Roadmap to 2050; International Renewable Energy Agency: Abu Dhabi, UAE, 2018. [Google Scholar]
  3. IEA. Energy Technology Perspectives 2017: Catalyzing Energy Technology; International Energy Agency: Paris, France, 2017. [Google Scholar]
  4. Zappa, W.; Junginger, M.; van den Broek, M. Is a 100% renewable European power system feasible by 2050? Appl. Energy 2019, 233, 1027–1050. [Google Scholar] [CrossRef]
  5. Gerbaulet, C.; von Hirschhausen, C.; Kemfert, C.; Lorenz, C.; Oei, P. European electricity sector decarbonization under different levels of foresight. Renew. Energy 2019, 141, 973–987. [Google Scholar] [CrossRef]
  6. Samadi, S.; Lechtenbömer, S.; Prantner, M.; Nebel, A. Vollständig auf Erneuerbaren Energien Basierende Stromversorgung Deutschlands im Jahr 2050 auf Basis in Europa Großtechnisch Leicht Erschließbarer Potentiale—Analyse und Bewertung Anhand von Studien; Umwelt Bundesamt: Dessau-Roßlau, Germany, 2014.
  7. Capros, P.; Paroussos, L.; Fragkos, P.; Tsani, S.; Boitier, B.; Wagner, F.; Busch, S.; Resch, G.; Blesl, M.; Bollen, J. European decarbonisation pathways under alternative technological and policy choices: A multi-model analysis. Energy Strat. Rev. 2014, 2, 231–245. [Google Scholar] [CrossRef]
  8. Van Zuijlen, B.; Zappa, W.; Turkenburg, W.; van der Schrier, G.; van den Broek, M. Cost-optimal reliable power generation in a deep decarbonisation future. Appl. Energy 2019, 253, 113587. [Google Scholar] [CrossRef]
  9. Pleßmann, G. Modeling Decarbonization Pathways of Europe’s Electricity Supply until 2050. Ph.D. Thesis, Carl von Ossietzky Universität Oldenburg, Oldenburg, Germany, 2019. [Google Scholar]
  10. Kavvadias, K.; Jiménez-Navarro, J.; Thomassen, G. Decarbonising the EU Heating Sector; JRC Technical Reports; European Commission: Petten, The Netherlands, 2019. [Google Scholar]
  11. Jimenez-Navarro, J.; Kavvadias, K.; Filippidou, F.; Pavičević, M.; Quoilin, S. Coupling the heating and power sectors: The role of centralised combined heat and power plants and district heat in a European decarbonised power system. Appl. Energy 2020, 270, 115134. [Google Scholar] [CrossRef]
  12. Millar, M.; Burnside, N.; Yu, Z. District Heating Challenges for the UK. Energies 2019, 12, 310. [Google Scholar] [CrossRef] [Green Version]
  13. Helin, K.; Zakeri, B.; Syri, S. Is District Heating Combined Heat and Power at Risk in the Nordic Area?—An Electricity Market Perspective. Energies 2018, 11, 1256. [Google Scholar] [CrossRef] [Green Version]
  14. Pakere, I.; Lauka, D.; Blumberga, D. Does the Balance Exist between Cost Efficiency of Different Energy Efficiency Measures? DH Systems Case. Energies 2020, 13, 5151. [Google Scholar] [CrossRef]
  15. Blanco, I.; Guericke, D.; Andersen, A.; Madsen, H. Operational Planning and Bidding for District Heating Systems with Uncertain Renewable Energy Production. Energies 2018, 11, 3310. [Google Scholar] [CrossRef] [Green Version]
  16. Ko, S.; Lautala, P. Optimal Level of Woody Biomass Co-Firing with Coal Power Plant Considering Advanced Feedstock Logistics System. Agriculture 2018, 8, 74. [Google Scholar] [CrossRef] [Green Version]
  17. Sáez-Blázquez, C.; Martín, A.F.; Martín-Nieto, I.; González-Aguilera, D. Economic and environmental analysis of different district heating systems aided by geothermal energy. Energies 2018, 11, 1265. [Google Scholar] [CrossRef] [Green Version]
  18. Kauko, H.; Rohde, D.; Knudsen, B.R.; Sund-Olsen, T. Potential of thermal energy storage for a district heating system utilizing industrial waste heat. Energies 2020, 13, 3923. [Google Scholar] [CrossRef]
  19. Nielsen, S.; Hansen, K.; Lund, R.; Moreno, D. Unconventional excess heat sources for district heating in a national energy system context. Energies 2020, 13, 5068. [Google Scholar] [CrossRef]
  20. Kontu, K.; Vimpari, J.; Penttinen, P.; Junnila, S. City Scale Demand Side Management in Three Different-Sized District Heating Systems. Energies 2018, 11, 3370. [Google Scholar] [CrossRef] [Green Version]
  21. Lund, H.; Werner, S.; Wiltshire, R.; Svendsen, S.; Thorsen, J.E.; Hvelplund, F.; Mathiesen, B.V. 4th Generation District Heating (4GDH): Integrating smart thermal grids into future sustainable energy systems. Energy 2014, 68, 1–11. [Google Scholar] [CrossRef]
  22. Guzzini, A.; Pellegrini, M.; Pelliconi, E.; Saccani, C. Low Temperature District Heating: An Expert Opinion Survey. Energies 2020, 13, 810. [Google Scholar] [CrossRef] [Green Version]
  23. Neirotti, F.; Noussan, M.; Riverso, S.; Manganini, G. Analysis of different strategies for lowering the operation temperature in existing district heating networks. Energies 2019, 12, 321. [Google Scholar] [CrossRef] [Green Version]
  24. IEA. Germany 2020, Energy Policy Review; International Energy Agency: Paris, France, 2020. [Google Scholar]
  25. Bertelsen, N.; Mathiesen, B. EU-28 residential heat supply and consumption historical development and status. Energies 2020, 13, 1894. [Google Scholar] [CrossRef]
  26. Fehrenbach, D.; Merkel, E.; McKenna, R.; Karl, U.; Fichtner, W. On the economic potential for electric load management in the german residential heating sector—An optimising energy system model approach. Energy 2014, 71, 263–276. [Google Scholar] [CrossRef]
  27. Merkel, E.; McKenna, R.; Fehrenbach, D.; Fichtner, W. A model-based assessment of climate and energy targets for the German residential heat system. J. Clean. Prod. 2017, 142, 3151–3173. [Google Scholar] [CrossRef]
  28. Bauermann, K. German Energiewende and the heating market-Impact and limits of policy. Energy Policy 2016, 94, 235–246. [Google Scholar] [CrossRef] [Green Version]
  29. Bloess, A. Impacts of heat sector transformation on Germany’s power system through increased use of power-to-heat. Appl. Energy 2019, 239, 560–580. [Google Scholar] [CrossRef]
  30. Bernath, C.; Deac, G.; Sensfuß, F. Influence of heat pumps on renewable electricity integration: Germany in a European context. Energy Strategy Rev. 2019, 26, 100389. [Google Scholar] [CrossRef]
  31. Koch, K.; Höfner, P.; Gaderer, M. Techno-economic system comparison of a wood gas and a natural gas CHP plant in flexible district heating with a dynamic simulation model. Energy 2020, 202, 117710. [Google Scholar] [CrossRef]
  32. Popovski, E.; Aydemir, A.; Fleiter, T.; Bellstädt, D.; Büchele, R.; Steinbach, J. The role and costs of large-scale heat pumps in decarbonising existing district heating networks—A case study for the city of Herten in Germany. Energy 2019, 180, 918–933. [Google Scholar] [CrossRef]
  33. Persson, U. District Heating in Future Europe: Modelling Expansion Potentials and Mapping Heat Synergy Regions; Chalmers University of Technology: Gothenburg, Sweden, 2015. [Google Scholar]
  34. City of Berlin, Berliner Energiewendegesetz (EWG Bln). 2016. Available online: http://gesetze.berlin.de/jportal/?quelle=jlink&query=EWendG+BE&psml=bsbeprod.psml&max=true&aiz=true (accessed on 17 June 2020).
  35. BMUB. Climate Action Plan 2050. Principles and Goals of the German Government’s Climate Policy; Federal Ministry for the Environment, Nature Conservation, Building and Nuclear Safety (BMUB): Rosctock, Germany, 2016.
  36. Amt für Statistik. Energie- und CO2-Bilanz in Berlin 2017; Office for Statistics Berlin-Brandenburg: Potsdam, Germany, 2017.
  37. IRENA. Renewable Energy in District Heating and Cooling: A Sector Roadmap for Remap; International Renewable Energy Agency: Abu Dhabi, UAE, 2017. [Google Scholar]
  38. Fraunhofer IWES/IBP. Heat Transition 2030: Key Technologies for Reaching the Intermediate and Long-Term Climate Targets in the Building Sector; Agora Energiewende: Berlin, Germany, 2017. [Google Scholar]
  39. B E T; Vattenfall; SenUVK. Machbarkeitstudie Kohleausstieg und Nachhaltige Fernwärmeversorgung Berlin 2030; Büro für Energiewirtschaft und technische Planung (B E T); Vattenfall Wärme Berlin and Berlin Senate Department for the Environment, Transport and Climate Protection: Aachen, Germany, 2019. [Google Scholar]
  40. Talebi, B.; Mirzaei, P.; Bastani, A.; Haghighat, F. A Review of District Heating Systems: Modeling and Optimization. Front. Built Environ. 2016, 2, 22. [Google Scholar] [CrossRef] [Green Version]
  41. Werner, S. International review of district heating and cooling. Energy 2017, 137, 617–631. [Google Scholar] [CrossRef]
  42. Federal Ministry of the Environment, Nuclear Safety and Nature Conservation. German Climate Action Plan 2050: Principles and Goals of the German Government’s Climate Policy; Federal Ministry of the Environment, Nuclear Safety and Nature Conservation: Berlin, Germany, 2016.
  43. IEA. World Energy Model; International Energy Agency: Paris, France, 2019. [Google Scholar]
  44. IEA. Energy Technology Perspectives (ETP) Model; International Energy Agency: Paris, France, 2019. [Google Scholar]
  45. IEA-ETSAP. Documentation for the TIMES Model, Part III; International Energy Agency—Energy Technology Systems Analysis Programme (ETSAP): Paris, France, 2016. [Google Scholar]
  46. He, Y.; Hildmann, M.; Herzog, F.; Andersson, G. Modeling the Merit Order Curve of the European Energy Exchange Power Market in Germany. IEEE Trans. Power Syst. 2013, 28, 3155–3164. [Google Scholar] [CrossRef]
  47. Deane, P.; Collins, S.; Gallachóir, B.Ó.; Eid, C.; Hartel, R.; Keles, D.; Fichtner, W. Quantifying the "Merit-Order" Effect in European Electricity Markets; Rapid Response Energy Brief; Institut für Industriebetriebslehre und Industrielle Produktion (IIP): Karlsruhe, Germany, 2016. [Google Scholar]
  48. Howells, M.; Rogner, H.; Strachan, N.; Heaps, C.; Huntington, H.; Kypreos, S.; Hughes, A.; Silveira, S.; DeCarolis, J.; Bazillian, M.; et al. OSeMOSYS: The Open Source Energy Modeling System: An introduction to its ethos, structure and development. Energy Policy 2011, 39, 5850–5870. [Google Scholar] [CrossRef]
  49. IEA. World Energy Outlook (WEO); International Energy Agency: Paris, France, 2017. [Google Scholar]
  50. BCG & Prognos. Klimapfade für Deutschland; Boston Consulting Group and Prognos: Boston, MA, USA, 2018. [Google Scholar]
  51. Fraunhofer ISI, Consentec & IFEU. Langfristszenarien für die Transformation des Energiesystems in Deutschland—Modul 3: Referenzszenario und Basisszenario; Bundesministerium für Wirtschaft und Energie: Berlin, Germany, 2017.
  52. Öko-Institut & Fraunhofer ISI. Klimaschutzszenario 2050–2. Endbericht; Öko-Institut & Fraunhofer ISI: Berlin, Germany, 2015. [Google Scholar]
  53. PIK. Feasibility Study for a Climate-Neutral Berlin in 2050; Potsdam Institut für Klimaforschung, Institut für Ökologische Wirtschaftsforschung: Potsdam, Germany, 2014. [Google Scholar]
  54. SenUVK. Berliner Energie- und Klimaschutzprogramm 2030 (BEK 2030); City of Berlin, Senate Department for the Environment, Transport and Climate Protection: Berlin, Germany, 2017. [Google Scholar]
  55. Vattenfall. Moabit CHP Plant. Available online: https://powerplants.vattenfall.com/moabit (accessed on 25 May 2020).
  56. DBFZ. Biomass Resource Database for Germany. Deutsches Biomasseforschungszentrum (DBFZ). Available online: http://webapp.dbfz.de/resources (accessed on 4 May 2020).
  57. Brosowski, A.; Adler, P.; Erdmann, G.; Stinner, W.; Thrän, D.; Mantau, U.; Blanke, C.; Mahro, B.; Hering, T.; Reinholdt, G. Biomassepotenziale von Rest- und Abfallstoffen—Status quo in Deutschland (in German); Deutsches Biomasseforschungszentrum Gemeinnützige GmbH (DBFZ): Leipzig, Germany; Fachagentur Nachwachsende Rohstoffe e.V. (FNR): Gülzow, Germany, 2015. [Google Scholar]
  58. Brosowski, A.; Thrän, D.; Mantau, U.; Mahro, B.; Erdmann, G.; Adler, P.; Stinner, W.; Reinhold, G.; Hering, T.; Blanke, C. A review of biomass potential and current utilisation—Status quo for 93 biogenic wastes and residues in Germany. Biomass Bioenergy 2016, 95, 257–272. [Google Scholar] [CrossRef] [Green Version]
  59. BSR. Müllheizkraftwerk Ruhleben: Garant der Entsorgungssicherheit in Berlin; Berliner Stadtreinigung (BSR): Berlin, Germany, 2020. [Google Scholar]
  60. SenUVK. Geologischer Aufbau von Berlin; Senatsverwaltung für Gesundheit, Umwel und Verbraucherschutz Berlin (SenUVK): Berlin, Germany, 2018. [Google Scholar]
  61. Kahnt, R.; Ertel, S.; Feldmann, H.; Behnke, H. Potenzialstudien zur Nutzung der geothermischen ressource des Landes Berlin (Modul 2): Abschlussbericht zu den Ergebnissen; SenUVK: Berlin, Germany, 2011. [Google Scholar]
  62. Kastner, O.; Sippel, J.; Scheck-Wenderoth, M.; Huenges, E. The deep geothermal potential of the Berlin area. Environ. Earth Sci. 2013, 70, 3567–3584. [Google Scholar] [CrossRef]
  63. Kastner, O.; Sippel, J.; Zimmermann, G. Regional-scale assessment of hydrothermal heat plant capacities fed from deep sedimentary acquifers in Berlin/Germany. Geothermics 2015, 53, 353–367. [Google Scholar] [CrossRef]
  64. BVG. Tiefe Erdwärmesonden; Bundesverband Geothermie (BVG): Berlin, Germany, 2018. [Google Scholar]
  65. BVG. Wärmestromdichte; Bundesverband Geothermie (BVG): Berlin, Germany, 2018. [Google Scholar]
  66. Bloess, A.; Schill, W.; Zerrahn, A. Power-to-heat for renewable energy integration: A review of technologies, modeling approaches, and flexibility potentials. Appl. Energy 2018, 212, 1611–1626. [Google Scholar] [CrossRef]
  67. Perez-Arriaga, I.J.; Batlle, C. Impacts of Intermittent Renewables on Electricity Generation System Operation. Econ. Energy Environ. Policy 2012, 1, 3–17. [Google Scholar] [CrossRef] [Green Version]
  68. Gonzalez-Salazar, M.; Kirsten, T.; Prchlik, L. Review of the operational flexibility and emissions of gas- and coal-fired power plants in a future with growing renewables. Renew. Sustain. Energy Rev. 2018, 82, 1497–1513. [Google Scholar] [CrossRef]
  69. Hers, S.; Afman, M.; Cherif, S.; Rooijers, F. Potential for Power-to-Heat in the Netherlands; CE Delft: Delft, The Netherlands, 2015. [Google Scholar]
  70. EC. Mapping and Analyses of the Current and Future (2020–2030) Heating/Cooling Fuel Deployment (Fossil/Renewables); European Commission, Directorate General for Energy: Brussels, Belgium, 2016. [Google Scholar]
  71. Vattenfall. Power-to-Heat. 2020. Available online: https://group.vattenfall.com/de/zukunft/speichertechnologie/power-to-heat (accessed on 4 May 2020).
  72. Steag. EBSILON Professional. Available online: https://www.steag-systemtechnologies.com/de/produkte/ebsilon-professional (accessed on 4 May 2020).
  73. GAMS. General Algebraic Modelling System. GAMS Development Corporation. 2020. Available online: https://www.gams.com/latest/docs/UG_GAMSPrograms.html (accessed on 4 May 2020).
  74. IEA-ETSAP. Documentation for the TIMES Model, Part IV; International Energy Agency—Energy Technology Systems Analysis Programme (ETSAP): Paris, France, 2016. [Google Scholar]
  75. Christidis, A.; Koch, C.; Pottel, L.; Tsatsaronis, G. The contribution of heat storage to the profitable operation of combined heat and power plants in liberalized electricity markets. Energy 2012, 41, 75–82. [Google Scholar] [CrossRef]
  76. Christidis, A.; Mollenhauer, E.; Tsatsaronis, G.; Schuchardt, G.; Holler, S.; Böttger, D.; Bruckner, T. EnEff-Wärme: Einsatz von Wärmespeichern und Power-to-Heat-Anlagen in der Fernwärmeerzeugung; Technische Universität Berlin: Berlin, Germany, 2017. [Google Scholar]
  77. Gurobi. Gurobi Optimization LLC. 2020. Available online: www.gurobi.com (accessed on 4 May 2020).
  78. AGFW. Energetische Bewertung der Fernwärme—Bestimmung spezifischer CO2—Emissionsfaktoren; AGFW|Der Energieeffizienzverband für Wärme, Kälte und KWK e.V.: Frankfurt, Germany, 2016. [Google Scholar]
Figure 1. District heating network in Berlin.
Energies 13 06394 g001
Figure 2. Description of the methodology.
Energies 13 06394 g002
Figure 3. Prices of coal, gas, CO2 certificates (inputs to EuroMOD) and baseload electricity prices (output of EuroMOD).
Energies 13 06394 g003
Figure 4. (a) Heat densities in supply area 1 (encircled by blue line) and area for future supply. (b) estimation of the heat demand for the different scenarios.
Energies 13 06394 g004
Figure 5. Technical energy potential for biomass around the city of Berlin.
Energies 13 06394 g005
Figure 6. Range of monthly potential heat production from the river water heat pump (averaged data for the period 2008–2017 [39]).
Energies 13 06394 g006
Figure 7. Hybrid gas-based combined heat and power (CHP) power plant (DH: district heating, P2H: power-to-heat, SCR: selective catalytic reduction).
Energies 13 06394 g007
Figure 8. Thermal capacity in MWth by resource for the different scenarios. The added capacity of carbon neutral resources is highlighted. Note: reserve capacity is not shown.
Energies 13 06394 g008
Figure 9. Decentralized supply options.
Energies 13 06394 g009
Figure 10. Sum of investment for the period 2021–2050 for the different scenarios (in real terms).
Energies 13 06394 g010
Figure 11. Overview of the heat supply in 2030 for the different scenarios.
Energies 13 06394 g011
Figure 12. Heat supply disaggregated by resource for the KS 95 scenario.
Energies 13 06394 g012
Figure 13. CO2 emissions for the different scenarios.
Energies 13 06394 g013
Figure 14. Comparison of the increase in heat production costs and unit-based CO2 emissions (common reference for costs: district heating costs in 2021).
Energies 13 06394 g014
Table 1. Description of site-specific space and resource availability.
Commercial Availability of Conversion TechnologiesSpace and Resource Availability
ReuterReuter WestMoabitCharlottenburgWilmersdorf
BiomassYesYesYesYesNoNo
Municipal solid wasteYesYesYesNoNoNo
Industrial excess heatYesYes (not site-specific)
GeothermalYesYesYesYesNoNo
Large-scale solar thermalYesNoNoNoNoNo
River water heatYesYesYesNoUnlikelyNo
Power-to-heatYesYesYesYesYesYes
Gas turbinesYes 1YesYesYesYesYes
1 Although hydrogen pipelines are not available today and its combustion in gas turbines is not 100% available.
Table 2. Technical energy potential from industrial excess heat sources in Berlin.
AttractivenessNumber of CompaniesAverage Distance from Network (km)Average Excess Heat Capacity (MW)Estimated Excess Heat Capacity (MW)Estimated Excess Heat Potential (GWh)
High272.92.365294.8
Medium211.52.450312.3
Low761.70.320106.4
Theoretical potential124229.01.1135713.5
Technical potential272.92.365294.8
Table 3. Geothermal characteristics at Reuter and Moabit sites.
CharacteristicsOption 1Option 2Option 3Option 4Option 5
LocationReuterReuterMoabitMoabitMoabit
StorageNoYesNoYesYes
Depth (m)1195119514951495310
Annual heat production (GWh/year)19.618.320.718.528.7
Table 4. Overview of the potential from the different sources.
ResourcesOverviewSuitable for Replacing CoalCapacity (MWth)
KS 95KS 80CP
MSW and sewageTechnically and economically feasible. Advantages: multiple site synergies, available infrastructure, no emissions.Yes16816899
Industrial excess heatTechnically and economically feasible. Advantages: low-mid costs and no emissions.Yes35350
GeothermalTechnically feasible at mid-high costs and with limited capacity.Yes880
BiomassTechnically and economically feasible. Advantages: diversification of the portfolio and reduction of emissions.Yes909060
Hybrid CHPRequired to fill the gap between future heat capacity requirements and the potential from low carbon heat sources. Advantages: highly flexible and efficient, strong sector coupling with the potential to emit no emissions if green hydrogen or SNG are used.Yes503 (CHP)644 (CHP)0 (CHP)
220 (P2H)220 (P2H)120 (P2H)
River water heatTechnically unfeasible. Key disadvantage: strong imbalance between seasonal potential and seasonal demand.No000
Solar thermalTechnically and economically unfeasible. Large area requirements, which are currently not available.No000
Total capacity from low carbon sources521521279
Publisher’s Note: MDPI stays neutral with regard to jurisdictional claims in published maps and institutional affiliations.

