Review

Environmental Life Cycle Impacts of Automotive Batteries Based on a Literature Review

by
Christian Aichberger
* and
Gerfried Jungmeier
LIFE—Institute for Climate, Energy and Society, Joanneum Research Forschungsgesellschaft mbH, Waagner-Biro-Straße 100, 8020 Graz, Styria, Austria
*
Author to whom correspondence should be addressed.
Energies 2020, 13(23), 6345; https://doi.org/10.3390/en13236345
Submission received: 6 November 2020 / Revised: 27 November 2020 / Accepted: 28 November 2020 / Published: 1 December 2020
(This article belongs to the Special Issue Environmental Life Cycle Assessment of Electric Vehicles)

Abstract

:
We compiled 50 publications from the years 2005–2020 about life cycle assessment (LCA) of Li-ion batteries to assess the environmental effects of production, use, and end of life for application in electric vehicles. Investigated LCAs showed for the production of a battery pack per kWh battery capacity a median of 280 kWh/kWh_bc (25%-quantile–75%-quantile: 200–500 kWh/kWh_bc) for the primary energy consumption and a median of 120 kg CO2-eq/kWh_bc (25%-quantile–75%-quantile: 70–175 kg CO2-eq/kWh_bc) for greenhouse gas emissions. We expect results for current batteries to be in the lower range. Over the lifetime of an electric vehicle, these emissions relate to 20 g CO2-eq/km (25%-quantile–75%-quantile: 10–50 g CO2-eq/km). Considering recycling processes, greenhouse gas savings outweigh the negative environmental impacts of recycling and can reduce the life cycle greenhouse gas emissions by a median value of 20 kg CO2-eq/kWh_bc (25%-quantile–75%-quantile: 5–29 kg CO2-eq/kWh_bc). Overall, many LCA results overestimated the environmental impact of cell manufacturing, due to the assessments of relatively small or underutilized production facilities. Material emissions, like from mining and especially processing from metals and the cathode paste, could have been underestimated, due to process-based assumptions and non-regionalized primary data. Second-life applications were often not considered.

1. Introduction

A transformation from vehicles with internal combustion engines (ICV) to a transport system with electric vehicles (EV) is commonly regarded as a major step for sustainable future development. EVs, in comparison to ICVs, do not emit exhaust gases directly. Besides the necessary inputs of additional renewable electricity, the production and recycling of the necessary battery are often seen as a barrier, due to various potential negative environmental impacts.
To assess the environmental impacts of the battery, life cycle assessments (LCA) are carried out. As seen in Figure 1, LCAs investigate the environmental impacts of the whole life cycle from production, use, and the end of life by adding the use of energy and material resources to the investigated system [1,2]. Starting with the extraction of raw materials, battery materials are processed up to battery-grade. After the manufacture and integration of battery cells in modules, battery packs are assembled with a battery management system, cooling system, and a battery case. After use in the EV, the batteries should then be either reused in other applications or recycled, reducing the need for primary material. Between all those processes, transport is necessary to ship materials and products from one location to the next.
Many LCAs of EV batteries have been performed internationally because of the increasing global use of EVs. With 2.1 million battery electric vehicles (BEV) and plug-in hybrid electric vehicles (PHEV) sold in 2019 (2.6% of global car sales), the current worldwide stock of EVs is 7.2 million EVs (around 1% of global car stock) [3]. However, the qualitative and quantitative data and results of environmental impacts and key influences of the production and end-of-life life cycle steps vary between different assessments significantly.
Notter et al. [4] and Dunn et al. [5] conducted LCAs with low estimates of the energy demand and greenhouse gas (GHG) emissions of cell manufacturing. Zackrisson et al. [6] assessed the theoretical use of water as a solvent instead of N-methyl-2-pyrolidone (NMP) in the cathode, which leads to lower environmental impacts. Majeau-Bettez et al. [7] found high environmental impacts using a polytetrafluoroethylene (PTFE) binder with high GHG emissions in the material processing. Ellingsen et al. [8] assessed a commercial battery produced in a pilot-scale plant. Energy consumption values from 163–644 kilowatt-hours per kilowatt-hour battery capacity (kWh/kWh_bc) were estimated based on the production utilization, and the environmental impact of cell production was emphasized. In contrast, the energy demand calculated by Dai et al. [9] is 47 kWh/kWh_bc, which is significantly lower and explained, due to the higher production capacity of 2 GWh per year and better utilization of the facility. The cathode production, aluminum, and the cell production process are highlighted as environmentally significant. These results are further varied by Kelly et al. [10] by regionalizing them with different electricity mixes and production processes. They found that the electricity mix for aluminum reduction and cell manufacturing with high electricity demand and the production of the cathode paste influences LCA results significantly.
Broad attention was given to the publication of Romare and Dahllöf [11], who estimated the GHG emissions of battery production based on past LCAs in the range of 150–200 kg carbon dioxide equivalent emissions per kWh battery capacity (kg CO2-eq/kWh_bc). After the publication of further LCAs, a reassessment was carried out by Emilsson and Dahllöf [12], and the estimated values lowered to a range of 61–106 kg CO2-eq/kWh_bc.
The question remains, due to the diverse results, which aspects of the battery life cycle influence the environmental performance of batteries for EVs to which extent.
A review of the life cycle environmental effects of EV batteries in a qualitative and as far as possible quantitative way should identify the main influences on the environmental performance of batteries and point out aspects with a lack of data.

2. Methods

At first, literature research was done for relevant international studies and papers on LCA of lithium-ion (Li-ion) batteries with a special focus on automotive applications. Starting with collected literature in the IEA (International Energy Agency) HEV (Hybrid electric vehicle) Task 19 and 30, online libraries like Scopus and Web of Science were searched for further literature from the years 2015–2019 with keywords, such as “life cycle assessment”, “electric vehicles battery”, “lithium-ion battery”, “battery production” and “battery recycling”. Furthermore, reference lists were examined to broaden the selection, and relevant older literature was added to the research when more recent literature was based on it. Relevant data from collected literature (Table A1 in Appendix A) were gathered and recalculated. With these data, a structure for the literature review was developed, and collected data evaluated to carry out the review. After discussing the results, recommendations are given for future LCAs on this topic and further research and development issues identified.
Collected relevant data are structured into seven main sections:
(1)
General description of the LCA study like authors and year of publication
(2)
LCA approaches used and tools like the background database, sensitivity variables, and assessed impact categories
(3)
Characteristics of the assessed battery packs like the capacity, weight, specific energy, lifespan, and material/component composition
(4)
Qualified and quantified the environmental impact of the battery production for the primary energy consumption and GHG emissions, split into battery components and production stages
(5)
End-of-life treatment like recycling method, recycling rate, qualified and quantified the environmental impacts for the primary energy consumption and GHG emissions, and positive benefits from battery recycling processes
(6)
Qualified and quantified the environmental impact of the whole battery life cycle
(7)
Evaluation of further environmental impact categories
Evaluation of quantified data in the following figures and tables was done by calculating the 50%-quantile (Q50 or median, 50% of all values are lower or equal), the 25%-quantile (Q25, 25% of all values are lower or equal), and 75%-quantile (Q75, 75% of all values are lower or equal) of the sequences of numbers. The Q25 and Q75 are the shown ranges for results. This approach for the review was chosen to limit the high variation of results in the investigated LCAs and to avoid the influence of extreme values on the ranges.

3. Results and Discussion

3.1. General Description of Investigated LCAs

Many of the assessed studies rely on older literature data sources for aspects like the primary energy demand for battery production. Around two-thirds of all publications in this review (30 out of 50) do not include and provide any form of relevant primary data [11,12,13,14,15,16,17,18,19,20,21,22,23,24,25,26,27,28,29,30,31,32,33,34,35,36,37,38,39,40]. These publications rely mostly on databases and further secondary data. Together with a lack of transparency on how these data are used and altered, results of some LCAs can be difficult to trace back and assess, an aspect also previous researches on LCA literature for batteries underline [11,36,41]. The rest of the authors (20 out of 50) published new primary data, for example, for cell production energy demands or material production environmental impacts [4,5,6,7,8,9,10,42,43,44,45,46,47,48,49,50,51,52,53,54]. In the best case, studies published new primary life cycle inventory (LCI) data and presented results in a transparent way to bring research forward. Such studies, like those mentioned in the introduction [4,5,6,7,8,9,10], are the most suitable LCAs for an in-depth review. Although results can become outdated or could be misinterpreted, the provision of new primary data and high transparency are important instruments to gain new knowledge and progress and to see the influence of different assumptions.
Most publications originated in the United States, China, and countries in Europe like Germany, Belgium, Norway, Sweden, Switzerland, and the United Kingdom. The US and Chinese studies tend to assume their own country for battery production, while European studies tend to assume an Asian origin, especially from Japan and South Korea.
Batteries with lithium nickel manganese cobalt oxide (NMC), lithium manganese oxide (LMO), and lithium iron phosphate (LFP) as cathode material are the most investigated battery types (NMC: 39 LCAs, LMO: 29 LCAs, LFP: 24 LCAs), while those with nickel cobalt aluminum oxide (NCA) and lithium cobalt oxide (LCO) are less often studied (NCA: 11 LCAs, LCO: 6 LCAs). This reflects the real-life usage where NMC batteries in electric vehicles are currently widely distributed, due to higher specific energy values (Wh/kg battery), while LMO and LFP batteries were the most used chemistries in the past [11]. Additionally, in laboratories, new types of batteries like lithium cobalt phosphate (LCP) [52] and lithium-sulfur (Li-S) [50] are assessed for comparison with currently used batteries. However, the focus of the review remains on currently used chemistries, due to more available data.
If the assessed battery is associated with an EV, the curb weight class of a VW e-Golf (1615 kg) [55] is the most often assumed weight class (in 13 LCAs). Larger vehicles of the heaviest weight class like the Tesla Model S (2290 kg) [56] or smaller vehicles specified for the city use, are rarely addressed.
The vast majority of battery cell production for EVs is currently located in East Asia (China, Japan, and South Korea) and in the US [26]. The choice of the production location in LCAs reflects this aspect.

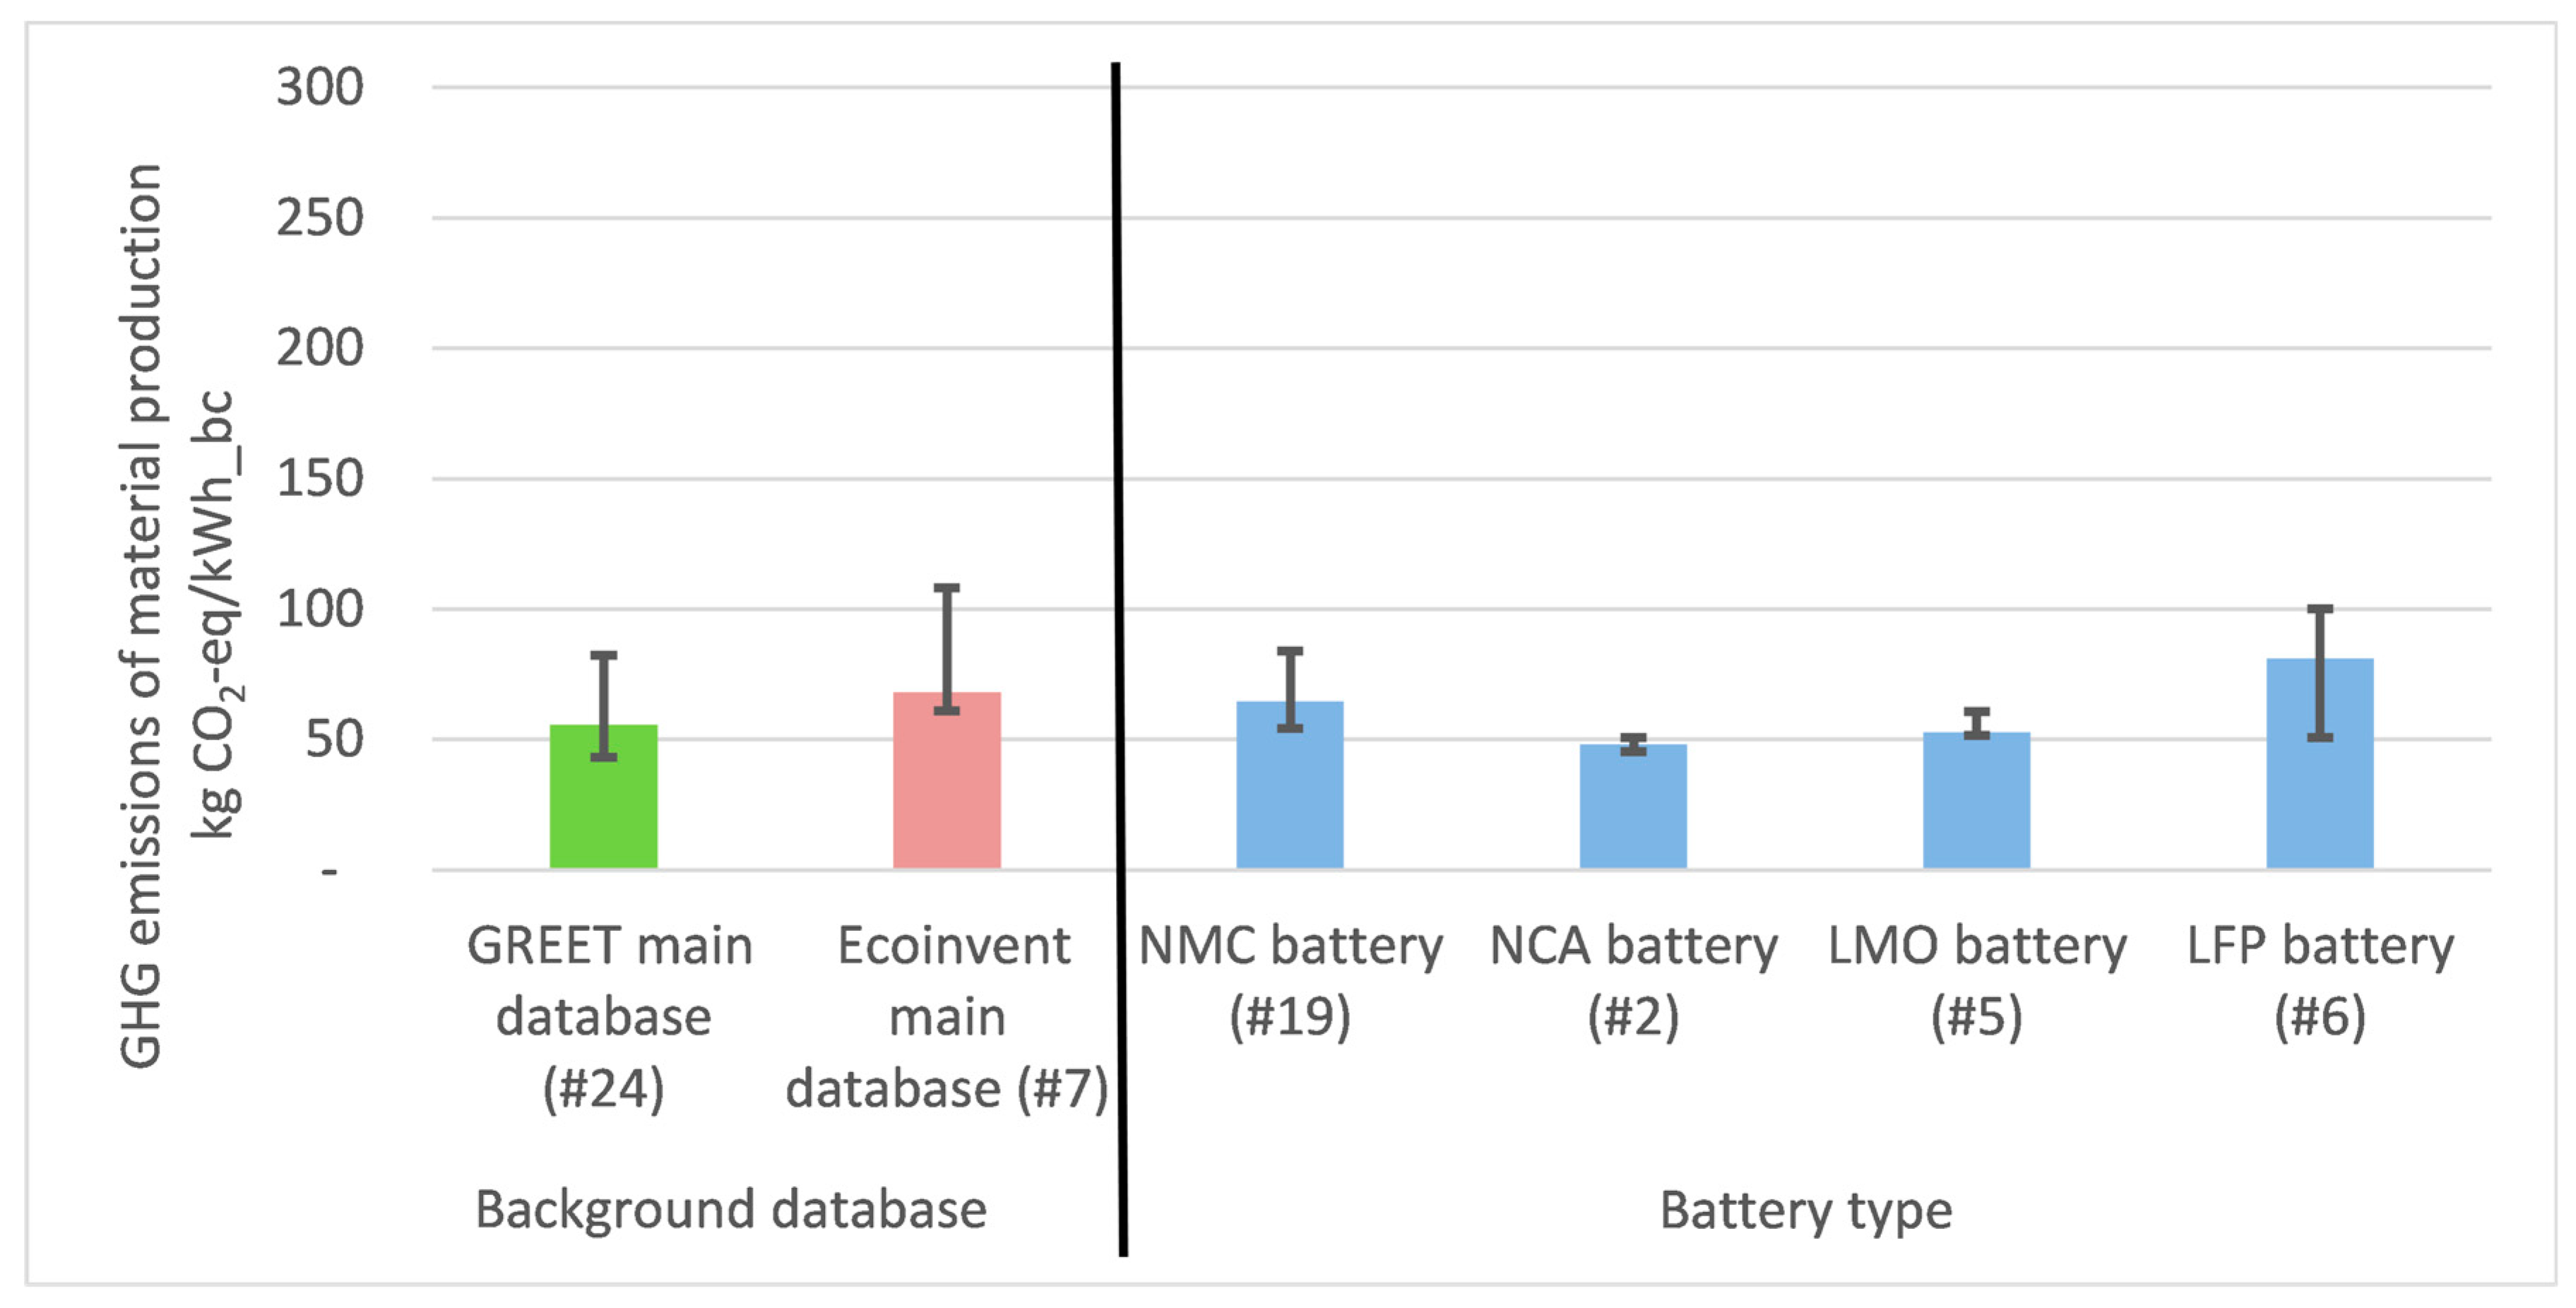
3.2. Used LCA Approaches and Data Sources

To date, LCAs use only an attributional approach for EV batteries, while leaving out consequential effects. The attributional approach takes into consideration the direct effects of the battery life cycle to assess the direct environmental impact of battery production per kWh battery capacity. However, using a consequential approach could lead to new results for other issues by including indirect effects from outside the system boundary of attributional LCAs [57].
LCAs use databases for background data of the LCI to determine the material emissions of battery components, and some databases also provide data for the battery manufacturing and recycling processes. Most often, Ecoinvent [58] is used as the LCI database for background data (20 LCAs), as it includes process supply chains for many products. The studies also often use the GREET model (The Greenhouse gases, Regulated Emissions, and Energy use in Technologies Model) [59] as a background LCI database (13 LCAs) with data for the energy use and emissions of different vehicles and fuels. In contrast to Ecoinvent, the GREET model is also free of charge. The choice of background database can influence the GHG emissions of materials in LCAs, due to different processing steps, assumed shares of virgin and recycled material, and production location [9].
Looking at other data sources, nearly all studies state secondary data from additional literature as sources for the LCI. Some studies also consider general industry data, laboratory analysis, or engineering estimates. It is notable that five LCAs [4,5,6,7,8] (described in the introduction), which also provide primary LCI data, are frequently used as data sources. Two of these LCAs use a bottom-up approach and result in very low energy demand values and GHG emissions for cell manufacturing [4,5]. The other three conduct top-down LCAs with higher energy demand and GHG emissions for cell manufacturing [6,7,8]. Assumptions and decisions made in these three studies are carried over to many other studies in this research field. This connection is also emphasized by Peters et al. [36].
To investigate the dependence on results from different assumptions, LCAs commonly carry out sensitivity analyses, altering different aspects to see the effects on the results. Figure 2 shows the frequency at which sensitivities, due to specified variables have been assessed. Sensitivity analyses often focus on the electricity mix for cell manufacturing, battery specific energy, battery lifetime, production energy demand, and recycling rate (in LCAs, which include recycling). Future sensitivity analyses could include the assumptions on the reuse of batteries in second-life storage applications or the ambient temperature of production locations and the influence on the energy demand of the dry room operation. Additionally, the investigation of negative end-of-life effects like landfilling of batteries instead of recycling for comparing and quantifying the impact of proper end-of-life handling of batteries could be assessed in the future to emphasize legal regulations.

3.3. Assessed Battery Characteristics

The most commonly assessed battery characteristics can be seen in Table 1.
The investigated battery capacities depend on the presumed use and driving ranges of the battery in PHEVs and BEVs and less on the battery chemistry itself. Studies assume higher capacities for NMC batteries than for LMO and LFP batteries.
Studies generally assume NMC batteries (127 Wh/kg) with higher specific energies for the whole battery pack than LMO (115 Wh/kg) and LFP (98 Wh/kg) batteries, due to technological differences. The values seem low compared to current battery packs, which offer significantly higher specific energies [60], for NMC batteries with high nickel share even up to 200 Wh/kg [12].
Battery lifetime also varies significantly depending on assumptions in LCAs. Looking at the lifetime according to battery charging cycles, studies state significantly higher values for LFP batteries (median: 3200 cycles) than for other Li-ion battery chemistries. However, the values of each LCA seem to be more dependent on the modeling according to the vehicle lifetime than on differences between battery chemistries. Therefore, studies often exclude in-depth lifetime considerations from calculations and results.

3.4. Environmental Impact of Battery Production

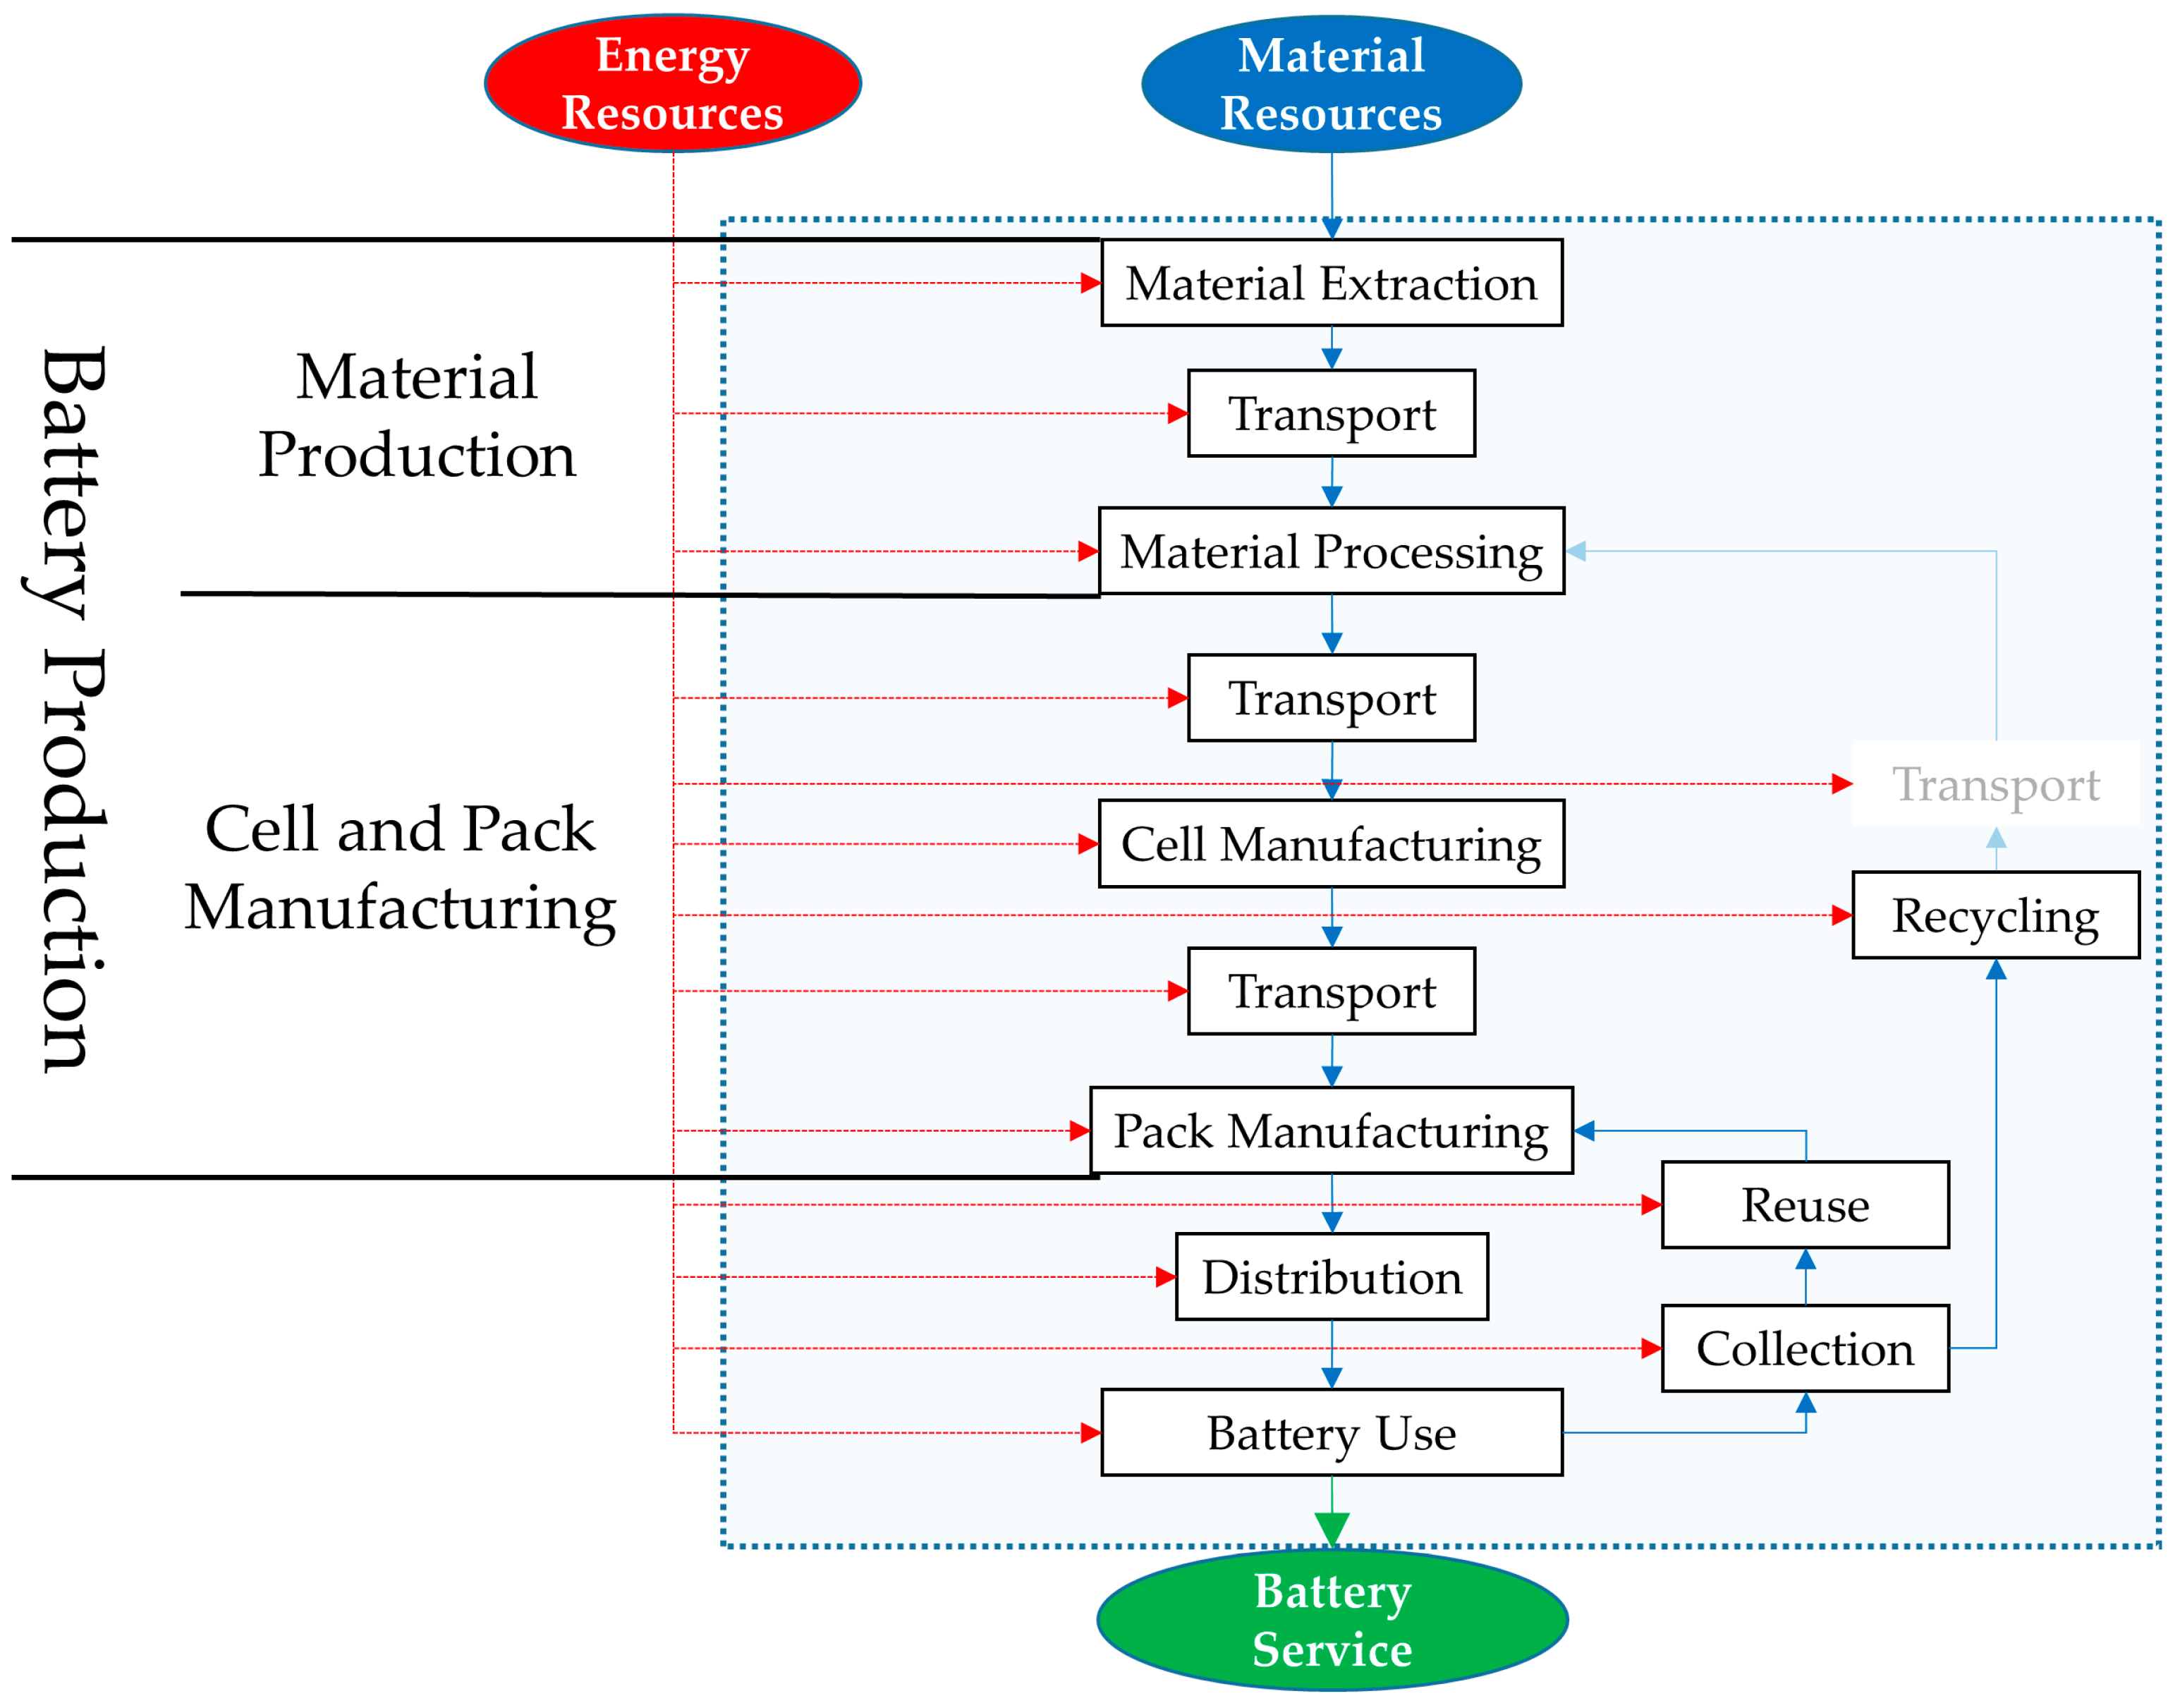
3.4.1. Major Environmental Contributors in Battery Production

The cell manufacturing step is the most mentioned aspect for the contribution to the environmental impact of battery production with a focus on the primary energy demand and GHG emissions. Especially the operation of the dry rooms and electrode drying is called the most energy demanding processes in battery production [8,9,10,11,12,43,47,50,53,54]. The second most mentioned environmental aspect is the cathode with its materials and its processing energy demand [5,6,7,8,9,10,12,14,15,22,27,34,35,37,38,42,43,49,50,53,54]. Further aspects that are less often identified as major contributors are the use of metals like copper [4,5,8,50] and aluminum [4,9,10,34], electronics in the battery management system (BMS) [4,6,11,29,49] and the anode as a whole [27,35,37].
Whether the LCA mentions cell manufacturing or the cathode materials and their processing as the most significant environmental contributor, seems to be dependent on different aspects. The first aspect is the choice of the modeling approach (top-down or bottom-up) for the energy demand of cell production. The second aspect relies on the capacity and utilization of the cell production facility.
A top-down approach starts with the data for the energy demand of a whole production facility and allocates it to the various products and processes. Using a top-down modeling approach leads to significantly higher values for the energy demand in comparison to a bottom-up approach. LCAs applying a bottom-up approach describe specific single processes in the production line based on industry data or calculations and estimations, and project those processes onto the total energy consumption of a facility. Due to the principle of each approach, bottom-up estimates tend to overlook aspects of the total energy demand, while a top-down approach tends to double-count energy demands, by including demands which are not linked to the explored product [36].
Therefore, top-down LCAs mention cell manufacturing as the most significant environmental contributor, while bottom-up studies are highlighting the environmental impacts of the cathode.
On the other hand, top-down LCAs also mention cathode as an important environmental factor. The modeling choice of the cell production process does not influence the emissions for the production of materials of the cathode. Therefore, there is no significant difference between top-down and bottom-up LCAs for this aspect. The environmental contribution of the cell production process relies on further factors. Dai et al. [9] used a top-down approach for NMC batteries with primary energy demand data from battery material producers and Li-ion battery manufacturers for EVs. While the cell production process is still an important environmental contributor, it is found that the emissions for extraction and processing of the active materials in the cathode and aluminum are more relevant. This is contrary to the results of Ellingsen et al. [8]. As shown in Table 2, three main aspects contribute to this result.
First, Ellingsen et al. state the direct energy demand of the assessed production plant as 163 kWh/kWh_bc produced for the lower bound value (asymptotic value: 267 kWh/kWh_bc, average value: 644 kWh/kWh_bc). According to the authors, this should represent future large-scale production the best, but it depends on the production output over time. In contrast, the energy demand stated by Dai et al. is 47 kWh/kWh_bc. This is significantly lower and is explained by the authors by the higher production output with higher utilization of the facility (two GWh per year) and employed energy-efficient measures to reduce cell production costs, as compared to Ellingsen et al. Regardless of the utilization of the production facility, the energy demand for the operation of the dry room remains constant to provide the needed air conditions for the cell production. Therefore, a higher production output with operation at near full capacity can lead to lower energy demand and environmental impacts per kWh of battery capacity produced. Apart from that, Ellingsen et al. use an East Asian electricity mix with a higher coal share (46%), while Dai et al. assume a US electricity mix with a lower coal share (32.7%) and higher renewable energy share. This difference is further exaggerated by the fact that Ellingsen et al. assume that the whole energy demand is provided by electricity. In a sensitivity analysis by Ellingsen et al., the GHG emissions are, therefore, highly dependent on the assumed electricity mix, where the use of hydroelectric power can lower the cell production impact by 60%. In contrast, in the study from Dai et al., electricity is mainly used for operating eleven dehumidifiers and four industrial chillers, while a natural gas heat plant is used for providing steam for dehumidification and drying. Dai et al. assume that heat from natural gas provides around 82% and electricity only 18% of the energy demand, lowering the influence of the local electricity mix.
As Dai et al. state, an additional aspect can also be the choice of solvents. Ellingsen et al. use an N-methyl-2-pyrolidone (NMP) solvent for the anode, which is more energy demanding in the vacuum drying step, while Dai et al. choose a water solvent for the anode, as it is currently state of the art [61]. The more recent results of Dai et al. seem to be more realistic for current and future cell production processes. For example, Ellingsen et al. reduced the electricity demand by 50% in a later study after reviewing industry reports [13], and this results in a value closer to Dai et al. Current data from the Northvolt cell production plant in Sweden also indicate values in the range from 50–65 kWh/kWh_bc for current and future large-scale battery cell factories [62]. Nevertheless, the results of Ellingsen et al. were in the last years often used as the basis for other top-down LCAs.

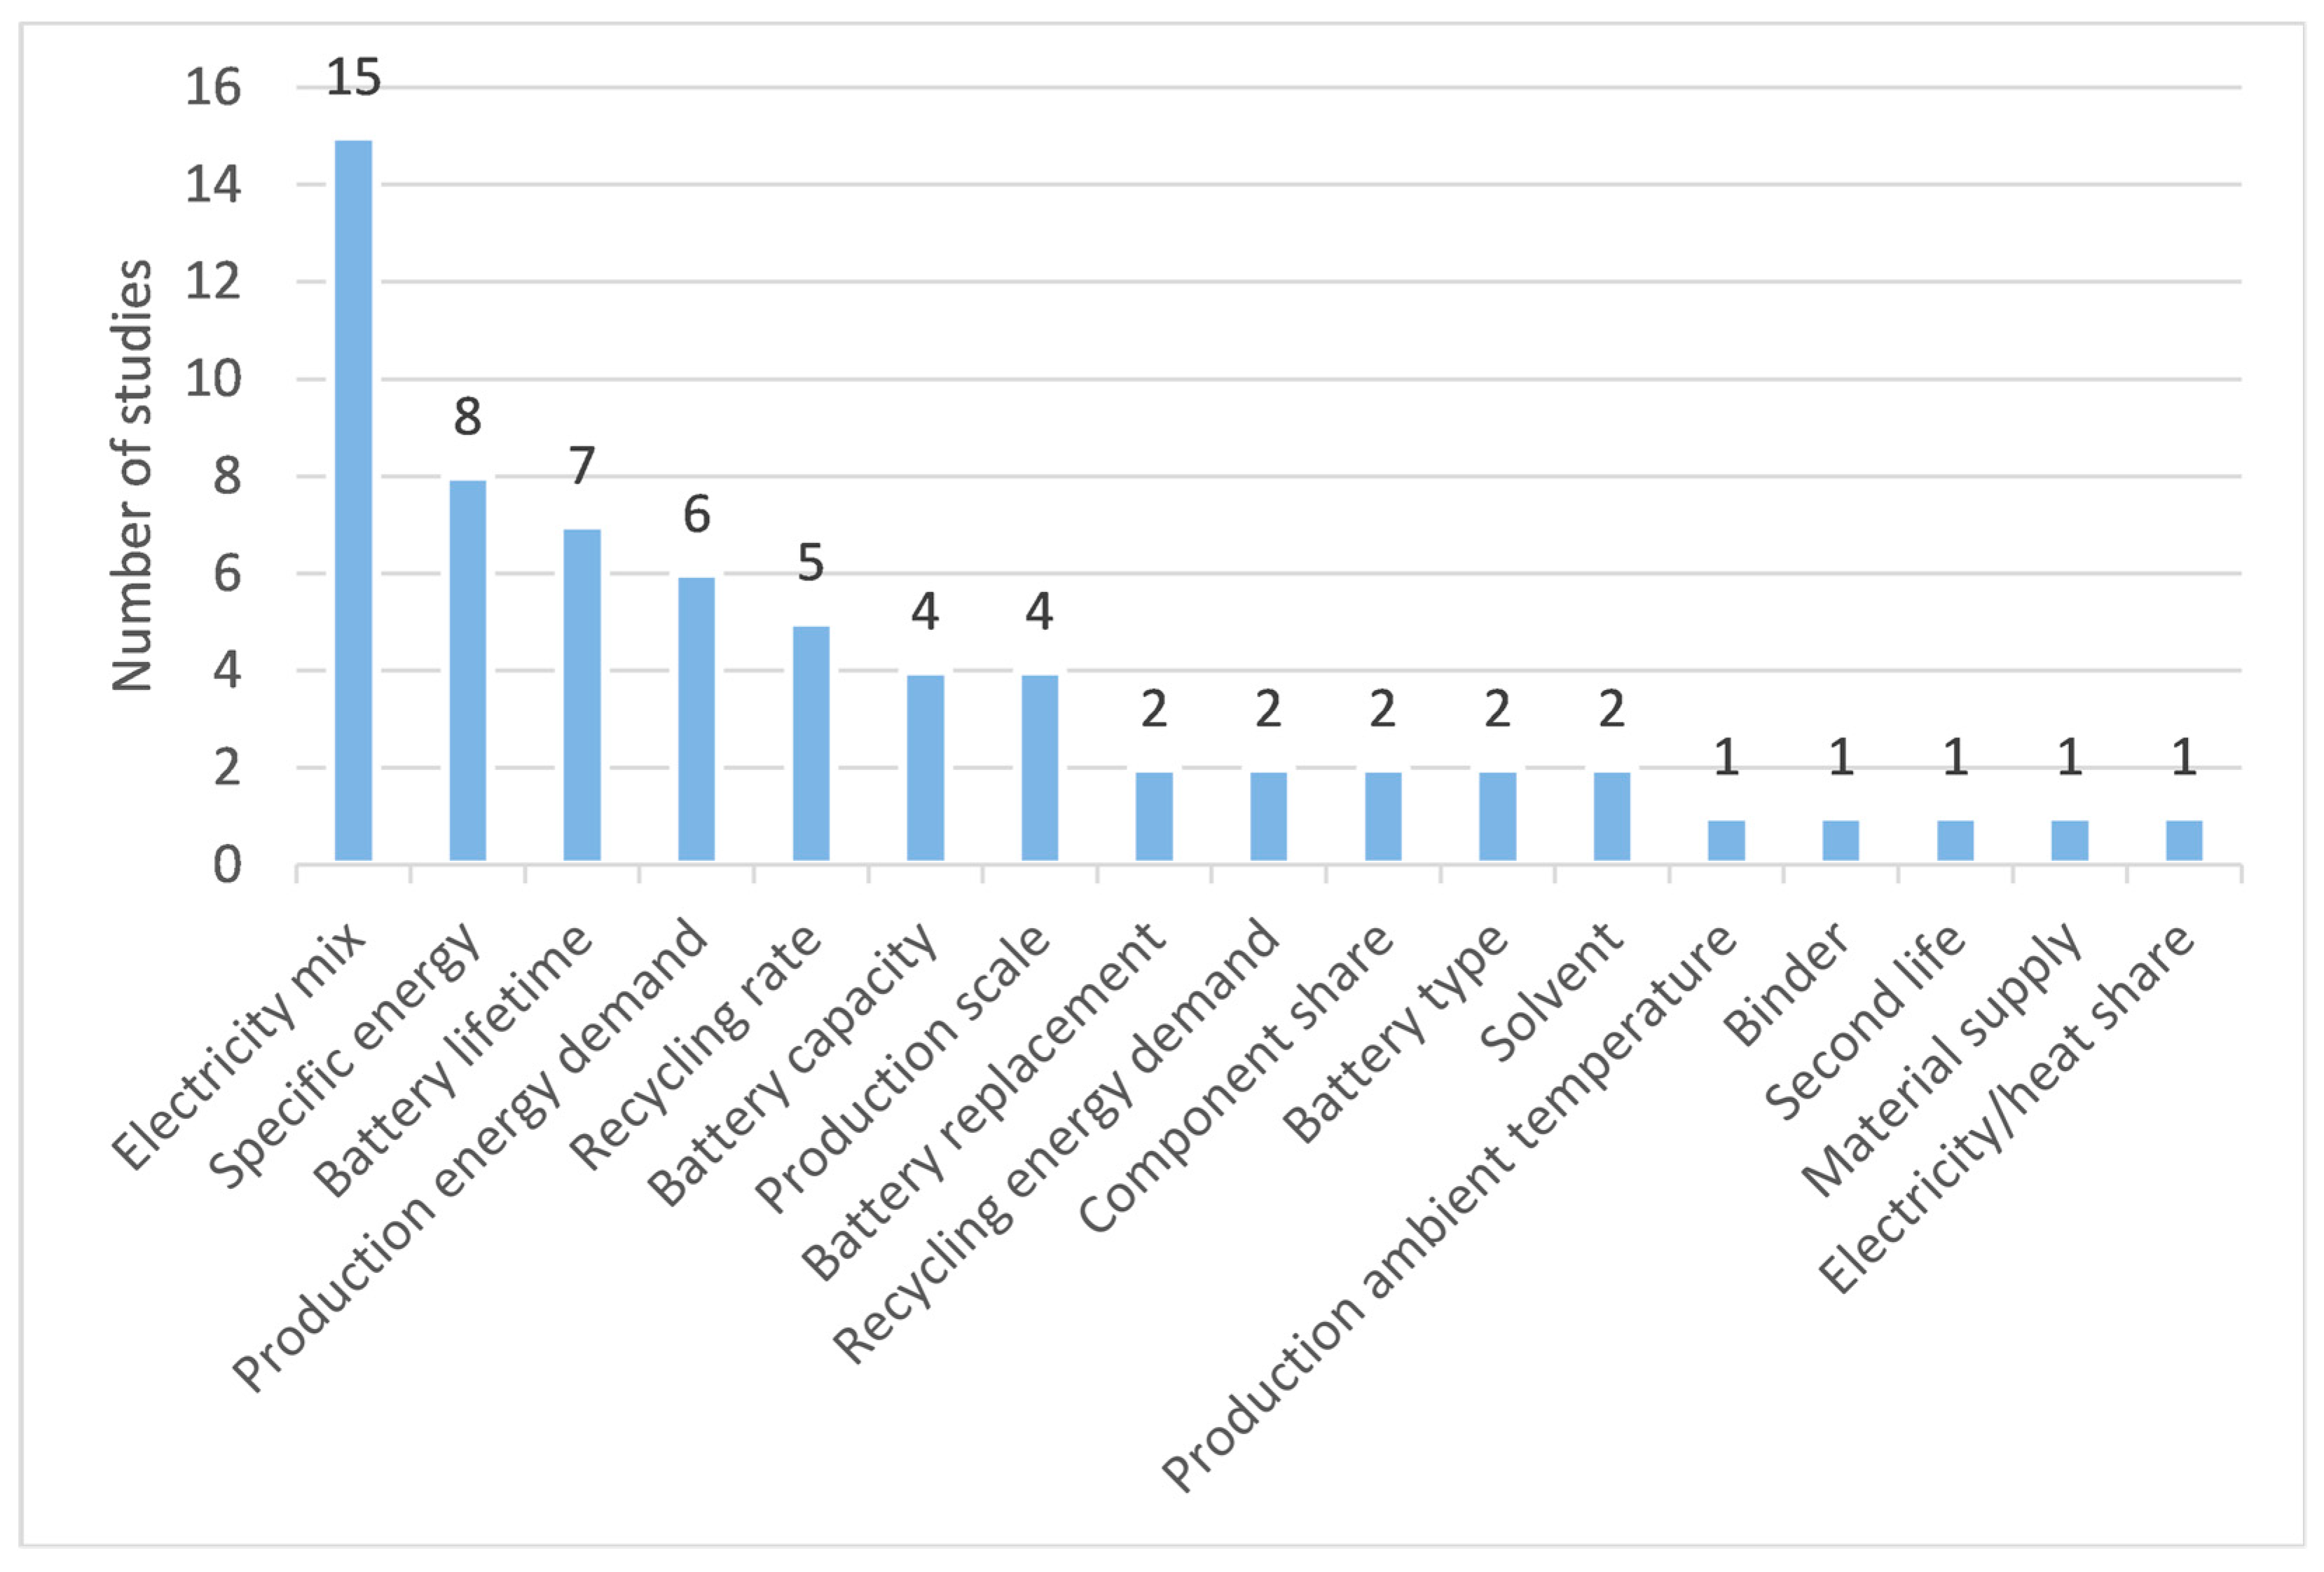
3.4.2. Collected Numerical Data for Battery Production

The production life cycle phase can be divided into two main sections: Battery material production and battery cell/pack manufacturing. The numerical results for the environmental impact of battery production are divided per battery component for material production and per battery production stage for the total battery pack.
Generally, environmental impact categories use in most cases equivalents like CO2 equivalents for GHG emissions, including further GHGs apart from CO2, such as methane (CH4), nitrous oxide (N20) chlorofluorocarbons (CFCs), and hydrochlorofluorocarbons (HCFCs). Different emissions can have qualitatively the same environmental impact like CO2 and CH4, while quantitatively, the impact is different. The effect of one kg CH4 on global warming is up to 34 times higher than that of one kg CO2 [63]. Therefore, the emission of one kg CH4 would be 34 kg CO2-eq for GHG emissions.
Other impacts like ecotoxicity can have more local instead of global effects and can be split up into terrestrial (affecting soil) and aquatic (affecting water) effects, where a further split is possible between effects on freshwater or seawater (marine) [1]. Chosen effects and categories, splits, and units depend on the respective LCA study and the used impact assessment methods. For further impact categories like acidification or eutrophication, there are not enough data available in the literature to split between battery components and production stages. Therefore, the impact per component and production stage is evaluated for the primary energy demand and GHG emissions. Further impact categories are assessed per total battery pack.
Nevertheless, for the primary energy demand and GHG emissions, considerably more data are available for the total battery pack than split per component or production stage. Data per component are very limited, as the environmental impacts are often stated per material and not per component. This, together with missing material shares of single battery components, impedes the evaluation.
Data per kWh battery capacity have been gathered for review. If not directly provided, conversion to impacts per kWh battery capacity is in most cases possible when studies provide values per kg battery weight or values for the total battery pack. Conversion of data to impacts per kWh battery capacity is not possible when the study does not state the specific energy of the battery pack or states only total values per battery pack without stating the capacity of the pack. Together with missing detailed descriptions of data sources and presumed values for calculation, the transparency of some LCAs is limited.

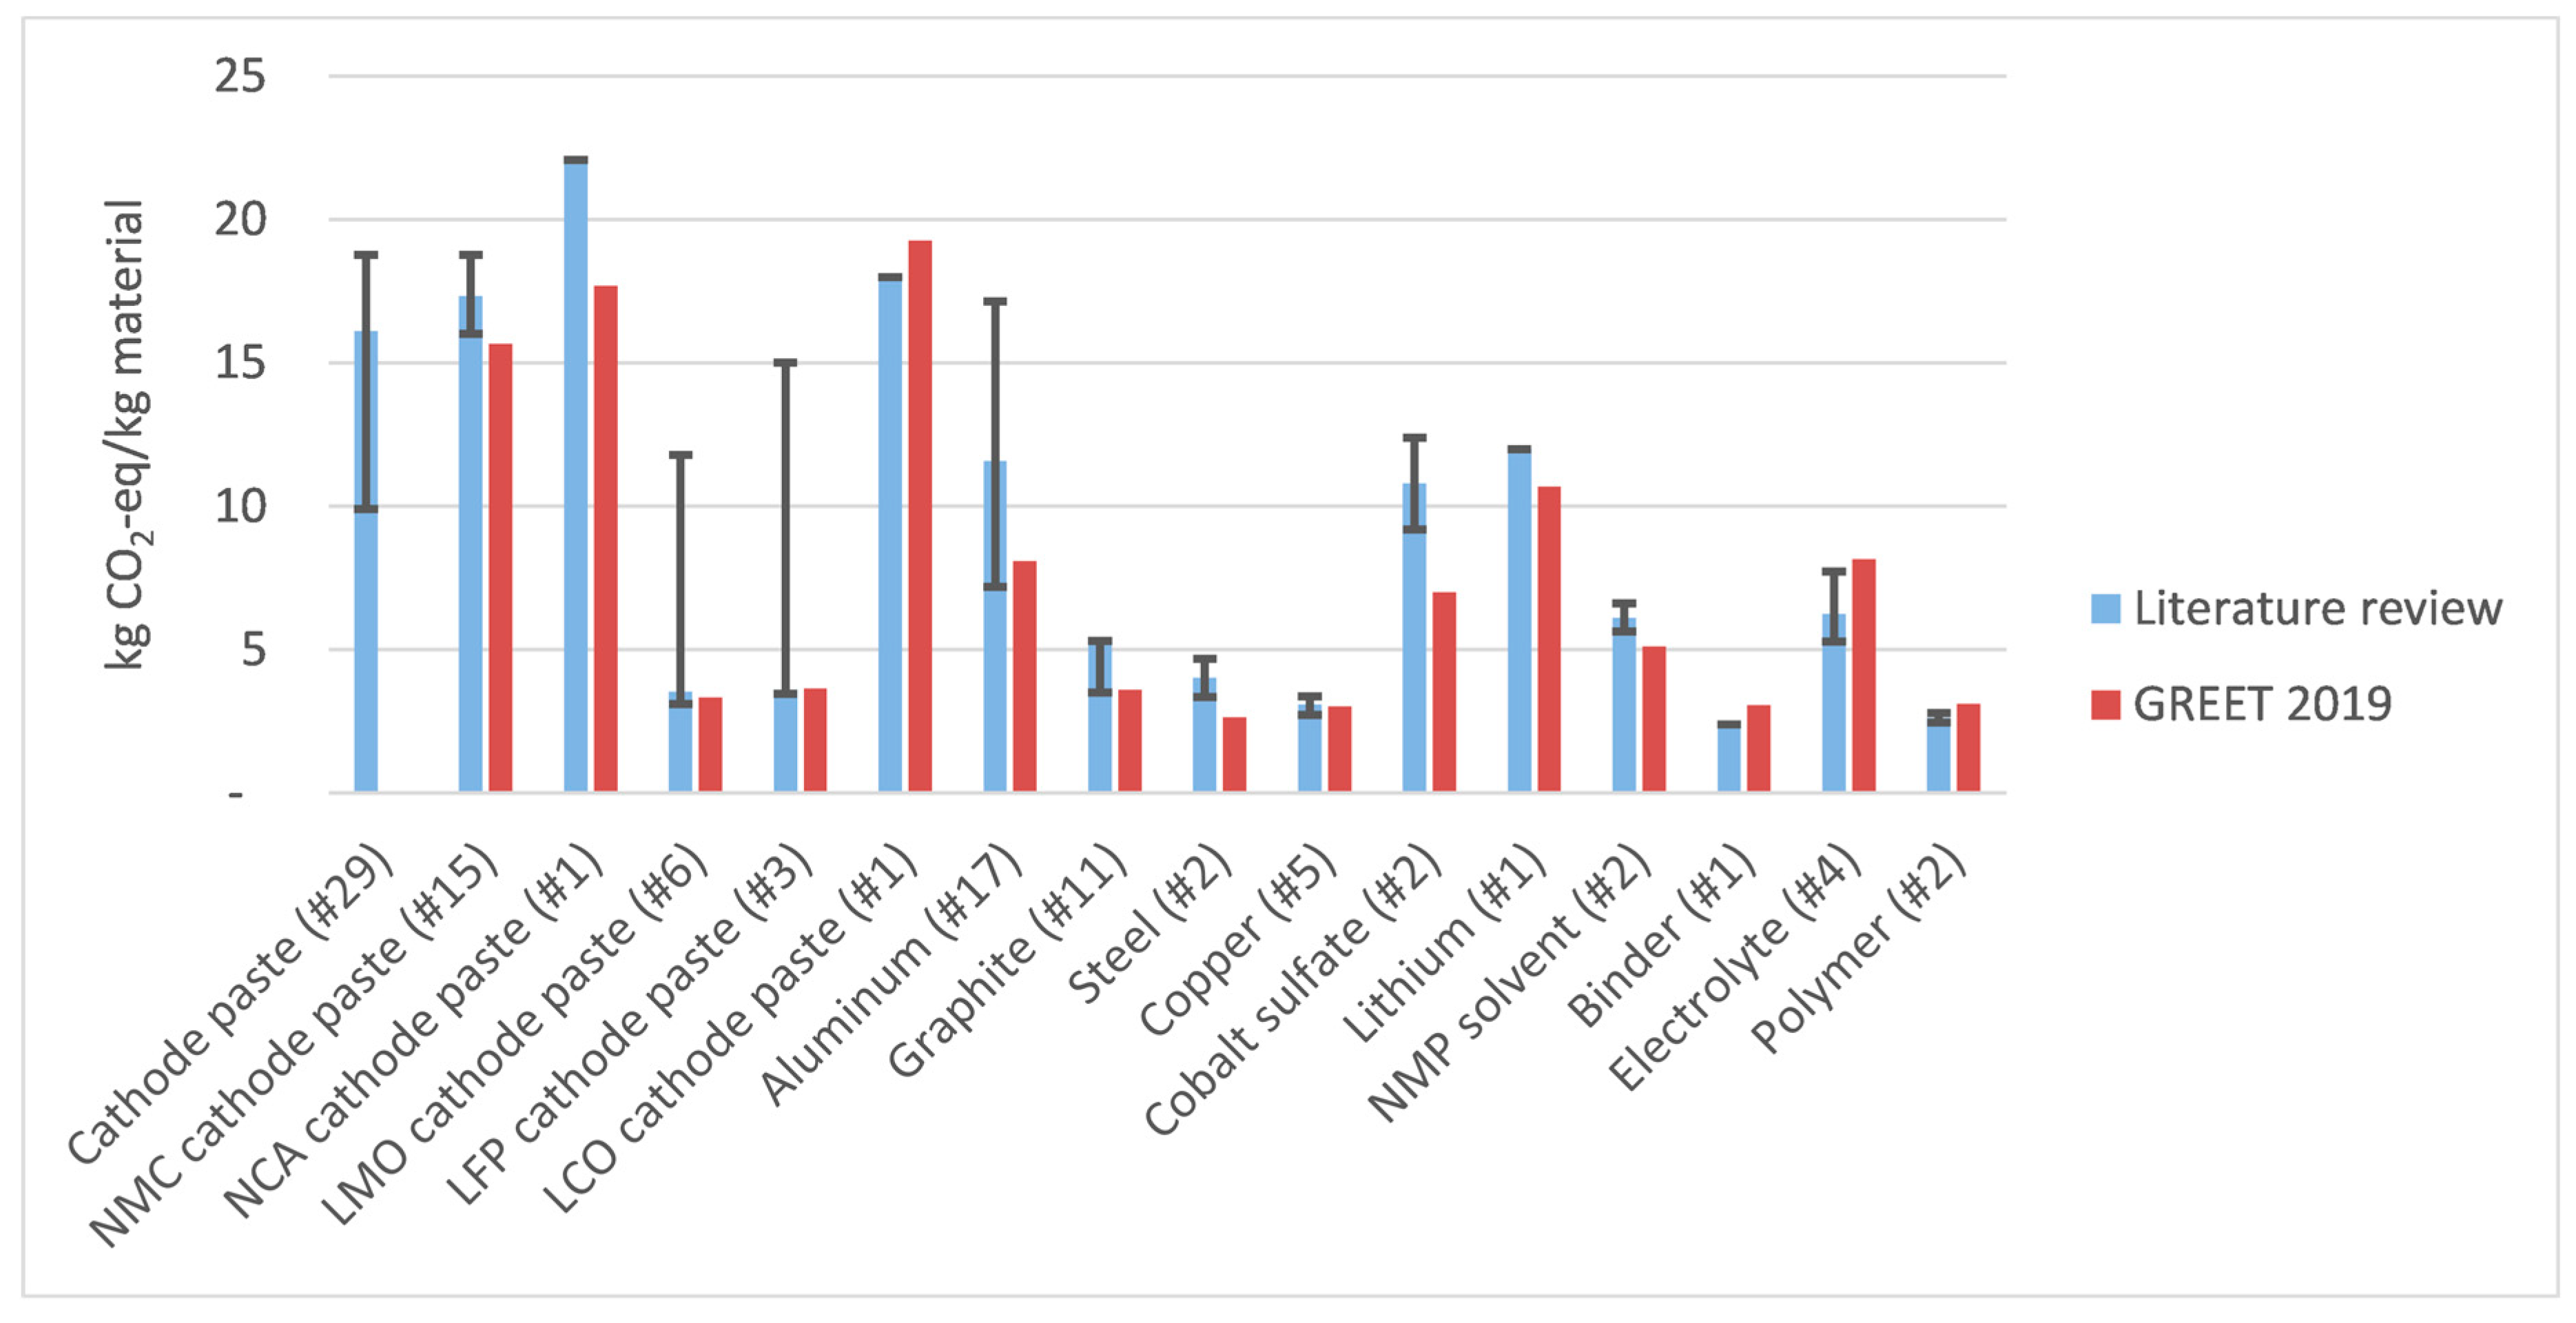
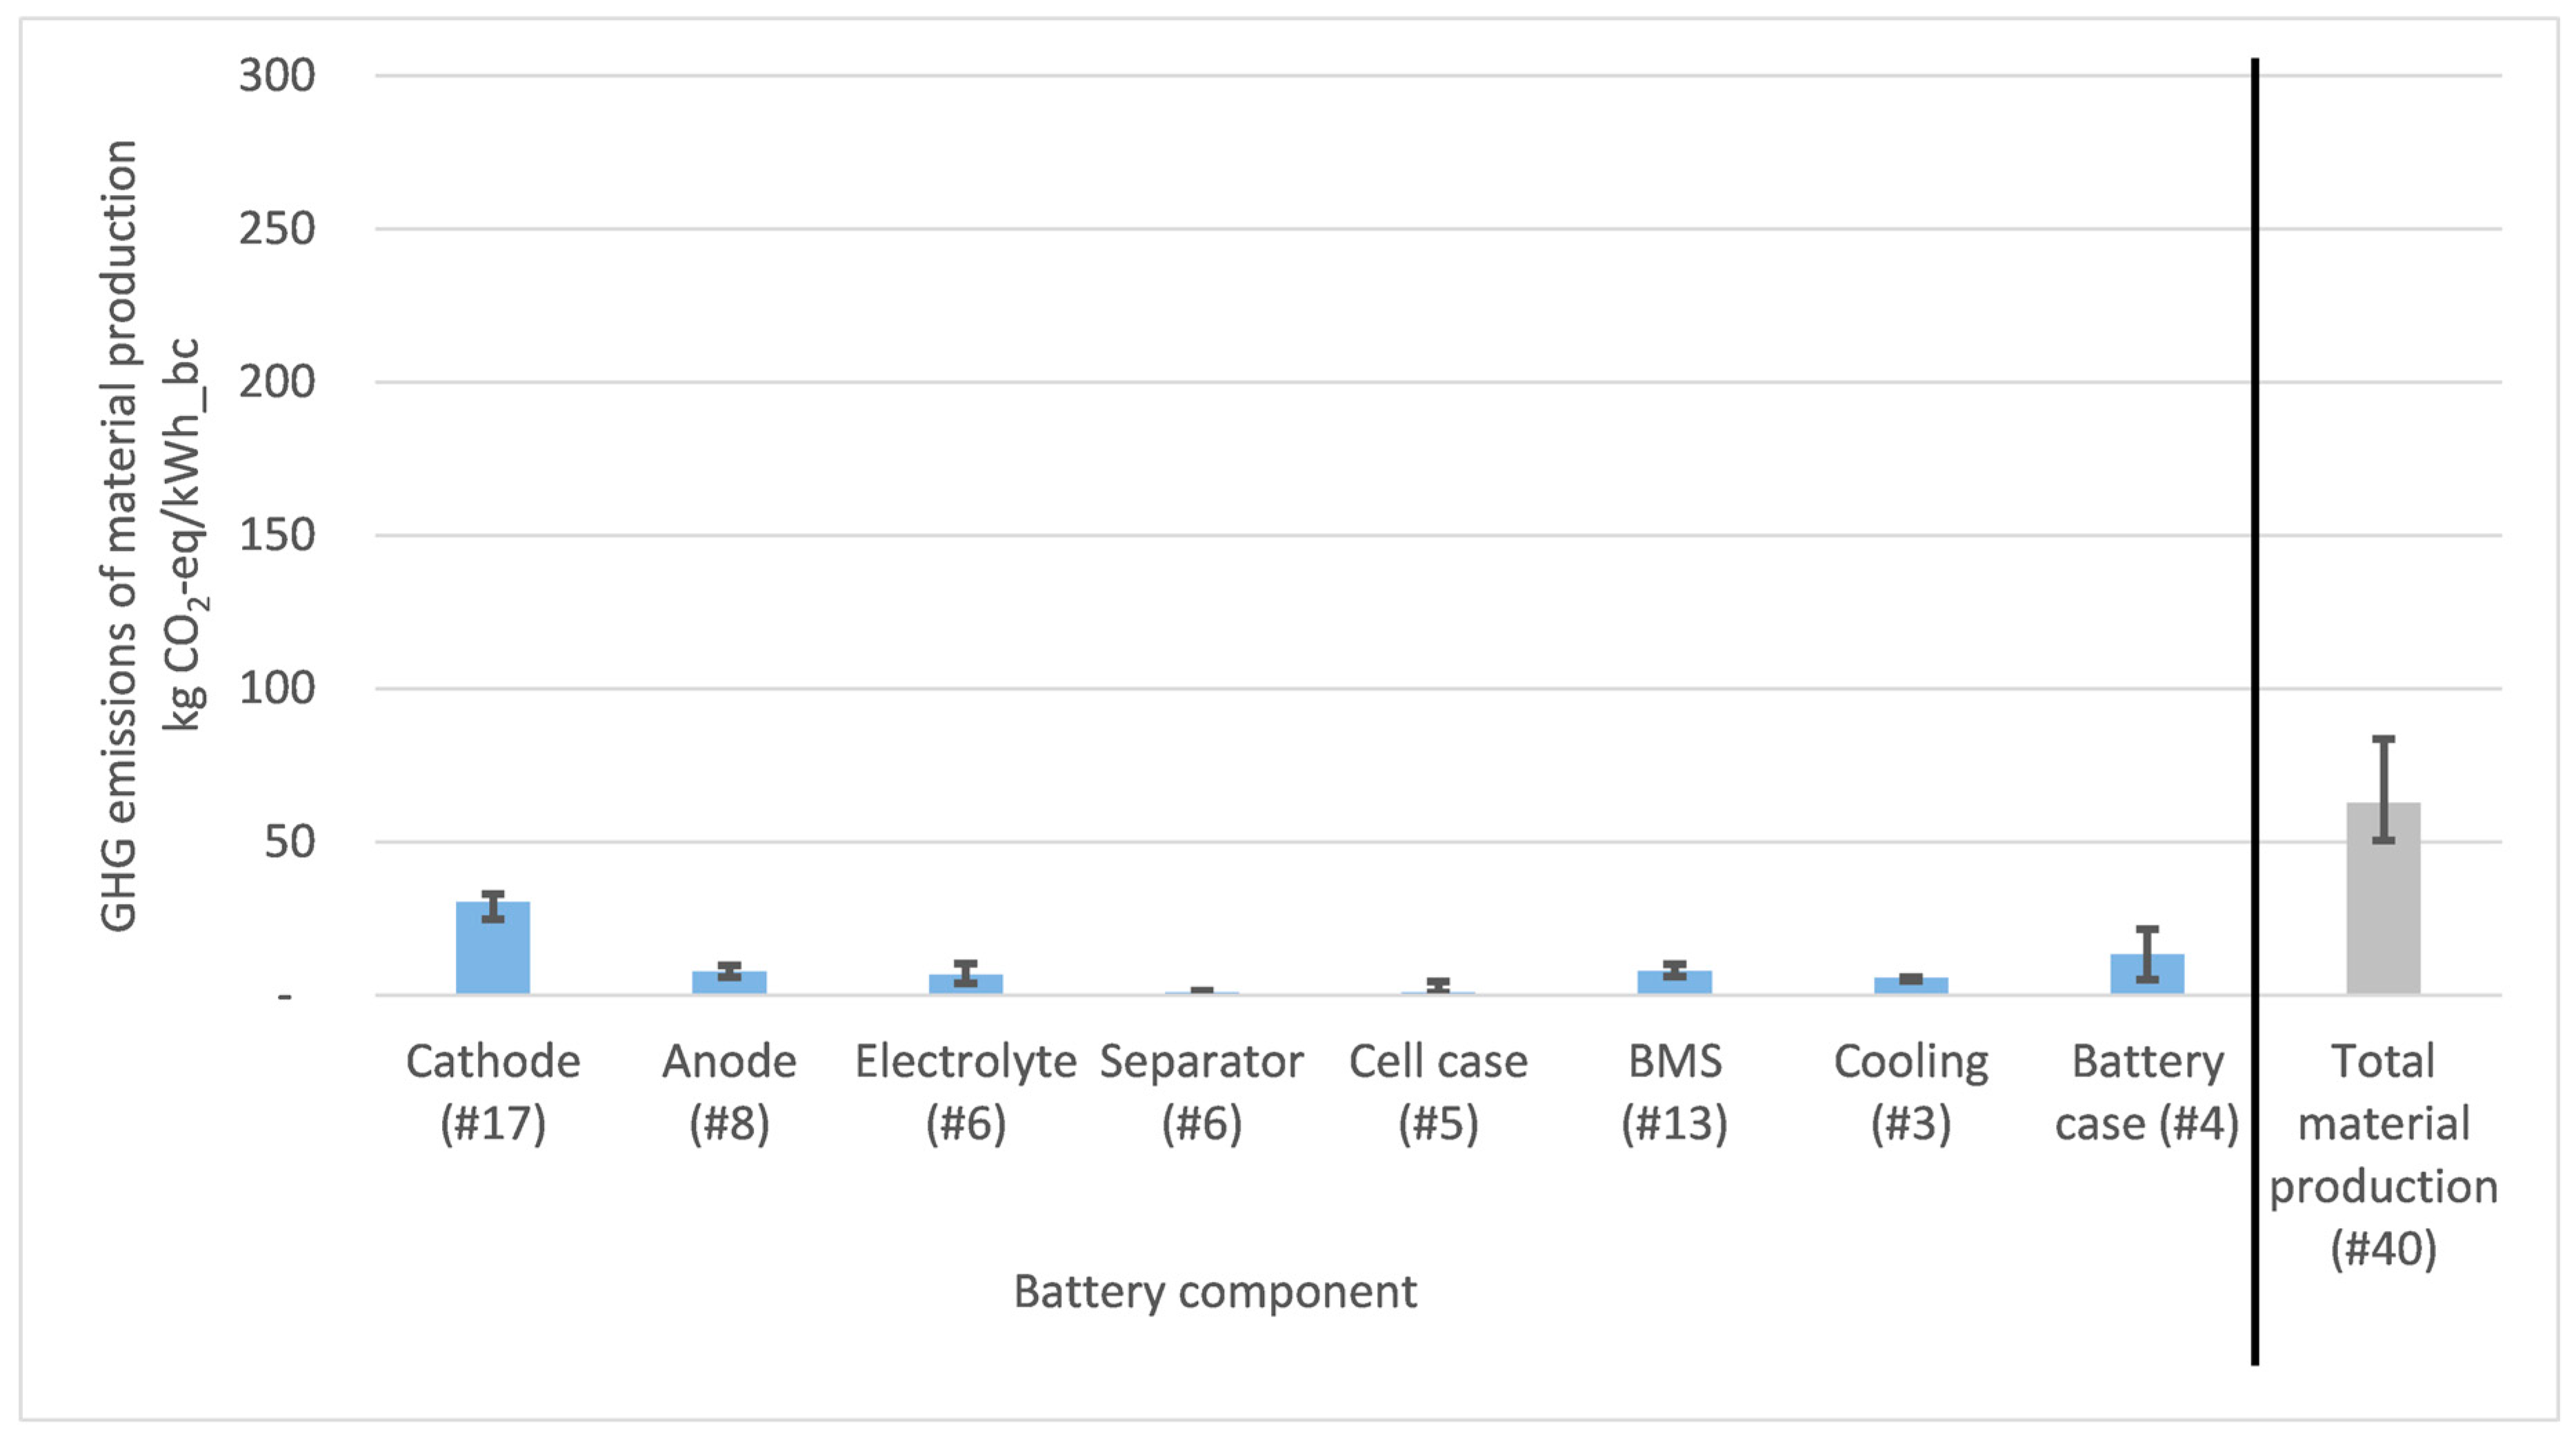
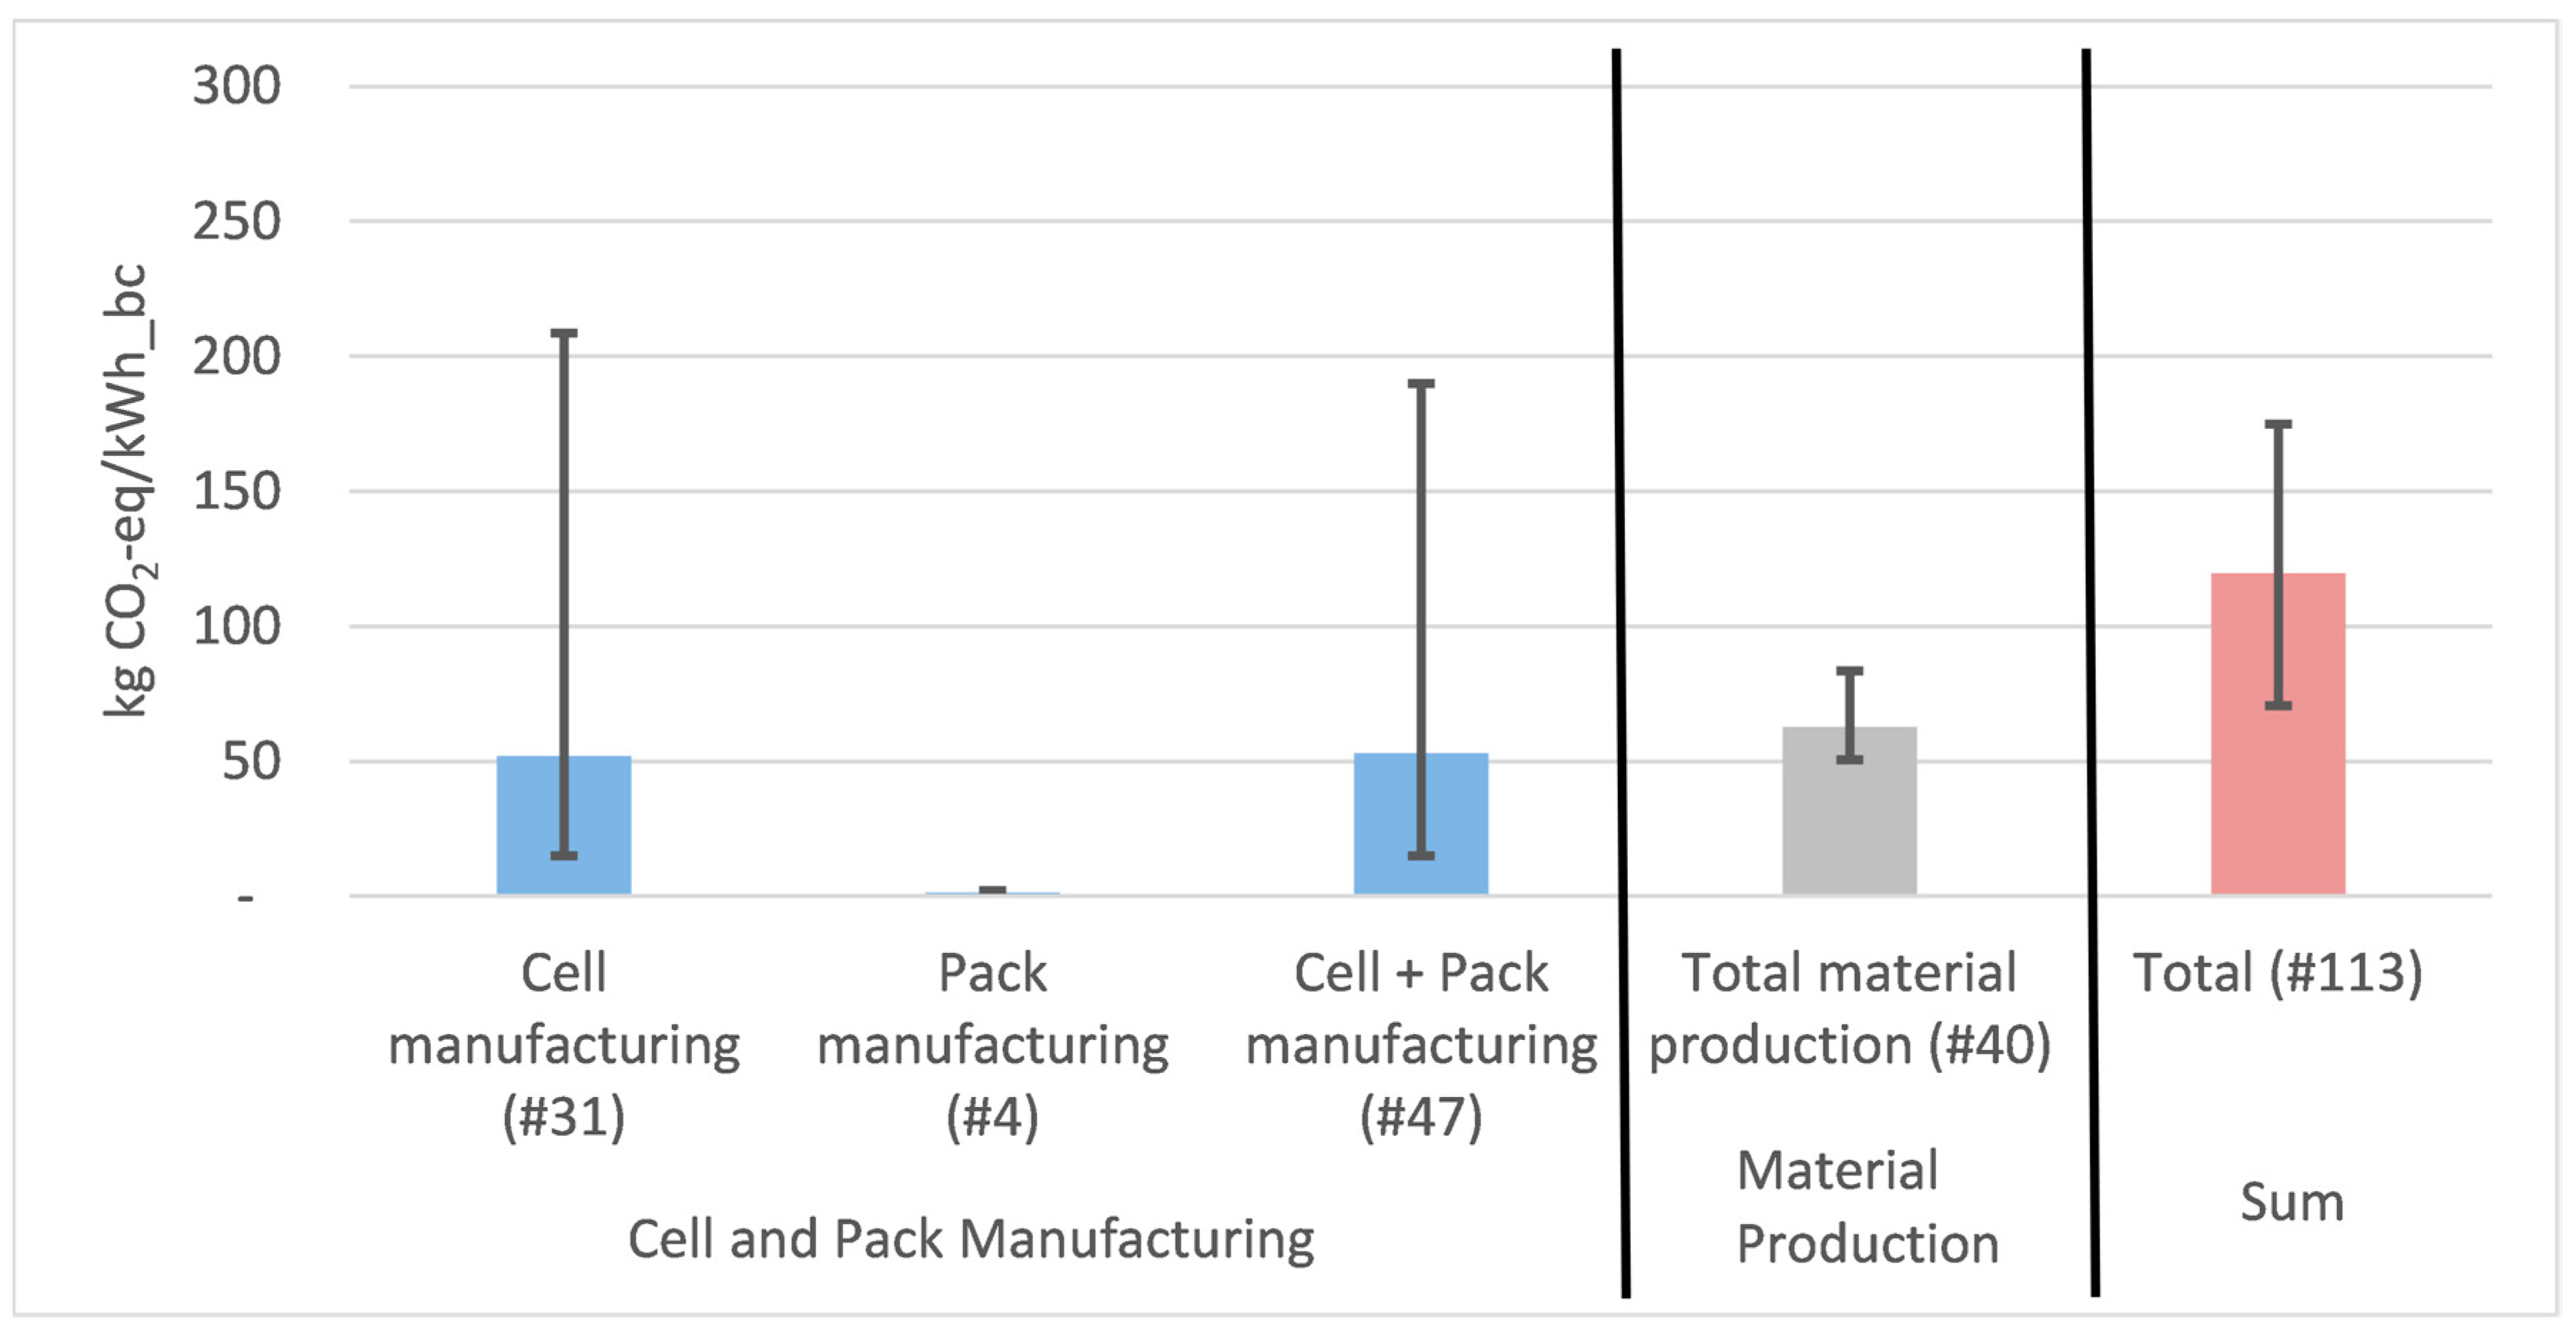
3.4.3. Numerical Results for Material Production

As shown in Figure 3, the GHG emissions of battery materials vary significantly depending on the choice of active materials for the cathode and amount of aluminum. Note that in the following figures, the number of values obtained from the literature will be stated as “(#x)”. One LCA can state several values when different batteries are assessed and compared. For some aspects, the amount of data was limited. The GHG emissions for each material can vary depending on the choice of background databases and the assumed share of virgin/recycled material. A higher share of recycled material lowers the impact. Studies often do not state assumed GHG emissions of single battery materials, and the assessment is further impeded, due to missing data on the material composition of batteries.
The comparison with the database GREET 2019 [59] in Figure 3 shows that values in LCAs are similar to those provided by the database. However, LMO and LFP have a rather large range, which can be explained with the inclusion of a study, which considers solely Chinese production of battery materials [34]. Due to a higher coal share and GHG emissions of the Chinese electricity mix, slightly higher values are expected, but large uncertainties remain. The stated values seem high for LFP production compared to the data from GREET 2019, even when considering the Chinese electricity mix for the GREET 2019 data. Another Chinese study, with largely the same authors, has similar GHG emissions for NMC batteries [18]. Excluding the Chinese studies, the results show similar median GHG emissions of NMC, LMO, and LFP as compared to GREET 2019, where NMC and LCO have higher impacts per kg than LMO and LFP. However, certain differences between US and Chinese material processing can be expected. Aluminum also shows a comparable high range of results, which could be due to high demands of electricity in the production process of virgin aluminum, and therefore, a high dependence on the local electricity mix [10].
Considering the primary energy demand, the inclusion of recent primary data for NMC powder production by Dai et al. [9] shows, that apart from nickel and cobalt, the co-precipitation and calcination process contribute similar GHG emissions and primary energy demands. According to the authors, the necessary use of multiple-stage calcination, instead of the previously assumed single-stage calcination in the literature, raises the energy demand. It seems that pilot-scale processes and engineering calculations adopted by Majeau-Bettez et al. [7] for the primary energy demands and GHG emissions for NMC, are underestimating the impact of NMC powder production.
The GHG emissions per battery component, as expressed in kg CO2-eq per kWh_bc, can be seen in Figure 4. The limited available data can vary considerably, due to different mass shares of battery components. The cathode and battery cases show significant impacts. Furthermore, the assumed choice of materials can vary between different LCAs (aluminum or steel for a battery case, the share of virgin/recycled material), and the shares of the cell and battery case in relation to the total battery pack vary considerably. Overall, the importance of cathode materials, and casing materials, like aluminum or steel, is visible. This review supports the findings of Dai et al. [9] that the cathode and aluminum, used in many parts of the battery pack like for the cathode, cases, BMS, and thermal system, are the major environmental contributors for material used in battery packs.
Comparing the GHG emissions of material production in Figure 5, one finds that the total GHG emissions in LCAs seems to depend less on battery materials and used background database compared to the total LCA results. Material processing could be more significant than assumed [9] and Chinese studies calculate much higher results for material impact, due to processing in China as compared to the US processing assumed by the GREET model [18,34]. The different material processing paths and locations with different electricity mixes should receive more focus in the research of battery LCAs.

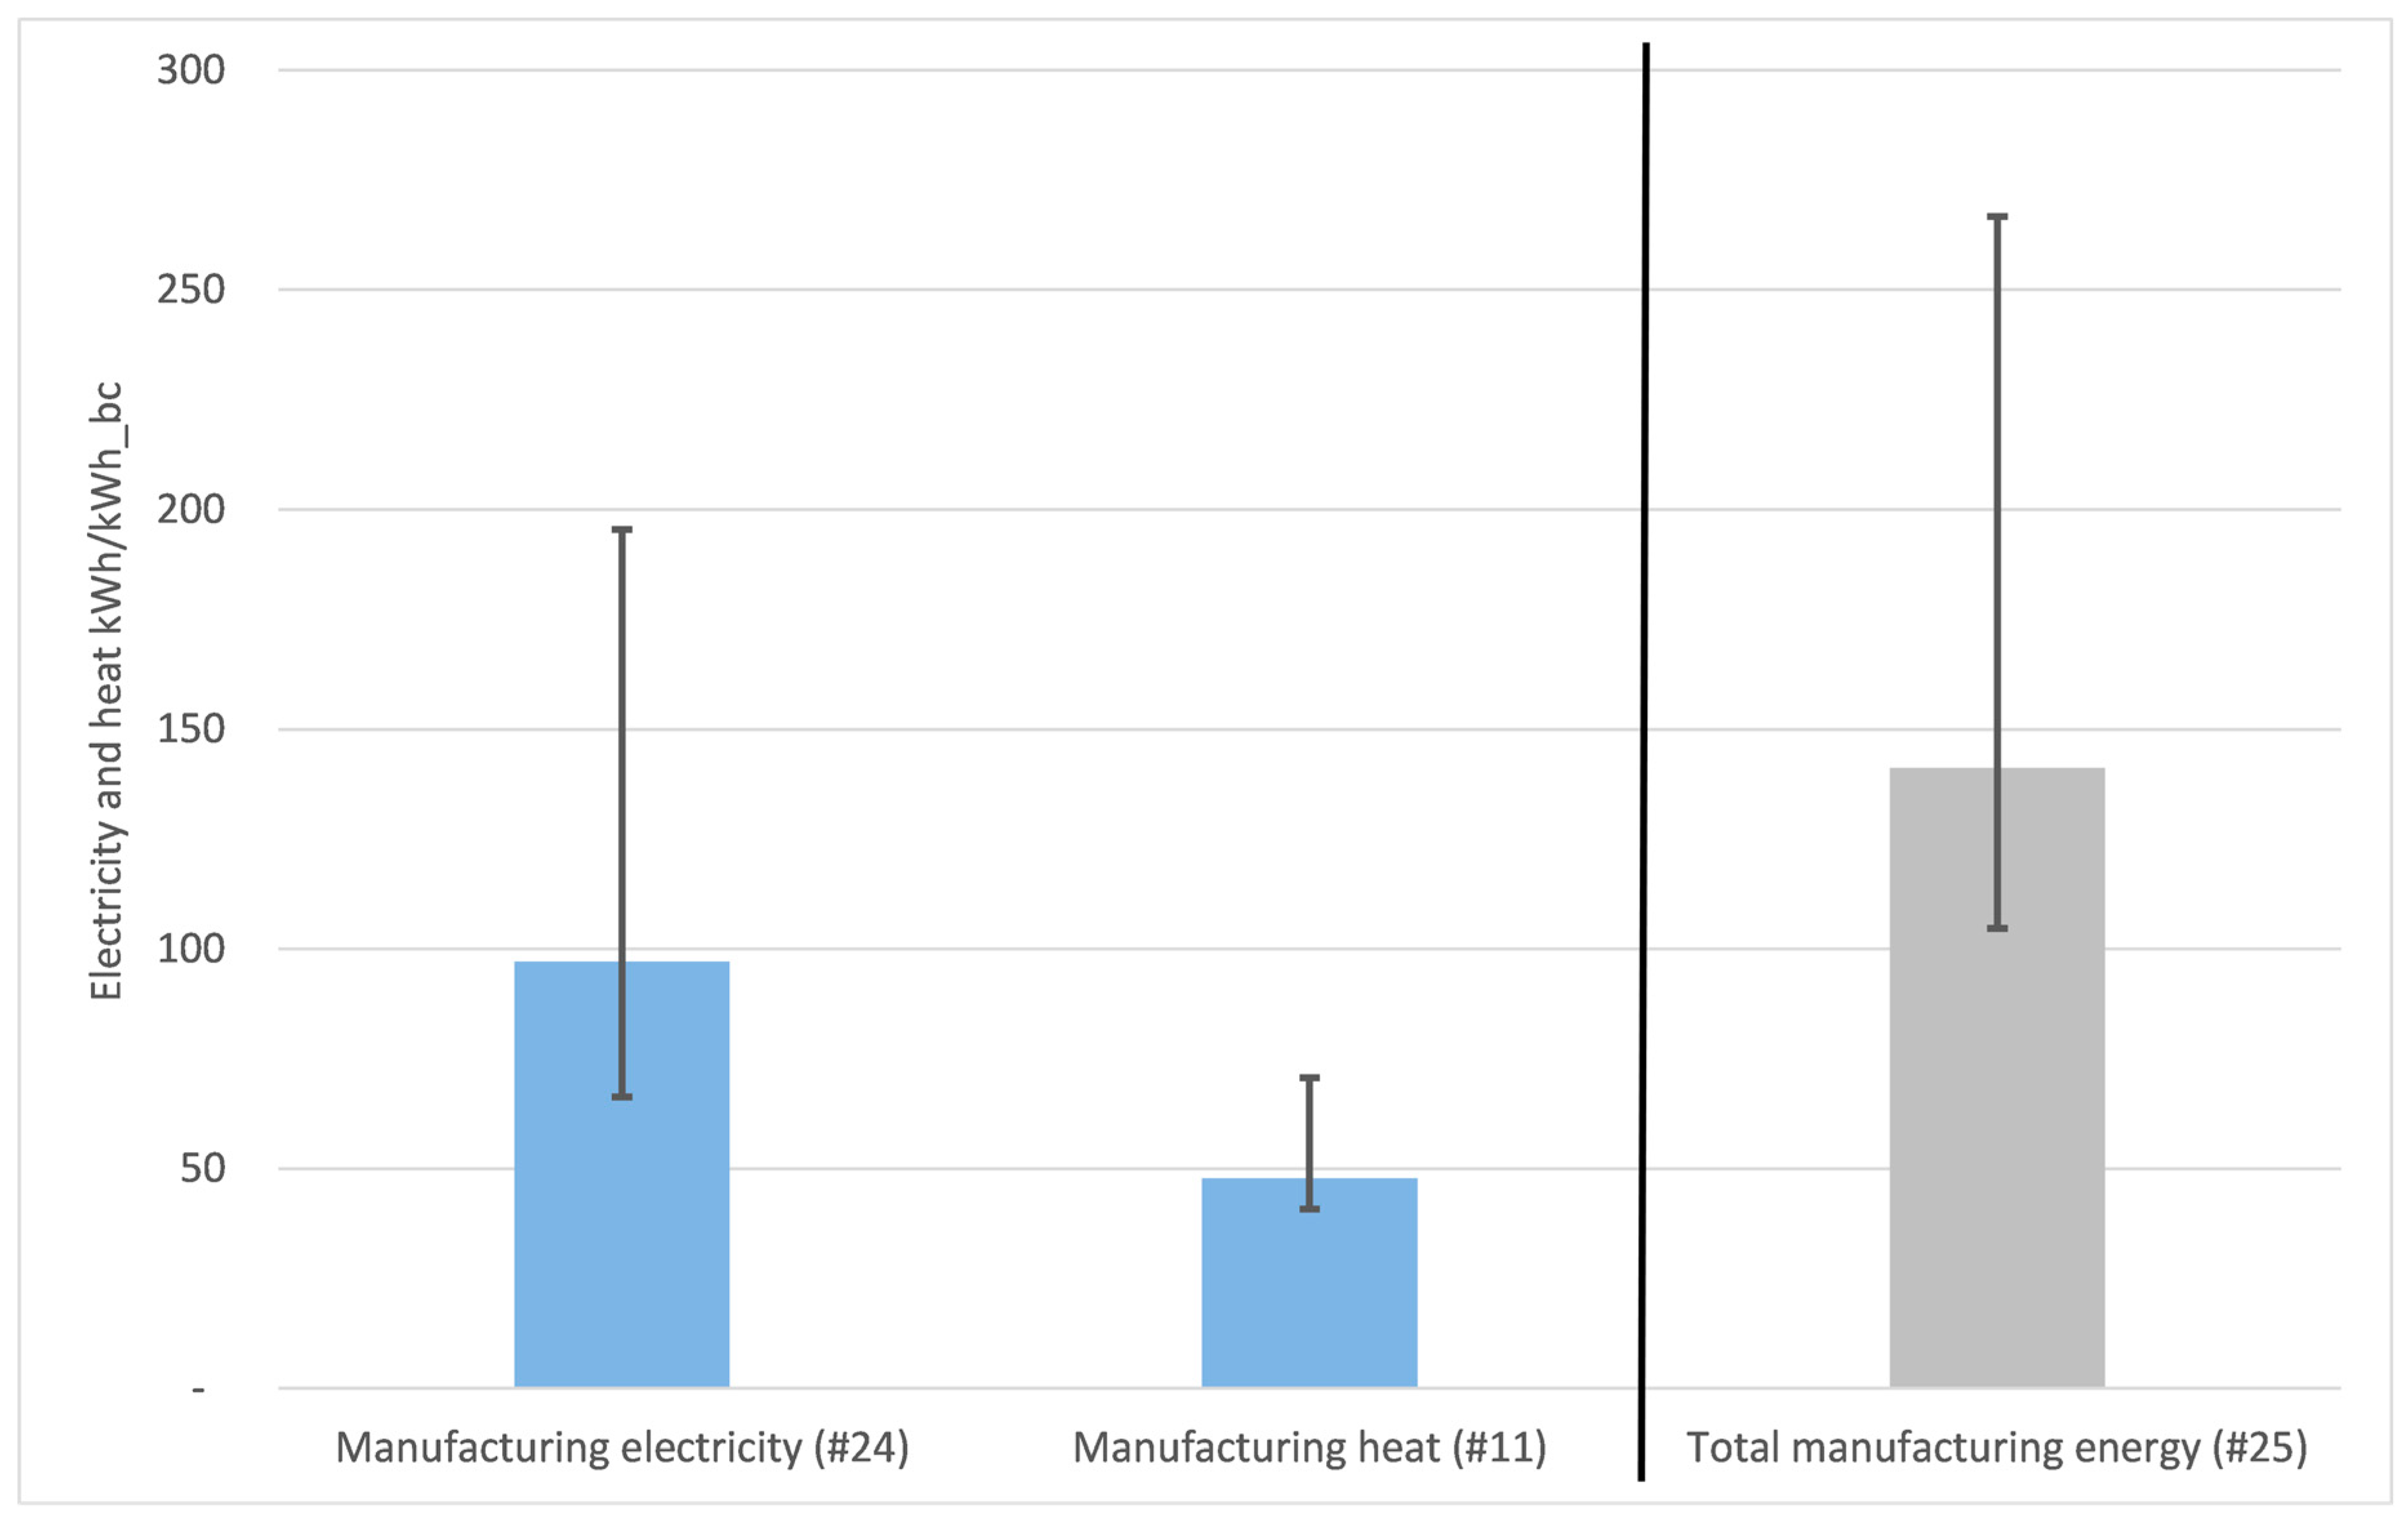
3.4.4. Numerical Results for Cell and Pack Manufacturing

Figure 6 shows the GHG emissions for cell and pack manufacturing compared to material production and the total result. The median impacts of material production (Figure 4 and repeated here) are slightly higher than for cell and pack manufacturing, but results vary considerably as visible. The emissions from pack manufacturing are negligible and are usually associated with manual welding [8,9]. LCAs rarely state separate values for pack manufacturing, and they are often combined into a single value with cell manufacturing. To investigate the variations between LCAs further, different aspects are assessed.
Figure 7 displays the direct electricity and heat inputs in cell manufacturing. The comparison between the electricity and heat shares shows that the heat input (for example, steam produced by natural gas [43]) is assumed with around 50 kWh/kWh_bc with variations up to around 70 kWh/kWh_bc, while the electricity input shows assumptions more than twice as high around 100 kWh/kWh_bc in a range of 60–200 kWh/kWh_bc.
Two factors explain the high variation of manufacturing electricity compared to heat. The first is the difference between top-down and bottom-up LCAs. First, while bottom-up studies are stating only small energy demands for cell manufacturing, top-down studies have higher variability and much higher results. The difference in primary energy consumption between top-down (median: 320 kWh/kWh_bc) and bottom-up (median: 10 kWh/kWh_bc) approaches is also apparent in the assessed manufacturing energy. In accordance with that, a comparison of battery manufacturing GHG emissions shows the same results (median top-down: 80 kg CO2-eq/kWh_bc, bottom-up: 5 kg CO2-eq/kWh_bc), with significantly higher values for top-down LCAs. Even when the high extreme values are excluded (i.e., considered outliers), the range of results in top-down studies is high (30–210 kg CO2-eq/kWh_bc).
The second factor seems to be strongly diverging values from underutilized facilities that depended on 100% electricity, like the previously described values from Ellingsen et al. [8] or estimations from Majeau-Bettez et al. [7]. Many top-down LCAs have based their energy demands on those two publications, which could both have overestimated energy demands for batteries from more energy-efficient large-scale production plants. The electricity demands, stated by Ellingsen et al., significantly influence the results, because they report not only the lower bound electricity demand value of the production facility but much higher electricity demands for less energy-efficient days. Those are again considerably higher and are either used in various other LCAs directly [39,51] or LCAs consider the values as likely, due to the use of primary data from a real production facility [11]. As a result, the statements of the Ellingsen et al. study, directly and indirectly, influence results in top-down studies and lead to assumed results at the upper range of the variations. Cusenza et al. [51], for example, combine the high value of 644 kWh/kWh_bc for cell manufacturing with low recycling rates and calculate for a worst-scenario case an emission value of 585 kg CO2-eq/kWh_bc, which seems unlikely.
Hoekstra [64] also concludes that current LCAs based on large-scale production plants estimate considerably less GHG emissions for the cell production phase than older studies, emphasizing the need to take into account the newest available data when doing research on current batteries from large-scale production plants. However, developments were fast, due to the rapidly rising international share of EVs in the transport sector [3], which strongly increased the number of needed batteries. This led to larger and higher utilized production facilities, making measures for higher energy-efficiency in production more relevant. For example, for the year 2014, Kim et al. [46] assessed the environmental impact of batteries used in the Ford Focus BEV based on a commercial plant and came to the result that the cell production process contributes to around half of the GHG emissions in battery production (65 kg CO2-eq/kWh_bc) (a similar share compared to Ellingsen et al. [8] but slightly lower). The authors emphasized that developments in production scales of facilities and more mature manufacturing processes could have led to lower results than from Ellingsen et al. and could lead to lower results in the future. However, as emphasized by Dai et al. [9], Kim et al. received production data from an underutilized production plant as the demand for batteries were low, leading to a still high result for GHG emissions compared to values in current studies. From this, it can be derived that older LCA results overestimated the environmental impact of cell production for current batteries from plants with high utilization, but for batteries in EVs from times with lower demand and without the integration of local renewable energy sources in the cell production process, the values seem plausible.
Assessing the influence of different electricity mixes assumed in LCAs on the GHG emissions for cell manufacturing is difficult across different studies. The assessed difference depends on the amount of electricity needed and the electricity share. The higher the amount of electricity in the cell production process, the higher the influence of different electricity mixes [9]. Otherwise, results can vary significantly for the same electricity mix, due to different energy demands and electricity shares assumptions in different studies. For instance, LCAs using the exact same electricity mix from Ellingsen et al. [8] calculate different results for the GHG emissions of the battery manufacturing process, due to variations in the electricity demand [13,25]. Overall, electricity mixes with less fossil fuel shares (especially coal), such as in the US and Europe, led to lower GHG emissions for battery manufacturing than in regions with high coal shares in the electricity grid, like China.
Nevertheless, a production process, solely using electricity, was assessed by Ellingsen et al. [8]. The impact of the local electricity mix for the cell manufacturing process could have been overestimated, while the impact on material processing steps is possible more relevant when higher electricity uses for those processes are considered. The results of Hao et al. [34] also indicate that the local electricity mix could be a significant contributor to material processing emissions.

3.4.5. Battery Production Impact per km for EV Use

Depending on the battery production emissions, the battery lifetime, and the capacity of the battery pack, the environmental impact of EV batteries can vary significantly. To allocate the environmental burden of battery production (excluding possible recycling) towards the use phase of an EV, a conversion to the impact per driven km is done.
To assess differences and influences of those impacts per km driven for GHG emissions, the Q25, median, and Q75 results from the review are used for the battery capacity, the battery lifetime (km), and the GHG emissions of battery production.
Table 3 shows the assessment of the GHG emissions per km driven for the battery production alone, without the impacts from the production of the EV (apart from the battery) and electricity required for the use phase. It shows that smaller battery packs, lower GHG emissions for battery production, and a longer battery lifetime reduce the amount of GHG emissions per km driven significantly. The values show the influence of variations in battery production GHG emissions, the battery lifetime, and the battery capacity.
Taking the calculated median values from the literature review for the battery capacity (30 kWh) and battery lifetime (180,000 km) combined with the median value for the GHG emissions (120 kg CO2-eq/kWh), the impacts of the battery production results in 20 g CO2-eq/km for the operation of the EV.
The results shown above are for battery production only. The use phase and the electricity mix for charging add further environmental impacts for the operation of an EV. Therefore, the life cycle GHG emissions of an EV compared to an ICV depends inter alia highly on the assumed aspects for battery production.

3.5. Environmental Impact of Battery Recycling

3.5.1. Major Environmental Contributors to Recycling

Only 16 out of the 50 publications include the recycling life cycle step in the research. This can generally be explained, due to a lack of inventory data for recycling. Overall, LCAs considering recycling mention metals as the most important materials for recycling. Specifically, recycling of cathode materials like cobalt and nickel [5,15,18,22,42] or aluminum [5,14,18] for the current collector and the battery case, are emphasized as having major environmental benefits. The major environmental benefits from recycling are in alignment with the major impacts of production. The extraction of recycled material can lower the environmental impact by substituting primary material.

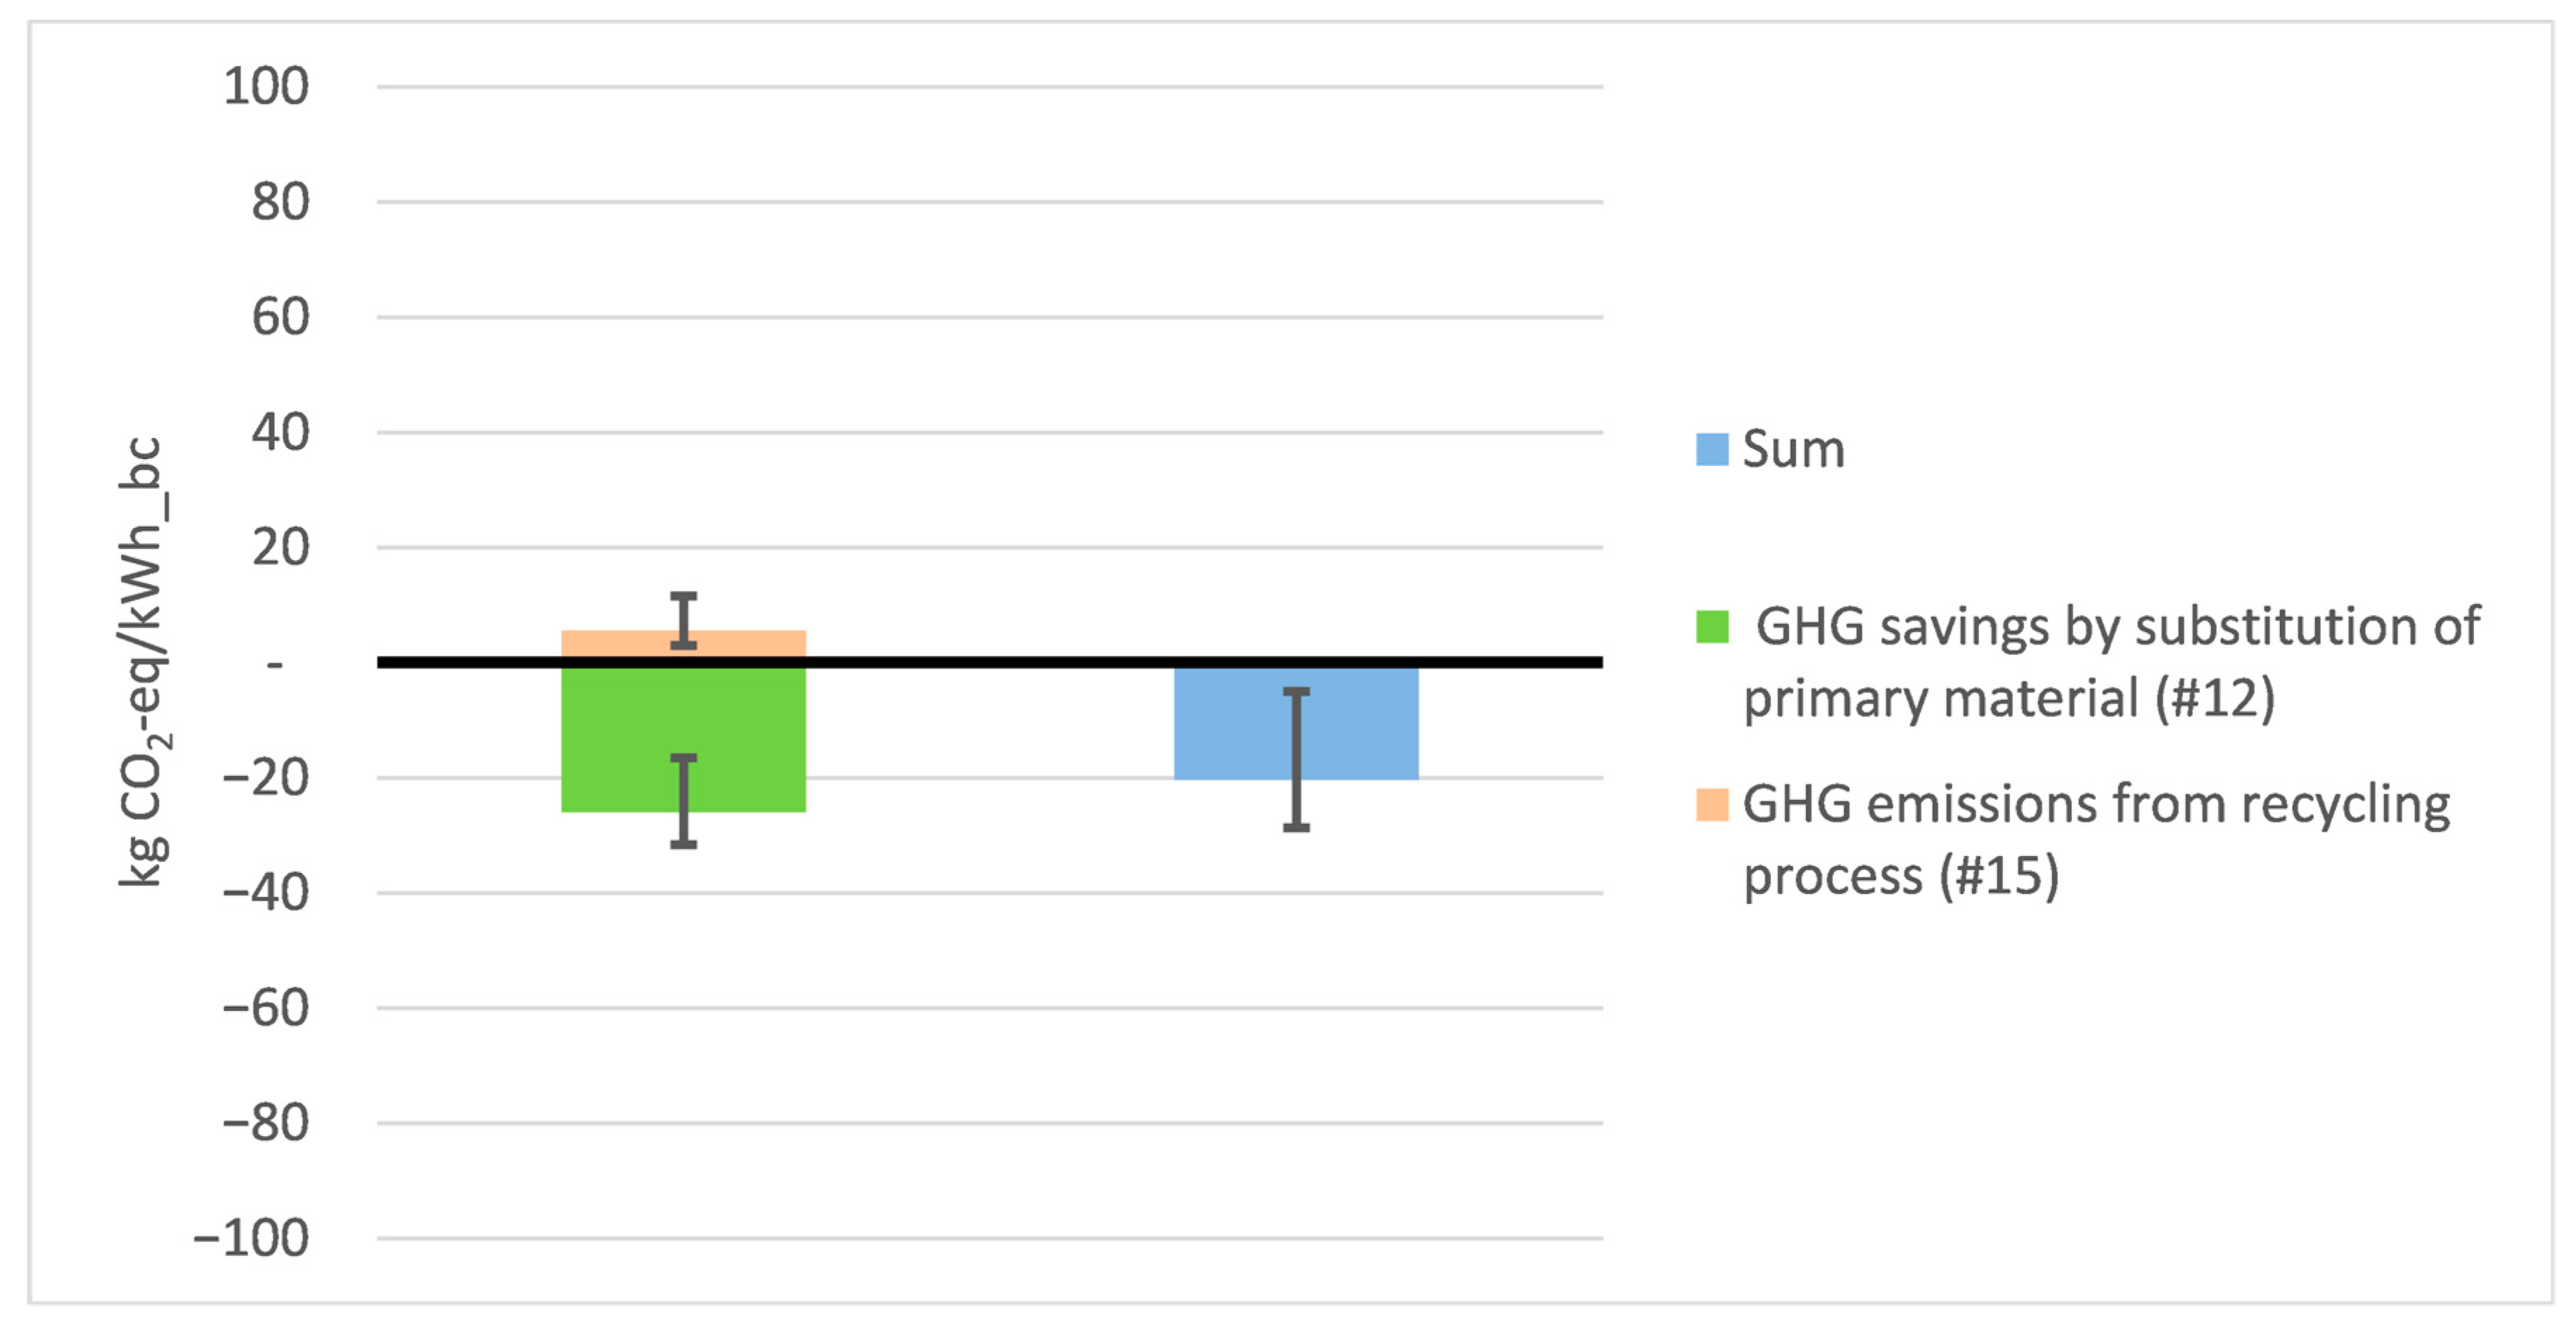
3.5.2. Numerical Results for Recycling/Reuse

Compared to battery production, data for the end-of-life treatment of EV batteries are limited, and the life cycle process is often neglected in LCAs. Only one study [24] describes battery reuse for other applications, like as a storage device for renewable energy sources after the use in an EV. Neubauer et al. [65] describe that discarded EV batteries still provide 70% of their initial capacity after 15 years of service, which could then be extended by 10 years in good conditions. As the best-extended life use, the study states peak-shaving services to replace peak load power plants, as fewer charge cycles per day (less than one) and longer discharge durations compared to the use in electric vehicles, could extend the reuse lifespan. Many LCAs only discuss the second-life of batteries superficially and do not include numerical results. The extension of the battery lifespan should be assessed and included in LCAs.
Summarizing the investigated recycling methods, LCAs usually assess the pyrometallurgical option (14 LCAs) and the hydrometallurgical option (18 LCAs), while investigating direct recycling options less (4 LCAs). Gaines [66] describes the three recycling options as follows. Pyrometallurgy is a high-temperature smelting process to reduce metals like cobalt and nickel from oxides to metals and is currently the common process for Li-ion battery recycling. However, the energy demand is high, and mostly only nickel and cobalt are recovered, while additional processes to recover other metals are needed. Hydrometallurgy uses acids after shredding the battery cells and can recover a higher amount of materials. The direct recycling approach is still in a lab-scale phase and tries to extract the cathode of a battery without breaking down the chemical structure. This would enable higher economic value for the extracted cathode, but use in future batteries with changed cathode chemistries could impede the implementation of this process.
Only 17 LCAs considered the use of materials recovered from battery recycling in battery production. More research is required in this area, and more primary data from battery recyclers should be gathered, and numerical results calculated. Numerical data are very limited for the recycling of EV batteries, and a split into single battery components is not possible. As in the case of battery production, there are more data on primary energy demand and the GHG emissions compared to other impact categories. Furthermore, studies often only state the recycling savings for battery production without specifying the negative environmental impact of the recycling process.
As shown in Figure 8, a median recycling benefit of about 20 kg CO2-eq/kWh_bc can be achieved when comparing the GHG emissions savings and impact of recycling to the environmental impact of virgin materials in battery production. Overall, battery recycling has GHG emissions savings, despite a wide range of results. In one study, the impacts of recycling using pyrometallurgy are assumed to be higher than the savings, while hydrometallurgy performs better [11]. Nevertheless, pyrometallurgy seems not to be useful for future large-scale battery recycling processes of electric vehicles. Savings from direct recovery could be the most significant due to using a low-temperature process and direct recovering of the cathode [5]. This avoids the need for material processing when used again in the battery production for recyclable metals like aluminum, steel, nickel, cobalt, and copper. However, the large scale application of this process remains uncertain.
According to Dai et al. [9], the recycling of the cathode material and aluminum seems to be significant for reducing the environmental impacts of EV batteries. Especially when considering the significant environmental impact difference between primary and secondary aluminum, like in GREET 2019. However, after extracting pack components like the battery case or BMS, which are sent to conventional recycling routes, recycling of battery cells is driven by the economic value of the cathode, meaning especially the extraction of cobalt and nickel, while for cells without such materials like LFP cells, extraction of materials is often not done [11,66]. When materials are extracted, they either have to be processed up to battery-grade again for use in new batteries, lowering the overall environmental benefit, or they are used in other applications that do not demand materials of high purity [11]. For example, in the case of aluminum, Dai et al. [9] assume a recycled content of 11% used in battery production, but they note that all of the used aluminum could also be virgin material as the recycled material may not meet the necessary specifications for new batteries. Nevertheless, in an environmental context, recycling is useful when sufficient recycled material is extracted, replacing either virgin materials in other processes or also at least in a small processed up proportion in new batteries. Recycling should be included and further researched in LCAs. Studies should investigate further impact categories, as, for example, considerable eutrophication impacts are possible when solvents like in hydrometallurgical processes are used [23].

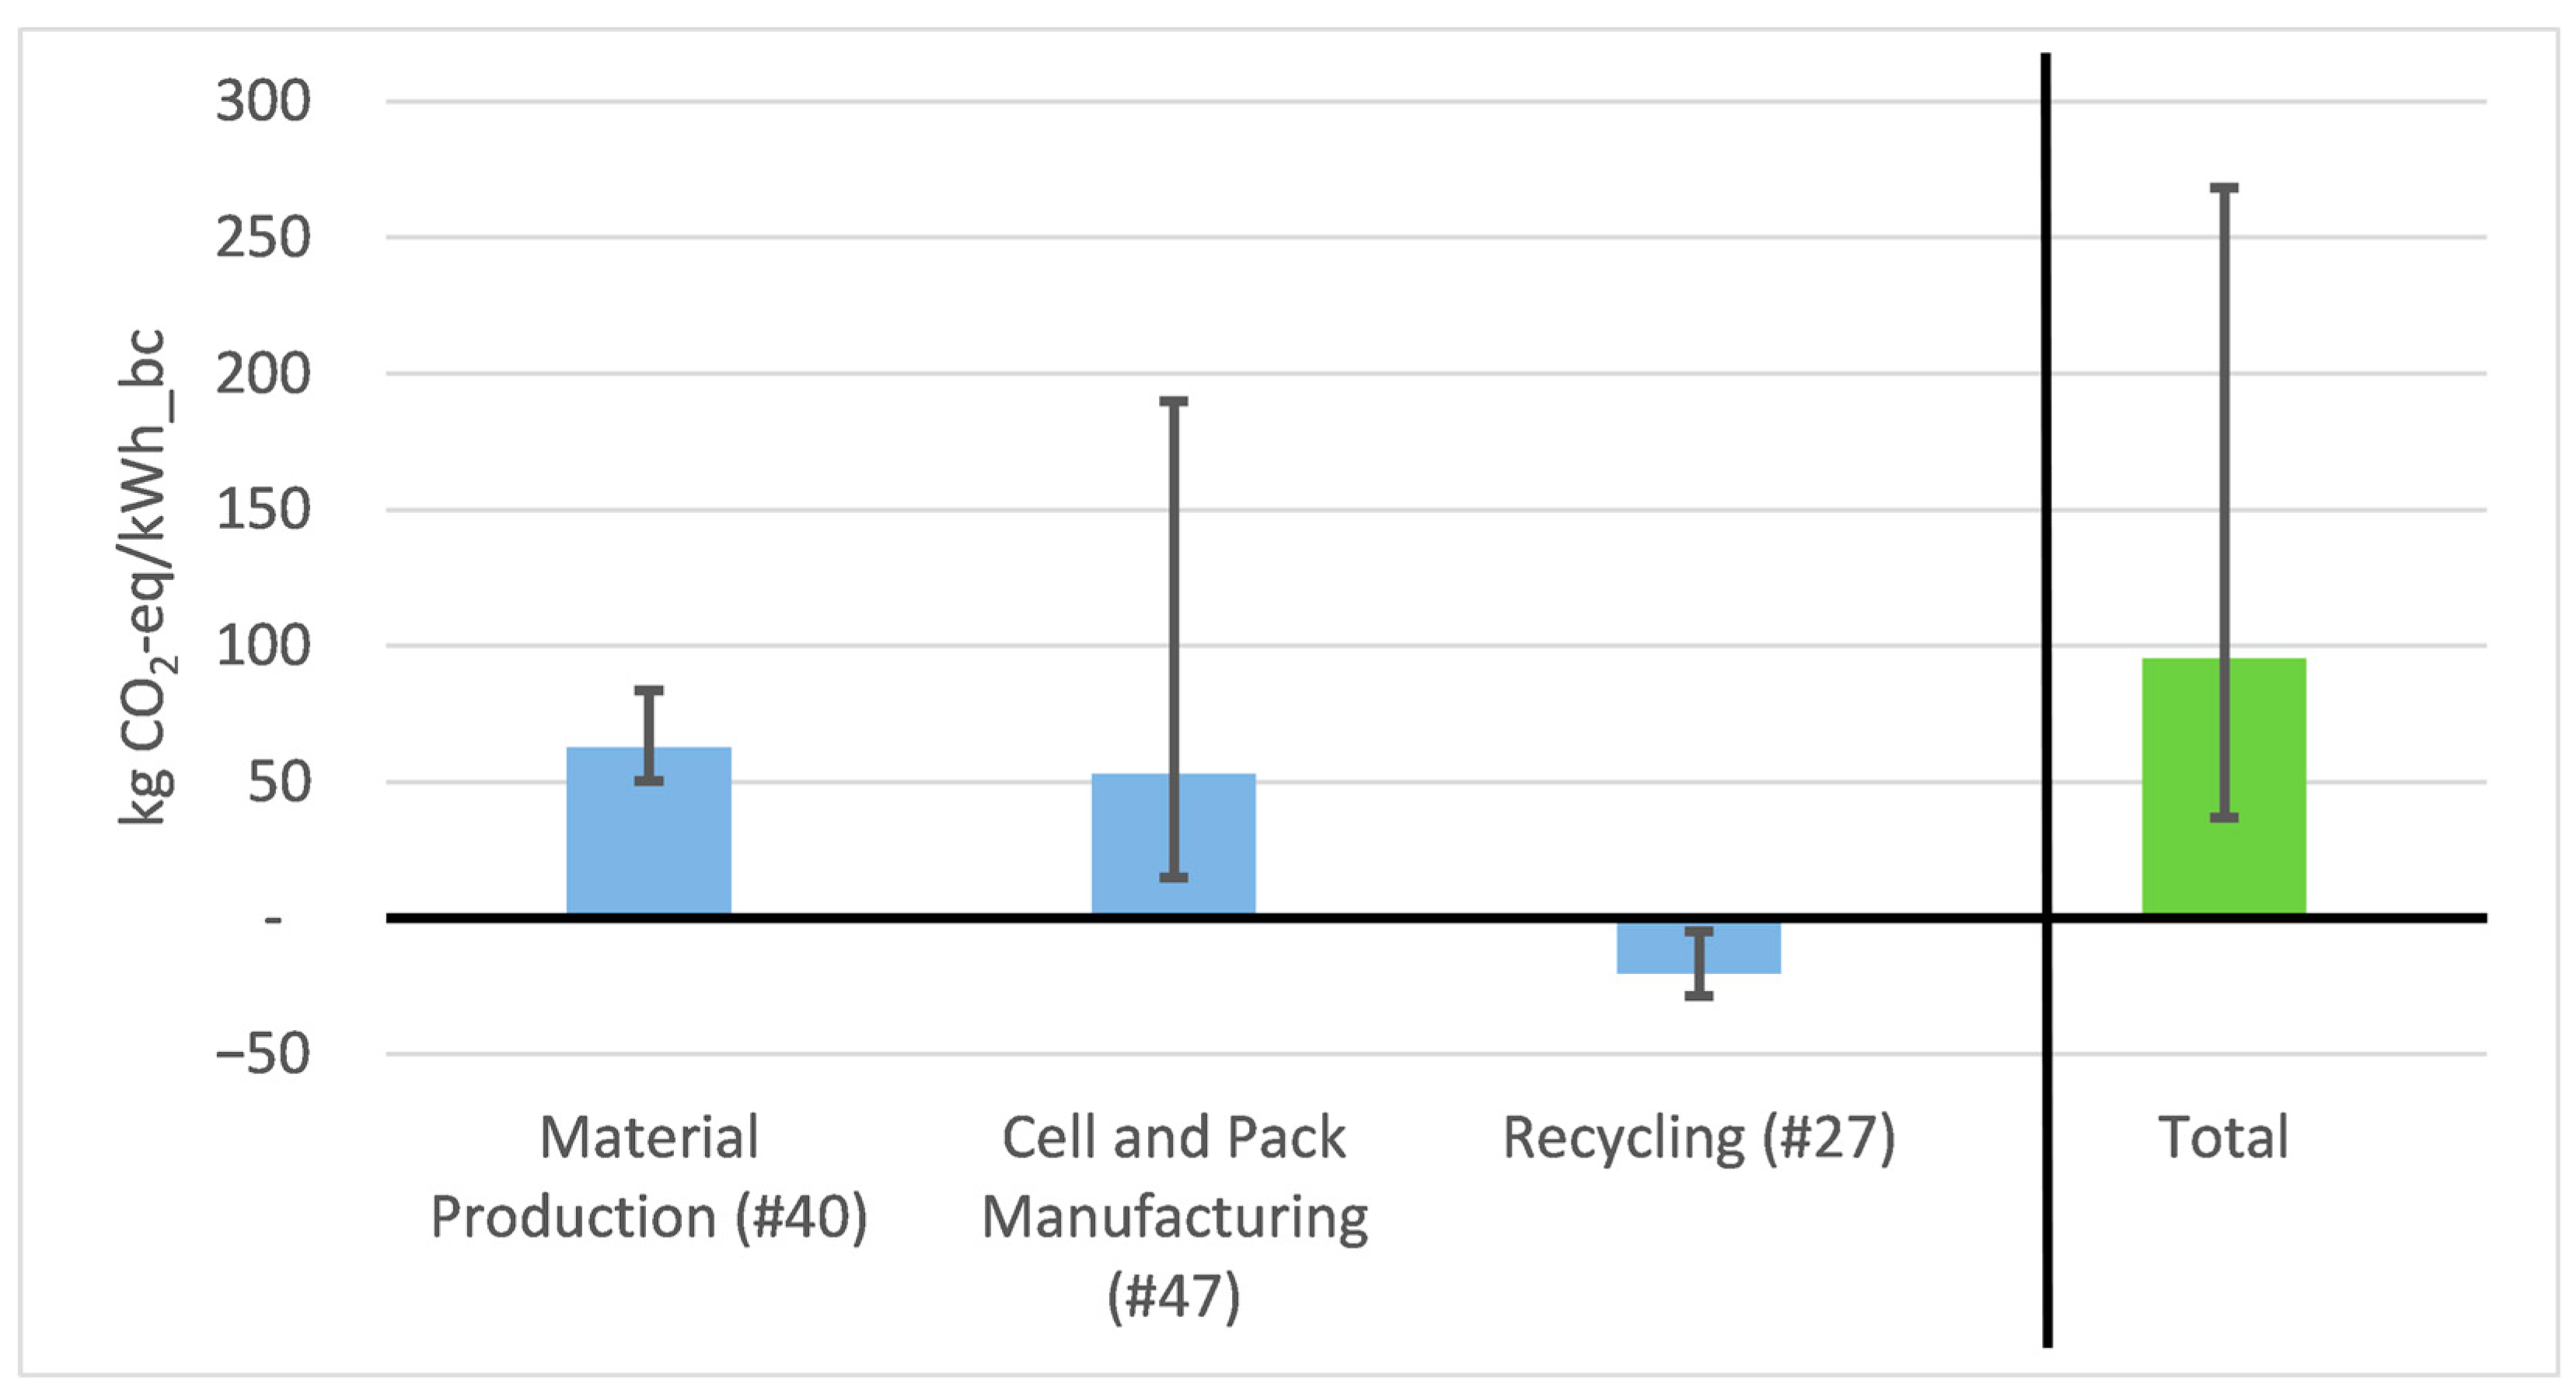
3.6. Total Numerical Results for the Battery Life Cycle

Overall, as visible in Figure 9, the high variation of GHG emissions resulted from different sized and partially underutilized production facilities, and the majority of variation comes from the cell manufacturing process. On the other hand, differences in material production at different locations with different energy mixes, are, in most cases, neglected. We expect that results for the overall GHG emissions of production of current batteries lie between the Q25%-quantile and the median, depending on the production location and utilized energy sources. The reduction of GHG emissions, due to recycling and the substitution of primary materials, is also often not included in results, although the influence is visible. It is especially important when considering energy-intensive primary materials like aluminum from production locations with high coal power share. Extrapolating the results of the review to the future, the impact of battery materials will gain further focus, while the impacts from cell manufacturing will be getting smaller and less significant, due to larger and more efficient production facilities at an industrial scale.

3.7. Other Impact Categories

3.7.1. Introduction

Thus far, the focus was on the primary energy demand and GHG emissions. However, other environmental impacts should also receive consideration. While data are limited for those, there are still quantitative results for the total battery pack available in the literature (Table A2 in Appendix A) and sources of origin for those impacts emphasized. In the following, further impact categories and the associated units are described when it is not otherwise stated, based on a description from the U.S. Environmental Protection Agency (EPA) [1].

3.7.2. Resource Depletion

This category is used to quantify the quantities of abiotic resources, fossil fuels, and minerals required by the process. For minerals, the metric is based on antimony (Sb) equivalents (ADP = abiotic resource depletion), or split in the parts fossil fuels (FDP = Fuel depletion potential, based on oil equivalents), metals (MDP = metal depletion potential, based on iron equivalents) or water depletion in m3. Depletion not only states the total amount of resources used but also compares the total use with the still available reserve resources, to state the overall reduction in the availability of the resources for the future. The depletion of resources has global, regional, and local effects and depends, for example, on the material amounts in the battery and the used fossil fuels in the battery production.

3.7.3. Acidification

Acidification has regional and local impacts and is calculated from the emissions of sulfur oxides (SOx), nitrogen oxides (NOx), hydrochloric acid (HCL), hydrofluoric acid (HF), or ammonium (NH4). For the overall acidification potential (AP), H+ ion molecules are used as an equivalent, as acids extrude those in solutions, and therefore, indicate the number of acids [67]. For a terrestrial acidification potential (TAP), sulfur dioxide (SO2) equivalents are relevant. The electricity mix and fossil fuels in battery production, including SOx or NOx emissions from coal power plants, whose amount depends on installed flue gas cleaning systems, is inter alia relevant to the acidification potential [36]. Moreover, nickel production can have serious SO2 impacts [9]. Acidification can lead, for example, to corrosion on buildings and has negative impacts on regional or local water, vegetation, and soil.

3.7.4. Ecotoxicity

Ecotoxicity has local impacts on organisms and is split into freshwater aquatic ecotoxicity (FWAE), marine aquatic ecotoxicity (MAE), and terrestrial ecotoxicity (TE). Ecotoxicity is stated with the kg equivalent of 1,4-Dichlorobenzene (1,4-DB), which is a solid used in insecticides and germicides and has toxic effects on organisms [68]. Terrestrial ecotoxicity leads to decreased biodiversity and wildlife, while aquatic ecotoxicity reduces the number of aquatic organisms and biodiversity. Toxicity can be significant in battery production, due to the use of metals, especially nickel and cobalt, while in the manufacturing process, its energy demand, and used electricity mix are less relevant [36].

3.7.5. Eutrophication

Eutrophication describes the accumulation of nutrients like phosphorus and nitrogen in soil or water bodies, which, on a local scale, causes increased growth of algae and leads to oxygen depletion and decreased fish stocks. Eutrophication is split into an overall eutrophication potential (EP) or a distinction of freshwater eutrophication potential (FEP), marine eutrophication potential (MEP), and terrestrial eutrophication potential (TETP). Eutrophication is stated in phosphorus or nitrogen equivalents. Emissions contributing to eutrophication are phosphate (PO4), nitrogen monoxide (NO), nitrogen dioxide (NO2), nitrates (NO3−), and ammonia (NH3) and can be generated, like for acidification, by coal-burning power plants delivering electricity used in the battery manufacturing.

3.7.6. Human Toxicity

The human toxicity potential (HTP) describes the negative impacts on humans. It uses the same equivalent unit based on 1,4-DB, as ecotoxicity, and high HTP may result in increased morbidity and mortality. As for ecotoxicity, the use of metals in batteries can be a significant contributor [36].

3.7.7. Ozone Depletion

The ozone depletion potential (ODP) has a global effect and leads to increased ultraviolet radiation. The depletion of the stratospheric ozone layer is associated with the emissions of CFCs, HCFCs, CH3Br, and halons, which are converted to an equivalent value of trichlorofluoromethane (CFC-11). It depends highly on the assessed electricity grid for battery production and the production of aluminum [42].

3.7.8. Air Pollutants

Air pollutants like SOx, NOx, or particulate matter (PM) are often not directly assessed in LCAs but incorporated in other impact categories like acidification. In the case of PM, particulate matter formation potentials (PMFP) for PM smaller than 10 micrometers (μm) or 2.5 μm are assessed. These include not only primary generated PM, but also secondary generated PM from the precursors NOx, SO2, and NH3 by photochemical reactions in the atmosphere [69]. The used electricity mix for battery production and associated flue gases from power plants are relevant factors for this category.

3.7.9. Photochemical Ozone

The photochemical ozone formation potential (POFP) describes the formation of tropospheric ozone on the ground level, which is stated as the non-methane volatile organic compounds (NMVOC) emissions. In contrast to stratospheric ozone, tropospheric ozone, formed by the oxidation of hydrocarbons (inter alia NMVOC) and NOx, due to sunlight exposure, is a greenhouse gas and air pollutant and leads to urban smog [70]. Sources are, for example, fossil fuel combustion processes for battery manufacturing, or oil refineries.

3.7.10. Numerical Results per Impact Category from the Literature Review

As data are limited, and studies use various impact assessment approaches, the evaluation is difficult. A split per battery component or per production stage, is in most cases not possible, due to missing data. The battery type and the choice of materials, modeling of production processes, and used electricity mixes are all factors, which could influence the result. For example, Amarakoon et al. [42] find a negative value with a positive environmental influence for eutrophication, because the production plant for the steel in the battery case cleans process water used for the production from elements like PO4 and NH3. Dai et al. [9] and Kelly et al. [10] show a significant influence of nickel smelting on the battery’s SO2 emissions, depending on whether production plants convert the SO2 emissions to sulfuric acid like at production plants in China and Canada or not like at a production plant in Russia.
Reports like the abovementioned should be carried out for different impact categories and battery packs with different technological properties, production processes, and locations. As Peters et al. [36] state, impacts like toxicity could also be relevant. Overall, LCAs often neglect the different midpoint and endpoint impact categories.
Table A2 in Appendix A shows that results for each impact category vary between several orders of magnitude. However, the values for recycling and its benefits show that recycling is, in most cases, environmentally useful when assessing other impact categories apart from GHG emissions.

4. Recommendations and Conclusions

Various aspects have been identified that improve future LCAs from EV batteries. They are:
  • The inclusion of further impact categories besides the primary energy demand and GHG emissions
  • Inclusion and assessment of recycling and second-life applications
  • Inclusion of the battery lifetime in estimations based on cycle life and replacement from battery packs, if needed
  • Statement of the detailed material mass composition and the component mass composition of the battery pack
  • Statement of relevant technological specifications like battery type, capacity, weight, and specific energy of the battery pack
  • Statement of GHG emissions (total and per functional unit) for each relevant material like aluminum and the active material, as well as electricity mix GHG emissions
  • Usage and gathering of primary data from industrial-scale production plants and comparing different production processes
  • Reduction of dependence on few LCAs with primary data and increased critical reviews of data sources
  • Consideration of production scale and the shares of electricity and heat and by which energy source heat is provided
  • Assessment of material processing impacts and the influence of the electricity mix and different processes in more locations like for Chinese production
  • Performing of consequential LCAs to include indirect life cycle impacts and to compare the impacts of a higher amount of produced possibly larger batteries in various scenarios like a growing number of large BEVs or growing car sales
To conclude, the review of the literature shows that transparency in LCAs for EV batteries is sometimes lacking because of no clear statements regarding data sources for certain aspects or missing statements of values. Reporting the technical specifications of assessed batteries and disclosure of all data used for calculations and results should be mandatory for facilitating comparison with other studies. In addition, the reliance on secondary data should be reduced, while gathering more primary data from different battery production and recycling facilities.
Studies should also extend assessed aspects of the battery life cycle beyond the production impact assessment of one battery pack by including indirect environmental effects in consequential LCAs and assessing further questions. For example, an investigation would be useful on how a growing share of more and larger EVs could influence the environmental impacts of total battery production compared to the more efficient use of less and smaller electric vehicles.
The review demonstrates the major contributing aspects for the production and end-of-life life cycle steps of EV batteries. Top-down LCAs state, in many cases, cell manufacturing as the most contributing process to the primary energy demand and GHG emissions, while this aspect also shows the highest numerical results. However, it may not be as significant as reported. Bottom-up studies seem to underestimate cell manufacturing, due to leaving out important aspects of the process. Top-down studies seem to have overestimated the contribution of cell manufacturing to the environmental impact, due to assessments of production facilities with lower production scales and underutilization. Production scales, and therefore, the importance of an energy-efficient and cost-efficient manufacturing process will grow rapidly and will most likely further reduce the impacts per kWh of battery capacity produced to a certain degree.
Material emissions, like from mining, and especially processing, which LCAs could have underestimated, due to process-based assumptions with limited regionalized primary data, could gain importance. Current LCAs show no significant differences between material emissions of different battery packs with variations in battery chemistries. But differences could be more significant than assumed, due to underestimating material processing and the impact of different production locations. The cathode and metal uses in the battery pack (especially nickel and cobalt for NMC cathodes, aluminum, and steel) and the production location seems to be more significant than the cell manufacturing process. Primary industry data from various locations should be gained.
The lifetime of batteries could also influence results, but LCAs mainly design this aspect according to the vehicle lifetime, which could be an incorrect assumption. Furthermore, studies should consider second-life applications, as those are at most shortly described and could influence the environmental impacts significantly. Immediate recycling after the use in EVs seems to be not useful, considering the remaining capacities of battery packs.
LCAs should also include recycling and the assessment of different recycling methods, as they tend to neglect those aspects, which could affect the environmental performance of EV batteries significantly. A direct recycling approach could facilitate recycling processes by obtaining whole cathodes with higher market values. However, the use of old cathodes with possibly outdated chemistries in new batteries remains unclear, considering the possibly long lifespan of batteries. Recycling could nevertheless also gain further importance when primary material processing remains to grow in significance.
For both, production and recycling processes, studies should assess more in-depth further impact categories besides the primary energy consumption and GHG emissions per battery component and for different material uses, especially impacts on a more local scale like toxicity or acidification. Considering the increased importance of metal use in battery packs, recycling could show significant and growing positive effects in such categories.

Author Contributions

Conceptualization, G.J.; methodology, C.A., G.J.; investigation, C.A.; data curation, C.A.; writing, C.A.; supervision, G.J.; project administration, G.J.; All authors have read and agreed to the published version of the manuscript.

Funding

This research was funded by the Climate and Energy Fund and Austrian Research Promotion Agency (FFG), FFG grant number 865135, and was done in the IEA HEV Task 30 “Assessment of Environmental Effects of Electric Vehicles”.

Acknowledgments

We want to thank the colleagues from IEA HEV Task 30 "Assessment of Environmental Effects of Electric Vehicles" for discussion and harmonization of the LCA methodology applied for automotive batteries and for helping to collect and identify the relevant literature. We would also like to thank our colleague David Neil Bird for proofreading.

Conflicts of Interest

The authors declare no conflict of interest.

Appendix A

Table A1. Assessed literature in review.
No.TitleOrganization/AuthorsYear of Publication
1Application of Life-Cycle Assessment to Nanoscale Technology: Lithium-Ion Batteries for Electric Vehicles [42]EPA—United States Environmental Protection Agency; Amarakoon S., Smith J. and Segal B.2013
2Contribution of Li-Ion Batteries to the Environmental Impact of Electric Vehicles [4]Technology and Society Laboratory, Swiss Federal Laboratories for Materials Science and Technology; Notter D., Gauch M., Widmer R., Wager P., Stamp A., Zah R. and Althaus H.-J.2010
3The Life Cycle Energy Consumption and Greenhouse Gas Emissions from Lithium-Ion Batteries [11]IVL Swedish Environmental Research Institute; Romare M. and Dahllöf L.2017
4Update of Life Cycle Analysis of Lithium-ion Batteries in the GREET Model [43]Argonne National Laboratory; Dai Q., Dunn J., Kelly L.-C., and Elgowainy A.2017
5The size and range effect: lifecycle greenhouse gas emissions of electric vehicles [13]Norwegian University of Science and Technology; Ellingsen L., Singh B. and Strømman A.2016
6Comparative Study on Life Cycle CO2 Emissions from the Production of Electric and Conventional Vehicles in China [14]Tsinghua University; Qiao Q., Zhao F., Liu Z., Jiang S. and Hao H.2017
7Life Cycle Analysis Summary for Automotive Lithium-Ion Battery Production and Recycling [15]Argonne National Laboratory; Dunn J., Gaines L., Kelly J. and Gallagher K.2016
8Plug-in vs. wireless charging: Life cycle energy and greenhouse gas emissions for an electric bus system [16]University of Michigan; Bi Z., Song L., De Kleine R., Mi C. and Keoleian G.2015
9Electric vehicle life cycle analysis and raw material availability [17]Transport and Environment2017
10Lithium Ion Battery Recycling Technology 2015—Current State and Future Prospects [44]Chalmers University of Technology; Kushnir D.2015
11Impact of recycling on energy consumption and greenhouse gas emissions from electric vehicle production: The China 2025 case [18]Tsinghua University; Hao H., Qiao Q., Liu Z. and Zhao F.2017
12Comparison of the Environmental impact of five Electric Vehicle Battery technologies using LCA [19]Vrije Universiteit Brussel, Université Libre de Bruxelles, Erasmus Hogeschool Brussel; Matheys J., Timmermans J.-M., Van Autenboer W., Van Mierlo J., Maggetto G., Meyer S., De Groof A., Hecq W. and Van den Bossche P.2009
13Cleaner Cars from Cradle to Grave—How Electric Cars Beat Gasoline Cars on Lifetime Global Warming Emissions [20]Union of Concerned Scientists; Nealer R., Reichmuth D. and Anair D.2015
14Ökobilanzierung der Elektromobilität—Themen und Stand der Forschung [21]Modellregionen Elektromobilität, Wuppertal Institut für Klima, Umwelt, Energie GmbH; Ritthoff M. and Schallaböck K.2012
15Lithium-Ion Battery Production and Recycling Materials Issues (Presentation) [22]Argonne National Laboratory; Gaines L. and Dunn J.2015
16Research for TRAN Committee—Battery-powered electric vehicles: market development and lifecycle emissions—Part 2—Resources, energy, and lifecycle greenhouse gas emission aspects of electric vehicles [23]European Parliament; Directorate-General for Internal Policies; Policy Department B.: Structural and Cohesion Policies; Committee on Transport and Tourism; Thomas M. Ellingsen L. and Hung, C.2018
17Effects of battery manufacturing on electric vehicle life-cycle greenhouse gas emissions [24]icct—The International Council on Clean Transportation; Lutsey N. and Hall D.2018
18Aktualisierung Umweltaspekte von Elektroautos [25]treeze—fair life cycle thinking, Frischknecht R., Messmer A. and Stolz P.2018
19Klimabilanz von Elektroautos—Einflussfaktoren und Verbesserungspotenzial [26]Agora Verkehrswende, ifeu—Institut für Energie- und Umweltforschung; Helms H., Kämper C., Biemann K., Lambrecht U., Jöhrens J. and Meyer K.2019
20Techno-economic and environmental assessment of stationary electricity storage technologies for different time scales [27]Lucerne University of Applied Sciences and Arts, Paul Scherrer Institute, University of Geneva; Abdon A., Zhang X., Parra D., Patel M., Bauer C. and Worlitschek J.2017
21Ökologische und ökonomische Performance stationärer Li-Ion-Batteriespeicher [28]Karlsruher Institut für Technologie, Baumann M., Peters J. and Weil M.2018
22Providing a common base for life cycle assessments of Li-Ion batteries [29]Helmholtz Institute Ulm (HIU), ITAS—Institute for Technology Assessment and Systems Analysis, Karlsruhe Institute of Technology (KIT); Peters J. and Weil M.2018
23Life cycle assessment of lithium-ion batteries for plug-in hybrid electric vehicles—Critical issues [6]Swerea IVF AB; Zackrisson M., Avellan L. and Orlenius J.2010
24Environmental consequences of the use of batteries in low carbon systems: The impact of battery production [30]University of Bath; McManus M.C.2012
25Environmental performance of electricity storage systems for grid applications, a life cycle approach [31]Vrije Universiteit Brussel, Laborelec; Oliveira L., Messagie M., Mertens J., Laget H., Coosemans T. and Van Mierlo J.2015
26Energy analysis of batteries in photovoltaic systems. Part I: Performance and energy requirements [32]University of Kalmer, Chalmers University of Technology; Rydh C. and Sandén B.2005
27Power-to-What?—Environmental assessment of energy storage systems [33]RWTH Aachen University; Sternberg A. and Bardow A.2015
28Environmental impacts of Lithium Metal Polymer and Lithium-ion stationary batteries [45]Université de Sherbrooke, Institut de recherche d’Hydro-Québec; Vandepaer L., Cloutier J. and Amor B.2017
29Life Cycle Assessment of a Lithium-Ion Battery Vehicle Pack [8]Norwegian University of Science and Technology, CIRAIG, Tel-Tek; Ellingsen L., Majeau-Bettez G., Singh B., Srivastva A, Valøen L. and Strømman H.2014
30Cradle-to-Gate Emissions from a Commercial Electric Vehicle Li-Ion Battery: A Comparative Analysis [46]Ford Motor Company, LG Chem Research Park; Kim H., Wallington T., Arsenault R., Bae C., Ahn S. and Lee J.2016
31Manufacturing energy analysis of lithium ion battery pack for electric vehicles [47]Case Western Reserve University, University of Wisconsin; Yuan C., Deng Y., Li T. and Yang F.2017
32Life Cycle Analysis of Lithium-Ion Batteries for Automotive Applications [9]Argonne National Laboratory; Dai Q., Kelly J., Gaines L. and Wang M.2019
33Eco-Efficiency of a Lithium-Ion Battery for Electric Vehicles: Influence of Manufacturing Country and Commodity Prices on GHG Emissions and Costs [48]Vrije Universiteit Brussel, Flanders Make, CIDETEC; Philippot M., Alvarez G., Ayerbe E., Van Mierlo J. and Messagie M.2019
34GHG Emissions from the Production of Lithium-Ion Batteries for Electric Vehicles in China [34]Tsinghua University; Hao H., Mu Z., Jiang S., Liu Z. and Zhao F.2017
35Quantifying the environmental impact of a Li-rich high-capacity cathode material in electric vehicles via life cycle assessment [49]Beijing Institute of Technology, Beijing Forestry University; Wang Y., Yu Y., Huang K., Chen B., Deng W. and Yao Y.2017
36Comparative life cycle assessment of lithium-ion batteries with lithium metal, silicon nanowire, and graphite anodes [35]Peking University Shenzhen Graduate School; Wu Z. and Kong D.2018
37Life Cycle Environmental Assessment of Lithium-Ion and Nickel Metal Hydride Batteries for Plug-In Hybrid and Battery Electric Vehicles [7]Norwegian University of Science and Technology; Majeau-Bettez G., Hawkins T. and Strømman A.2011
38Impact of Recycling on Cradle-to-Gate Energy Consumption and Greenhouse Gas Emissions of Automotive Lithium-Ion Batteries [5]Argonne National Laboratory; Dunn J., Gaines L., Sullivan J. and Wang M.2012
39The environmental impact of Li-Ion batteries and the role of key parameters—A review [36]Karlsruhe Institute for Technology; Peters J., Baumann M., Zimmermann B., Braun J. and Weil M.2017
40Identifying key assumptions and differences in life cycle assessment studies of lithium-ion traction batteries with focus on greenhouse gas emissions [37]Norwegian University of Science and Technology; Ellingsen L., Hung C. and Strømman A.2017
41Life cycle assessment of lithium sulfur battery for electric vehicles [50]Soochow University, University of Wisconsin, Case Western Reserve University; Deng Y., Li J., Li T., Gao X. and Yuan C.2017
42Life cycle assessment of future electric and hybrid vehicles: A cradle-to-grave systems engineering approach [38]University College London, Università di Salerno; Tagliaferri C., Evangelisti S., Acconia F., Domenech T., Ekins P., Barletta D. and Lettieri P.2016
43Effects of battery chemistry and performance on the life cycle greenhouse gas intensity of electric mobility [39]University of California; Ambrose H. and Kendall A.2016
44Comparative environmental assessment of alternative fueled vehicles using a life cycle assessment [40]Vrije Universiteit Brussel; Van Mierlo J., Messagie M. and Rangaraju S.2017
45Energy and environmental assessment of a traction lithium-ion battery pack for plug-in hybrid electric vehicles [51]University of Palermo, European Commission, Politecnico di Torino; Cusenza M., Bobba S., Ardente F., Cellura M. and Di Persio F.2019
46Prospective LCA of the production and EoL recycling of a novel type of Li-ion battery for electric vehicles [52]Oxford Brookes University; Raugei M. and Winfield P.2019
47PEFCR—Product Environmental Footprint Category Rules for High Specific Energy Rechargeable Batteries for Mobile Applications [53]Recharge; Siret C., Tytgat J., Ebert T., Mistry M., Thirlaway C., Schutz B., Xhantopoulos D., Wiaux J.-P., Chanson C., Tomboy W., Pettit C., Gediga J., Bonell M., Carrillo V.2018
48Preparatory Study on Ecodesign and Energy Labelling of Batteries under FWC ENER/C3/2015-619-Lot 1 [54]European Union, VITO, Fraunhofer, Viegand Maagøe; Lam W.C., Peeters K., Tichelen P. V.2019
49Globally regional life cycle analysis of automotive lithium-ion nickel manganese cobalt batteries [10]Argonne National Laboratory; Kelly J., Dai Q., Wang M.2020
50Lithium-Ion Vehicle Battery Production—Status 2019 on Energy Use, CO2 Emissions, Use of Metals, Products Environmental Footprint, and Recycling [12]IVL Swedish Environmental Research Institute; Emilsson E., Dahllöf L.2019
Table A2. Numerical results for various impact categories in LCAs (results based on 25%-quantile, median and 75%-quantile).
Battery ProductionRecycling ImpactReduction Potential
Per kWh_bcQ25Q50Q75Q25Q50Q75Q25Q50Q75
EnergyPrimary energy demandkWh1.98 × 1022.84 × 1025.19 × 1026.68 × 1017.64 × 1017.75 × 101−5.83 × 101−9.04 × 101−1.00 × 10²
Global warmingGWPkg CO2-eq7.06 × 1011.20 × 1021.75 × 1022.935.651.15 × 101−1.65 × 101−2.60 × 101−3.16 × 101
Resource depletionADPkg Sb-eq4.86 × 1025.93 × 1024.22 × 1018.14 × 1058.16 × 1058.20 × 105−1.12 × 10³−4.73 × 10²−1.19 × 101
Water depletionm32.37 × 1015.62 × 1015.70 × 101n.d.n.d.n.d.n.d.n.d.n.d.
FDPkg oil-eq4.02 × 1015.08 × 1016.89 × 101n.d.1.99n.d.n.d.n.d.n.d.
MDPkg Fe-eq9.10 × 1019.99 × 1011.51 × 102n.d.2.17 × 101n.d.n.d.n.d.n.d.
AcidificationAPkg H+ Mol-eq1.502.334.418.60 × 1028.63 × 1028.70 × 102−5.54 × 101−5.55 × 101−3.73
TAPkg SO2-eq1.772.032.65n.d.5.42 × 102n.d.n.d.n.d.n.d.
EcotoxicityFWAEkg 1,4-DB-eq8.489.619.91n.d.1.59 × 101n.d.n.d.n.d.n.d.
MAEkg 1,4-DB-eq9.421.04 × 1011.07 × 101n.d.1.46 × 101n.d.n.d.n.d.n.d.
TEkg 1,4-DB-eq4.45 × 1024.95 × 1025.15 × 102n.d.1.18 × 102n.d.n.d.n.d.n.d.
EutrophicationEPkg N-eq9.26 × 1038.21 × 1022.08 × 101n.d.n.d.n.d.−1.91 × 10³−9.80 × 10³−4.86 × 10²
MEPkg N-eq1.37 × 1012.41 × 1013.00 × 1019.71 × 1031.25 × 1021.26 × 102−1.67 × 101−1.67 × 101−1.67 × 101
TETPmole N-eq1.232.124.961.11 × 1011.12 × 1011.13 × 101−4.39 × 101−4.39 × 101−4.40 × 101
FEPkg P-eq1.60 × 1011.83 × 1012.95 × 1019.06 × 1031.06 × 1021.06 × 102−2.03 × 10²−3.69 × 10²−3.70 × 10²
Human toxicityHTPkg 1,4-DB-eq1.53 × 1022.50 × 1023.82 × 102n.d.4.01n.d.n.d.n.d.n.d.
OzoneODPkg CFC 11-eq1.10 × 1051.16 × 1041.07 × 1032.83 × 1063.62 × 1063.62 × 106−1.25 × 10⁶−2.21 × 10⁶−2.23 × 10⁶
Air pollutantsPMFP (2.5)kg PM2.5-eq1.39 × 1011.62 × 1011.99 × 1011.18 × 1021.18 × 1021.18 × 102−4.40 × 10²−4.41 × 10²−4.40 × 10²
PMFP (10)kg PM10-eq4.57 × 1015.85 × 1018.13 × 101n.d.1.50 × 102n.d.n.d.n.d.n.d.
SOxg8.30 × 1029.60 × 1021.20 × 103n.d.n.d.n.d.n.d.n.d.n.d.
NOxg1.00 × 1021.10 × 1021.20 × 102n.d.n.d.n.d.n.d.n.d.n.d.
PM10g8.03 × 1011.13 × 1021.45 × 102n.d.n.d.n.d.n.d.n.d.n.d.
Photochemical ozonePOFPkg NMVOC6.41 × 1016.80 × 1019.91 × 1012.98 × 1023.20 × 1023.23 × 102−1.36 × 101−1.36 × 101−1.37 × 101

References

  1. U.S. Environmental Protection Agency (EPA). Life Cycle Assessment: Principles and Practice; US Environmental Protection Agency: Cincinnati, OH, USA, 2006.
  2. International Organization for Standardization (ISO). ISO 14040:2006. Available online: https://www.iso.org/cms/render/live/en/sites/isoorg/contents/data/standard/03/74/37456.html (accessed on 8 July 2020).
  3. IEA. Global EV Outlook 2020; IEA: Paris, France, 2020. [Google Scholar]
  4. Notter, D.A.; Gauch, M.; Widmer, R.; Wäger, P.; Stamp, A.; Zah, R.; Althaus, H.-J. Contribution of Li-Ion Batteries to the Environmental Impact of Electric Vehicles. Environ. Sci. Technol. 2010, 44, 6550–6556. [Google Scholar] [CrossRef]
  5. Dunn, J.B.; Gaines, L.; Sullivan, J.; Wang, M.Q. Impact of Recycling on Cradle-to-Gate Energy Consumption and Greenhouse Gas Emissions of Automotive Lithium-Ion Batteries. Environ. Sci. Technol. 2012, 46, 12704–12710. [Google Scholar] [CrossRef]
  6. Zackrisson, M.; Avellán, L.; Orlenius, J. Life cycle assessment of lithium-ion batteries for plug-in hybrid electric vehicles—Critical issues. J. Clean. Prod. 2010, 18, 1519–1529. [Google Scholar] [CrossRef]
  7. Majeau-Bettez, G.; Hawkins, T.R.; Strømman, A.H. Life Cycle Environmental Assessment of Lithium-Ion and Nickel Metal Hydride Batteries for Plug-In Hybrid and Battery Electric Vehicles. Environ. Sci. Technol. 2011, 45, 4548–4554. [Google Scholar] [CrossRef] [PubMed]
  8. Ellingsen, L.A.-W.; Majeau-Bettez, G.; Singh, B.; Srivastava, A.K.; Valøen, L.O.; Strømman, A.H. Life Cycle Assessment of a Lithium-Ion Battery Vehicle Pack: LCA of a Li-Ion Battery Vehicle Pack. J. Ind. Ecol. 2014, 18, 113–124. [Google Scholar] [CrossRef] [Green Version]
  9. Dai, Q.; Kelly, J.C.; Gaines, L.; Wang, M. Life Cycle Analysis of Lithium-Ion Batteries for Automotive Applications. Batteries 2019, 5, 48. [Google Scholar] [CrossRef] [Green Version]
  10. Kelly, J.C.; Dai, Q.; Wang, M. Globally regional life cycle analysis of automotive lithium-ion nickel manganese cobalt batteries. Mitig. Adapt. Strateg. Glob. Change 2020, 25, 371–396. [Google Scholar] [CrossRef]
  11. Romare, M.; Dahllöf, L. The Life Cycle Energy Consumption and Greenhouse Gas Emissions from Lithium-Ion Batteries; IVL Swedish Environmental Research Institute: Stockholm, Sweden, 2017. [Google Scholar]
  12. Emilsson, E.; Dahllöf, L. Lithium-Ion Vehicle Battery Production Status 2019 on Energy Use, CO2 Emissions, Use of Metals, Products Environmental Footprint, and Recycling; IVL Swedish Environmental Research Institute: Stockholm, Sweden, 2019. [Google Scholar]
  13. Ellingsen, L.A.-W.; Singh, B.; Strømman, A.H. The size and range effect: Lifecycle greenhouse gas emissions of electric vehicles. Environ. Res. Lett. 2016, 11, 054010. [Google Scholar] [CrossRef]
  14. Qiao, Q.; Zhao, F.; Liu, Z.; Jiang, S.; Hao, H. Comparative Study on Life Cycle CO2 Emissions from the Production of Electric and Conventional Vehicles in China. Energy Procedia 2017, 105, 3584–3595. [Google Scholar] [CrossRef]
  15. Dunn, J.B.; Gaines, L.; Kelly, J.C.; Gallagher, K.G. Life Cycle Analysis Summary for Automotive Lithium-Ion Battery Production and Recycling. In REWAS 2016; Kirchain, R.E., Blanpain, B., Meskers, C., Olivetti, E., Apelian, D., Howarter, J., Kvithyld, A., Mishra, B., Neelameggham, N.R., Spangenberger, J., Eds.; Springer International Publishing: Cham, Switzerland, 2016; pp. 73–79. [Google Scholar] [CrossRef]
  16. Bi, Z.; Song, L.; De Kleine, R.; Mi, C.C.; Keoleian, G.A. Plug-in vs. wireless charging: Life cycle energy and greenhouse gas emissions for an electric bus system. Appl. Energy 2015, 146, 11–19. [Google Scholar] [CrossRef] [Green Version]
  17. Transport & Environment. Electric Vehicle Life Cycle Analysis and Raw Material Availability. Available online: https://www.transportenvironment.org/sites/te/files/publications/2017_10_EV_LCA_briefing_final.pdf (accessed on 7 July 2020).
  18. Hao, H.; Qiao, Q.; Liu, Z.; Zhao, F. Impact of recycling on energy consumption and greenhouse gas emissions from electric vehicle production: The China 2025 case. Resour. Conserv. Recycl. 2017, 122, 114–125. [Google Scholar] [CrossRef]
  19. Matheys, J.; Timmermans, J.M.; Van Mierlo, J.; Meyer, S.; Van den Bossche, P. Comparison of the environmental impact of five electric vehicle battery technologies using LCA. Int. J. Sustain. Manuf. 2009, 1, 318–329. [Google Scholar] [CrossRef]
  20. Nealer, R.; Reichmuth, D.; Anair, D. Cleaner Cars from Cradle to Grave; Union of Concerned Scientists: Cambridge, MA, USA, 2015. [Google Scholar]
  21. Ritthoff, M.; Schallaböck, K.O. Ökobilanzierung der Elektromobilität. Themen und Stand der Forschung. Teilbericht im Rahmen der Umweltbegleitforschung Elektromobilität im Förderschwerpunkt “Modellregionen Elektromobilität”; Wuppertal Institut für Klima, Umwelt, Energie GmbH: Wuppertal, Germany, 2012. [Google Scholar]
  22. Gaines, L.; Dunn, J. Lithium-Ion Battery Production and Recycling Materials Issues (Project ID: ES229). In Proceedings of the VTO Annual Merit Review, Lemont, IL, USA, 9 June 2015. [Google Scholar]
  23. Thomas, M.; Ellingsen, L.A.-W.; Hung, C.R.; European Parliament; Directorate-General for Internal Policies; Policy Department B.: Structural and Cohesion Policies; Committee on Transport and Tourism. Research for TRAN Committee—Battery-Powered Electric Vehicles: Market Development and Lifecycle Emissions: Study; European Union: Brussels, Belgium, 2018. [Google Scholar]
  24. Lutsey, N.; Hall, D. Effects of Battery Manufacturing on Electric Vehicle Life-Cycle Greenhouse Gas Emissions; The International Council on Clean Transportation: Washington, DC, USA, 2018. [Google Scholar]
  25. Frischknecht, R.; Messmer, A.; Stolz, P. Aktualisierung Umweltaspekte von Elektroautos. Ein Argumentarium; treeze: Uster, Switzerland, 2018. [Google Scholar]
  26. Helms, H.; Kämper, C.; Biemann, K.; Lambrecht, U.; Jöhrens, J.; Meyer, K. Klimabilanz von Elektroautos. Einflussfaktoren und Verbesserungspotenzial; Agora Verkehrswende and ifeu—Institut für Energie- und Umweltforschung Heidelberg GmbH: Berlin, Germany, 2019. [Google Scholar]
  27. Abdon, A.; Zhang, X.; Parra, D.; Patel, M.K.; Bauer, C.; Worlitschek, J. Techno-economic and environmental assessment of stationary electricity storage technologies for different time scales. Energy 2017, 139, 1173–1187. [Google Scholar] [CrossRef]
  28. Baumann, M.; Peters, J.; Weil, M. Ökologische und ökonomische Performance stationärer Li-Ion-Batteriespeicher. In Proceedings of the 15th Symposium Energy Innovation, Graz, Austria, 14–16 February 2018; Technische Universität Graz: Graz, Austria, 2018. [Google Scholar]
  29. Peters, J.F.; Weil, M. Providing a common base for life cycle assessments of Li-Ion batteries. J. Clean. Prod. 2018, 171, 704–713. [Google Scholar] [CrossRef]
  30. McManus, M.C. Environmental consequences of the use of batteries in low carbon systems: The impact of battery production. Appl. Energy 2012, 93, 288–295. [Google Scholar] [CrossRef] [Green Version]
  31. Oliveira, L.; Messagie, M.; Mertens, J.; Laget, H.; Coosemans, T.; Van Mierlo, J. Environmental performance of electricity storage systems for grid applications, a life cycle approach. Energy Convers. Manag. 2015, 101, 326–335. [Google Scholar] [CrossRef]
  32. Rydh, C.J.; Sandén, B.A. Energy analysis of batteries in photovoltaic systems. Part I: Performance and energy requirements. Energy Convers. Manag. 2005, 46, 1957–1979. [Google Scholar] [CrossRef]
  33. Sternberg, A.; Bardow, A. Power-to-What?—Environmental assessment of energy storage systems. Energy Environ. Sci. 2015, 8, 389–400. [Google Scholar] [CrossRef]
  34. Hao, H.; Mu, Z.; Jiang, S.; Liu, Z.; Zhao, F. GHG Emissions from the Production of Lithium-Ion Batteries for Electric Vehicles in China. Sustainability 2017, 9, 504. [Google Scholar] [CrossRef] [Green Version]
  35. Wu, Z.; Kong, D. Comparative life cycle assessment of lithium-ion batteries with lithium metal, silicon nanowire, and graphite anodes. Clean Technol. Environ. Policy 2018, 20, 1233–1244. [Google Scholar] [CrossRef]
  36. Peters, J.F.; Baumann, M.; Zimmermann, B.; Braun, J.; Weil, M. The environmental impact of Li-Ion batteries and the role of key parameters—A review. Renew. Sustain. Energy Rev. 2017, 67, 491–506. [Google Scholar] [CrossRef]
  37. Ellingsen, L.A.-W.; Hung, C.R.; Strømman, A.H. Identifying key assumptions and differences in life cycle assessment studies of lithium-ion traction batteries with focus on greenhouse gas emissions. Transp. Res. Part Transp. Environ. 2017, 55, 82–90. [Google Scholar] [CrossRef]
  38. Tagliaferri, C.; Evangelisti, S.; Acconcia, F.; Domenech, T.; Ekins, P.; Barletta, D.; Lettieri, P. Life cycle assessment of future electric and hybrid vehicles: A cradle-to-grave systems engineering approach. Chem. Eng. Res. Des. 2016, 112, 298–309. [Google Scholar] [CrossRef]
  39. Ambrose, H.; Kendall, A. Effects of battery chemistry and performance on the life cycle greenhouse gas intensity of electric mobility. Transp. Res. Part Transp. Environ. 2016, 47, 182–194. [Google Scholar] [CrossRef] [Green Version]
  40. Van Mierlo, J.; Messagie, M.; Rangaraju, S. Comparative environmental assessment of alternative fueled vehicles using a life cycle assessment. Transp. Res. Procedia 2017, 25, 3435–3445. [Google Scholar] [CrossRef]
  41. Temporelli, A.; Carvalho, M.L.; Girardi, P. Life Cycle Assessment of Electric Vehicle Batteries: An Overview of Recent Literature. Energies 2020, 13, 2864. [Google Scholar] [CrossRef]
  42. Amarakoon, S.; Smith, J.; Segal, B. Application of Life-Cycle Assessment to Nanoscale Technology: Lithium-ion Batteries for Electric Vehicles; US Environmental Protection Agency: Washington, DC, USA, 2013.
  43. Dai, Q.; Dunn, J.; Kelly, J.C.; Elgowainy, A. Update of Life Cycle Analysis of Lithium-ion Batteries in the GREET Model; Energy Systems Division, Argonne National Laboratory: Lemont, IL, USA, 2017.
  44. Kushnir, D. Lithium Ion Battery Recycling Technology 2015. Current State and Future Prospects; Environmental Systems Analysis. Chalmers University of Technology: Göteborg, Sweden, 2015. [Google Scholar]
  45. Vandepaer, L.; Cloutier, J.; Amor, B. Environmental impacts of Lithium Metal Polymer and Lithium-ion stationary batteries. Renew. Sustain. Energy Rev. 2017, 78, 46–60. [Google Scholar] [CrossRef]
  46. Kim, H.C.; Wallington, T.J.; Arsenault, R.; Bae, C.; Ahn, S.; Lee, J. Cradle-to-Gate Emissions from a Commercial Electric Vehicle Li-Ion Battery: A Comparative Analysis. Environ. Sci. Technol. 2016, 50, 7715–7722. [Google Scholar] [CrossRef]
  47. Yuan, C.; Deng, Y.; Li, T.; Yang, F. Manufacturing energy analysis of lithium ion battery pack for electric vehicles. CIRP Ann. 2017, 66, 53–56. [Google Scholar] [CrossRef]
  48. Philippot, M.; Alvarez, G.; Ayerbe, E.; Van Mierlo, J.; Messagie, M. Eco-Efficiency of a Lithium-Ion Battery for Electric Vehicles: Influence of Manufacturing Country and Commodity Prices on GHG Emissions and Costs. Batteries 2019, 5, 23. [Google Scholar] [CrossRef] [Green Version]
  49. Wang, Y.; Yu, Y.; Huang, K.; Chen, B.; Deng, W.; Yao, Y. Quantifying the environmental impact of a Li-rich high-capacity cathode material in electric vehicles via life cycle assessment. Environ. Sci. Pollut. Res. 2017, 24, 1251–1260. [Google Scholar] [CrossRef] [PubMed]
  50. Deng, Y.; Li, J.; Li, T.; Gao, X.; Yuan, C. Life cycle assessment of lithium sulfur battery for electric vehicles. J. Power Sources 2017, 343, 284–295. [Google Scholar] [CrossRef] [Green Version]
  51. Cusenza, M.A.; Bobba, S.; Ardente, F.; Cellura, M.; Di Persio, F. Energy and environmental assessment of a traction lithium-ion battery pack for plug-in hybrid electric vehicles. J. Clean. Prod. 2019, 215, 634–649. [Google Scholar] [CrossRef] [PubMed]
  52. Raugei, M.; Winfield, P. Prospective LCA of the production and EoL recycling of a novel type of Li-ion battery for electric vehicles. J. Clean. Prod. 2019, 213, 926–932. [Google Scholar] [CrossRef] [Green Version]
  53. Siret, C.; Tytgat, J.; Ebert, T.; Mistry, M.; Thirlaway, C.; Schutz, B.; Xhantopoulos, D.; Wiaux, J.-P.; Chanson, C.; Tomboy, W.; et al. PEFCR—Product Environmental Footprint Category Rules for High Specific Energy Rechargeable Batteries for Mobile Applications; Recharge: Brussels, Belgium, 2018. [Google Scholar]
  54. Lam, W.C.; Peeters, K.; Van Tichelen, P. Preparatory Study on Ecodesign and Energy Labelling of Batteries under FWC ENER/C3/2015-619-Lot 1. Task 5. Environment & Economics—For Ecodesign and Energy Labelling; European Commission: Brussels, Belgium, 2019. [Google Scholar]
  55. 2019 Volkswagen e-Golf SE—Specifications and Price. Available online: https://www.evspecifications.com/en/model/e1d178 (accessed on 8 July 2020).
  56. Tesla Model S Long Range. Available online: https://ev-database.org/car/1194/Tesla-Model-S-Long-Range (accessed on 8 July 2020).
  57. Brander, M.; Tipper, R.; Hutchison, C.; Davis, G. Consequential and Attributional Approaches to LCA: A Guide to Policy Makers with Specific Reference to Greenhouse Gas LCA of Biofuels. Ecometrica Tech. Pap. TP090403A 2009, 44. [Google Scholar]
  58. Wernet, G.; Bauer, C.; Steubing, B.; Reinhard, J.; Moreno-Ruiz, E.; Weidema, B. The ecoinvent database version 3 (part I): Overview and methodology. Int. J. Life Cycle Assess. 2016, 21, 1218–1230. [Google Scholar] [CrossRef]
  59. Argonne National Laboratory GREET Model: The Greenhouse gases, Regulated Emissions, and Energy Use in Transportation Model. 2019. Available online: https://greet.es.anl.gov/ (accessed on 28 September 2020).
  60. Field, K. BloombergNEF: Lithium-Ion Battery Cell Densities Have Almost Tripled Since 2010. Available online: https://cleantechnica.com/2020/02/19/bloombergnef-lithium-ion-battery-cell-densities-have-almost-tripled-since-2010/ (accessed on 9 July 2020).
  61. Wood, D.L.; Li, J.; Daniel, C. Prospects for reducing the processing cost of lithium ion batteries. J. Power Sources 2015, 275, 234–242. [Google Scholar] [CrossRef] [Green Version]
  62. Davidsson Kurland, S. Energy use for GWh-scale lithium-ion battery production. Environ. Res. Commun. 2019, 2, 012001. [Google Scholar] [CrossRef]
  63. Myhre, G.; Shindell, D.; Bréon, F.-M.; Collins, W.; Fuglestvedt, J.; Huang, J.; Koch, D.; Lamarque, J.-F.; Lee, D.; Mendoza, B.; et al. Anthropogenic and Natural Radiative Forcing. In Climate Change 2013—The Physical Science Basis; Cambridge University Press: Cambridge, UK, 2013; pp. 659–740. [Google Scholar] [CrossRef]
  64. Hoekstra, A. The Underestimated Potential of Battery Electric Vehicles to Reduce Emissions. Joule 2019, 3, 1412–1414. [Google Scholar] [CrossRef] [Green Version]
  65. Neubauer, J.; Smith, K.; Wood, E.; Pesaran, A. Identifying and Overcoming Critical Barriers to Widespread Second Use of PEV Batteries; National Renewable Energy Lab (NREL): Golden, CO, USA, 2015; NREL/TP--5400-63332; p. 1171780.
  66. Gaines, L. Lithium-ion battery recycling processes: Research towards a sustainable course. Sustain. Mater. Technol. 2018, 17, e00068. [Google Scholar] [CrossRef]
  67. Broderick, C.; Moussa, M.; Clark, J. Overview of Acids and Bases. Available online: https://chem.libretexts.org/Bookshelves/Physical_and_Theoretical_Chemistry_Textbook_Maps/Supplemental_Modules_(Physical_and_Theoretical_Chemistry)/Acids_and_Bases/Acid/Overview_of_Acids_and_Bases (accessed on 4 August 2020).
  68. National Center for Biotechnology Information. PubChem Annotation Record for 1,4-Dichlorobenzene, Source: Hazardous Substances Data Bank (HSDB). Available online: https://pubchem.ncbi.nlm.nih.gov/source/hsdb/523 (accessed on 5 August 2020).
  69. European Environment Agency. Emissions of primary PM2.5 and PM10 particulate matter. Available online: https://www.eea.europa.eu/data-and-maps/indicators/emissions-of-primary-particles-and-5 (accessed on 5 August 2020).
  70. Climate & Clean Air Coalition. Tropospheric Ozone. Available online: https://www.ccacoalition.org/ru/slcps/tropospheric-ozone (accessed on 5 August 2020).
Figure 1. The life cycle of batteries.
Energies 13 06345 g001
Figure 2. Frequency of assessed sensitivity variables in investigated LCAs.
Energies 13 06345 g002
Figure 3. Greenhouse gas (GHG) emissions of battery materials from the literature review in comparison to GREET 2019 (results based on median, 25%-quantile, and 75%-quantile).
Energies 13 06345 g003
Figure 4. GHG emissions of material production per battery component (results based on median, 25%-quantile, and 75%-quantile).
Energies 13 06345 g004
Figure 5. GHG emissions comparison of material production between background databases and battery types (results based on median, 25%-quantile, and 75%-quantile).
Energies 13 06345 g005
Figure 6. GHG emissions of battery production (results based on median, 25%-quantile, and 75%-quantile).
Energies 13 06345 g006
Figure 7. Battery cell manufacturing energy consumption (results based on median, 25%-quantile, and 75%-quantile).
Energies 13 06345 g007
Figure 8. GHG emissions and savings of recycling (results based on median, 25%-quantile, and 75%-quantile).
Energies 13 06345 g008
Figure 9. Overall results (results based on median, 25%-quantile, and 75%-quantile).
Energies 13 06345 g009
Table 1. Most commonly assessed battery characteristics (results based on median, 25%-quantile, and 75%-quantile).
Capacity [kWh]30 (25–40)
Weight [kg]250 (170–440)
Specific energy [Wh/kg]115 (100–135)
Driving range per charge [km]190 (110–300)
Lifetime[km]180,000 (150,000–200,000)
[cycles]1850 (1100–3200)
[years]13 (8–14)
Table 2. Comparison of battery production assumptions of Ellingsen et al. [8] and Dai et al. [9].
Ellingsen et al. (2014)Dai et al. (2019)
Production scalePilot plant, <1 GWh/aIndustrial plant, 2 GWh/a
Energy demand163–644 kWh/kWh_bc 47 kWh/kWh_bc
Of which is electricity100% electricity; from East Asian mix (46% coal)18% electricity; from US mix (32.7% coal)
Of which is heat-82% heat from natural gas
Table 3. GHG emissions [g CO2-eq/km] contributed by battery production to drive one km.
GHG Emissions of Battery ProductionBattery Pack CapacityLifetime BatteryGHG Emissions
[kg CO2-eq/kWh][kWh][km]g CO2-eq/km
Q25%-quantile7025200,0009
Median12030180,00020
Q75%-quantile17540150,00047
Publisher’s Note: MDPI stays neutral with regard to jurisdictional claims in published maps and institutional affiliations.

