Article

Refining Estimates of Fuel-Cycle Greenhouse-Gas Emission Reductions Associated with California’s Clean Vehicle Rebate Project with Program Data and Other Case-Specific Inputs

by
Nicholas Pallonetti
* and
Brett D. H. Williams
Center for Sustainable Energy (CSE), 3980 Sherman St. Suite 170, San Diego, CA 92110, USA
*
Author to whom correspondence should be addressed.
Energies 2021, 14(15), 4640; https://doi.org/10.3390/en14154640
Submission received: 12 July 2021 / Revised: 23 July 2021 / Accepted: 28 July 2021 / Published: 30 July 2021
(This article belongs to the Special Issue Environmental Life Cycle Assessment of Electric Vehicles)

Abstract

:
This work refines and updates estimates of the fuel-cycle greenhouse-gas (GHG) emission impacts of electric vehicles (EVs) rebated in California. Emissions are estimated using disaggregated data from the start of the rebate program through August 2018 (N = 269,902 participants) and factors that characterize fuel use and fuel life-cycle carbon intensity. GHG reductions are calculated for the first year of vehicle operation and subsequently scaled to reflect various operational timeframes. GHG reduction estimates over the first year of vehicle ownership total approximately 855 thousand metric tons of CO2-equivalent emissions, or 3.2 tons per vehicle. For nonfleet individuals, 54% of reductions are associated with “Rebate-Essential” participants who were most highly influenced by the rebate to purchase/lease. Comparing the estimated warranty-life benefit of 7.9 million tons of GHG reductions to USD 603 million in corresponding rebates results in USD 76 of state incentives per metric ton reduced over the first 100,000/150,000 miles of rebated vehicle use. Uncertainty in estimates presents opportunities for further refinement using additional participant-specific, time-variant, or otherwise detailed inputs. Nevertheless, the contributions of this work increased average first-year GHG reductions per vehicle by 35–45% compared to previous work, demonstrating that use of program-derived data can enhance the understanding of EV impacts.

1. Introduction

1.1. Motivation

A primary motivation for federal, state, and regional investment in electric-vehicle (EV) commercialization and wide-spread adoption is the need to reduce greenhouse-gas (GHG) and other emissions from the light-duty-vehicle (LDV) sector, which is a major contributor to U.S. carbon emissions. The California Air Resources Board’s (CARB’s) Clean Vehicle Rebate Project (CVRP) provides cash rebates to California consumers for the purchase or lease of eligible light-duty electric vehicles (and other vehicles not examined here such as zero-emission motorcycles). It represents an investment exceeding one-half of a billion dollars over the life of the project, which began in 2010, through August 2018.

1.2. Previous Related Work

As highlighted in multiple literature reviews [1,2,3] many studies have used life-cycle assessments (LCAs) to evaluate the environmental effects of EV operation and how those compare to internal combustion engine vehicles. These studies often use one or more illustrative EVs or average EV characterizations as the basis of the analysis [2]. Some EV LCAs use their results to make forward-looking projections to estimate the potential of EVs’ role in reaching climate goals over the decades to come [4,5,6,7,8,9]. Others have assessed the cumulative impact of fleetwide EV adoption that has occurred to help understand expected emission reduction progress from EVs acquired to date [10].
As discussed in [3] the reviewed literature has generated a wide range of results due to differing study parameters such as goals, scopes, models, scales, timespans, and datasets used. This underscores the need for context-specific analyses to understand EV impacts for a given vehicle population. However, the theme found across studies is that EVs generally emit fewer life-cycle GHG emissions than internal combustion engine vehicles. Most results have found comparatively higher emissions from EVs in the production phase—which is a relatively small portion of overall LCA emissions—which are then more than offset by lower in-use emissions.
Prior comparable estimates of fuel-cycle GHG emission reductions associated with CVRP, developed in support of CARB’s fiscal year 2017–18 low-carbon transportation Funding Plan process [11], were based upon an average LDV fuel economy value for California in 2017, derived from the EMFAC model [12]. This fuel economy was converted into two emissions-per-mile factors using fuel carbon intensities [13] and energy-efficiency ratios [14] from the Low Carbon Fuel Standard (LCFS), one each to represent the fuel-specific life-cycle emissions rate from a baseline new gasoline vehicle and a rebated battery-electric vehicle (BEV). These were combined into a third emissions-per-mile factor for a rebated plug-in hybrid electric vehicle (PHEV), presumably based upon an assumed proportion of electric (40%) and gasoline (60%) operation [15]. The difference between baseline and rebated emission factors was then multiplied by annual vehicle miles traveled (VMT)—one value each for PHEVs and BEVs—and scaled up in proportion to the number of rebates for each. This approach was applied to a range of light-duty-vehicle programs. It was designed to generate a conservative estimate of programs’ current-year impacts, with a plan to revise “…as new data becomes available and methodologies are refined” [11].

1.3. Contribution and Overview

The work described herein supplements previous studies that have assessed the cumulative emissions impact of fleetwide EV adoption that has occurred to date in the United States. This effort fills a gap in existing fuel-cycle (well-to-wheels) EV emissions literature by providing a context-specific analysis of a large number (N = 269,902) of rebated vehicles in California. It builds off the prior comparable estimates of emission reductions associated with CVRP described above with the goal of improving our understanding of: (a) what impact the use of disaggregated, vehicle-specific data has on fuel-cycle GHG savings estimates in California (as opposed to using an illustrative model or average vehicle characterizations), and (b) the emissions benefits associated with and attributable to the United States’ largest EV rebate program. With a focus on incorporating more tailored data and increasing the detail of the methods employed in estimating the GHG impacts of CVRP specifically, it expands upon prior efforts to quantify the emissions impact of the project in six major ways:
  • It extends the perspective from annual reporting towards a “life-of-project” view, examining emission reductions from CVRP’s inception in 2010 through the end of August 2018. (The end of the date range reflects the most recent data available for this use at the time of the analysis; subsequent work in progress will incorporate more recent data and select other features described in Section 4.2.)
  • It incorporates project-derived and/or case-specific data. Specifically, it employs model- and model-year-specific fuel consumption rate values corresponding to the nearly 270,000 vehicles rebated, as well as model-specific electric-VMT values corresponding to over 100,000 rebated PHEVs. California-sales-weighted average fuel consumption rate values were created for each model year of baseline gasoline vehicles for comparison.
  • It includes an initial quantification of GHG savings from rebated fuel-cell electric vehicles (FCEVs).
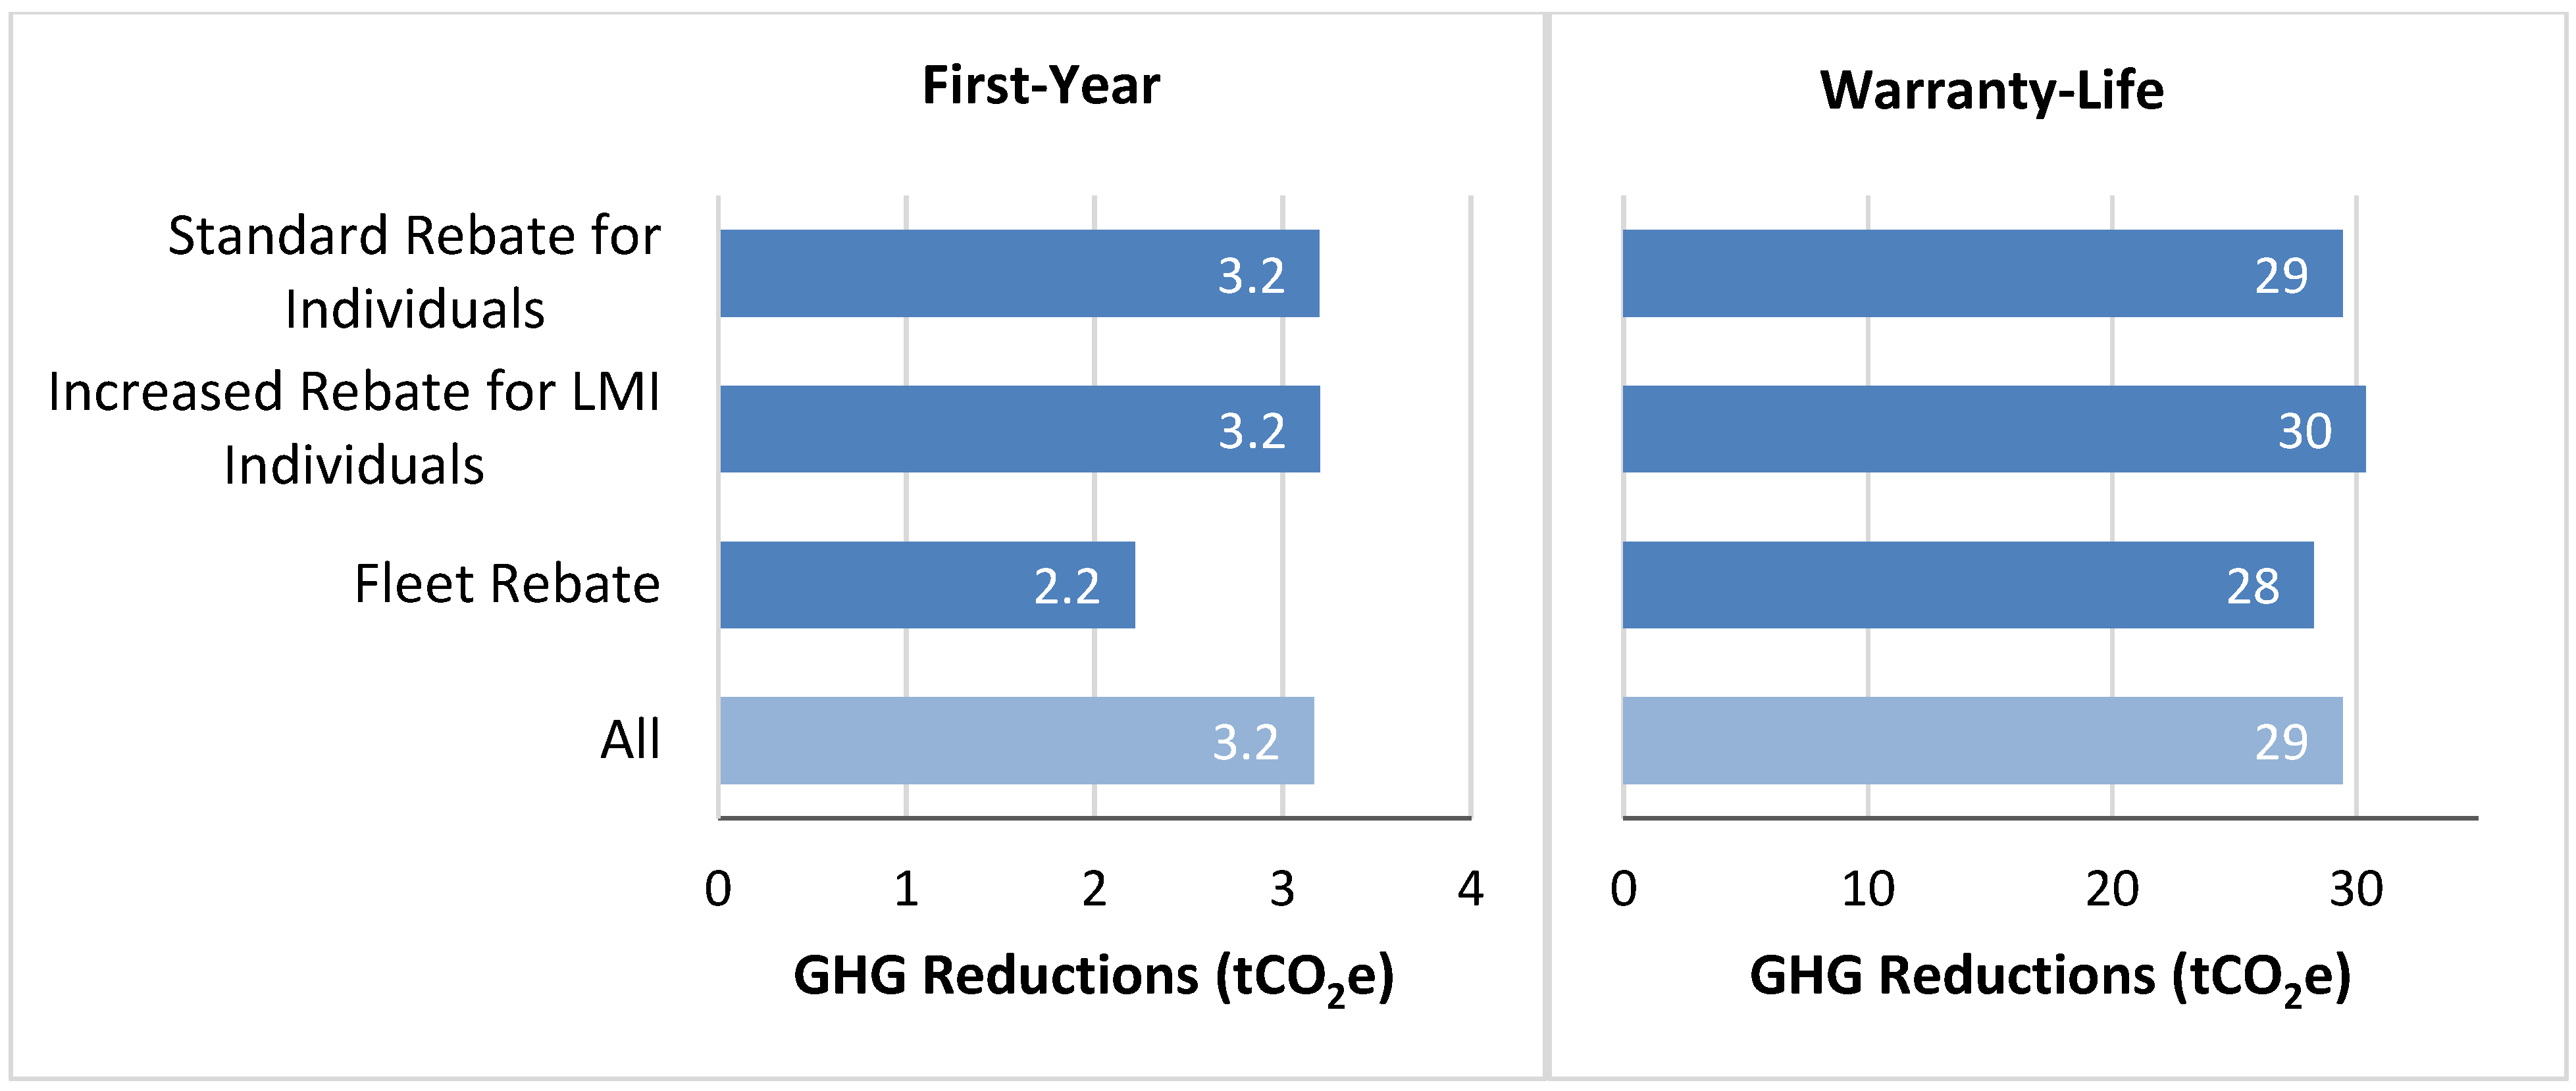
  • It assesses how emissions vary by rebate type and consumer type.
  • It analyzes the sensitivity of the results to variations in individual input values.
  • It uses metrics of “Rebate Essentiality” [16,17] from nearly 40,000 corresponding survey respondents to highlight those emissions savings produced by consumers most highly influenced by the rebate to acquire an EV.
As such, the work aims to provide a more project-specific, detailed, and increasingly accurate estimate of the project’s emission impacts.
These contributions increased average first-year GHG reductions per vehicle by 35–45% compared to previous work [11], demonstrating that use of program-derived data can significantly enhance the understanding of the EV impacts. Comparing the estimated warranty-life benefit of 7.9 million total metric tons of reduced GHG emissions to the USD 603 million in corresponding rebates results in an estimate of roughly USD 76 of state incentives per metric ton reduced over the first 100,000/150,000 miles of rebated vehicle use, or about 13 kg of CO2-equivalent emissions reduced over that period per incentive dollar invested. Uncertainty in such estimates, which are heavily influenced by the generally conservative assumptions in this study, presents opportunities for further refinement using additional participant-specific, time-variant, or otherwise detailed inputs.
The remainder of the report is organized as follows. Section 2 characterizes the data utilized and describes the approach taken to estimate emission reductions using factors characterizing rebated- and baseline-vehicle fuel consumption rates, VMT, electric VMT, and the life-cycle carbon intensity of fuels. Section 3 summarizes the resulting estimates and sensitivity analysis. Reductions attributable to CVRP-rebated PHEVs, range-extended BEVs (BEVx vehicles), BEVs, and FCEVs over the first year of vehicle ownership are estimated per vehicle and in aggregate. These savings are then scaled up to reflect the battery warranty lifespan. A subset of emission reductions is then highlighted to reflect “Rebate-Essential” participants who were most highly influenced by the rebate to purchase/lease their vehicles. Sensitivity analyses are presented, indicating opportunities for further refinement using participant-specific inputs. Further, bounding estimates are created and other operational timeframes are explored. Section 4 discusses the results, their interpretation, and next steps—including opportunities to incorporate more project-specific information and conservatisms to address. Section 5 presents summarizing thoughts.

2. Materials and Methods

2.1. Data Summary

2.1.1. Application Data

The rebated vehicle dataset from which emissions associated with the project are estimated is comprised of vehicles with issued (paid) rebates or approved applications (check forthcoming) over the life of the project through August 2018. The dataset includes individual and fleet (governmental, business, and nonprofit) consumer types and PHEV, BEVx, BEV, and FCEV drivetrain categories (technology types). Individual consumers include two rebate types: Standard Rebates and Increased Rebates for Low-/Moderate-Income (LMI) Consumers (the latter have been available since 29 March 2016) [18]. Zero-emission motorcycles and other technology types totaled <1% of all records and were removed for simplicity. The final dataset included 269,902 applications totaling USD 603,314,214 in rebates. Vehicle purchase/lease dates spanned 11 March 2009–31 August 2018 and CVRP application-received dates spanned 18 March 2010–31 August 2018.

2.1.2. Survey Data

CVRP invites individual (i.e., non-fleet) applicants that have been approved to receive a rebate to fill out a voluntary Consumer Survey. Survey responses are used to classify fractions of emission reductions as Rebate Essential (from consumers most highly influenced by the rebate to adopt, see Section 2.2.3). The survey has undergone several modifications since the beginning of the project, dividing it into three “editions” (Table 1). Responses from all technology types were used, though it should be noted that FCEV consumers were invited to participate in the survey beginning with the third edition (with previous FCEV applicants from the start of the project invited to respond to the survey at that time). Though analyzed separately, BEVx is grouped with BEV for all survey assumptions where needed, as BEVx consumers are expected to be more akin to BEV consumers than PHEV consumers. This also follows the project’s approach to providing BEVx vehicles equivalent incentives to BEVs.
Survey responses are weighted using the raking method (iterative proportional fitting) to make the survey responses more representative of the program populations during each period. The weighting was performed along the dimensions of technology type, vehicle model, purchase vs. lease, and county of residence. Finally, non-respondents that fall within a project era that is not represented by a survey are assigned to the survey edition that they are “nearest to” based on purchase/lease date (e.g., early project participants that are not represented by the first survey were assigned to the first survey, and recent project participants that are not represented by the latest survey were assigned to the latest survey). All FCEV consumers are assigned to the most recent survey edition, as this was the first edition to which this group was invited. The editions of the survey and their assigned participants are described in Table 1.

2.1.3. Vehicle Registration Data

The baseline-vehicle sales-weighted fuel consumption rate values (Table 2, row 4) were calculated using registration data licensed from IHS Markit. The data include monthly new gasoline and electric vehicle registrations in California from March 2010 through July 2018.

2.2. Methods and Inputs

GHG reductions associated with the project are calculated by comparing estimates of on-road emissions from each vehicle that was rebated to a baseline vehicle assumed to have been used had the rebated vehicle not been acquired. These reductions are assessed at two levels: (1) savings associated with all rebated project participants, or “rebated reductions,” and (2) savings associated with consumers most highly influenced by the rebate to purchase/lease an EV, or “Rebate-Essential reductions.”
The approach for estimating emissions is described next, inputs and sources are detailed further in Table 2, and sensitivity testing is described in Section 3.2. Only light-duty vehicles are included throughout.

2.2.1. Rebated Emission Reductions: Approach

Annualizing emissions for simplicity, rebated reductions (in units of metric tons of CO2-equivalent emissions, or tCO2e) are calculated by summing for each rebate the difference between estimates of the emissions avoided (baseline vehicle, E baseline ) and the emissions produced (rebated vehicle, E rebated ) over a year of operation:
Rebated   reductions = i E i , baseline E i , rebated
where:
i = each individual baseline and rebated vehicle pair;
E = annual emissions.
Following [11], the baseline vehicle is assumed to be a new gasoline vehicle of the same model year (MY) as the rebated vehicle.
For each baseline vehicle:
E i ,   baseline = C I gasoline × F C gasoline M Y × V M T gasoline c ,   d ,   r
where:
E = emissions avoided annually;
i = individual vehicle;
baseline = vehicle that would have been used had the rebated vehicle not been acquired;
CIgasoline = carbon intensity of gasoline in units of life-cycle CO2e per gallon;
FCgasoline = gasoline consumption rate in units of gallons per mile, which varies by model year (MY) of the paired rebated vehicle;
VMTgasoline = vehicle miles traveled annually, which varies by consumer type (c) and the paired rebated vehicle’s drivetrain category (d), and, for BEVs only, range subcategory (r).
For each rebated vehicle:
E i ,   rebated = f ( C I f × F C f m , M Y × [ V M T f c , d , r × P f m , M Y ] )
where:
Ei,rebated = emissions produced annually by each individual rebated vehicle;
f = fuel used by rebated vehicle {gasoline, electricity, hydrogen};
CIf = carbon intensity of fuel f in units of life-cycle CO2e per unit of fuel;
FCf = fuel consumption rate in units of gal, kWh, or kg of fuel f per mile, which varies by model (m) and model year (MY);
VMTf = vehicle miles traveled annually on fuel f, which varies by consumer type (c), drivetrain category (d), and, for BEVs only, range subcategory (r);
Pf = percent of miles traveled on fuel f, which varies by m and MY for PHEVs.
Carbon intensity, fuel consumption rate, and vehicle miles traveled are described further next.
Carbon intensity of fuels. Consistent with [11], this work uses statewide average carbon intensity (CI) values from California’s LCFS program regulations [14,19,20]. These values represent the amount of CO2-equivalent emissions (CO2e) emitted during the life-cycle of each fuel, accounting for upstream and combustion emissions. This approach neither accounts for changes to the CI of fuel sources over time nor weighs in on the issue of assigning marginal/induced grid emissions (which is a shorter-term perspective on assigning emissions to added electrical load that would include assessing which power plants can scale in response to demand and the time of day in which load is added).
Fuel consumption rate. Rebated vehicle fuel consumption rates are determined on a model- and model-year-specific basis using EPA data [21]. Following [11], the baseline vehicle is assumed to be a new gasoline vehicle of the same model year as the rebated vehicle. However, this study utilizes California-sales-weighted average fuel consumption rates created for baseline vehicles, as described in Table 2 and detailed in Appendix A. These are different, more context-specific values than those calculated from EMFAC forecasts and used in [11]. The EPA data provided in units of fuel economy (e.g., miles per gallon) are converted to fuel consumption rates (e.g., gallons per mile) for analysis.
Vehicle miles traveled. Annual VMT estimates for individuals come from surveys of EV drivers in California conducted by the PH&EV Research Center at UC Davis [22,23]. These estimates vary by the rebated vehicle technology type and, for BEVs, the range subcategory of the model (long or short). Fleet VMT is based on the U.S. General Services Administration’s Federal Fleet Report [24] and adjusted to reflect the variations by technology type found in individuals, as detailed in Table 2 and described in Appendix B. For PHEVs and BEVx vehicles, which use both electric and gasoline fuels, a model-specific electric-VMT percentage is used to assign fractions of total travel to electricity (see Table 2 and Appendix C for further detail). For example, emissions from 92% of travel for a rebated BMW i3 REx are calculated using the CI of electric fuel and the remainder is calculated using the CI of gasoline.

2.2.2. Rebated Emission Reductions: Operation Lifetime Assumption

In addition to one-year estimates ( Rebated   Reductions 1 st year ), reflecting savings expected during the first year of vehicle operation, rebated reductions are reported in terms of warranty life ( Rebated   Reductions warranty   life ). Considering the fairly recent nature of their widespread availability and accelerated adoption, the average length of an EV’s useful life is not yet clear. It can be assumed, however, that EVs are likely to last at least as long as their warranties. Therefore, lifetime emission savings are quantified over the mileage period associated with the vehicle’s battery warranties. The warranty lifetime assumption varies by technology type and is based on the 150,000-mile battery warranty for PHEVs required by California’s Zero-Emission Vehicle Standards [25,26] and the most common battery warranty of 100,000 miles [27] for other EVs. While BEVx batteries are covered for 150,000 miles under California’s Standards, BEVx vehicles are analyzed over the 100,000-mile period of other EVs here as a conservatism and to align more closely with the total miles expected to be driven over the 10-year warranty period associated with the 150,000 warranty miles.
Both perspectives are useful for different reasons: First-year GHG savings better illustrate the variations across vehicle types and consumer types that result from differences in annual mileage estimates or carbon intensity of fuels. They also provide the reader a mechanism, albeit a slightly rough one, for scaling up emissions savings to a variety of timescales of interest (e.g., for comparison across programs or to compare different assumptions of vehicle ownership, use, and/or lifetime capacity). The warranty-life reductions, on the other hand, can be viewed as reductions achieved over the time period the vehicles should very reasonably be expected to last (which is, in turn, a conservative proxy for the actual lifetime capacity of the vehicles to provide benefits).
Consistent with [11], estimates are simplified here by multiplying first-year emission reductions to represent lifetime results, rather than modeling each year with time-variant factors:
Rebated   Reductions i , warranty   life = Rebated   Reductions i ,   1 st year × Warranty   Miles d V M T c ,   d ,   r .

2.2.3. Rebate-Essential Emission Reductions

One difficulty in estimating emission reductions directly attributable to the project is identifying EV sales that would not have happened without the rebate. To provide a more comprehensive picture of benefits directly attributable to CVRP, GHG reductions associated with consumers most highly influenced by the rebate to acquire an EV are calculated separately. As described in previous work [16,17], the CVRP Consumer Survey (see Section 2.1.2) provides project-specific insights into the influence of the project. Those who answer “No” to the question, “Would you have purchased your [rebated EV model] without the CVRP rebate?” are categorized as “Rebate-Essential”—i.e., not free-riders. Accordingly, responses to this question were used to direct focus toward emission reductions enabled by and directly attributable to the project. Specifically, if a participant was known to be Rebate-Essential, their emission reductions are included. If a participant was known to not be Rebate-Essential, their emission reductions are not included. If it was unknown whether a participant was Rebate-Essential, a fraction of their emission reductions are included equal to the percentage of Rebate Essentiality among their cohort (i.e., by technology type and assigned survey edition, see Appendix D). Since only individual (i.e., non-fleet) consumers were invited to respond to the survey, fleets are not analyzed for Rebate Essentiality or Rebate-Essential reductions.

3. Results

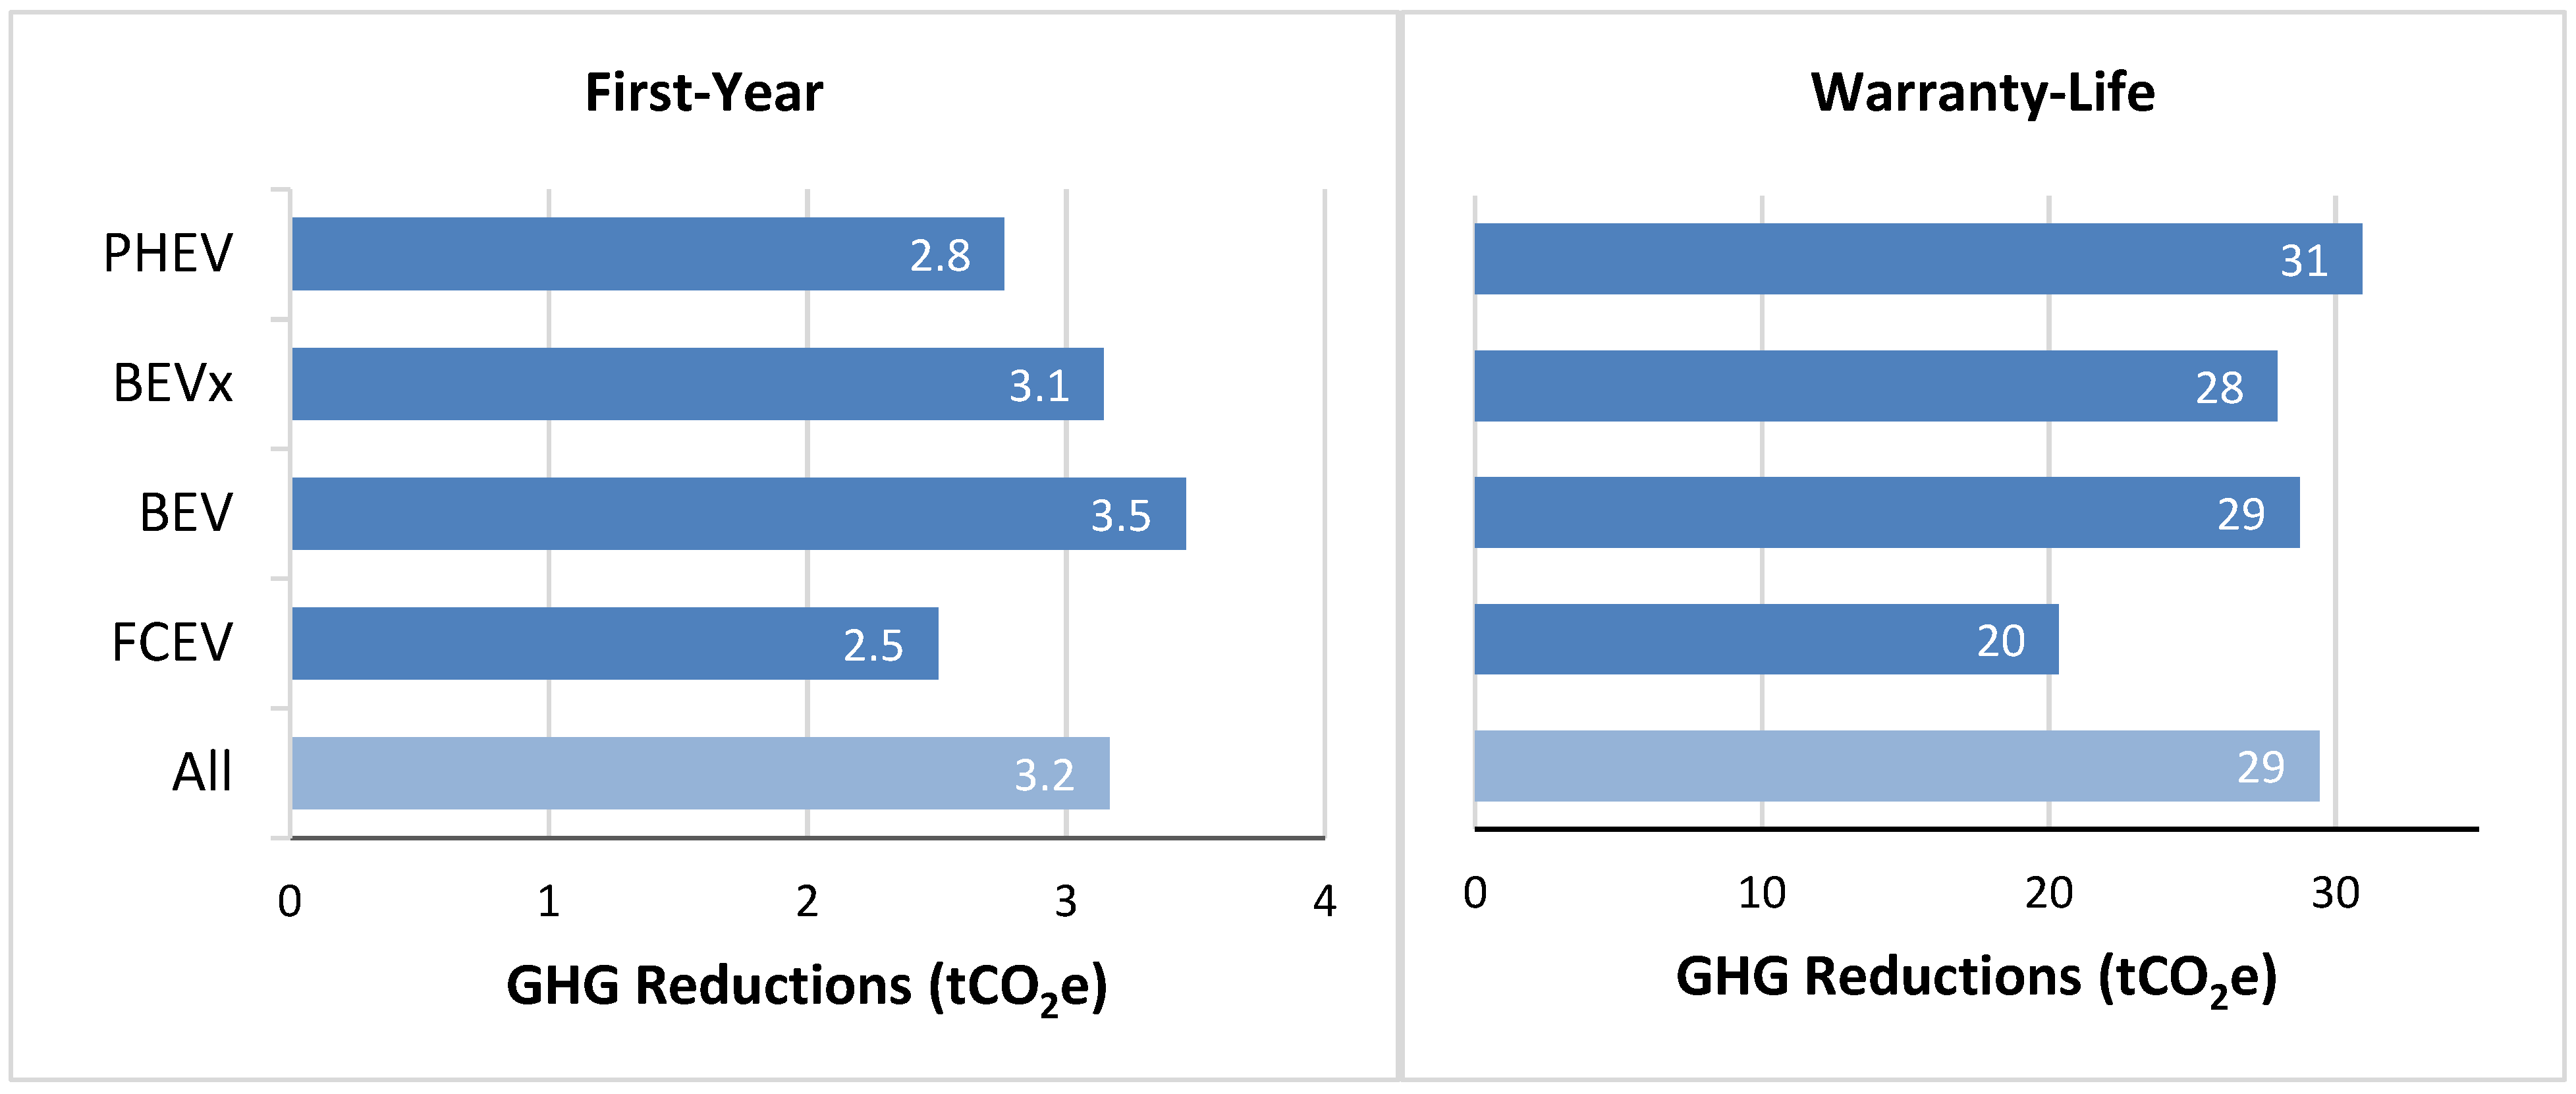
3.1. GHG Emission Reduction Estimates

Total GHG emission reductions achieved by the 269,902 rebated PHEVs, BEVx vehicles, BEVs, and FCEVs over the first year of vehicle ownership are estimated to be approximately 855,000 metric tons of CO2-equivalent emissions (tCO2e). This increases to 7.9 million tCO2e when scaled up to represent a 100,000-/150,000-mile warranty life. Approximately 53–54% of the reductions from individuals are associated with Rebate-Essential participants. Per-vehicle reductions estimates average 3.2 tCO2e over the first year of ownership and 29 tCO2e over the warranty life. Per-vehicle reductions by technology and rebate type are detailed in Figure 1 and Figure 2 below. These results are explored further in Section 3.2 and discussed in Section 4.
Another noteworthy observation relates to cost-effectiveness: this analysis indicates each ton of CO2e saved over the 100,000-/150,000-mile warranty period is associated with approximately USD 76 in rebates, or about 13 kg of CO2e is saved per incentive dollar. It should be noted that these findings are subject to the limitations discussed in Section 4.2.

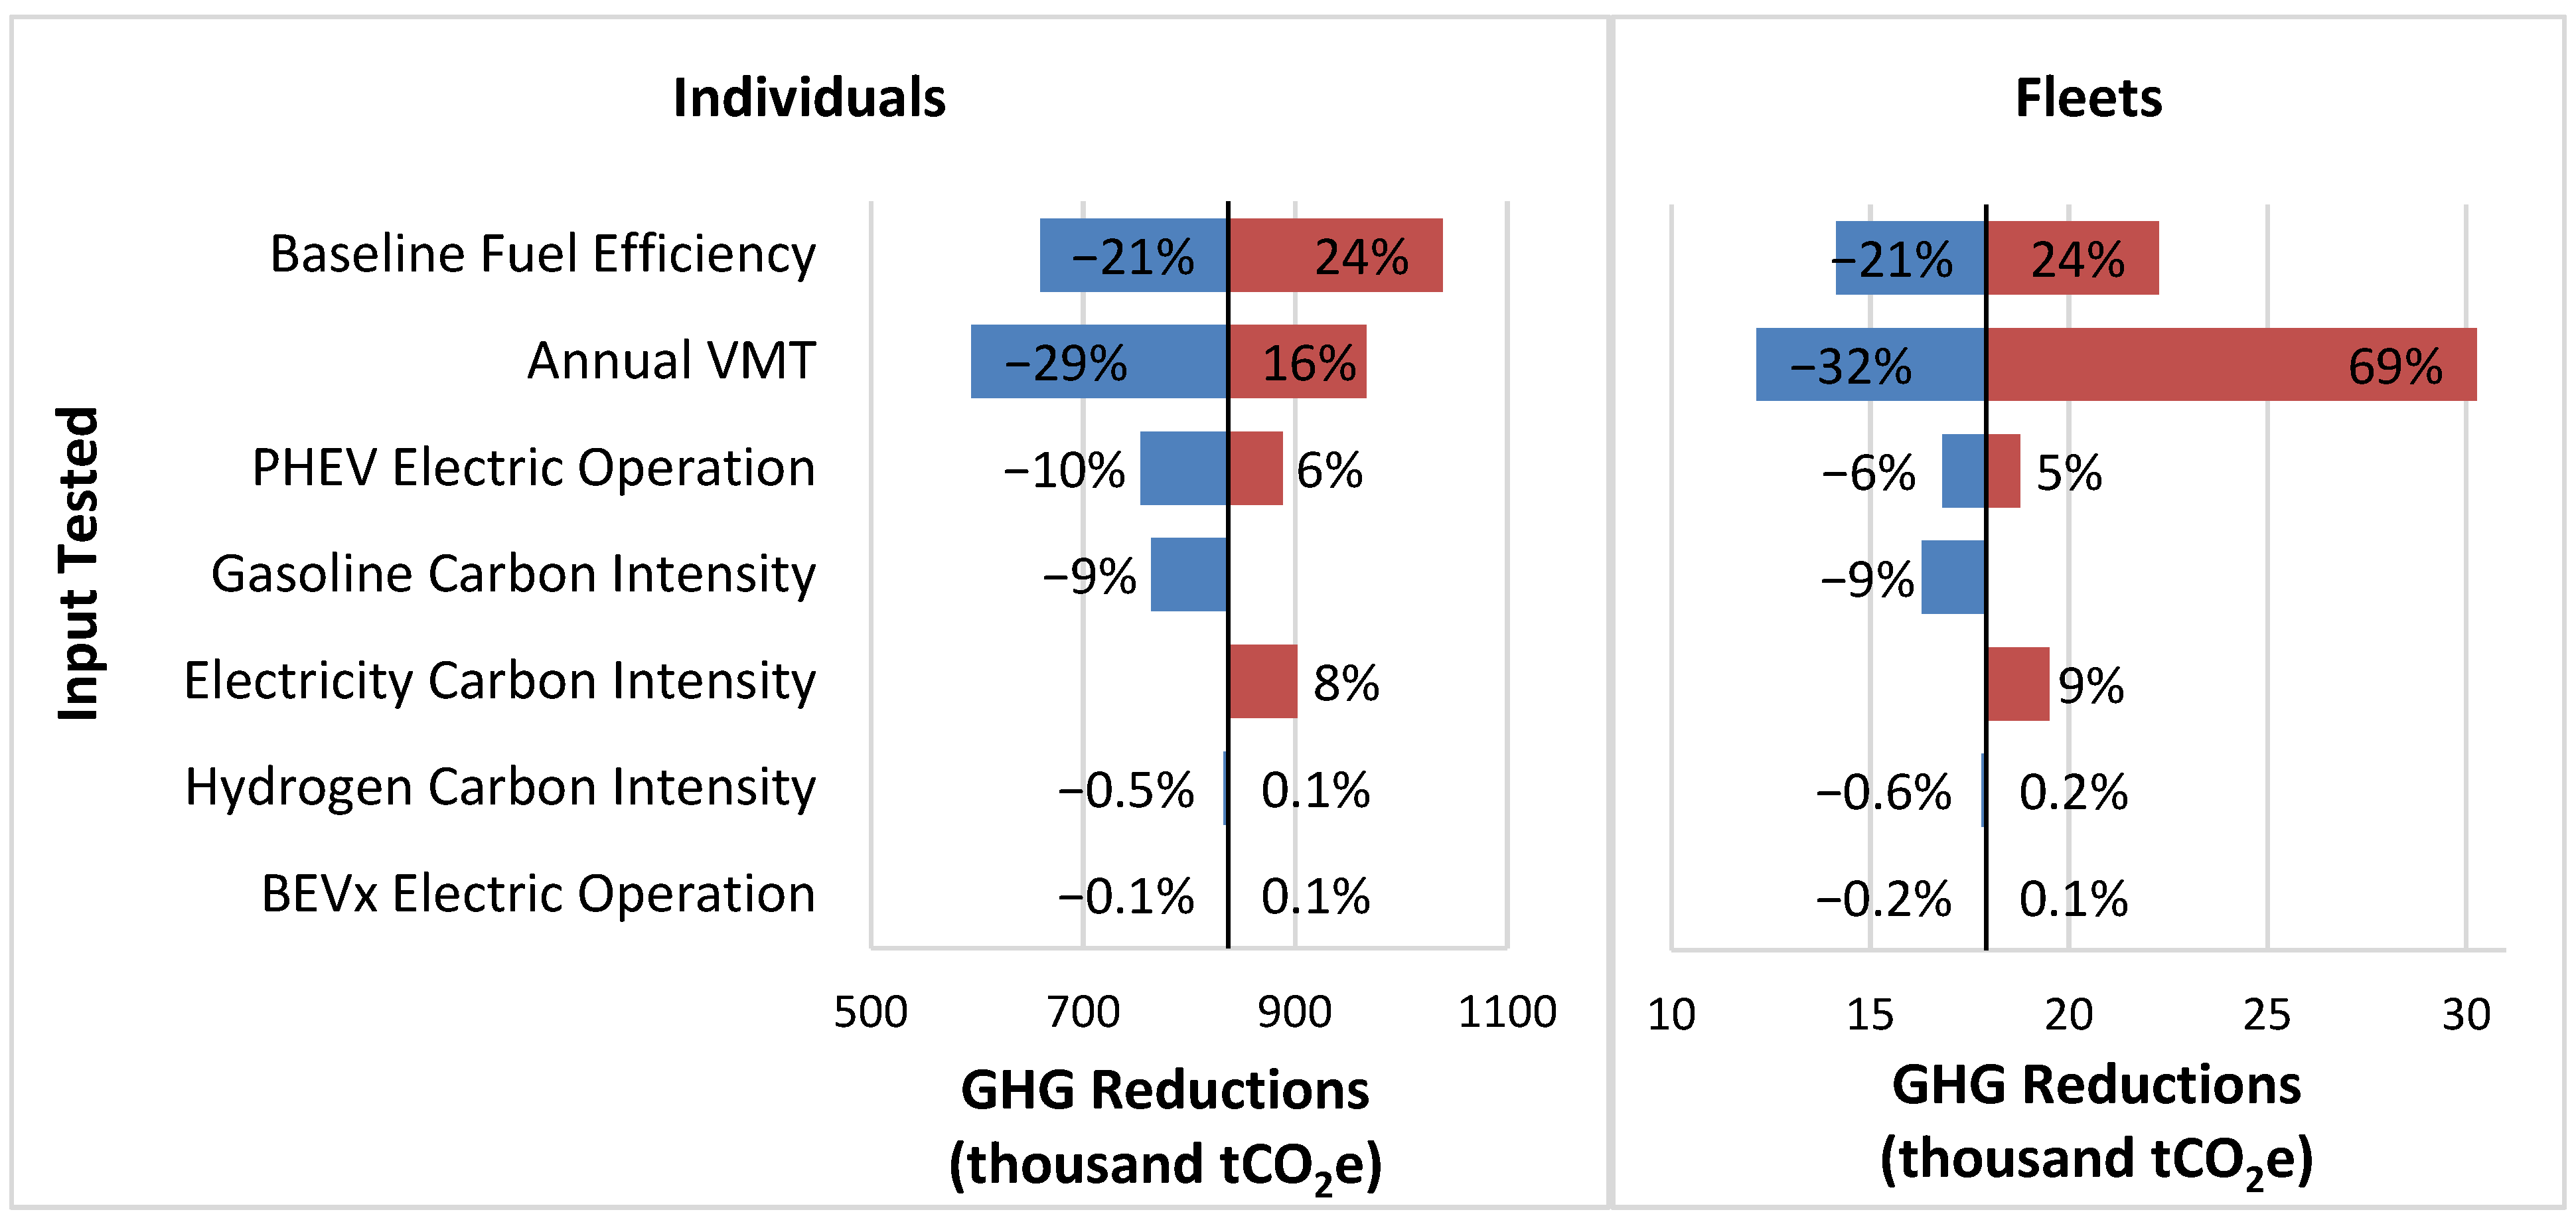
3.2. GHG Sensitivity Analysis

Sensitivity analyses were conducted to assess the impact of the uncertainty in several individual input values on emission reductions. As described in the subsections below, the literature about related topics helped inform value ranges for sensitivity tests. The isolated effects of these tests on the total first-year GHG reduction estimates range from −29% to +24% for individuals and −32% to +69% for fleets. Further, bounding estimates are created for several inputs and various operational timeframes are explored.

3.2.1. Sensitivity to Baseline-Vehicle Fuel Consumption Rates

GHG emission reduction estimates were sensitive to changes in the baseline fleet fuel consumption rates. The baseline fleet fuel consumption rates are comprised of California-sales-weighted averages of EPA-adjusted consumption rates for the 30 top-selling new gasoline models in each model year (MYs 2011–2018). Sales data were not available for MYs 2009–2010, so EPA-adjusted U.S.-production-weighted averages from [31] were used for these model years. Car-only averages were used because they were found to represent average California fuel consumption rates more closely than car-and-truck averages for MYs 2011–2017 (see Appendix A for further detail). The sensitivity test changed these to the U.S.-production-weighted car-and-truck averages [31,37]. This covers the unlikely scenario that larger cars and trucks would have been purchased without CVRP (which generally rebated cars of modest size during the period examined). The U.S. car-and-truck averages range 11–15% less fuel-efficient than the primary assumptions and resulted in a 24% increase in the first-year emission reduction estimates for both individuals and fleets.
Due to the lack of a comparable source for a high fuel-efficiency average, the sensitivity test used the magnitude of the largest deviation from the primary assumptions in the low-efficiency scenario (15%). This resulted in a decrease in the first-year emission reduction estimates of 21% for both individuals and fleets. However, it is possible that without the rebate many participants would have tended toward purchasing conventional hybrid vehicles that are more than 15% more fuel efficient than the assumed baseline vehicle. Accordingly, the authors explored an extreme high-efficiency bounding scenario using the fuel consumption rate of the most fuel-efficient non-EV for each model year. These were based on fuel economy values ranging from 46–58 MPG and resulted in a 76% decrease in emission reductions from the primary estimate for both individuals and fleets.

3.2.2. Sensitivity to Annual Vehicle Miles Traveled

The emission reduction estimates were also sensitive to changes in annual VMT, which were tested differently for individuals and fleets since primary VMT assumptions differ by consumer type. For individuals, a low-VMT scenario was tested by assigning the lowest annual VMT for any PHEV model found in the literature (11,122 miles) [38] to PHEVs and assigning the lowest VMT for any BEV model (7916 miles) [32] to all other technology types. These low-VMT values range 17–41% lower than the primary assumptions and decreased the first-year GHG reduction estimate for individuals by 29%. In the high-VMT scenario for individuals, the highest VMT for any PHEV model found in the literature (15,283 miles) [32] was used for PHEVs, long-range BEVs, and FCEVs; and the highest VMT for any BEV model in the literature (13,494 miles) [32] was used for short-range BEVs and BEVx vehicles. These high-VMT values range from 13–23% higher than the VMT assumed in the analysis and increased the estimated GHG savings by 16%.
Because primary VMT assumptions are lower for fleets than individuals, a low scenario for fleets was tested by decreasing VMT for each technology type by the same magnitude as the test for individuals (17–41%). This decreased the first-year GHGs saved from fleet vehicles by 32%. To account for the uncertainty related to CA fleet VMT, a high-upside test used the same high VMT inputs for individuals (13,494 and 15,283 miles), which increased the fleet GHG savings by 69%.

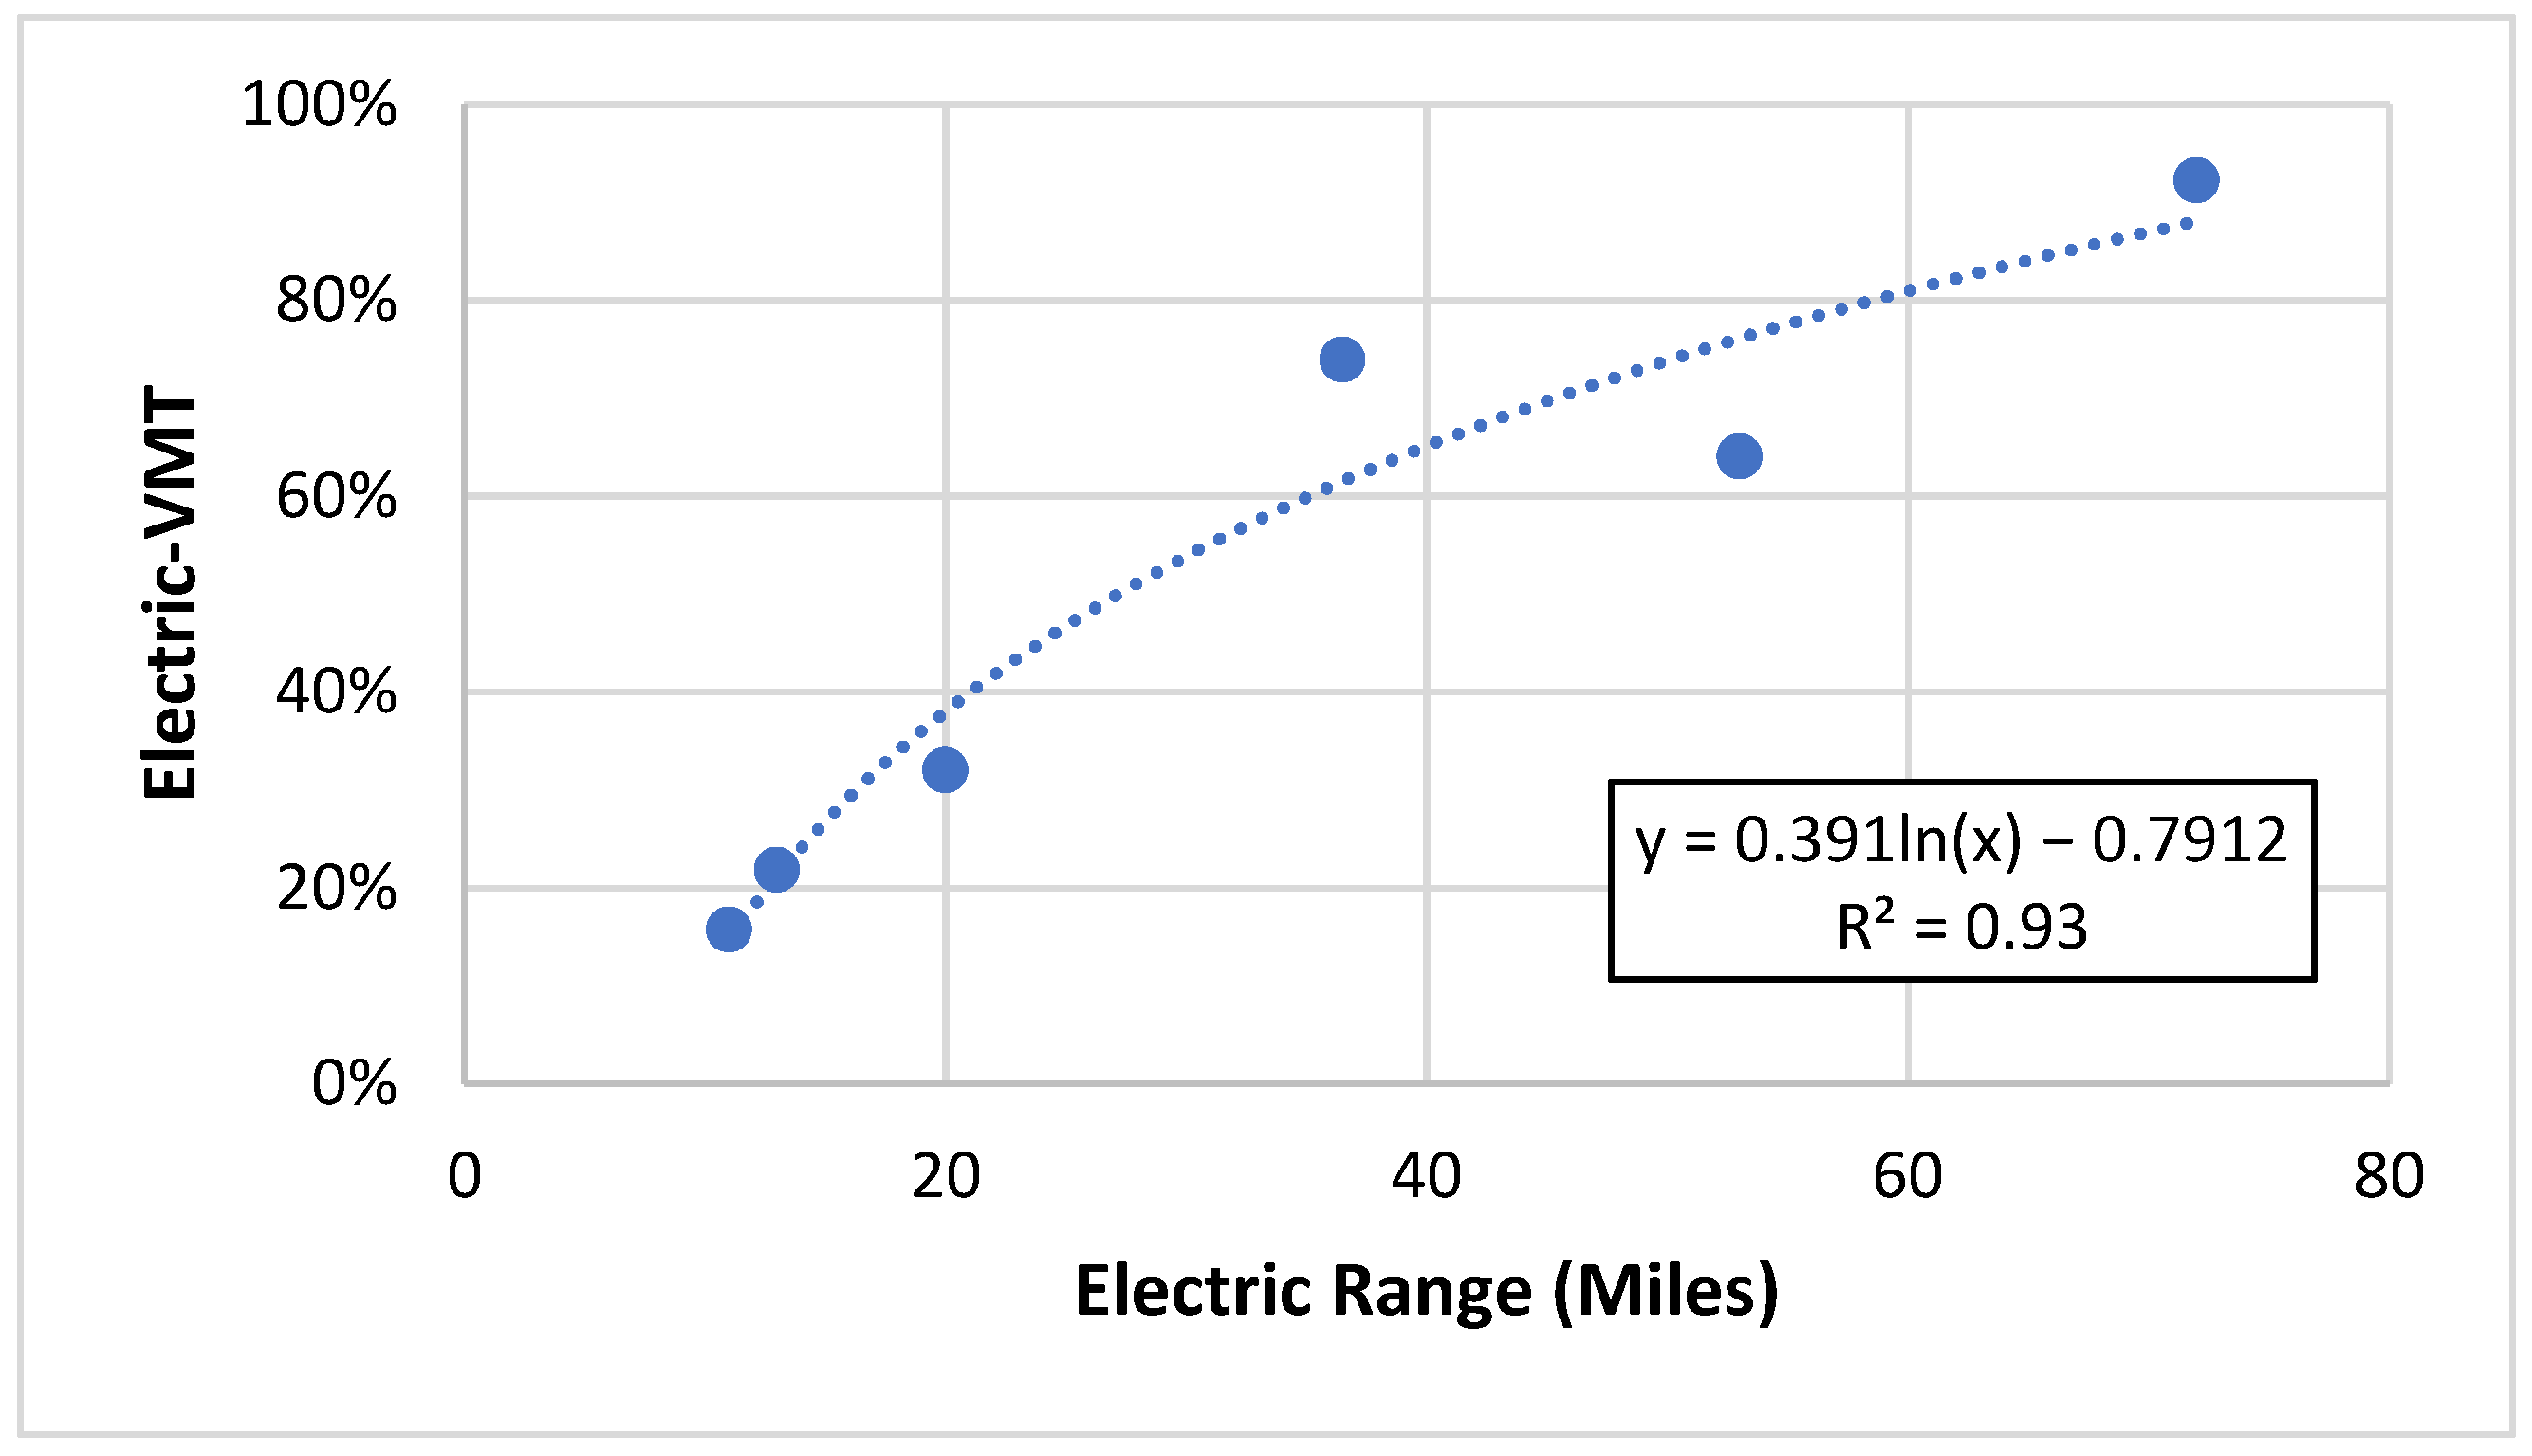
3.2.3. Sensitivity to Electric-VMT Percentage

The sensitivity of the estimated GHG reductions to assumptions about PHEV and BEVx electric-VMT percentages (i.e., the portion of travel in all electric mode) were also evaluated. Changing the assumption to the lowest value for any PHEV model found in the literature (12%) [22] for all PHEV models decreased the total first-year GHG emission reductions estimate by 10% for individuals and 6% for fleets. Shifting the assumption to the highest value for any PHEV model found in the literature (74.5%) [33] increased the first-year GHG reduction estimate by 6% for individuals and 5% for fleets.
Shifting the BEVx (BMW i3 REx) electric-VMT percentage assumption from 92%, as found in the literature [32], to 100% electric increased the total GHG emission reductions estimate by 0.1% for both individuals and fleets. Decreasing the primary assumption by the same magnitude (8 percentage points, to 84%) decreased the reduction estimate by 0.1% for individuals and 0.2% for fleets.

3.2.4. Sensitivity to Carbon Intensity of Fuels

The sensitivity of GHG reductions to fuel carbon intensities was tested by using varying inputs from the LCFS. This program has steadily decreasing annual benchmarks for gasoline CI based on a 2010 baseline [19], annual reports about changes to the CI of electricity used as a transportation fuel [20], and reports about the CI of other alternative transportation fuels every few years [14,19].
Sensitivity to the CI of gasoline was tested by updating the value from the LCFS regulation’s [19] CI baseline from 2010 (consistent with [11]) to the regulation’s CI benchmark for 2019 (10,799 g CO2e/gal). This decreased the total first-year emission reductions estimate by 9% for both individuals and fleets.
Sensitivity to the CI of electricity was tested by updating the value from that reported in the 2015 LCFS regulation [14] based on the grid mix in 2010 (consistent with [11]) to the latest annual CI metric update (299 g CO2e/kWh) [20], which uses the 2018 grid mix. This increased the total first-year emission reductions estimate by 8% for individuals and 9% for fleets. A high bound for the 2018 grid CI was also tested using a second source: EPA’s Emissions and Generation Resource Integrated Database (eGRID2018) [39]. EPA’s emission rate for the CAMX subregion (which roughly corresponds to the state of CA) is much lower than the LCFS (226 g CO2e/kWh). Using eGRID2018 increased total emission reductions by 15% for individuals and 17% for fleets compared to the primary estimates.
The LCFS regulation does not report one overall average hydrogen CI value, but rather a different value for each fuel pathway. The primary input follows recent CARB reporting [40] and assumes SB 1505-compliant gaseous hydrogen reformed on-site at the refueling station from a mix of 67% North American natural gas and 33% renewable biomethane from landfill gas. The primary CI values are from the 2018 LCFS regulation [19], which includes the highest (and therefore most conservative) hydrogen CI yet reported by the program. (Per personal communication with CARB, this is due to changes in how upstream emissions were evaluated from previous regulations, rather than an increase in the CI of hydrogen fuel over time.) The low-carbon scenario changed the assumption from a natural gas and biomethane mix to 100% biomethane (11,938 g CO2e/kg), which increased the total first-year emission reductions estimate by 0.1% for individuals and 0.2% for fleets. The high-carbon scenario tested a different LCFS fuel pathway for hydrogen from the 2015 LCFS regulation: central reforming of natural gas with liquefication and regasification steps (18,121 g CO2e/kg). This decreased the total first-year reduction estimate by 0.5% for individuals and 0.6% for fleets.
To assess the extent that electric grid and hydrogen improvements can increase emission reductions achievable from these vehicles, an extreme bounding scenario was calculated with 100% carbon-free electricity and hydrogen. This resulted in an increase of 38% for individuals and 44% for fleets compared to the primary first-year emission reduction estimates.

3.2.5. Sensitivity to Rebate Essentiality

Sensitivity of the Rebate-Essential reductions estimates for individuals to the Rebate Essentiality percentages was tested by adding and subtracting the margin of error for these percentages. The error margin was calculated at the 99% confidence level based on the sample proportion and sample size of each cohort (by technology type and survey edition). These errors ranged from 1.2 to 2.2 percentage points for PHEVs and BEVs and was equal to 6.0 percentage points for FCEVs. Ten percentage points were added to the margin of error to account for any unknown response bias (resulting from respondents answering questions inaccurately) or selection bias (resulting from the survey being voluntary). Adding and subtracting 11.2–16.0 percentage points from the Rebate Essentiality percentages changed the Rebate-Essential GHG reductions estimate for individuals by +/−19%.
The isolated effects of the tests described above on the total primary first-year GHG reduction estimates for individuals (~837,000) and fleets (~18,000), excluding bounding estimates and Rebate Essentiality, are presented in Figure 3.

3.2.6. Operation Lifetime

The primary estimates in this study consist of first-year reductions and reductions associated with the warranty life of each vehicle. For individuals, which comprise 97% of the vehicles analyzed, even warranty-life estimates are arguably still a conservative assumption of useful vehicle life for all technology types, depending on a balance of factors. On the one hand, if we assume a consistent annual VMT equal to those used for the first-year estimates of individuals (as detailed in Table 2), the warranty-life estimates represent 11 years of driving for PHEVs and 7–9 years for other vehicle types. Both are roughly equivalent to the 8/10 warranty years associated with the 100,000-/150,000-mile warranties but represent lower mileage than the expected useful life of the vehicles: predictive modeling by the National Renewable Energy Laboratory [41] indicates that batteries may last 12 to 15 years in moderate climates. Further, vehicles may have an even longer life if batteries are replaced, albeit with additional associated private costs if after the warranty period. On the other hand, vehicle use may decline with time and a modest number of rebated vehicles may leave the state upon change of ownership—which averages 6 years [42]. Lifetime GHG savings could be significantly impacted if vehicles leave the state, as the results in this work are based on the carbon intensity of fuel in California. Additionally, grid emissions are likely to decrease significantly over time as aggressive goals move California and other states toward high levels of renewable energy penetration (discussed more in Section 4.2.3).
Due to the uncertainty around vehicle calendar-year lifetime and the sensitivity of the GHG estimates to VMT, various operation lifetime options and their resulting impacts on the estimates are explored in comparison to the fixed-VMT “warranty life” approach. Savings over these alternate calendar-year lifetimes are estimated by multiplying first-year savings (855 thousand tCO2e total or 3.2 tCO2e per vehicle) by the number of lifetime years. A useful “vehicle life” can be conservatively characterized as the average age of vehicles in California, or 11.2 years [43]. These best-guess estimates are supplemented with “project-life” estimates (2.5 years, based upon CVRP terms and conditions) and “ownership-life” estimates (6 years) [42]. Finally, “project-comparison-life” estimates (15 years) are provided in order to better reflect typical expectations about vehicle longevity, the PHEV battery warranty calendar-year life, and National Renewable Energy Laboratory estimates for battery calendar-year life. Project-life estimates also facilitate comparisons with previous work [11] and between CVRP and other programs that make a 15-year vehicle life assumption. As presented in Table 3, the impact of quantifying GHG reductions over these alternate lifetimes compared to the primary warranty-life results ranges from −73% to +61% in reductions and −17% to +272% on rebate dollars per ton reduced.

4. Discussion

Estimates indicate that the average first-year GHG reductions resulting from a rebated vehicle is approximately 3.2 metric tons of CO2e emissions per vehicle. The average estimated reductions for BEVs (3.5 tons) is higher than that for PHEVs (2.8 tons). As displayed above in Figure 1, the difference in reductions between PHEVs and BEVs change when vehicles are evaluated over their warranty life, with PHEV savings (31 tons) surpassing those of BEVs (29 tons). This is due to the higher number of miles (150,000) covered by the battery warranty for PHEVs (required by California’s Zero-Emission Vehicle Standards [25,26]) compared to the standard 100,000-mile battery warranty offered by most manufacturers for other EV technology types [27]. As described in Section 2.2.2, first-year reductions better illustrate the variations across vehicle types and consumer types that result from differences in annual mileage estimates or carbon intensity of fuels, while warranty-life reductions can be viewed as reductions achieved over the time period the vehicles should very reasonably be expected to last.
There is also variability in Rebate-Essential reductions between vehicle technology types ranging from 45% of PHEV reductions, 58% of BEV reductions, and 67% of FCEV reductions associated with Rebate-Essential participants (see Appendix E for further detail). This variability closely resembles that of the Consumer Survey results on Rebate Essentiality, which are presented in Appendix D.
In addition to the impacts of technology type on GHG reductions, emission reductions also varied across the three rebate types. For example, first-year savings for fleets are much lower than individuals (Figure 2), primarily due to the lower annual VMT assumed for fleet vehicles (see Appendix B). However, the variability in VMT—and therefore most of the variability in emission reductions—diminishes when quantifying emissions over the warranty life of vehicles, as this period is based on the 100,000-/150,000-mile warranty associated with the vehicle technology and does not vary by consumer type. Differences are also seen in Rebate-Essential reductions between Standard Rebates for individuals and Increased Rebates for Low-/Moderate-Income Individuals (see Appendix E), with 53% of first-year reductions from Standard Rebates and 59% from those from Increased Rebates associated with Rebate-Essential participants. Fleets have not been invited to participate in the Consumer Survey and therefore are not analyzed for Rebate-Essential reductions.

4.1. Impact of Methodological Contributions

A rough assessment of the benefits of using project-specific data and the other contributions of this work indicates significant impact, as the following illustrates: when the results from this work are filtered for individual MY 2017 BEVs and PHEVs to facilitate comparisons with prior public work [11], they produce average per-mile GHG reductions 20–60% greater than previous estimates. Once scaled up by first-year VMT assumptions, they produce per-vehicle reductions roughly 35–45% greater than prior public work. This is illustrated in Table 4 below.

4.2. Limitations and Next Steps

It should be noted again that the GHG estimates in this work do not include time-variant carbon intensity or other factors that might impact results over time. Additionally, this work focuses on on-road and fuel life-cycle emissions and does not assess total vehicle life-cycle emissions (including those related to vehicle or battery production, maintenance and disposal) or any potential variability in emission rates due to climate effects. Further, this work uses individual vehicles as the unit of analysis and therefore behavior-change effects, such as vehicle substitution for certain trips, are not accounted for. Were they, some BEV emission savings would need to be reduced to account for conventional vehicle mileage used for trips not attempted in the BEV (particularly short-range BEVs prominent in early market commercialization). This need for a vehicle-substitution penalty is also expected to decline as BEV range capabilities improve. Research analyzing EV-owning household driving dynamics, such as that conducted by UC Davis [22], could be referenced to support an assessment of household-level impacts. Next steps to address these and other limitations are discussed further below.

4.2.1. Project Eligibility Changes and Extrapolation of Results to Future Time Periods

Because consumer and vehicle eligibility criteria change over time, care should be taken when extrapolating the results of this study to future time periods. As of 29 March 2016, higher-income consumers became ineligible to participate in CVRP, and on 1 November 2016, the eligibility criteria were adjusted. The income cap shifted participant demographics, with corresponding changes in vehicle preferences and adoption. As of 3 December 2019, an MSRP cap of USD 60,000 was instituted on all vehicles except FCEVs. The electric range requirement for PHEVs has also changed over time and is increasing to 30 miles in April 2021. For these reasons, the average emission reduction estimates associated with each participant and vehicle will likely change going forward from the period examined herein.

4.2.2. Additional Project Data to Utilize

Given the significant impact of using project-specific data and the other contributions of this work, further steps appear warranted. The analysis shows that emission reduction estimates are sensitive to deviations from assumed fuel consumption rates of the baseline fleet and VMT. Therefore, precision of the reduction estimate relies on the accuracy of these assumptions, revealing the opportunity to continue refinement with project-derived data.
To be consistent with [11] and to simplify the emission reduction calculations, it is assumed that had rebated-EVs not been acquired, participants would have purchased new gasoline vehicles instead. A more accurate baseline for evaluating the impact of the project could be calculated using a counterfactual fleet likely to exist in the project’s absence. This counterfactual fleet could be derived from answers to the CVRP Consumer Survey. Specifically, from questions about whether rebated EVs replaced a household vehicle and what would have occurred if rebates for EVs were not available. A partial assessment of the impact of incorporating this data was conducted in a previous version of this work [44] by assigning counterfactual fuel consumption rate values to the subset of survey respondents who indicated that they both replaced a vehicle with their rebated EV and would not have made a vehicle purchase had CVRP rebates not been available. This resulted in a slight decrease in the first-year emission reductions compared to the primary estimate, indicating vehicles replaced by this cohort may be less-emitting on average than new gasoline vehicles. In other words, any increase in first-year emission reductions resulting from accounting for older conventional replaced vehicles may be offset by a decrease in emission reductions resulting from EVs replacing other clean-technology vehicles. A complete assessment of the impact of replaced vehicles on results can be explored by incorporating the remaining survey respondents and continuing to refine the related fuel consumption inputs.
The primary VMT assumptions used in this analysis were average VMT findings from surveys of EV drivers in California [22,23], which may not be an accurate representation of all CVRP participants. Consumer Survey respondents are asked how many miles are included in their lease and how many total miles they have driven their vehicle so far (albeit not long after vehicle acquisition). Answers to these questions, along with vehicle purchase/lease dates and survey started/submitted dates, could be explored for their value as case- and model-specific VMT metrics. VMT inputs could also be improved by employing a time-variance when estimating multi-year savings to address changes in driving behavior such as possible decreasing annual VMT over time.
As described in Section 2.2.3, Rebate-Essential reductions for non-respondents were accounted for using the average Rebate Essentiality percentage by project era and technology type. Sensitivity to these assumptions were tested using a margin of error of +/- 10 percentage points to account for potential survey biases. Consumer demographics and other survey variables can be explored for use in predictive modeling of Rebate Essentiality to address biases and more accurately account for the rebate influence on survey non-respondents.
Rebate Essentiality represents the most conservative measure of rebate influence available in survey data. However, indicators of rebate importance provide a more nuanced measure of rebate influence. For example, survey respondents are asked, “How important was the state vehicle rebate (CVRP) in making it possible for you to acquire your clean vehicle?” and provided options ranging from “Not at all important” to “Extremely important.” Assessing “rebate-important” reductions would provide an additional measure of rebate influence between Rebate-Essential reductions and all rebated reductions.

4.2.3. Conservatisms to Address and Other Considerations

An assumption made to conservatively facilitate the emission reduction estimates was that electricity generation is properly represented by the 2015 LCFS regulation CI, which uses the average California electricity generation mix during 2010. This does not account for ongoing grid decarbonization as the state achieves its renewable-portfolio-standard (RPS) goals. Calculating emission reductions with the latest annual update of this metric, which uses grid inputs from 2018, resulted in an 8–9% increase in savings. Even this can be considered a conservative grid assumption for longer-term accounting (e.g., warranty-life) of the newer vehicles analyzed. Using time-variant CI data for all fuels and assessing marginal emissions are additional next steps, which may result in further GHG benefits depending on the net effect of grid and gasoline decarbonization as California simultaneously achieves its RPS and LCFS goals. Further, case-specific CI data can be deployed based on utility-specific electricity CI and survey data related to household solar energy use.
CVRP is likely to have positive spillover effects on the EV market, which may lead to greater long-run benefits than the emission reductions estimated in this report. However, as suggested by one anonymous reviewer of a precursor work and explored in [45], this approach does not account for any national effects that might arise were rebated EVs not purchased, causing automakers to adapt by increasing the fuel efficiency of their conventional vehicle offerings in order to maintain overall compliance with national fuel-economy/emissions standards. This could raise the fuel efficiency of the counterfactual fleet, thereby reducing the emission savings attributable to the project.
Finally, prior work [46] has indicated Monte Carlo analysis is useful in prioritizing inputs for refinement based upon repeated calculations that simultaneously and probabilistically vary several input values. This approach could also be used to determine a probability distribution of emissions from the baseline and rebated fleets.

5. Conclusions

Prior estimates of GHG emission reductions associated with rebated battery and plug-in hybrid electric vehicles in California were based upon average vehicle characterizations and intentionally conservative as a starting point for future refinement. This work aims to inform that process by utilizing project-derived and/or case-specific data and other enhancements to create a more detailed picture of the GHG impacts of 269,902 EV rebates disbursed through August 2018. Specifically, this study employed model- and model-year-specific fuel consumption rates and PHEV model-specific electric-VMT percentages to estimate rebated-vehicle emissions. California-sales-weighted average fuel consumption rate values were created for each model year of baseline gasoline vehicles for comparison. It also uses disaggregated and weighted project survey data characterizing rebate influence to estimate both rebated reductions associated with the project and Rebate-Essential reductions attributable to the project.
Reductions from CVRP-rebated PHEVs, BEVx vehicles, BEVs, and FCEVs over the first year of vehicle operation are estimated to be approximately 855,000 metric tons of CO2-equivalent emissions, roughly 54% of which are classified as Rebate Essential. When scaled up to represent operation over a 100,000-/150,000-mile warranty life, total emission savings increase to 7.9 million metric tons.
A noteworthy observation relates to cost-effectiveness: comparing the warranty-life benefit of 7.9 million metric tons of GHG emissions reduced to the USD 603 million in corresponding rebates results in an estimate of roughly USD 76 of state rebate incentives per ton reduced over the 100,000-/150,000-mile warranty period, or about 13 kg of CO2e saved over that period per incentive dollar invested. However, there is considerable uncertainty in these estimates which are heavily influenced by the generally conservative assumptions in this study.
First-year and warranty-life reductions average 2.8 and 31 tons per PHEV, 3.1 and 28 tons per BEVx, 3.5 and 29 tons per BEV, and 2.5 and 20 tons per FCEV, respectively. Compared to prior work, this approach was found to produce average first-year GHG reductions per vehicle that are roughly 35–45% greater, indicating the importance of ongoing refinement with more project-specific and detailed data. Sensitivity analyses highlight significant remaining uncertainty and indicate priority attention should be given to the fuel efficiency of the baseline (avoided) vehicle and assumed VMT. Unknown vehicle ownership and operational timeframes present further challenges in estimating lifetime emission savings. Additional unexplored opportunities include analyzing the effect of time-variant factors and counterfactual survey data.

Author Contributions

N.P.: Methodology, software, validation, formal analysis, investigation, data curation, writing—original draft preparation, writing—review and editing, visualization, project administration. B.D.H.W.: Conceptualization, methodology, validation, investigation, resources, data curation, writing—original draft preparation, writing—review and editing, visualization, supervision, project administration, funding acquisition. All authors have read and agreed to the published version of the manuscript.

Funding

This research was funded by a grant for the administration of the Clean Vehicle Rebate Project, a program of the California Air Resources Board (G17-CVRP-01, G18-CVRP-01, G19-CVRP-01). The funders were not involved in the conduct of the research.

Informed Consent Statement

Program participants agreed to the collection and anonymized use of data as a term and condition of program participation.

Data Availability Statement

Data analyzed for this study were collected as part of the administration of the Clean Vehicle Rebate Project and are not available in raw form to protect participant confidentiality and sensitive information. However, portions of the data are available for free download via program dashboards, as are a variety of analyses that shed additional light on its collection and qualities: http://cleanvehiclerebate.org (accessed 24 June 2021).

Acknowledgments

This study was conducted by the Center for Sustainable Energy to inform the Clean Vehicle Rebate Project, and we thank CARB staff for the opportunity to contribute to the conversation. However, it does not necessarily represent the views of the California Air Resources Board. Nor does it represent a final determination for project-reporting purposes. The authors extend special thanks to James Tamerius for analytical guidance and editorial support. The authors also thank Keir Havel and Michelle Jones for providing research assistance, and others who provided feedback.

Conflicts of Interest

The authors declare no conflict of interest.

Abbreviations

BEVbattery-electric vehicle
BEVxrange-extended battery-electric vehicle
CACalifornia
CARBCalifornia Air Resources Board
CIcarbon intensity
CO2ecarbon dioxide-equivalent
CVRPClean Vehicle Rebate Project
EPAEnvironmental Protection Agency
EVelectric vehicle
FCEVfuel-cell electric vehicle
ggram
galgallon
GHGgreenhouse-gas
hwyhighway
kgkilogram
kWhkilowatt-hour
LCAlife-cycle assessment
LCFSLow Carbon Fuel Standard
LDVlight-duty vehicle
LMIlow-/moderate-income
MPGmiles per gallon
MYmodel year
PHEVplug-in hybrid electric vehicle
RPSrenewable portfolio standard
tCO2emetric tons of carbon dioxide-equivalent
VMTvehicle miles traveled

Appendix A

As detailed in Table 2 and discussed further in Section 3.2.1, baseline-vehicle fuel consumption rates are MY-specific. MYs 2011–2018 are comprised of California-sales-weighted averages based on the EPA-adjusted fuel economy for the 30 top-selling new gasoline models (which include over 50% of sales for each model year). Vehicles within each MY were assessed at the model-level. For models with multiple trims or series with varying fuel efficiency within a given MY, the most efficient (and therefore most conservative) fuel economy value was used in the sales-weighting calculations.
For MYs 2009–2010, for which sales data were not available, EPA-adjusted U.S.-production-weighted car averages are used. These were found to represent average California fuel economy more closely than car-and-truck averages. Table A1 presents the baseline-vehicle fuel economy values from which fuel consumption rates were derived, with a comparison to the U.S.-production averages for cars (used for MYs 2009–2010) and for cars and trucks (used in sensitivity analysis). Fuel economy values in MPG were converted to fuel consumption rates in gallons per mile for analysis.
Table A1. Baseline-Vehicle Fuel Economy Compared with U.S.-Production-Weighted Avg. Fuel Economy.
Model YearBaseline VehicleU.S.-Production-Weighted Avg. Fuel Economy [31,37]
Fuel Economy (MPG)DescriptionCarCar and Truck
Value
(MPG)
Diff. from
Baseline
Value
(MPG)
Diff. from Baseline
200925.4U.S.-production-weighted avg. (car) [31]25.4n.a.22.4−12%
201025.825.8n.a.22.6−12%
201125.1CA-sales-weighted avg. for the 30 top-selling new gasoline
models (calculations using data from [21,30])
25.41%22.3−11%
201227.926.9−3%23.6−15%
201327.927.7−1%24.2−13%
201428.227.6−2%24.1−15%
201528.428.2−1%24.6−13%
201628.728.5−1%24.7−14%
201728.029.24%25.2−11%
201828.829.94%25.4−12%
2019 128.8----
1 Model year 2018 value used due to limited 2019 data availability.

Appendix B

Due to limited public information about the driving characteristics of EVs in fleets, annual fleet VMT was inferred from federal fleet reporting for all passenger vehicles and the VMT characteristics of non-fleet EVs. Fleet PHEVs are characterized by the average annual VMT of all federal fleet passenger vehicles. Annual VMT for the other EV categories, which are more likely to have different usage from the average vehicle, are derived by scaling the average overall federal fleet value (used for PHEVs) down by the same magnitude observed for individuals.
Table A2. Description of Annual VMT Calculations for Fleets.
Technology TypeFleetsIndividuals
Annual VMTDescriptionAnnual VMT
PHEV7768Average of FY 2013–2017 federal fleet passenger vehicle annual VMT in [24]13,472
BEVx, Short Range BEV11,366Fleet PHEV VMT decreased by the magnitude observed for individuals: 9207 × 11 , 366 13 , 472   11,366
Long Range BEV9196Fleet PHEV VMT decreased by the magnitude observed for individuals: 9207 × 13 , 456 13 , 472   13,456
FCEV13,456Fleet PHEV VMT decreased by the magnitude observed for individuals: 9207 × 12 , 445 13 , 472   12,445

Appendix C

As described in Section 2.2.1, for PHEVs and BEVx vehicles (which use both electricity and gasoline as fuel) model-specific electric-VMT factors are used to assign fractions of total travel to electricity. Following the general approach in previous work [47], in cases where on-road studies of driving behavior have been conducted for specific rebated models, the electric-VMT findings from those studies are used (or averages of findings, for models with more than one study). For models that have not been studied, electric-VMT percentages are determined as a function of electric range, derived from plotting electric-VMT findings from studied models by their corresponding electric ranges. This plot, function, and relationship between the variables are presented in Figure A1.
Figure A1. PHEV and BEVx Electric-VMT.
Energies 14 04640 g0a1

Appendix D

The weighted percentage of respondents from each Consumer Survey edition who indicated that they would not have purchased their EV without the CVRP rebate are presented in Table A3 below. These percentages reflect the proportion of GHG reductions categorized as “Rebate-Essential reductions” for project participants that did not respond to the Consumer Survey.
Table A3. Weighted Rebate Essentiality by Survey Edition and Technology Type.
Technology Type2013–15 Edition2015–16 Edition2016–17 Edition
PHEV41%47%47%
BEV/BEVx50%61%64%
FCEVn.a.n.a.67%
Note: Values are specific to the dataset used in this analysis and may not align with CVRP Rebate Essentiality percentages reported elsewhere.

Appendix E

Table A4. GHG Reduction Estimates by Technology Type and Quantification Period.
Technology TypeTotal Rebated
Reductions
thousand tCO2e)
Per-Vehicle
Reductions
(tCO2e)
Total Rebate-Essential
Reductions
(Individuals only,
thousand tCO2e)
PHEV(
N = 104,583)
Y1 = 289
WL = 3235
Y1 = 2.8
WL = 31
Y1 = 127 (45%)
WL = 1418 (45%)
BEVx
(N = 6559)
Y1 = 21
WL = 183
Y1 = 3.1
WL = 28
Y1 = 12 (61%)
WL = 107 (61%)
BEV
(N = 154,184)
Y1 = 534
WL = 4432
Y1 = 3.5
WL = 29
Y1 = 301 (58%)
WL = 2471 (58%)
FCEV
(N = 4576)
Y1 = 11
WL = 93
Y1 = 2.5
WL = 20
Y1 = 8 (67%)
WL = 60 (67%)
All
(N = 269,902)
Y1 = 855
WL = 7944
Y1 = 3.2
WL = 29
Y1 = 448 (54%)
WL = 4057 (53%)
Note: Values may not sum to totals due to rounding. Y1 = first year of vehicle operation, WL = 100,000-/150,000-mile warranty life.
Table A5. GHG Reduction Estimates by Technology Type and Quantification Period.
Technology TypeTotal Rebated
Reductions
(thousand tCO2e)
Per-Vehicle
Reductions
(tCO2e)
Total Rebate-Essential
Reductions
(Individuals Only,
Thousand tCO2e)
Standard Rebatefor
Individuals
(N = 251,960)
Y1 = 805
WL = 7416
Y1 = 3.2
WL = 29
Y1 = 429 (53%)
WL = 3885 (52%)
Low-/Moderate-Income Increased Rebate
for Individuals
(N = 9859)
Y1 = 32
WL = 300
Y1 = 3.2
WL = 30
Y1 = 18 (59%)
WL = 172 (57%)
Fleet Rebate
(N = 8083)
Y1 = 18
WL = 228
Y1 = 2.2
WL = 28
n.a.
All
(N = 269,902)
Y1 = 855
WL = 7944
Y1 = 3.2
WL = 29
Y1 = 448 (54%)
WL = 4057 (53%)
Note: Values may not sum to totals due to rounding. Y1 = first year of vehicle operation, WL = 100,000-/150,000-mile warranty life.

References

  1. Nealer, R.; Hendrickson, T.P. Review of Recent Lifecycle Assessments of Energy and Greenhouse Gas Emissions for Electric Vehicles. Curr. Sustain. Renew. Energy Rep. 2015, 2, 66–73. [Google Scholar] [CrossRef] [Green Version]
  2. Marmiroli, B.; Messagie, M.; Dotelli, G.; Van Mierlo, J. Electricity generation in LCA of electric vehicles: A review. Appl. Sci. 2018, 8, 1384. [Google Scholar] [CrossRef] [Green Version]
  3. Lattanzio, R.K.; Clark, C.E. Environmental Effects of Battery Electric and Internal Combustion Engine Vehicles; Congressional Research Service: Washington, DC, USA, 2020.
  4. National Research Council. Transitions to Alternative Vehicles and Fuels; National Academies Press: Washington, DC, USA, 2013. [Google Scholar] [CrossRef]
  5. Babaee, S.; Nagpure, A.S.; Decarolis, J.F. How much do electric drive vehicles matter to future U.S. emissions? Environ. Sci. Technol. 2014, 48, 1382–1390. [Google Scholar] [CrossRef]
  6. Archsmith, J.; Kendall, A.; Rapson, D. From Cradle to Junkyard: Assessing the Life Cycle Greenhouse Gas Benefits of Electric Vehicles. Res. Transp. Econ. 2015, 52, 72–90. [Google Scholar] [CrossRef] [Green Version]
  7. Lutsey, N. Global Climate Change Mitigation Potential from a Transition to Electric Vehicles; ICCT: Washington, DC, USA, 2015. [Google Scholar]
  8. National Academies of Sciences, Engineering, and Medicine. Zero Emission Vehicles: Forecasting Fleet Scenarios and their Emissions Implications; The National Academies Press: Washington, DC, USA, 2019. [Google Scholar] [CrossRef]
  9. Brown, A.L.; Sperling, D.; Austin, B.; DeShazo, J.; Fulton, L.; Lipman, T.; Murphy, C.; Daniel Saphores, J.; Tal, G. Driving California’s Transportation Emissions to Zero; UC Office of the President: University of California Institute of Transportation Studies: Oakland, CA, USA, 2021. [Google Scholar] [CrossRef]
  10. Gohlke, D.; Zhou, Y. Assessment of Light-Duty Plug-In Electric Vehicles in the United States, 2010–2019; United States Department of Energy Office of Scientific and Technical Information (OSTI): Oak Ridge, TN, USA, 2020. [CrossRef]
  11. California Air Resources Board. Proposed Fiscal Year 2017-18 Funding Plan for Clean Transportation Incentives. 2017. Available online: https://ww2.arb.ca.gov/sites/default/files/classic/msprog/aqip/fundplan/proposed_1718_funding_plan_final.pdf (accessed on 30 July 2018).
  12. California Air Resources Board. EMFAC2014 Web Database. 2014. Available online: https://www.arb.ca.gov/emfac/2014/ (accessed on 30 July 2018).
  13. California Air Resources Board. LCFS Pathway Certified Carbon Intensities. Available online: https://www.arb.ca.gov/fuels/lcfs/fuelpathways/pathwaytable.htm (accessed on 30 July 2018).
  14. California Air Resources Board. Low Carbon Fuel Standard Regulation. 2015. Available online: https://www.arb.ca.gov/regact/2015/lcfs2015/lcfsfinalregorder.pdf (accessed on 30 July 2018).
  15. California Air Resources Board. Proposed Fiscal Year 2016–2017 Funding Plan for Low Carbon Transportation and Fuels Investments and the Air Quality Improvement Program, Appendix A—Emission Reductions: Quantification Methodology. 2016. Available online: https://www.arb.ca.gov/msprog/aqip/fundplan/proposed_fy16-17_fundingplan_appa.pdf (accessed on 30 July 2018).
  16. Johnson, C.; Williams, B. Characterizing Plug-In Hybrid Electric Vehicle Consumers Most Influenced by California’s Electric Vehicle Rebate. Transp. Res. Rec. 2017, 2628, 23–31. [Google Scholar] [CrossRef]
  17. Williams, B.; Anderson, J. Strategically Targeting Plug-in Electric Vehicle Rebates and Outreach Using Characteristics of “Rebate-Essential” Consumers in 2016–2017. In Proceedings of the 31st International Electric Vehicles Symposium, Kobe, Japan, 30 September–3 October 2018. [Google Scholar]
  18. Clean Vehicle Rebate Project. Income Eligibility. Available online: https://cleanvehiclerebate.org/eng/income-eligibility (accessed on 3 December 2020).
  19. California Air Resources Board. Low Carbon Fuel Standard Regulation. 2018. Available online: https://www.arb.ca.gov/regact/2018/lcfs18/frolcfs.pdf (accessed on 30 May 2019).
  20. California Air Resources Board. Low Carbon Fuel Standard Annual Updates to Lookup Table Pathways. 2020. Available online: https://ww3.arb.ca.gov/fuels/lcfs/fuelpathways/comments/tier2/elec_update.pdf?_ga=2.23020219.126207149.1587598652-1818811838.1579023467 (accessed on 4 May 2020).
  21. Fuel Economy Data. United States Department of Energy and United States Environmental Protection Agency. Available online: https://www.fueleconomy.gov/feg/download.shtml (accessed on 30 July 2018).
  22. Tal, G.; Raghavan, S.S.; Karanam, V.C.; Favetti, M.P.; Sutton, K.M.; Lee, J.H.; Nitta, C.; Kurani, K.; Chakraborty, D.; Michael, N.; et al. Advanced Plug-in Electric Vehicle Travel and Charging Behavior Final Report; California Air Resources Board: Sacramento, CA, USA, 2019. [Google Scholar]
  23. Hardman, S. Understanding the Early Adopters of Fuel Cell Vehicles; California Department of Transportation: Sacramento, CA, USA, 2019. [CrossRef]
  24. U.S. General Services Administration. FY 2017 Federal Fleet Report. 2018. Available online: https://www.gsa.gov/policy-regulations/policy/vehicle-management-policy/federal-fleet-report (accessed on 15 March 2019).
  25. Zero-Emission Vehicle Standards for 2009 through 2017 Model Year Passenger Cars, Light-Duty Trucks, and Medium-Duty Vehicles, 13 CCR § 1962.1. Available online: https://ww2.arb.ca.gov/sites/default/files/2019-07/cleancomplete%20lev-ghg%20regs%2010-19.pdf (accessed on 17 April 2020).
  26. Zero-Emission Vehicle Standards for 2018 and Subsequent Model Year Passenger Cars, Light-Duty Trucks, and Medium-Duty Vehicles, 13 CCR § 1962.2. Available online: https://ww2.arb.ca.gov/sites/default/files/2019-07/cleancomplete%20lev-ghg%20regs%2010-19.pdf (accessed on 17 April 2020).
  27. United States Office of Energy Efficiency and Renewable Energy. Electric Car Safety, Maintenance, and Battery Life. Available online: https://www.energy.gov/eere/electricvehicles/electric-car-safety-maintenance-and-battery-life#:~:text=Like%20the%20engines%20in%20conventional,5%20years%20or%2060%2C000%20miles. (accessed on 3 June 2020).
  28. PluginCars.com. All the News, Reviews, Guides and Reports on Electric Cars. Available online: https://www.plugincars.com/archives (accessed on 15 February 2018).
  29. Car and Driver. Reviews. Available online: https://www.caranddriver.com/reviews/ (accessed on 15 February 2018).
  30. Monthly New Vehicle Registration Data. IHS Markit. 2018. Available online: https://ihsmarkit.com/index.html (accessed on 17 September 2018).
  31. United States Environmental Protection Agency. Light-Duty Automotive Technology, Carbon Dioxide Emissions, and Fuel Economy Trends: 1975 through 2017. 2018. Available online: https://nepis.epa.gov/Exe/ZyPDF.cgi?Dockey=P100TGDW.pdf (accessed on 30 July 2018).
  32. California Air Resources Board. California’s Advanced Clean Cars Midterm Review, Appendix G: Plug-in Electric Vehicle In-Use and Charging Data Analysis. 2017. Available online: https://ww2.arb.ca.gov/sites/default/files/2020-01/appendix_g_pev_in_use_and_charging_data_analysis_ac.pdf (accessed on 30 July 2018).
  33. Idaho National Laboratory. Plug-in Electric Vehicle and Infrastructure Analysis. 2015. Available online: https://inldigitallibrary.inl.gov/sites/sti/sti/6799570.pdf (accessed on 30 July 2018).
  34. Carlson, B. Electric Vehicle Mile Traveled (eVMT): On-Road Results and Analysis. 2015. Available online: http://energy.gov/sites/prod/files/2015/07/f24/vss171_carlson_2015_p.pdf (accessed on 30 July 2018).
  35. Duhon, A.; Sevel, K.; Tarnowsky, S.; Savagian, P. Chevrolet Volt Electric Utilization. SAE Int. J. Altern. Powertrains 2015, 4, 269–276. [Google Scholar] [CrossRef]
  36. Boston, D.; Werthman, A. Plug-in Vehicle Behaviors: An analysis of charging and driving behavior of Ford plug-in electric vehicles in the real world. World Electr. Veh. J. 2016, 8, 926–935. [Google Scholar] [CrossRef] [Green Version]
  37. United States Environmental Protection Agency. Light-Duty Automotive Technology, Carbon Dioxide Emissions, and Fuel Economy Trends: 1975 through 2018. 2019. Available online: https://www.epa.gov/automotive-trends/download-automotive-trends-report#Report-Tables (accessed on 27 August 2019).
  38. Nicholas, M.A.; Tal, G.; Turrentine, T.S. Advanced Plug-in Electric Vehicle Travel and Charging Behavior Interim Report. 2017. Available online: https://itspubs.ucdavis.edu/index.php/research/publications/publication-detail/?pub_id=2692 (accessed on 30 July 2018).
  39. United States Environmental Protection Agency. eGRID Summary Tables 2018. 2020. Available online: https://www.epa.gov/sites/production/files/2020-01/documents/egrid2018_summary_tables.pdf (accessed on 1 April 2020).
  40. California Air Resources Board. Proposed Fiscal Year 2019-20 Funding Plan for Clean Transportation Incentives. 2019. Available online: https://ww2.arb.ca.gov/sites/default/files/2019-09/fy1920fundingplan-appa.pdf (accessed on 4 May 2020).
  41. National Renewable Energy Laboratory. Predictive Models of Li-Ion Battery Lifetime. 2014. Available online: https://afdc.energy.gov/fuels/electricity_benefits.html (accessed on 4 May 2020).
  42. Demuro, D. Buying a Car: How Long Can You Expect a Car to Last? 2019. Available online: https://www.autotrader.com/car-shopping/buying-car-how-long-can-you-expect-car-last-240725 (accessed on 4 February 2021).
  43. Auto Alliance. In Your State: State Facts. Available online: https://autoalliance.org/in-your-state/CA (accessed on 31 March 2020).
  44. Pallonetti, N.; Williams, B. Exploratory Estimation of Greenhouse-Gas Emission Reductions Associated with California’s Clean Vehicle Rebate Project. In Proceedings of the Transportation Research Board 2019 Annual Meeting, Washington, DC, USA, 13–17 January 2019. [Google Scholar]
  45. Jenn, A.; Azevedo, I.M.L.; Michalek, J.J. Alternative Fuel Vehicle Adoption Increases Fleet Gasoline Consumption and Greenhouse Gas Emissions under United States Corporate Average Fuel Economy Policy and Greenhouse Gas Emissions Standards. Environ. Sci. Technol. 2016, 50, 2165–2174. [Google Scholar] [CrossRef] [PubMed]
  46. Williams, B.; DeShazo, J. Pricing Workplace Charging: Financial Viability and Fueling Costs. Transp. Res. Rec. J. Transp. Res. Board 2014, 2454, 68–75. [Google Scholar] [CrossRef] [Green Version]
  47. California Air Resources Board. Assessment of CARB’s Zero-Emission Vehicle Programs Per Senate Bill 498. 2020. Available online: https://ww3.arb.ca.gov/programs/zev/SB-498-Report-072320.pdf (accessed on 3 December 2020).
Figure 1. Per-Vehicle GHG Reduction Estimates by Technology Type and Quantification Period.
Energies 14 04640 g001
Figure 2. Per-Vehicle GHG Reduction Estimates by Rebate Type and Quantification Period.
Energies 14 04640 g002
Figure 3. Per-Vehicle GHG Reduction Estimates by Rebate Type and Quantification Period.
Energies 14 04640 g003
Table 1. Consumer Survey Dates.
2013–15 Edition2015–16 Edition2016–17 EditionTotal
PEVsFCEVs
Responsesn = 19,361n = 11,577n = 8957n = 410n = 40,305
Weighted to RepresentN = 91,081N = 45,694N = 46,838N = 1749N = 185,362
Vehicle Purchase/LeasesSeptember 2012–May 2015April 2015–May 2016May 2016–May 2017December 2010–May 2017PEVs: September 2012–May 2017
FCEVs: December 2010–May 2017
Additional Participants AssignedN = 11,916N = 2052N = 59,820N = 2669N = 76,457
Total Participants
Assigned
N = 102,997N = 47,746N = 106,658N = 4418N = 261,819
Assigned Purchase/Lease DatesMarch 2009–May 2015April 2015–May 2016May 2016–August 2018June 2010–August 2018March 2009–August 2018
Table 2. Input Values and Sources.
CharacteristicRebated VehicleBaseline Vehicle
Model year
Source: rebate application
Individuals = {MY2009 … MY2019}
Fleets = {MY2009 … MY2018}
Same as paired rebated vehicle, consistent with [11]
Drivetrain category
Source: rebate application
{PHEV, BEVx, BEV, FCEV}{Gasoline}, consistent with [11]
Fuel life-cycle carbon intensity
Source: calculations using data from [14] or [19]
{Gasoline = 11,518 g CO2e/gal;
Electricity = 379 g CO2e/kWh;
Hydrogen = 13,393 g CO2e/kg}
{11,518 g CO2e/gal}
Fuel consumption rate
Sources: [21,28], or [29] for rebated vehicles; calculations using data from [21,30] or [31] for baseline vehicles
Combined city/hwy EPA-adjusted (when available) rating for specific model/MYCA-sales-weighted average of combined city/hwy EPA-adjusted ratings for 30 top-selling light-duty gasoline models in MYs 2011–2018 (MY 2018 value used for partial MY 2019 data); EPA-adjusted U.S. production average for cars in MYs 2009, 2010 (see Appendix A)
Annual vehicle miles traveled (VMT)
Sources: [22,23] for individuals; calculations using data from [22,23,24] for fleets (see Appendix B)
Individuals = {PHEV = 13,472;
BEVx, Short range BEV (<200 mi.) = 11,366;
Long range BEV (≥200 mi.) = 13,456;
FCEV = 12,445}
Fleets = {PHEV = 9207;
BEVx, Short range BEV (< 200 mi.) = 7768;
Long range BEV (≥200 mi.) = 9196;
FCEV = 8505}
Same as paired rebated vehicle,
consistent with [11]
Lifetime VMT
Sources: [25,26] for PHEV; [27] for other drivetrain categories
Individuals & Fleets = {PHEV = 150,000;
BEVx, Short range BEV, Long range BEV, FCEV = 100,000}
Same as paired rebated vehicle,
consistent with [11]
PHEV electric-VMT percentage
Sources: [22,32] or calculations using data from [21,22,32,33,34,35,36]
Model-/MY-specific percentage from literature (when available) or calculated as a function of electric range (see Appendix C)n.a.
BEVx (BMW i3 REx) electric-VMT percentageSource: [32]{92% electric fuel}n.a.
Rebate Essentiality
Source: Consumer Survey data (unweighted direct responses
and weighted averages)
{1,0} for those with survey responses; for others, used the average by technology type for the corresponding project era/survey edition, ranging 41.3–66.9%[applies to case as a whole; emission reductions counted are proportional to Rebate Essentiality value (e.g., case excluded if not Rebate Essential)]
Table 3. Lifetime Assumption Comparison.
Lifetime
Assumption
Total Rebated
Reductions
(thousand tCO2e)
Per-Vehicle
Reductions
(tCO2e)
Rebate Dollars Per tCO2e
Battery Warranty Life794429.4USD 76
2.5-Year Project Life2137
(−73%)
7.9
−73%)
USD 282
(+272%)
6-Year Ownership Life5128
(−35%)
19.0
(−35%)
USD 118
(+55%)
11.2-Year Vehicle Life9573
(+21%)
35.5
(+21%)
USD 63
(−17%)
15-Year Projectlef
Comparison Life
12,821
(+61%)
47.5
(+61%)
USD 47
(−38%)
Note: Battery-warranty life estimates reflect 150,000 miles of use per PHEV and 100,000 miles of use for other EVs. Calendar-year lifetimes are calculated as multiples of first-year savings estimates of 855 thousand tCO2e total or 3.2 tCO2e per vehicle.
Table 4. Comparison of Model Year 2017 GHG Reductions for Individuals.
Technology Type2017 Estimates for FY 2017–18 [11]
(MY 2017)
New Estimates for Life of Project
(MY 2017 subset)
Avg. Reductions
Per Mile
(grams CO2e)
Avg. First-Year
Reductions Per
Vehicle (tCO2e)
Avg. Reductions
Per Mile
(grams CO2e)
Avg. First-Year
Reductions Per
Vehicle (tCO2e)
PHEV1422.1228(+60%)3.1(+45%)
BEV2472.7296(+20%)3.7(+35%)
Publisher’s Note: MDPI stays neutral with regard to jurisdictional claims in published maps and institutional affiliations.

