Abstract
The use of photovoltaic (PV) energy in combination with heat pump systems for heating and cooling of residential buildings can lead to renewable energy self-consumption, reducing the energy required from the grid and the carbon footprint of the building uses. However, energy storage technologies and control strategies are essential to enhance the self-consumption level. This paper proposes and analyzes a new control strategy for the operation of a modulating air-source heat pump, based on the actual PV availability. The solar energy surplus is stored as thermal energy by the use of water tanks and the activation of the thermal capacitance of the building. The efficacy of the control strategy is evaluated considering different rule-based strategies, and different boundary conditions. The effect of climate data, building insulation level and thermal inertia are investigated and compared. The results show the efficacy of the proposed strategy to decrease up to 17% the amount of electricity purchased from the grid and to increase the self-consumption by 22%, considering a high-insulated building in Bolzano, Northern Italy. The thermal mass activation is found effective to increase the self-consumption of the system. Nonetheless, the achievable energy reduction depends largely on the building characteristics and the boundary conditions.
1. Introduction
Around 40% of the European final energy consumption is related to building use [1]. Specifically, the residential sector is responsible for 25% of the total building consumption [2]. In 2017, Eurostat reported a renewable energy share for heating and cooling applications in the residential sector of around 19.5% in the European countries [3]. Increasing the use of electricity to supply heating and cooling in buildings is a strategic solution to increase the share of renewable energy in the sector and to reduce the carbon footprint of buildings. For this purpose, one of the most promising and largely spreading solutions is the installation of heat pump systems coupled with photovoltaic plants [4]. Heat pumps can provide space heating, space cooling and domestic hot water to the building with high levels of performance by using electricity. A certain level of self-consumption is assured by the direct use of the produced PV energy for the heat pump operation. Nevertheless, the mismatch between the solar production (during the day) and the energy demand of the building (mostly during the evening) is one of the main challenges to reach a high share of self-consumption. The net zero energy building (NZEB) concept was based on the idea of using the grid as a virtual battery. However, the grid has a limited capacity and this solution can work for a limited number of buildings. Considering the increasing number of PV installation, this solution is becoming problematic because it can lead to a lack of stability and reliability of the grid supply. For this reason, the direct use of solar energy on-site is a preferable solution. The use of heat pump units leads to an increase of solar energy self-consumption and reduces the impact of the produced PV energy on the grid. Different solutions have been studied to increase the self-consumption rate of the system, such as energy storage and control strategies to match the building load to the solar availability [5,6]. Energy storage systems work collecting the solar energy in the form of thermal or electric energy and releasing it when the system requires it. The use of thermal storage brings several issues about energy losses, space availability and the decrease of the heat pump system performance while increasing the temperature of the storage. Electric energy storage can collect energy with lower losses and higher density, but the installation cost is an important aspect to consider when evaluating the feasibility of the system [7]. For these reasons, the potential of control strategies to increase the self-consumption of solar energy becomes very attractive to reduce the need for electric energy storage. Several control strategies have been defined, such as direct-load controls, load limiters and time-of-use pricing [8]. These strategies can be classified in two main categories: rule-based controls (RB) and model predictive controls (MPC). In the first case, the control system works using rule-based algorithms that regulate the system operation depending on certain trigger parameters. MPCs require more advanced algorithms based on forecast models for weather and/or electricity price. Some of these strategies, mainly rule-based controls, can be implemented in the system using low-cost controllers, hence limiting the installation costs [9].
Heat pumps are characterized by a great potential for load flexibility and they are a promising target for the application of different control strategies. Several authors analyzed the impact of different control strategies for PV coupled heat pump systems. Different design approaches can be identified in these studies, depending on the objective of the control strategy. For example, different objectives such as peak-load shaving, energy cost reduction or self-consumption maximization imply different control approaches, and the solutions might be contradictory [10]. Arteconi et al. [11] studied an air-source heat pump system integrated with a thermal storage in the UK. A control strategy was implemented to shift the heat pump operation out of the peak hours (from 16:00 to 19:00). The results showed no significant reduction of energy consumption, but the benefit of shifting the heat pump operation was found in a smaller operation cost. Salpakari et al. [12] investigated a control strategy for a ground-source heat pump considering a case study in Finland. Two different strategies were developed towards cost-optimal and self-consumption maximization solutions. The system was equipped with a thermal storage, an electric battery and a number of shiftable loads (electric appliances). The results showed an energy saving potential in the range of 13–25%. The use of load shifting was found less effective than the use of battery storage. Dentel et al. [13] proposed a control strategy for a modulating ground-source heat pump in a house complex in Germany. The heat pump (HP) operation was regulated depending on the PV availability and thermal and electric storage were integrated in the system. The results show an increase of self-consumption of 21%, decreasing the energy required from the grid by 13% and reducing by 10% the use of the battery. Moreover, the peak loads required from the grid were reduced by 24% using the proposed control strategy. The use of variable speed heat pump units is a promising solution, because of higher performance levels at part-load operation [14,15]. Moreover, the heat pump output can be modulated according to the solar energy availability to optimize self-consumption.
A number of studies showed the efficacy of exploiting the thermal inertia of the building to increase the self-consumption of solar energy. The energy saving potential related to the thermal inertia of high-efficiency buildings has been widely studied [16]. Nevertheless, a recent interest in using thermal inertia actively as energy storage showed promising results. Bee et al. [9] defined a DSM control strategy to store the PV surplus within the system thermal capacity and the building thermal capacitance (a.k.a. virtual battery). In the study, the control strategy operated by varying the set-points of the water tanks and the indoor air temperature during PV overproduction periods. The strategy was able to increase the self-consumption of the system from 7% up to 60%. Toradmal et al. [17] assessed the effect of exploiting the thermal mass of the building and thermal storage to store a higher amount of solar energy while minimizing the size of the battery and the costs of the system. The study considers two cases, with a ground-source heat pump and an air-source heat pump. The results show a larger PV energy utilization with increased room temperature variation interval. In this case, the heat pump is characterized by a more flexible operation. With a 4 kWp PV plant the authors found a share of on-site solar energy utilization of 47.9% for the ground-source HP and 49.5% for the air-source HP. For all the PV sizes, the air-source heat pump reaches higher shares of solar energy, as it requires more energy than the ground-source HP. In general, they found an increase of 15–25% of PV energy utilization when the room temperature is allowed to change by ±0.5–2 °C. Sikder [18] investigated the use of thermal inertia in a residential building to foster load shifting to reduce the energy cost. The system was controlled in order to preheat the building during the day when PV was available, to decrease the heating demand in the evening. Depending on the set-point temperature the systems was able to reach different cost saving levels. Hewitt et al. [19] assessed that varying the indoor temperature by ±2 °C can ensure a 3-h storage of energy in a building in the UK. Psimopoulos et al. [20] presented a control strategy that works increasing the set points of a selected part of the building (i.e., living room and bathroom) up to 22 °C. The same study investigated the impact of boundary conditions on the performance of the system, such as climate, occupancy and appliances. The authors focused on the economic aspects. An overview of the most relevant analyzed studies can be found in Table 1.

Table 1.
Previous studies on rule-based (RB) control strategies for heat pump coupled with photovoltaic (PV) systems.
The table highlights the main features of the previous studies. A clear majority of studies focused on the purpose of cost saving, considering space heating and domestic hot water applications. The main part of them analyzed the system performance in relation to a single climatic condition. The application of TES solutions is widespread, while the study of the use of building thermal mass as a virtual battery is still limited, especially for cooling applications. A clear gap in literature was found considering simultaneous heating and cooling production to understand the potential of the virtual battery storage to improve the self-consumption of PV coupled heat pump systems. Moreover, in most cases the impact of different climates on the results is not well defined.
This paper proposes a control strategy to control a modulating heat pump based on the actual produced PV power. The heat pump is controlled by means of its compressor rotational speed, to maximize the self-consumption of solar energy. The heat pump operates to provide space heating, space cooling and domestic hot water to a single-family house. Different rule-based strategies are defined and investigated, aiming to maximize the annual PV energy self-consumption. The maximization is achieved with the use of thermal energy storage and building thermal inertia. The results are assessed considering different boundary conditions (building characteristics and climates) and a comparison of different cases is carried out to broaden the efficacy of the solutions.
2. Materials and Methods
This paper studied the application of a rule-based (RB) control strategy (CS) that aims to maximize the PV energy self-consumption in a residential single-family house. The system consists of a rooftop PV system coupled with a modulating air-source heat pump providing space heating, space cooling and domestic hot water to the building. The aim of the control strategy is to control the heat pump operation in order to match the HP output to the instantaneous PV availability. The surplus of PV power was used to run the heat pump and store the energy using two thermal tanks (one for space heating and space cooling and one for DHW) and the thermal capacitance of the building, by changing the air temperature set-points in the building zones. The case study was of a residential building located in Bolzano, Northern Italy. The energy performance of the system was evaluated using the TRNSYS simulation software. The simulations were run for the whole year, considering heating and cooling loads, and other electrical loads of the house (water circulation, ventilation and air dehumidification). The efficacy of the RB control was evaluated considering four different design approaches. In the first two cases, the heat pump operated with priority to overheat either the space heating tank or the domestic hot water tank in the winter period. During the summer, the heat pump worked alternately to overheat the DHW tank or to overcool the space cooling tank. In the second two cases, the same rules were applied, and in addition, the air temperature set-points were modified by ±2 °C to store heat through the building thermal capacitance. Then, the efficacy of the CS was evaluated considering different climatic conditions, different insulation and thermal inertia levels.
2.1. Test Case Building
The case study of this paper is a single two-story residential building located in Bolzano, in Northern Italy. The building has a 140 m2 heated floor area and a ratio of heat dispersing surface over conditioned volume (S/V) of 0.59. The heated volume of the building is divided in four thermal zones, two for each floor of the building. Each floor is divided into two zones, one north and one south, to consider the different effect of solar radiation entering the building. The building is characterized by a well-insulated envelope. The characteristics of the envelope are described in the following section.
The building loads for heating and cooling are defined considering the test reference year (TRY) of Bolzano and using the TRNSYS simulation software. The model of the building is created in TRNSYS using the subroutine type 56. The DHW demand was estimated around 186 L per day, as defined by the Italian technical specification [22], considering the hourly demand profile prescribed by the European Standard [23]. The energy demand levels of the building are shown in Table 2.
Table 2.
Building’s energy loads.
2.2. Building HVAC System
The building HVAC system consists of an air-to-water heat pump, which provides space heating (SH), space cooling (SC) and domestic hot water (DHW) to the building. A schematic of the system is shown in Figure 1. The system was equipped with two separate tanks, one for SH and SC, and the other one for DHW. The tank volume was 250 L for SH-SC and 150 L for DHW. The average tank heat loss coefficient was 0.35 W m−2·K−1, and the heat dispersing surfaces for the SH/SC and the DHW tank were 2.27 m2 and 1.67 m2 respectively. The heat pump was characterized by a variable speed compressor, which is controlled depending on the operating conditions. For DHW production, the HP works at its maximum capacity During SH and SC operations, the compressor speed is proportionally controlled depending on the difference between the inlet water temperature and the set-point temperature of the SH–SC tank. The set-point temperature changed following an outside temperature reset (OTR) curve. The OTR curve defines the set-point level depending on the outside air temperature. In the heating mode, the set-point temperature of the SH tank varied from 40 to 20 °C for external air temperature going from −5 to 20 °C respectively. In the cooling mode, the set-point varied from 26 to 12 °C for an external air temperature going from 26 to 35 °C. The SH–SC tank is connected to the radiant floor system, which provide heating and cooling to the four thermal zones of the building. A motorized mixing valve ensures the adjustment of the supply temperature to the radiant panels. The water flow in the radiant panels is controlled separately for each thermal zone, using four thermostats working to maintain the indoor room temperature between 20 and 26 °C. The system works prioritizing the DHW preparation, hence, during DHW demand periods, the set point in the SH/SC tank was not controlled. The photovoltaic (PV) plant had a nominal power of 3.24 kWp, considering polycrystalline modules had a total area of about 20 m2. The PV panels were installed south facing on the roof of the house with a slope of 45°. The overall DC/AC conversion efficiency of the inverter was 90%. The building was provided with a mechanical ventilation system and a dehumidification unit, which works during the cooling season to avoid the risk of condensation on the radiant floor panels.
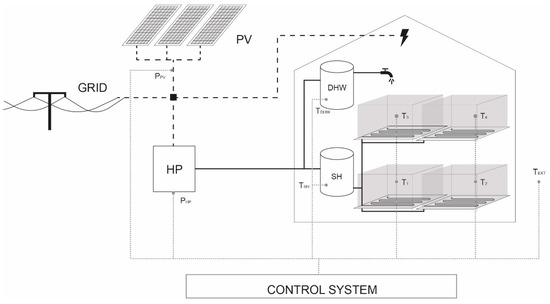
Figure 1.
Heat pump and PV system schematic.
The building system was modeled using the software TRNSYS. A list of the main components of the model is presented in Table 3.
Table 3.
Main components of the TRNSYS model of the system.
The heat pump was modeled using the previously developed type 250 [24], which computes the heat pump performance based on look-up tables (performance maps), hence, depending on the inlet air and outlet water temperatures. The tables are defined by the values of heating and electric power of the HP working at different sink and source temperatures, based on manufacturer data. The type represents an inverter-driven technology, and the HP is controlled varying the compressor speed, acting on the frequency of the supply current. Type250′s control is based on the computation of the capacity ratio (CR) and the COP correction factor (fCOP), where CR is redefined as the ratio of the frequency over the nominal frequency, i.e., 50 Hz. Ultimately, the effective thermal power and the COP level were computed.
2.3. Control Strategy
The heat pump operation is controlled using the compressor rotational speed input. The input parameter is the frequency of the supplied power, which is regulated considering the difference between the set-point temperature and the actual temperature in the SH/SC tank. During the DHW production operation, the heat pump works at its maximum capacity. The model determines the heat pump power absorption according to the inverter frequency (f), expressed as the percentage of the total electric input (Yel%) based on the current operating conditions. The correlation between the frequency and the electric input was defined simulating the heat pump operation working with variable compressor speed at different sink and source temperatures according to the manufacturer data. The simulation results show the f-Yel% correlation for the heat pump working under different operating conditions, as shown in Figure 2.
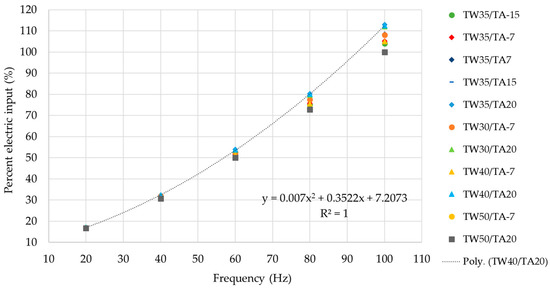
Figure 2.
Percentage of the electric input for different HP compressor speed at different sink and source temperatures (TW: water temperature, TA: air temperature).
The graph shows how the electric input slightly changed considering different operating temperatures at high frequency levels. For the purpose of this study, the interpolation curve was defined considering the highest values of Yel% (working temperatures 20–40 °C). The results of Figure 2 were interpolated to define the relation between frequency and electric input.
When an overproduction of PV energy is detected by the control system, the PV surplus at the time step is expressed as percentage of the electric input Yel (Yel%,surplus), defined at the actual operation temperatures. The optimal frequency for the heat pump operation under PV-surplus conditions (fsurplus) is then evaluated by the equation (Equation (1)):
The coefficients a0, a1 and a2 are defined for heating and cooling operation, as shown in Table 4.
Table 4.
Coefficient of the f-Yel% equation for heating and cooling operation.
The obtained value for the frequency was used as the input to control the HP compressor speed. This frequency value allows one to run the HP at the maximum capacity covered by the PV availability.
2.4. System Simulation
The dynamic simulations of the building-system were performed using the software TRNSYS. The simulations were run for the whole year, using a time step of 1 min. Five different cases were defined and simulated. In the first case (standard control strategy), a standard HVAC control was applied to the system. In this case, the PV power was used to directly cover the electric loads of the system and any PV surplus was sent to the grid. In the other four cases, the optimal supply frequency defined in the previous section was applied to the system to store the PV surplus as thermal energy exploiting the thermal storage capacity of the system and the building thermal mass. The energy was stored by running the heat pump during the PV overproduction periods, increasing the set point temperatures of the two tanks used for SH-SC and DHW. During the PV overproduction, the OTR curve for the SH-SC tank set-point was altered to reach a maximum temperature of 50 °C during the heating season, and a minimum temperature of 7 °C during the cooling season (Figure 3).
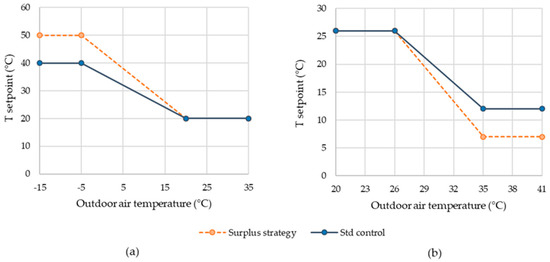
Figure 3.
Outside temperature reset (OTR) curves for the space heating (SH)/space cooling (SC) tank setpoint (heating mode (a) and cooling mode (b)) for the standard control and the RB control strategy.
The inlet temperature of the water flow in the radiant panels varied following the OTR curve described before, depending on the external air temperature. A diverting and a mixing valve were used to control and mix the return water flows from the radiant floor system with the water coming in the tank, to maintain the temperature of the water circulating in the panels at the set-point level. The DHW tank set-point was increased up to 60 °C. A mixing valve worked to maintain the DHW flow at 45 °C, mixing the flow from the tank with cold water at 10 °C. The temperature was reached with the use of the heat pump only, which adopted R134 refrigerant. No additional electric heaters were considered for this study. Furthermore, the possibility of storing additional energy using the thermal capacitance of the building was assessed modifying the room temperature set-point of ±2 °C. This study analyzed four cases defined using different combinations of these strategies, as described below:
- CS1: when a PV overproduction occurred, the SH-SC set-point for heating and cooling modes were modified as described above. When the maximum set-point was reached, the set-point in the DHW was modified consequently.
- CS1+: the set-point of the two tanks were modified in the same order of CS1, and at the same time the room set-point of the four thermal zones was modified by ±2 °C.
- CS2: the DHW tank set-point was firstly increased. The SH-SC was modified when the DHW maximum set-point was reached.
- CS2+: the control strategy was the same as CS2, together with the increase of the room set-point of ±2 °C.
As reference, a schematic of the control algorithms for the CS2+ is shown in Figure 4.
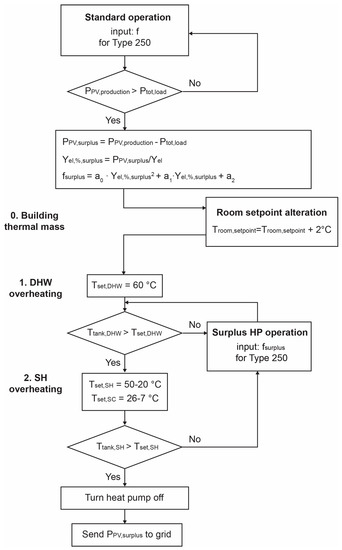
Figure 4.
Control algorithm schematic for CS2+ working in the heating mode.
The results are expressed by means of annual grid consumption, defined as the amount of energy, which was purchased from the grid over the year, and the self-consumption rate, calculated as the ratio between the self-consumed energy and the total PV production, as in Equation (2)
2.5. Boundary Conditions
To assess the efficacy and broaden the result validity of the proposed CS, the simulations were performed considering different boundary conditions. The analysis investigates the impact of different climates, different insulation levels of the building and different building inertia.
2.5.1. Climatic Conditions
In the base case, the study considers the climate data of the test reference year (TRY) of Bolzano, in Northern Italy. In addition, the TRY data of four additional Italian cities were considered, namely Trento, Trieste, Milan and Rome. The location of the five cities is shown in Figure 5.
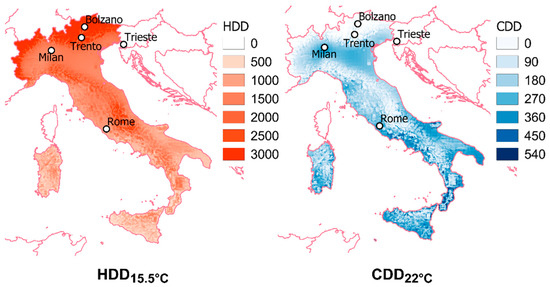
Figure 5.
Location of the five Italian cities considered in the study.
The mean monthly temperature and total monthly solar radiation for the different climates are shown in Figure 6 and Figure 7.
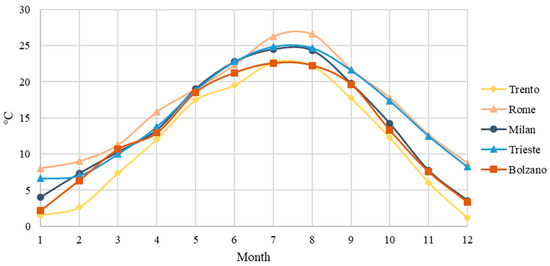
Figure 6.
Mean monthly temperatures (°C) for the five analyzed climates.
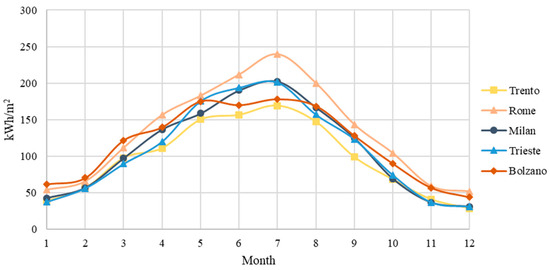
Figure 7.
Total monthly solar radiation (kW·m−2) of the five analyzed climates.
The cities were selected as a representative test bench considering the different levels of temperatures and solar irradiation over the year. Bolzano is characterized by low temperatures and high solar radiation levels, mostly during the winter period. Trieste has high average temperatures and a low amount of solar radiation during the wintertime. Milan is characterized by medium-low levels of both temperature and solar radiation. Rome has high average temperatures and high levels of solar radiation all year around. In the end, Trento is characterized by low temperatures and a low level of solar radiation. The energy demand for heating, cooling and DHW of the buildings for the different climates was calculated and the results are summarized in Table 5.
Table 5.
Building energy demand for the different climate boundary conditions.
2.5.2. Building Insulation Level
Firstly, the CS was analyzed considering a well-insulated building. Additionally, the same control strategy was investigated for a medium-insulated building. The insulation layers of the walls of the medium-insulated building is defined so that the U-values of the envelope satisfy the limits defined by the Italian law [25]. The U-values of the two buildings are listed in Table A1 of Appendix A.
The heating and cooling loads were calculated for the two buildings considering the climate of Bolzano, as shown in Table 6.
Table 6.
Building energy loads for the two insulation scenarios in Bolzano.
The fraction of different energy use on the total energy demand varied between the two insulation scenario cases, since the heating seems to be mainly sensitive to the insulation level.
2.5.3. Building Inertia
Since the CS proposed in this study aimed to exploit the thermal inertia of the building to store the surplus of solar energy, the effect of variable thermal inertia of the building envelope was also investigated. For this purpose, three different thermal inertia levels for the reference building were hypothesized and modeled in TRNSYS. The reference building as described above was considered as a standard solution, which was designed based on the typical Italian masonry construction type. Then, the thermal mass of external walls, roof, ceiling and ground floor was increased in one case and decreased in another case, in order to maintain the U-value of the elements unmodified from the reference case. The composition of the constructions systems for the three cases is summarized in Table A2 of Appendix A.
3. Results
3.1. Base Case
The energy performance of the system was evaluated for the standard control strategy and the four CS solutions. The potential energy reduction achievable through the use of the different CS was evaluated in terms of grid consumption reduction, in comparison to the standard HVAC control strategy. In a first analysis, the annual system operation was simulated considering a highly insulated building with a medium inertia level in the climate of Bolzano, Northern Italy. The monthly amount of energy purchased from the grid for the system with the standard control strategy is shown in Figure 8. Additionally, the figure shows the monthly percent reduction (i.e., positive values) of grid energy consumption for the four control strategies.
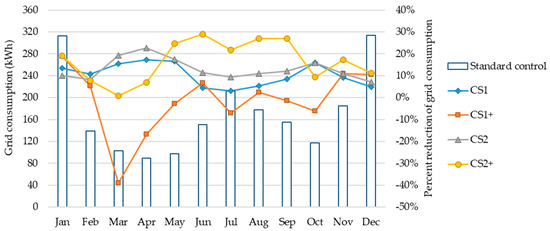
Figure 8.
Grid consumption of the standard control strategy and the monthly percent variation levels of the grid consumption for the different CSs. A positive value means a reduction in grid consumption.
The results show the level of reduction of energy purchased from the grid in relation to the different CS strategies. Comparing CS1 and CS2, the results show that giving the priority to the DHW tank overheating led to higher energy reduction levels, mainly during summer and in the end of the heating season. The same consideration was true if comparing CS1+ and CS2+. When comparing the results of CS1+ and CS2+ to the results of CS1 and CS2 respectively, the results show that the activation of the thermal inertia of the building had a limited benefit during the winter months, and it was unfavorable during the middle seasons. However, the exploitation of the building inertia was highly effective in the summer period. The results show that the system was able to store additional energy and reduce the purchase of electricity from the grid.
The levels of self-consumption and the annual energy consumption from the grid for the different control strategies are shown in Figure 9.
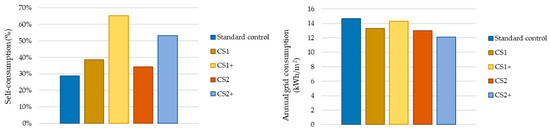
Figure 9.
Self-consumption and total annual grid consumption for the standard control strategy and the proposed control strategies.
The annual energy consumption from the grid for the standard control strategy was about 14.67 kWh∙m−2∙y−1. The levels of achievable energy reduction were 9%, 3%, 12% and 17% applying CS1, CS1+, CS2 and CS2+ respectively. The application of CS1+ led to the higher level of self-consumption (+35%). Nonetheless, considering the amount of energy purchased from the grid, the CS2+ resulted in the best solution. With this control strategy, the increase of self-consumption was about 22%.
Figure 10 shows the building loads and the PV production for three reference weeks during winter, spring and summer. The graphs represent the standard control case on the left, and the CS2+ on the right. Considering the January 15th–21st period, the control strategy was able to increase the amount of self-consumed energy, storing the solar energy during the day and slightly reducing the loads during the evening and the night. During the middle season—April 15th–21st—the control strategy allowed one to reduce the load peaks relative to DHW production that occur during the evening. The same consideration was valid for the summer period.
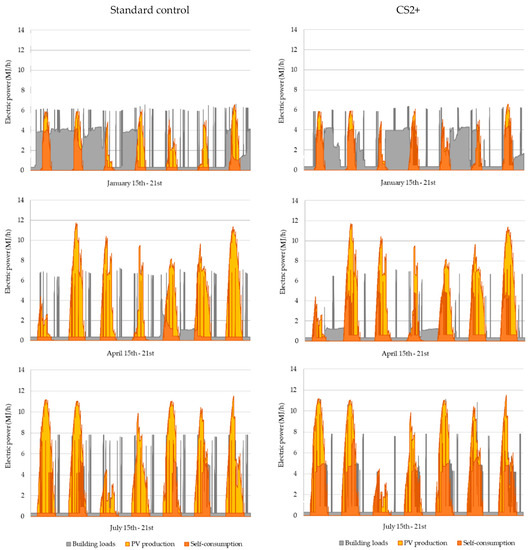
Figure 10.
Building loads and PV production (MJ∙h−1) during three reference weeks (winter, middle season and summer) for the standard control (left) and the CS2+ (right).
The share of self-consumption over the whole year is presented for the CS2+ and the standard control case in Figure 11.
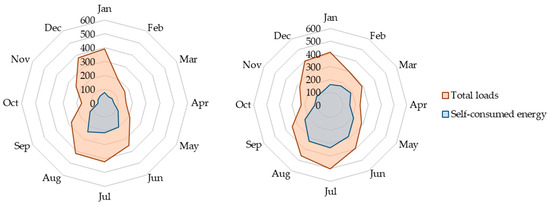
Figure 11.
Total energy consumption and self-consumption share over the year for the standard control strategy (left) and the CS2+ (right).
The control strategy led to an increase of the total loads during the year, but, at the same time, it increased considerably the share of load covered by solar energy self-consumption.
Lastly, Figure 12 shows the frequency distribution of the grid demand magnitude of the system throughout the whole year. The graph shows that the control strategy, which is designed to increase the self-consumption, was able to reduce the demand peak load periods by 4% increasing instead the frequency of smaller grid withdrawals, with benefit on the grid stability.
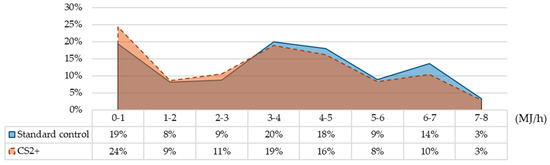
Figure 12.
Frequency distribution of the grid demand magnitude (MJ∙h−1) of the system throughout the year for the standard control and the CS2+.
3.2. Climatic Conditions
The simulations are run considering different climatic conditions to estimate the impact of the weather on the effectiveness of the control strategies. Additionally, there were different shares between the energy end uses for different climates. The effect of changing the climate boundary conditions was evaluated for all the proposed control strategies. The results are shown in Figure 13.
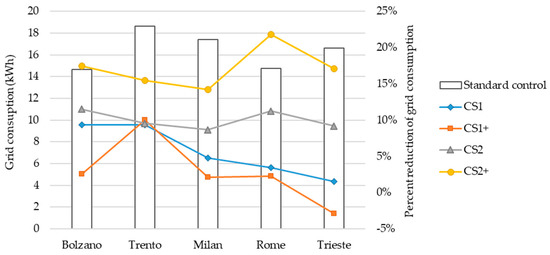
Figure 13.
Annual percentage reduction of grid consumption (positive values) for the different CSs under different climatic conditions.
The results show that the CS can reduce the grid energy consumption considering all the analyzed climates. The maximum energy reduction found for the climate of Bolzano was 17%. Similar results were found considering the climate of Trieste (maximum reduction of 17%). A maximum reduction of about 14% was found for Milan. The highest energy reduction rate was found for the climate of Rome (22%), which is the city with the highest level of solar radiation. In all the analyzed cases, the most effective solution was CS2+, which means that prioritizing the DHW tank overheating was advantageous for all the climatic conditions. Comparing CS1 and CS2 in the different climates, it is noticeable that CS2 became more effective for climates with a lower share of space heating. In other words, prioritizing the DHW tank overheating over the SH/SC shows similar results for cold climates (i.e., Trento), and it led to large benefits for warm climates (i.e., Rome). Moreover, the increase of energy reduction passing from CS2 and CS2+ was similar for all the cases (5–8%).
Figure 14 shows the correlation between the SCratio and the grid-consumption of the different proposed strategies under different climatic conditions.
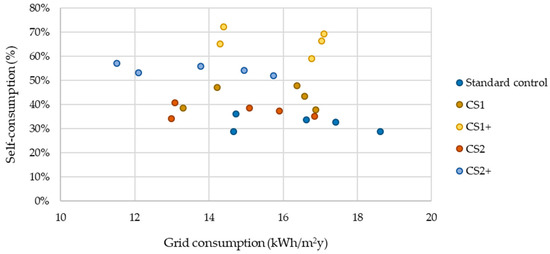
Figure 14.
Self-consumption and grid consumption correlation for the different control strategies under different climatic conditions.
The graph shows that the CS1+ was the solution that brings to higher levels of self-consumption but higher grid consumption in comparison to CS2+, which was characterized by lower self-consumption rates.
3.3. Building Insulation Level
The results obtained considering a lower level of insulation for the building envelope are shown in Figure 15. The results were similar to the high-insulated case, achieving a maximum reduction of grid consumption of 15%. The main difference was seen for the CS1+, which became more beneficial, considering the highest share of space heating in the total energy demand.
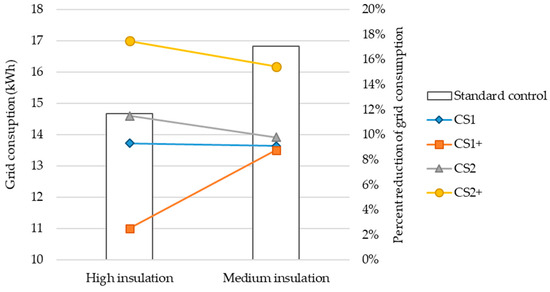
Figure 15.
CS efficacy for different climate boundary conditions for the medium-insulated building scenario.
As for the well-insulated case, the control strategy was able to reduce the high load demand from the grid, increasing the low peak loads (Figure 16). Nonetheless, the biggest reductions were for intermediate powers (i.e., 4000–7000 kJ/h) and not for peak powers.
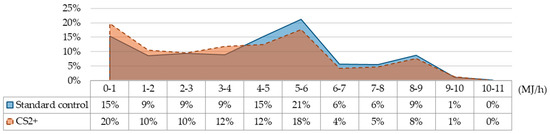
Figure 16.
Frequency distribution of the grid demand magnitude (MJ/h) of the system throughout the year for the standard control and the CS2+.
3.4. Building Inertia
The effect of varying the thermal inertia of the building is shown in Figure 17. Considering the standard control strategy, the energy consumption of the HP system decreased as the thermal inertia of the building increased, varying from 15.02 (low inertia) to 13.72 kWh·m−2 y−1 (high inertia). In all cases, significant energy reduction levels were achievable with the application of the CS. The choice of prioritizing the DHW tank overheating resulted in being more advantageous for all the cases (CS2 and CS2+). The application of CS2 led a constant energy reduction around 11–12% for all three cases. As expected, prioritizing the production of DHW without activating the thermal mass of the building minimized the impact of the inertia level over the efficacy of the control strategy. Looking at the thermal mass activation, this solution seemed to be not beneficial in the case of the building with low inertia. In this case, the low inertia level did not allow to store heat in the building effectively. The maximum profitability level of the thermal mass activation was found for the medium-inertia case, where an increase of 5% was reported. For the high inertia case the increase of energy reduction was slightly lower (4%). Moreover, for the high inertia case the efficacy of all the different control strategies was attenuated, which could be related to the lower energy demand of the building. The maximum energy reduction achievable with the CS2+ for the low inertia and the high inertia cases were 11% and 16%.
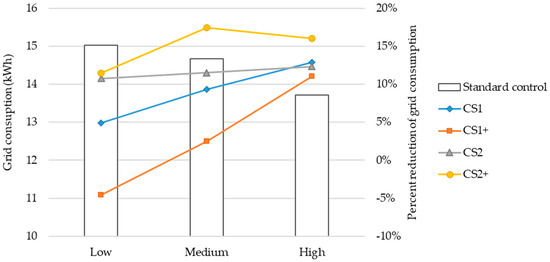
Figure 17.
Annual grid consumption with different inertia levels of the building envelope.
Figure 18 shows the correlation between the self-consumption and the grid consumption levels for the proposed strategies in relation to the buildings with different inertia. For all cases, the building with low inertia presents higher self-consumption rates, but higher grid consumption. A linear increase of both self-consumption and grid consumption with the decrease of the thermal mass of the building can be identified in the graph. Moreover, a linear trend can be identified for the cases with and without thermal mass activation, regardless of the inertia level of the building and the choice of prioritizing either DHW or SH/SC.
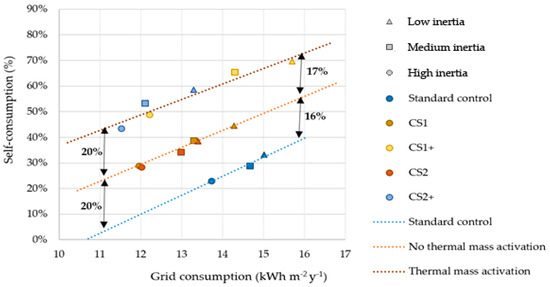
Figure 18.
Self-consumption and grid consumption correlation considering different inertia levels: low inertia (triangles), medium inertia (squares) and high inertia (circles).
The graph highlights the percent increase of self-consumption in relation to the different control strategies. Considering cases with the same level of grid consumption, an increase of self-consumption in the range of 16–20% can be achieved with the proposed RB control strategy in comparison to a standard control strategy. Moreover, an additional increase in between 17% and 20% can be reached with the activation of the building thermal mass.
4. Discussions
Modulating heat pumps have a great potential in increasing the PV self-consumption potential, thus decreasing the carbon footprint of residential buildings. The proper application of control strategies is fundamental and needs further improvements. This study shows the efficacy of a rule-based RB control strategy, considering a single residential building with different boundary conditions. Different studies analyzed the application of RB control strategies, pointing out the greater potential of model predictive control (MPC) over RB strategies [21,26]. MPC can lead further improvement to the system operation, but requires higher investments and complex predictive and optimizing models. Therefore, RB controls become competitive solutions when taking in consideration economic aspects and the applicability in the residential sector. Moreover, in most cases, the studies compare the efficacy of the MPC with a poorly designed controller as a reference. This situation might lead to an overestimation of the MCP benefits, and the potential of efficient and well-designed RBCs is arguable [21].
A wide spread of simple but efficient control strategies can be an effective solution to reduce the impact of residential building use on the environment. Currently, RB controls can be implemented with no additional cost into modern controllers of heat pump units, which already have internet connectivity. The spread of heat pump installation in Europe is almost constantly increasing [27] with a drop of prices, which makes the technology largely affordable. At the same time, the price for residential PV installations is decreasing. Increasing the self-consumption share of the system ensures lower operation costs and shorter payback periods.
The results of this study show the energy saving potential of a RB control strategy in comparison to a standard control strategy for a modulating HP coupled with 3.24 kWp PV plant. The control strategy is based on the possibility of the heat pump to work at different capacity levels, maximizing the self-consumption of solar energy. The PV surplus is stored as thermal energy within the system and into the building thermal mass, avoiding the use of electric batteries. The system works to provide space heating, space cooling and DHW, so that the system can exploit its flexibility along the whole year. Four different control strategies are defined by varying the control algorithm to prioritize either the DHW or SH/SC production, and activating the building thermal mass. The proposed control strategies are able to increase the self-consumption up to 70%. Nonetheless, the CS that assures the highest levels of self-consumption are not the same that minimize the energy demand from the grid. The grid energy demand is reduced in the range of 11–22%, depending on the climate and the building characteristics. Moreover, the control strategy is able to reduce the peak load demand from the grid. These values are promising results in the CS scenario, proving the capacity of properly designed RB controls to improve the system performance and reduce the yearly energy demand of the system without the use of electric batteries. Considering these results, the application of RB controls becomes strategic to limit the installation cost and the environmental impact of the system, by reducing the need of additional components.
5. Conclusions
The paper presented a control strategy to increase the PV self-consumption of a modulating air-source heat pump supplying heating and cooling for a residential building. The proposed control strategy was based on a simple RB algorithm that can be implemented in the system with low-cost controllers, without affecting the installation cost of the system. Starting from a standard HVAC control strategy, the CS was defined to store the PV surplus as thermal energy exploiting two water tanks and the thermal capacitance of the building. The results show how the CS was effective to increase the self-consumption of PV energy of the system. Moreover, the CS was able to reduce the energy consumption from the grid and to reduce the high peak demand periods. The activation of the thermal inertia of the building to increase the self-consumption of the system during heating and cooling operation resulted in a feasible solution and leads to a reduction of energy consumption. Specifically, the thermal mass activation was beneficial during the winter and summer periods, but it resulted in being disadvantageous during the middle season months. The benefit of the thermal mass activation in term of reduction of grid purchase was reduced for buildings with low thermal inertia, even if higher levels of self-consumption were achievable for this case. Considering solutions with the same level of grid consumption, the thermal mass activation was able to increase the self-consumption rate in between 33% and 40%, in comparison to the standard control strategy.
For the reference case of Bolzano, the maximum reduction of the grid consumption was 17% and an increase of self-consumption of 22%, in comparison to a standard control strategy. The best control strategy was found by prioritizing the DHW tank overheating. Moreover, the control strategy was able to shave the periods of peak load demand from the grid, increasing the frequency of smaller grid withdrawals, thus enhancing the stability of the grid. For a medium-insulated building, higher power exchanges were required from the grid. The CS reduced the peaks at intermediate power exchanges, and not at peak power.
Considering different climatic conditions, highest levels of energy reduction were found for the climate of Rome (22%). The lowest energy reduction levels were found for the climate of Milan and Trento, (14% and 15%), which were characterized by low solar radiation and low temperature levels.
The results show the feasibility of the proposed RB control strategy to increase the rate of PV energy self-consumption of the system without the need of electric storage. At the same time, the CS was able to reduce the grid consumption and to stabilize the grid by reducing the peak load demand.
Author Contributions
Methodology, M.P.; software, M.P., A.P.; writing—original draft preparation, M.P.; writing—review and editing, A.P., P.B.; supervision, P.B. All authors have read and agreed to the published version of the manuscript.
Funding
The research leading to these results has received funding from the MIUR-Italian Ministry of Education, Universities and Research (PRIN 2017) grant number 2017KAAECT.
Acknowledgments
This study was performed in the frame of the FLEXHEAT project “The energy FLEXibility of enhanced HEAT pumps for the next generation of sustainable buildings”.
Conflicts of Interest
The authors declare no conflict of interest. The funders had no role in the design of the study; in the collection, analyses, or interpretation of data; in the writing of the manuscript, or in the decision to publish the results.
Nomenclature
| COP | Coefficient of Performance |
| CS | Control Strategy |
| DHW | Domestic Hot water |
| EER | Energy Efficiency Ratio |
| HP | Heat Pump |
| HVAC | Heating, Ventilation, and Air Conditioning |
| PV | Photovoltaic |
| MPC | Model Predictive Control |
| NZEB | Net Zero Energy Building |
| OTR | Outside Temperature Reset |
| PV | Photovoltaic |
| RB | Rule Based |
| SC | Space Cooling |
| SH | Space Heating |
| TRY | Test Reference Year |
Appendix A
The characteristics of the building, which were used to define the different cases for the simulations of this study, are summarized in this appendix.
The U-values of the two different insulation levels of the building are summarized in the table:
Table A1.
U-values of the envelope elements for the two insulation scenarios of the reference building.
Table A1.
U-values of the envelope elements for the two insulation scenarios of the reference building.
| Element | U-Value | U-Value |
|---|---|---|
| High-Insulated | Medium-Insulated | |
| (W m−2 K−1) | (W m−2 K−1) | |
| Wall | 0.18 | 0.25 |
| Ground floor | 0.18 | 0.26 |
| Roof | 0.17 | 0.24 |
| Window | 0.86 | 1.27 |
| Ceiling | 0.20 | 0.38 |
The composition of the construction for the three different inertia cases of the building are presented in the table:
Table A2.
Layers of the construction systems for the three inertia scenarios of the building.
Table A2.
Layers of the construction systems for the three inertia scenarios of the building.
| Element | Inertia Level | Layers (Internal-External) |
|---|---|---|
| External wall | Standard | Internal plaster 2 cm, hollow brick 25 cm, insulation 20 cm, brick 12 cm |
| High | Internal plaster 2 cm, hollow brick 50 cm, insulation 18 cm, brick 12 cm | |
| Low | Internal plaster 2 cm, insulation 21 cm, external plaster 4 cm | |
| Ceiling | Standard | Flooring 2 cm, cement mortar 3 cm, concrete slab (*) 15 cm, insulation 12 cm, brick-concrete slab 26 cm, internal plaster 1 cm |
| High | Flooring 2 cm, cement mortar 3 cm, concrete slab (*) 25 cm, insulation 10 cm, brick-concrete slab 26 cm, internal plaster 1 cm | |
| Low | Flooring 2 cm, cement mortar 3 cm, concrete slab (*) 8 cm, insulation 12 cm, wood plank 5 cm, internal plaster 1 cm | |
| Ground floor | Standard | Flooring 2 cm, cement mortar 3 cm, concrete slab (*) 15 cm, insulation 15 cm, concrete slab 10 cm, gravel 20 cm |
| High | Flooring 2 cm, cement mortar 3 cm, concrete slab (*) 25 cm, insulation 14 cm, concrete slab 10 cm, gravel 20 cm | |
| Low | Flooring 2 cm, cement mortar 3 cm, concrete slab (*) 8 cm, insulation 15 cm, concrete slab 10 cm, gravel 20 cm | |
| Ceiling | Standard | Internal plaster 2 cm, brick-concrete slab 26 cm, insulation 20 cm, roof tile 1.5 cm |
| High | Internal plaster 2 cm, brick-concrete slab 50 cm, insulation 20 cm, roof tile 1.5 cm | |
| Low | Internal plaster 2 cm, wood plank 5 cm, insulation 20 cm, roof tile 1.5 cm |
(*) radiant panel.
References
- European Parliament and Council. Directive 2012/27/EU of 25 October 2012 on Energy Efficiency. 2012. Available online: https://eur-lex.europa.eu/legal-content/EN/TXT/?uri=celex%3A32012L0027 (accessed on 1 September 2020).
- Eurostat. Energy Statistics—Final Energy Consumption by Sector. 2019; p. 2019. Available online: https://ec.europa.eu/eurostat/statistics-explained/index.php/Energy_statistics_-_an_overview#Final_energy_consumption (accessed on 1 September 2020).
- Eurostat. Energy Statistics—Share of Energy from Renewable Energy Sources. 2018. Available online: https://ec.europa.eu/eurostat/data/database (accessed on 1 September 2020).
- Battaglia, M.; Haberl, R.; Bamberger, E.; Haller, M. Increased self-consumption and grid flexibility of PV and heat pump systems with thermal and electrical storage. Energy Procedia 2017, 135, 358–366. [Google Scholar] [CrossRef]
- Fischer, D.; Madani, H. On heat pumps in smart grids: A review. Renew. Sustain. Energy Rev. 2017, 70, 342–357. [Google Scholar] [CrossRef]
- Luthander, R.; Widén, J.; Nilsson, D.; Palm, J. Photovoltaic self-consumption in buildings: A review. Appl. Energy 2015, 142, 80–94. [Google Scholar] [CrossRef]
- Moser, D.; Breyer, C.; Masson, G.; Vartiainen, E. Improving the Competitiveness of Solar PV with Electricity Storage. In Proceedings of the 33rd European Photovoltaic Solar Energy Conference and Exhibition, Amsterdam, The Netherlands, 25–29 September 2017; pp. 2783–2789. [Google Scholar]
- Strbac, G. Demand side management: Benefits and challenges. Energy Policy 2008, 36, 4419–4426. [Google Scholar] [CrossRef]
- Bee, E.; Prada, A.; Baggio, P. Demand-Side Management of Air-Source Heat Pump and Photovoltaic Systems for Heating Applications in the Italian Context. Environments 2018, 5, 132. [Google Scholar] [CrossRef]
- Dar, U.I.; Sartori, I.; Georges, L.; Novakovic, V. Advanced control of heat pumps for improved flexibility of Net-ZEB towards the grid. Energy Build. 2014, 69, 74–84. [Google Scholar] [CrossRef]
- Arteconi, A.; Hewitt, N.J.; Polonara, F. Domestic demand-side management (DSM): Role of heat pumps and thermal energy storage (TES ) systems. Appl. Therm. Eng. 2013, 51, 155–165. [Google Scholar] [CrossRef]
- Salpakari, J.; Lund, P. Optimal and rule-based control strategies for energy flexibility in buildings with PV. Appl. Energy 2016, 161, 425–436. [Google Scholar] [CrossRef]
- Dentel, A.; Betzold, C. Control Strategies for Geothermal Heat Pump Systems in Combination with Thermal and Electrical Storage Units. In Proceedings of the BS2017—15th IBPSA Conference, San Francisco, CA, USA, 7–9 August 2017; pp. 292–298. [Google Scholar]
- Marquand, C.J.; Tassou, S.A.; Wang, Y.T.; Wilson, D.R. An economic comparison of a fixed speed, a two speed, and a variable speed vapour compression heat pump. Appl. Energy 1984, 16, 59–66. [Google Scholar] [CrossRef]
- Tassou, S.A.; Qureshi, T.Q. Comparative performance evaluation of positive displacement compressors in variable-speed refrigeration applications. Int. J. Refrig. 1998, 21, 29–41. [Google Scholar] [CrossRef]
- Aste, N.; Angelotti, A.; Buzzetti, M. The influence of the external walls thermal inertia on the energy performance of well insulated buildings. Energy Build. 2009, 41, 1181–1187. [Google Scholar] [CrossRef]
- Toradmal, A.; Kemmler, T.; Thomas, B. Boosting the share of onsite PV-electricity utilization by optimized scheduling of a heat pump using buildings thermal inertia. Appl. Therm. Eng. 2018, 137, 248–258. [Google Scholar] [CrossRef]
- Sikder, O.; Jansson, P.M. Thermal Inertia of a Building as Virtual Energy Storage: A Sustainable Solution for Smart Grids. In Proceedings of the 53rd International Universities Power Engineering Conference, (UPEC), Glasgow, Scotland, 4–7 September 2018; pp. 1–6. [Google Scholar]
- Hewitt, N.J. Heat pumps and energy storage—The challenges of implementation. Appl. Energy 2012, 89, 37–44. [Google Scholar] [CrossRef]
- Psimopoulos, E.; Johari, F.; Bales, C.; Widén, J. Impact of boundary conditions on the performance enhancement of advanced control strategies for a residential building with a heat pump and PV system with energy storage. Energies 2020, 13, 1413. [Google Scholar] [CrossRef]
- Fischer, D.; Bernhardt, J.; Madani, H.; Wittwer, C. Comparison of control approaches for variable speed air source heat pumps considering time variable electricity prices and PV. Appl. Energy 2017, 204, 93–105. [Google Scholar] [CrossRef]
- UNI. UNI/TS 11300-2: Prestazioni Energetiche Degli Edifici-Parte 2. 2014. Available online: http://store.uni.com/catalogo/uni-ts-11300-2-2019?josso_back_to=http://store.uni.com/josso-security-check.php&josso_cmd=login_optional&josso_partnerapp_host=store.uni.com (accessed on 1 September 2020).
- European Committee for Standardization-CEN. EN12381-3 Energy Performance of Buildings-Method for Calculation of Design Heat Load-Part 3: Domestic Hot Water Systems Heat Load and Characterisation of Needs, Module M8-2, M8-3. 2016. Available online: http://store.uni.com/catalogo/uni-en-12831-3-2018 (accessed on 1 September 2020).
- Bee, E.; Prada, A.; Baggio, P. Variable-speed air-to-water heat pumps for residential buildings: Evaluation of the performance in northern Italian climate. In Proceedings of the 12th Rehva World Congress (CLIMA 2016), Aalborg, Denmark, 22–25 May 2016. [Google Scholar]
- Ministry of Economic Development. Decreto del Ministero dello Sviluppo Economico 26 Giugno 2015. 2015. Available online: https://www.mise.gov.it/index.php/it/normativa/decreti-interministeriali/2032966-decreto-interministeriale-26-giugno-2015-applicazione-delle-metodologie-di-calcolo-delle-prestazioni-energetiche-e-definizione-delle-prescrizioni-e-dei-requisiti-minimi-degli-edifici (accessed on 1 September 2020).
- Péan, T.Q.; Salom, J.; Costa-Castelló, R. Review of control strategies for improving the energy flexibility provided by heat pump systems in buildings. J. Process Control 2019, 74, 35–49. [Google Scholar] [CrossRef]
- EHPA European Heat Pump Association. European Heat Pump Market and Statistics Report 2019-Executive Summary. 2019. Available online: https://www.ehpa.org/market-data/market-report/report-2019/ (accessed on 1 September 2020).
Publisher’s Note: MDPI stays neutral with regard to jurisdictional claims in published maps and institutional affiliations. |
© 2020 by the authors. Licensee MDPI, Basel, Switzerland. This article is an open access article distributed under the terms and conditions of the Creative Commons Attribution (CC BY) license (http://creativecommons.org/licenses/by/4.0/).