Abstract
In the residential sector, a great part of the electricity goes into heating water by electric water heaters, which results in high CO2 emissions as well as an unprecedented increase in electricity demand leading to an energy crisis. This study offers solar water heaters as a more economical and efficient replacement for electric water heaters. The present study is aimed at investigating the potential for solar water heaters in the subcontinent, especially in India. A feasibility analysis is performed for seven cities in the subcontinent, namely Mumbai, New Delhi, Kolkata, Assam, Gujrat and Madhya Pradesh. Simulated results are based on a solar fraction, equity payback, multiple collectors (one, two or three), horizontal and tilted, type of collector (evacuated tube, glazed and unglazed), electricity saved and greenhouse gas (GHG) emission reduction. The collector’s area is made such that it should receive at least 50% of the solar fraction. The range of payback period varies from five to 15 years. The results show Gujrat being the most ideal site for solar water heaters.
1. Introduction
With increasing energy crisis and the effects of increasing pollution due to emissions, the world is switching over to alternative sources of energy that provide sufficient energy and do not adversely affect the environment. Among these alternative energy sources, solar is a notable one.
Currently, India produces almost 72% of electricity by coal (in the year 2018–2019). This country is one of the major importers of coal. India has its coal, but the coal mined in it has low calorific value. India imported 171.85 million tons in the year 2018. The import of coal to run thermal power plants is very costly for India [1]. A considerable portion of this electricity goes into residential areas where a part of it is used in heating water with the help of electric water heaters. Moreover, the increased use of electricity leads to an increase in the emissions of GHGs (greenhouse gases), mainly comprising of CO2. In the subcontinent alone between 2005–2013, 20.54 billion tons of carbon dioxide equivalent were released in India [1].
This study is being presented to overcome some of the issues mentioned above by offering solar water heaters as a replacement for conventional electric water heaters. By this replacement, the electricity demand can be expected to decrease resulting in conservation of energy, lesser greenhouse gas emissions and lesser burden on the economy.
This study uses the RetScreen which is a clean energy management software system developed by the government of Canada for calculating the energy efficiency, renewable energy and cogeneration project feasibility. Moreover, it can also be used to do online energy analysis. Previously, different researchers used this software for feasibility study of solar water heaters (SWHs) for different cities, as discussed above. We use the same software for comparative analysis of evacuated, glazed and unglazed SWHs for seven different cities of India.
India has high solar potential owing to its position, as India lies north of the equator between 8°04′ to 37°06′ north latitude and 68°07′ to 97°25′ east longitude, which is relatively close to the equator (areas near the equator receive direct solar radiation throughout the year, as compared to areas away from the equator) [2]. The intensity of solar radiation received by India is 200 MW/km square [3].
However, the present number of studies discuss the feasibility study of solar water heater (SWHs), for example, a feasibility study from the techno-economic perspective for solar water heating systems was done for Saudi Arabia [4] and Libya [5] using RETscreen software. In [4], authors access the techno economic validation of SWHs for domestic purpose by simulating different types of SWH collectors, like evacuated and glazed type. In [5], a proposal is presented for replacing conventional SWHs with domestic SWHs (DSWHs), for that purpose RETscreen is used for techno economic evaluation of DSWHs. Using the same software, Aysar Yasin [6] evaluated a passive open loop domestic solar water heater for a house in Palestine in 2017 using Retscreen software. M.M.Kablan, in 2004, compared economic feasibility of SWHs with gas geyser system for Jordan [7]. Assessment for solar potential and study of the possibility of using solar water heating for residential application in Inland Norway was also carried out by Hagos [8]. He uses two types of solar collectors for techno economic performance comparison. Gautam reviewed practical advances, commercial viability, and worldwide development of solar water heating systems; he investigates the economic feasibility of SWHs in the long run [9]. Taborianski [10] suggested that the device that consumes the most electric power and is responsible for the emission of the most pollutants while operating is the electric water heater. Taborianski et al. [11], through the use of Transient System Simulation Tool (TRNSYS), also developed a model to enhance the tank and flat plate collector for domestic use to assure financial efficacy in 2006. Urmee discussed the constraints from various technical, economic, social and policy barriers that prevented the uplifting of SWHs in Australia [12]. Nahar in 1998 designed a SWH system with a capacity of 750 L based on thermosyphon principle and found out the efficiency and payback period of such collector [13]. Bason in 1982 analyzed the feasibility of using a solar water heating system for low-income housing [14]. Murli in 2015 examined the performance of a phase change material incorporated thermosyphon solar water heating system using a flat plate collector as a heat source [15]. Notton and Said in 2016 [16] evaluated the net amount of radiation available for flat plate solar collectors mounted on fixed or tracking structures. Koholé in 2018 studied the thermosyphon SWH and presented the optimization of a flat plate solar water collector used for such system, this optimization was done for achieving maximum output [17]. Zhang in 2020 compared the annual performance of loop thermosyphon and conventional SWHs. In addition, the effective heat gain, effective number of supplying days and nighttime heat loss for Fuzhou City were comparatively analyzed under two different operating modes [18]. Touaba in 2020 proposed a flat plate collector that uses waste engine oil as absorber and heat transfer fluid at the same time, and which is also equipped with a controlled sun tracker photovoltaic system to maximize the collected solar irradiation [19]. Balaji, in 2020, performed an experiment to compare the convention effect of a flat plate collector with or without a thermal performance enhancer, thus finding the optimum mode for convection of a flat plate SWH [20]. Kumar and Rosen, in 2010, conducted a detailed comparative assessment on the performance of integrated collector storage SWH, using various strategies for reducing heat loss for the purpose of comparing and accessing best heat loss strategy [21]. Tanha in 2015 investigated the performance of two solar domestic hot waters with drain water heat recovery, which were recently installed at the Archetype Sustainable Twin Houses at Kortright Center, Vaughan, Ontario [22].
In this paper, we use RETscreen software to demonstrate the comparative analysis of evacuated, glazed and unglazed SWHs for the cities of Mumbai, New Delhi, Kolkata, Assam, Gujrat, and Madhya Pradesh as shown in Figure 1. These cities are selected to cover all parts of India in this analysis. The analysis was performed for one, two and three collectors. The results output by the RETscreen software were solar fraction for different types of solar water heaters and having multiple collectors (single, double and triple), equity payback, payback period and B:C ratio (benefit:cost ratio).
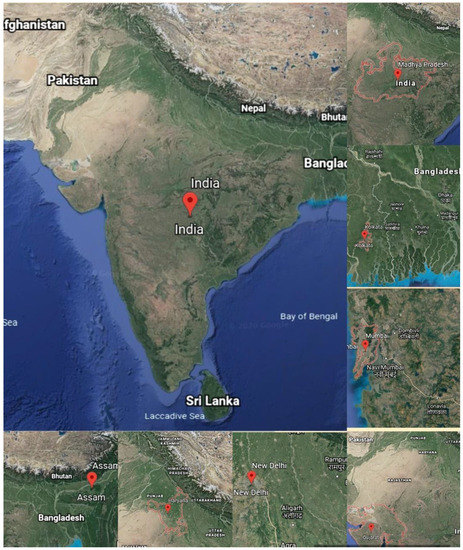
Figure 1.
Map of selected cities (Google Earth [23]).
2. System Description
In case of the subcontinent, as far as the type of circulation is concerned, the passive circulation method is widely used in houses, as the water quantity used in at homes is less as compared to big buildings where the active system is used (in this case a pump is used to circulate water).
The evacuated type of solar water heater is considered most efficient in its purpose worldwide. This is because, in the evacuated type of solar water heater, convection losses are reduced due to evacuation of air from the cavity of the solar water heater. But this type of solar water heater is generally more expensive due to the added cost of creating a vacuum. The glazed type has a special coating on the receiving cover that does not allow heat loss to the surroundings. It is cheaper than the evacuated tube type of solar collector. The unglazed type of solar collector is the cheapest and least efficient of the three types. Normally it is provided with a larger area to compensate for its lack of ability to heat water effectively.
A direct system of circulation refers to a system that provides hot water directly to the consumer. The indirect system; however, provides a heat exchanger that passes heated up water in another circulation cycle, which provides the water to the consumer. Often such a system is provided with an antifreeze that runs in the collector circulation cycle and is used in very cold climates where there is a danger of water freezing in collector tubes and damaging them. In almost all cities of the subcontinent the direct system of circulation is used, since the cities in India rarely experience a cold climate that can cause water to freeze. Figure 2 shows the schematic for passive solar water heaters.
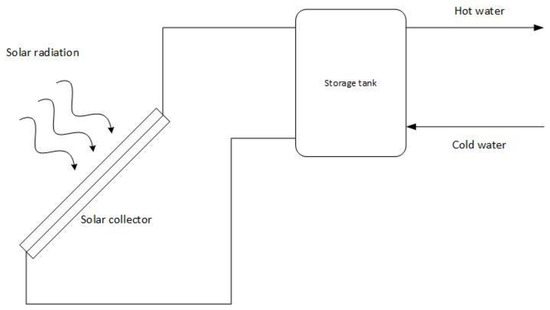
Figure 2.
Schematic for passive solar water heater.
Unglazed solar collectors are a type of solar that do not have a protective layer on them. They are the cheapest among the other types of solar collectors (i.e., evacuated and glazed). The thermal losses in unglazed solar collectors are maximum as compared to the other two types. They are often used for small houses where little heating is required. They are usually inexpensive and are cost effective if used for low temperature applications. The limitations of unglazed SWHs includes higher losses, especially in windy areas. Moreover, they are used for low temperature applications and there are freezing concerns in some climates. Figure 3 shows a simple diagram of an unglazed solar collector which consists of a header pipe, flow entrance slots, channel entrance points. Flow from the pool flows from the header pipe to the tubes through channel entrances.
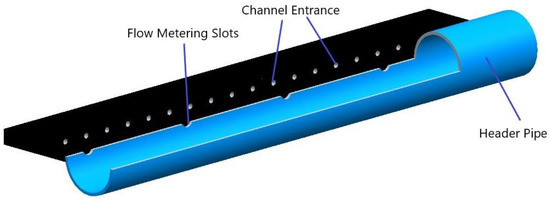
Figure 3.
Unglazed solar water heater.
Glazed type solar collectors are a type of solar collector that uses a selective coating. These types of collectors are usually made up of copper tubing over an aluminum plate and it also consists of an iron-tempered glass covering. Glazed SWHs are generally more expensive than that of unglazed SWHs. They can absorb sunlight more effectively than that of unglazed solar collectors and can be used for the whole year in any climatic condition. They have more aperture area then evacuated SWHs. There are temperature limitations in these collectors, like efficiency drops at higher temperatures. Figure 4 shows a flat plate glazed type solar collector, it is surrounded by two to three layers of glass and an insulation coating at the back. Glazed type solar collectors are often used in the average temperature application. Thermal losses in this type of collector are usually lower due to the presence of an insulation layer which causes the greenhouse effect.
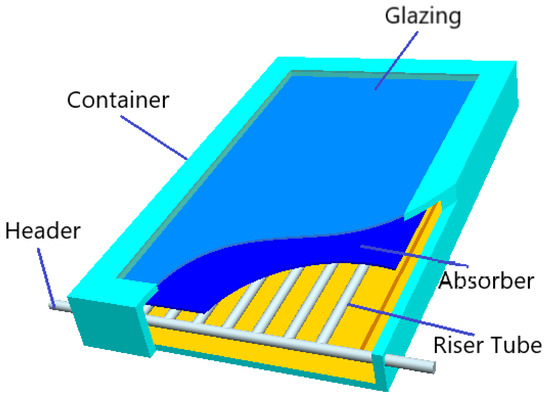
Figure 4.
Glazed solar water heater.
Evacuated tube solar collectors are typically used for providing hot water of intermediate and high temperatures (usually in colder areas). Figure 5 shows a diagram of the evacuated tube solar collector consisting of an absorber plate enclosed in a vacuumed closed glass tube. They are covered with a selective coating and their thermal losses are very low. The absorption plates are cylindrical in shape, hence the angle of sunlight is always perpendicular to them which enables them to work effectively even when sunlight is low. These types of collectors are often used in cold, cloudy or places where sunlight is low. They have usually higher initial costs. Some limitations include efficiency lost if the vacuum is lost over time, and they usually have a small aperture area. Some advantages of using this type of collector includes higher efficiency at high operating temperatures and it usually has higher temperatures than other two types. Moreover, pipe bursting due to freezing is not a concern, as it is with the other two types of collectors.
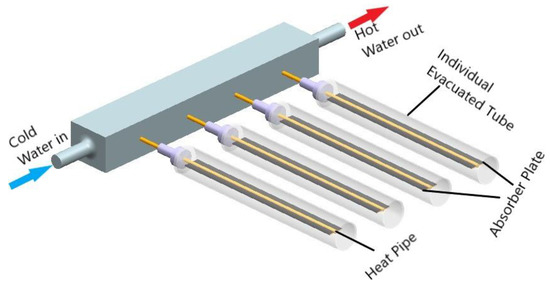
Figure 5.
Evacuated tube solar collector.
3. Environmental and Metrological Data
The environmental and metrological data for seven cities of the subcontinent were imported from RETscreen. Table 1 shows data for latitude, longitude, air temperature, Earth temperature, horizontal solar radiation and wind speed for Mumbai, New Delhi, Kolkata, Haryana, Assam, Gujrat and Madhya Pradesh. The values of air temperature, earth temperature, solar radiation horizontal and wind speed were average data for a year.

Table 1.
Climate data (from RetScreen, which collect its data from NASA).
It is imminent that Gujrat receives maximum horizontal solar radiation of 5.29 kWh/m2/d, while Assam receives the lowest, which is about 4.33 kWh/m2/d. Mumbai receives 5.12 kWh/m2/d. Haryana is the second highest, with 5.16 kWh/m2/d, while Kolkata and New Delhi receive 4.86 and 5.06 kWh/m2/d, respectively.
The average air temperature for a year is maximum for the Mumbai, of about 27.5 °C, while it is lowest for the Gujrat, having a value of 21.2 °C. Air temperature for New Delhi and Haryana was 25.5 °C. Assam showed 22.1 °C, while Kolkata showed 26.9 °C.
Figure 6 shows the horizontal solar radiation every month for the seven cities of the subcontinent. The selected cities have an almost similar amount of solar radiation throughout the year. Even in winter, the solar radiation for the selected cities is comparatively high, which shows these cities have a good solar water heating potential throughout the year. The unit used for calculation was kWh/m2 per day.
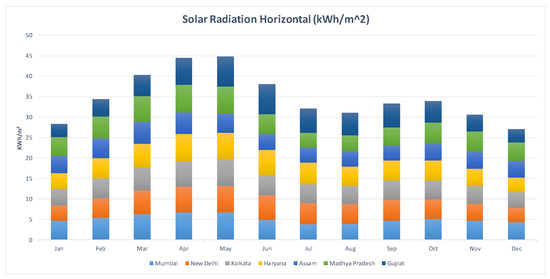
Figure 6.
Average horizontal solar radiation every month in KWH/m2.
Air temperature is equally important in determining solar water heating potential and ignoring it can lead to a possible error. To have a more accurate analysis, the air temperature should also be accounted for. Figure 7 shows the monthly variation in air temperature for the seven selected sites.
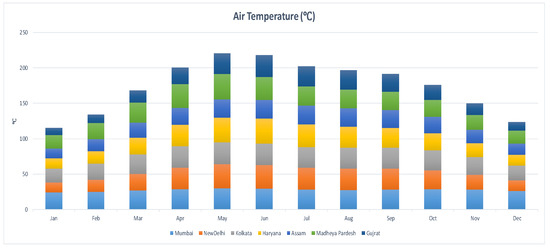
Figure 7.
Average air temperature every month.
Comparative results for daily solar radiation are presented in Figure 8 for the horizontal and tilted surface. Gujrat showed maximum daily solar radiation when in the horizontal position, with a value of about 2.1 MWh/m2; while Assam showed the lowest value for the horizontal position, as compared to the others. Madhya Pradesh and New Delhi showed to eb equal when in a horizontal position, having a value of about 1.85 MWh/m2. Haryana and Mumbai were almost equal when in a horizontal position, having values of 1.88 and 1.87 MWh/m2, respectively; while Kolkata showed 1.77 MWh/m2.
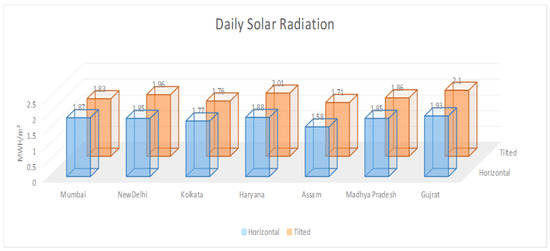
Figure 8.
Daily solar radiation for horizontal and tilted position.
Daily solar radiation absorbed by the collector when in the tilted position was comparatively higher than in the horizontal position, with the only exception being when it was installed in Kolkata, having a value of 1.76 MWh/m2. For the tilted position, Gujrat showed a maximum of about 2.1 MWh/m2, while Assam showed the lowest, at 1.71 MWh/m2. Haryana and New Delhi showed 2.01 and 1.96 MWh/m2, respectively, while Mumbai and Madhya Pradesh showed 1.83 and 1.86 MWh/m2, respectively.
4. Collector Types
RETscreen software was used to simulate different types of collectors. The data for collectors obtained from RETscreen is shown in Table 2. In this paper, evacuated and glazed type solar collectors were used for simulation. These collectors were tested by installing them on our preferred locations with the help of RETscreen. The manufacturer for the evacuated and glazed type collectors were Shangdong Linuo Paradigma and Soltop Schuppisser, respectively. CPC 1512 and Cobra 2.3 m2 model were used for evacuated and glazed type collectors, respectively. Table 2 shows the information about manufacturer, model, collector gross area, collector aperture area, Fr (τα) coefficient, FrUL coefficient, and temperature coefficient for FrUL for evacuated and glazed type collectors. Collector aperture area of the evacuated and glazed type collectors were 2.0 and 2.05 m2, respectively; moreover, collector gross area were 2.28 and 2.31 m2, respectively
Table 2.
Collector type.
In case of the unglazed collector, the manufacturer of the collector was Aquatherm Industries and the model number is Ecosun 16104. The collectors’ gross and aperture area were the same at 4.367 m2. The Fr (τα) coefficient was 0.816, while FrUL coefficient was 15.763 (W/m2)/°C. The temperature coefficient for FrUL was 0.03 (W/m2)/°C and the wind correction for Fr UL was 10 (J/m3)/°C.
5. Simulation
The simulation in this paper was done using RETscreen software. For our simulation, we used our capacity as the house with five occupants, having an occupancy rate of 90%. The daily water used per person was 57 L/day. The temperature was set at 60 °C and it was operated throughout the week. Solar tracking mode was fixed, and the slope was set to latitude of our preferred location. The azimuth was 0. We set the miscellaneous losses of the collector as 5% and the storage capacity of collector per area was 80 L/m2. The initial cost for both evacuated and glazed type collector was set between $1200 to $6300, while operating and maintenance cost was $20. Fuel type was used as electricity and seasonal efficiency was set to 90%. The inflation rate of a country in the subcontinent was 3.14% and incentives and grants given by the government were taken as zero. Using this data, we calculated the solar fraction, equity payback period and B:C ratio for a project life of 20 years. All these data are included in the tabular form and is shown in Table 3.
Table 3.
Simulation data.
Mathematical Models
RetScreen was used to perform the simulation in this study, where a passive SWH was used and the equation used for performing these simulations was as given by Beckman and Duffie [24] and Kalogirou [25].
Energy collected per unit collector area for glazed or evacuated SWHs is given by Equation (1), while for unglazed SWHs it is given by Equation (2).
When solar radiation falls on the collector, some of radiation bounce backs, this usually happens when the angle of the incident solar radiation has high incidence angle. For compensating this effect, the factor is multiplied with 0.95. Snow and dirt can also deteriorate the performance of solar collector. For compensating these losses, the factor is multiplied with (1 − fdirt).
Solar fraction is defined as the percentage of heating water load supplied by the SWH. F-chart, which is used to access the performance of SWHs, is aimed at estimating the solar fraction. Energy saving potential of SWHs can also be accessed by knowing the solar fraction. Duffie and Beckman explained the f-chart method in detail.
The ratio of collector losses to heating load and ratio of absorbed solar radiation to heating load is given by X and Y, respectively.
where is the correction factor, which is multiplied with X for compensating the effect of variation in the main supply water Tm and minimum acceptable temperature Ta.
Equation (6) represents the fraction of total monthly load provided by SWHs.
6. Results and Discussion
RETscreen software is used to demonstrate the comparative analysis of evacuated, glazed and unglazed SWHs for the cities of Mumbai, New Delhi, Kolkata, Assam, Gujrat and Madhya Pradesh. The analysis was performed for one, two and three collectors. The results output by the RETscreen software were solar fraction for different types of solar water heaters and having multiple collectors (single, double and triple), equity payback, payback period and B:C ratio (benefit-cost ratio).
6.1. Backup Fuel Analysis
Figure 9 shows the energy saved annually and energy saved during the project life (i.e., 20 years). Comparatively, two unglazed type solar collectors saved more electricity, as compared to two glazed types solar collectors and two evacuated types of solar collectors. Gujrat showed the maximum amount of saved electricity for using two evacuated types of solar collectors, more specifically 3.6 MWh annually and 72 MWh for 20 years. Haryana and New Delhi showed an equal value of 3.4 MWh annually. Moreover, Assam and Madhya Pradesh showed an almost equal value of 3 and 3.2 MWh annually, respectively. In the end, Kolkata and Mumbai showed the lowest value, as compared to the others, at 3.1 MWh annually. Electricity saved during the project life is calculated by multiplying electricity saved annually with the project life, which according to our study is 20 years.
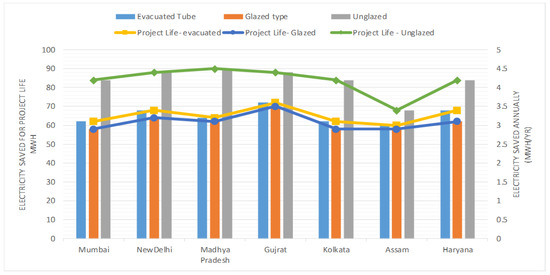
Figure 9.
Energy saving potential.
Electricity saved for two glazed type solar collectors is comparatively lesser than two evacuated type collectors. Gujrat showed the maximum value of the electricity saved, which is about 3.5 MWh annually. Whereas, Kolkata, Mumbai and Assam showed the lowest, as compared to others, more specifically at about 2.9 MWh annually. Haryana and Madhya Pradesh showed 3.1 MWh annually, while New Delhi showed 3.2 MWh annually.
Figure 9 shows the electricity-saving potential of two unglazed solar collectors. By installing our collector in Madhya Pradesh, the maximum electricity annually was saved, having a value of 4.5 MWh, while the lowest value of 3.4 MWh annually was obtained in Assam. Kolkata, Haryana and Mumbai saved 4.2 MWh electricity annually by installing two unglazed solar collectors, while Gujrat and New Delhi saved 4.4 MWh electricity annually.
Electricity saved during the project life was calculated by multiplying electricity saved annually by 20 years.
Figure 10 shows the reduction in the emission of GHG in terms of tons of CO2. Comparatively, two unglazed type collector reduces more GHG as compared to two glazed type collectors and two evacuated type collectors. Among the two evacuated type collectors, Haryana showed a maximum GHG emission reduction of about 4.8 tons of CO2, which is equal to 11.1 barrels of crude oil; while Kolkata showed the lowest value of 3.3 tons of CO2, which is equal to 7.7 barrels of crude oil. Madhya Pradesh and Gujrat showed to be almost equal, having values of 4.6 and 4.5 tons of CO2, respectively, which is equal to 10.7 and 10.5 barrels of crude oil, respectively. Similarly, New Delhi and Assam showed almost equal results of 3.6 and 3.7 tons of CO2, respectively, which is equal to 8.5 barrels of crude oil.
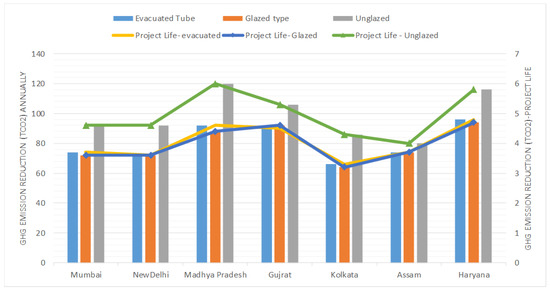
Figure 10.
GHG reduction in terms of CO2.
Among the two glazed solar collectors, Haryana showed a maximum value of 4.7 tons of CO2, which is about 11 barrels of crude oil. Gujrat was not far behind, with 4.6 tons of CO2, which is equal to 10.8 barrels of crude oil. Kolkata showed the lowest value, at 3.2 tons of CO2, which is equal to 7.5 barrels of crude oil. By installing solar collectors in New Delhi and Mumbai, we got a CO2 reduction of 3.6 tons, which is equal to 8.4 barrels of crude oil. Madhya Pradesh showed 4.4 tons of CO2 emissions, which is about 10.3 barrels of crude oil. In the end, Assam showed 3.7 tons of CO2 emissions, which is about 8.5 barrels of crude oil.
Figure 10 shows the GHG emission reduction for two unglazed solar collectors. By using our collectors in Madhya Pradesh, we obtained a GHG emission reduction of 6 tons of CO2, which is equal to 14 barrels of crude oil. Similarly, we obtained 5.8 tons of CO2 in Haryana, which is equal to 13.6 barrels of crude oil; and 4.6 tons of CO2 for Mumbai and New Delhi, which is equal to 10.7 barrels of crude oil. Gujrat and Kolkata reduced the CO2 emissions by 5.3 tons and 4.3 tons, which is equal to 12.3 and 10.1 barrels of crude oil, respectively. In the end, Assam reduced the emission of 4 tons of CO2, which is equal to 9.2 barrels of crude oil.
GHG emissions reduction for the project life is calculated by multiplying GHG emissions reduction annually by 20 years.
6.2. Annual Heating Energy Saved
Annual heating energy saved per collector is calculated and is shown in Figure 11, Figure 12 and Figure 13. Overall, unglazed solar collectors show greater potential for saving annual heating energy if two solar collectors are used, whereas they showed lesser value than evacuated and glazed solar collectors if only one collector is used. For one collector, an unglazed solar collector saved 0.6 to 1.2 MWh of heating energy per year for given cities, while the evacuated solar collector saved 1.7 to 2 MWh of heating energy per year and the glazed solar collector saved 1.7 to 2.2 MWh of heating energy per year. For two collectors, an unglazed solar collector saved 3.4 to 4.5 MWh of heating energy per year, whereas an evacuated solar collector saved 3.0 to 3.6 MWh of heating energy per year and the glazed solar collector saved 2.9 to 3.5 MWh of heating energy per year for given cities. The evacuated solar collector saved 3.9 to 4.6 MWh of heating energy per year and the glazed solar collector saved 3.9 to 4.4 MWh of heating energy per year for given cities.
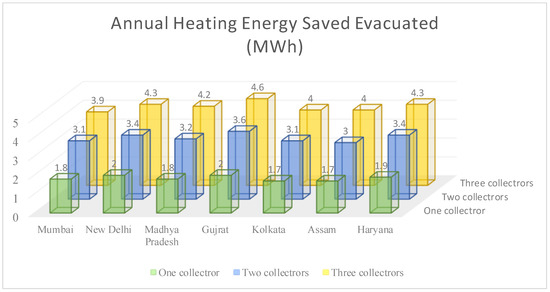
Figure 11.
Annual heating energy saved for evacuated solar collectors.
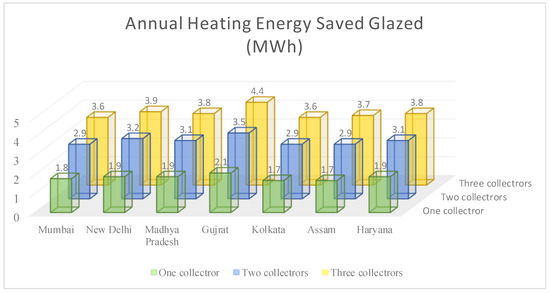
Figure 12.
Annual heating energy saved for glazed solar collectors.
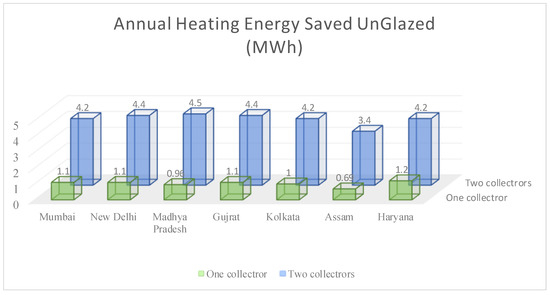
Figure 13.
Annual heating energy saved for unglazed solar collectors.
6.3. Solar Fraction
RETscreen was used to calculate solar fraction for one, two and three glazed type collectors. It is imminent from Figure 14 that as we increase the number of collectors, solar fraction increases. Solar fraction for the seven cities of the subcontinent was calculated, and the results show that for three collectors the solar fraction reaches more than 80%; except for Assam, whose values for solar fraction were 75.80%. Assam shows the lowest amount of solar fraction for one, two and three collectors. While Gujrat shows a relatively maximum amount of solar fraction. The solar fraction for two collectors remains between 55% to 75%, with New Delhi showing the maximum. The solar fraction for one collector remains between 30% to 45%, with New Delhi and Mumbai showing the maximum amount of solar fraction, being slightly higher than Gujrat.
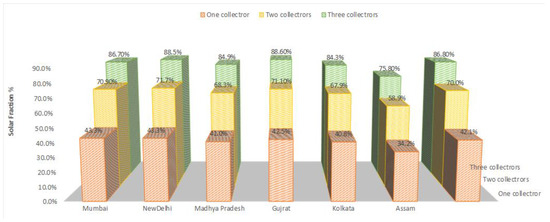
Figure 14.
Solar fraction for glazed collectors.
Figure 15 shows solar fraction data for one, two and three evacuated type collectors. The solar fraction for three collectors lies above 90%, with the only exception being Assam. The solar fraction value for Assam is the lowest, while New Delhi shows the maximum solar fraction for one, two and three collectors. Solar fraction for two collectors remains between 60% to 80%. Solar fraction value for one collector remains between 30% to 45%.
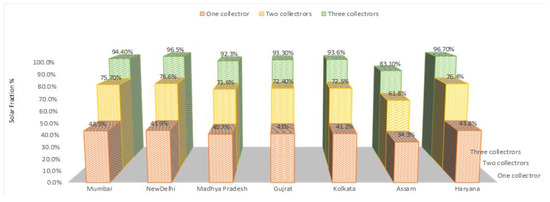
Figure 15.
Solar fraction for evacuated collectors.
Figure 16 shows the solar fraction for one and two unglazed solar collectors. The solar fraction for two unglazed solar collectors reached 100% when operating in Mumbai, New Delhi, Madhya Pradesh and Kolkata. For two unglazed solar collectors, the lowest value of solar fraction was 71.1% and was obtained when operating in Assam. Solar fractions of 95.1% and 89.80% were obtained for two unglazed solar collectors when operating in Haryana and Gujrat, respectively.
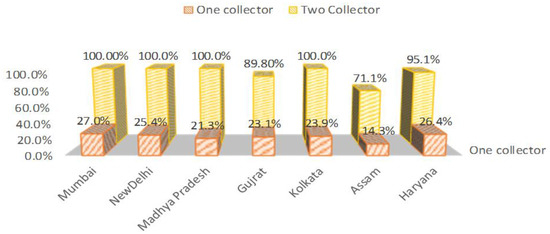
Figure 16.
Solar fraction for unglazed solar collectors.
For one unglazed solar collector, the maximum value of 27% was obtained for Mumbai, while the smallest value of 14.3% was obtained for Assam. Haryana was very close to Mumbai, with 26.8%. Kolkata and Gujrat showed between values 23% and 24%. New Delhi showed avalue of 25.9%, while Madhya Pradesh showed 21.3%.
6.4. Financial Analysis
The benefit to cost ratio, commonly known as the B:C ratio, for two evacuated, two glazed type collectors and one unglazed solar collector was calculated and is shown in Figure 17. The unglazed type collector shows a better B:C ratio, as compared to an evacuated type collector and glazed solar collector. The maximum value for the glazed type collector was calculated for New Delhi, Gujrat, Madhya Pradesh and Haryana at 2.5, while Kolkata and Assam showed the lowest at 2.3. In between them is Mumbai, which showed 2.4 B:C ratios for the two glazed solar collectors.
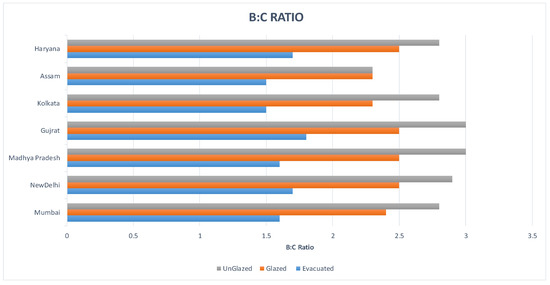
Figure 17.
Benefit to cost ratio.
The B:C ratio for the two evacuated type collectors was relatively smaller than the two glazed type collectors. Kolkata and Assam showed the lowest ratio of 1.5, while Gujrat showed the highest ratio of 1.8 for the two evacuated types of solar collectors. Haryana and New Delhi were equal, with a value of 1.7 each, while Mumbai showed 1.6 B:C ratios for the two evacuated types of solar collectors.
Figure 17 also shows the B:C ratio for two unglazed types of solar collectors. The B:C ratio for the two unglazed solar collectors was comparatively high, as related to the evacuated and glazed collectors. A maximum of 3 B:C ratios was obtained for the cites of Madhya Pradesh and Gujrat, while the lowest ratio of 2.3 was obtained for Assam. By installing two unglazed solar collectors in Haryana and Kolkata, we obtained a B:C ratio of 2.8. The B:C ratio of Mumbai and New Delhi turned out to be almost similar, having a ratio of 2.8 and 2.9, respectively.
Figure 18 shows the data of the equity payback period for our preferred locations using two evacuated, glazed type solar collectors and two unglazed solar collectors. New Delhi showed the smallest equity payback period of 7.7 years for using two glazed types of solar collectors. Gujrat, Madhya Pradesh and Haryana showed 7.8 years for two glazed solar collectors. Mumbai showed 8.2 years, while Kolkata and Assam showed the maximum time of 8.4 years for using two glazed types of solar collectors.
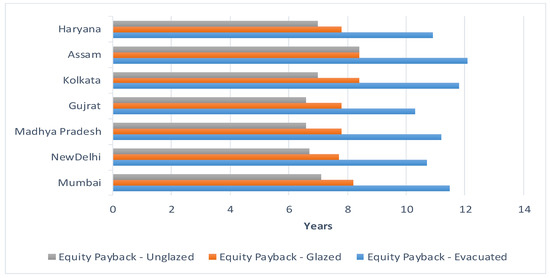
Figure 18.
Equity payback period.
The equity payback period for the evacuated type collector is comparatively greater than the glazed type collector. Gujrat showed the lowest value of 10.3 years, while Assam showed the highest value of 12.1 years for using two evacuated types of solar collectors. New Delhi and Haryana were almost equal with 10.7 years and 10.9 years, respectively. While Kolkata and Mumbai were quite similar at 11.8 years and 11.5 years, respectively, for using two evacuated types of solar collectors. In the end, Madhya Pradesh showed an equity payback period of 11.2 years for two evacuated solar collectors.
The equity payback period for two unglazed solar collectors was comparatively smaller than the other two collectors. The maximum equity payback period was 8.4 years, which was obtained for Assam, while Gujrat and Madhya Pradesh showed 6.6 years, which was the lowest as compared to the other locations. New Delhi showed an almost similar time as that of Gujrat and Madhya Pradesh, having a value 6.7 years. Kolkata and Haryana showed an equity payback period of 7 years. Mumbai showed almost similar data to that of Haryana and Kolkata, having a value of 7.1 years.
Figure 19 shows the relation between the equity payback period and solar fraction for two glazed, unglazed and evacuated tube collectors. It is evident from the graph that the equity payback period for collectors whose solar fraction is high is lesser. As the solar fraction for the two unglazed solar collectors was highest, so the equity payback period was lowest. Whereas the solar fraction for the two evacuated solar collectors was lowest, so the equity payback period was highest. Solar fraction and equity payback period for the two glazed solar collectors was intermediate.
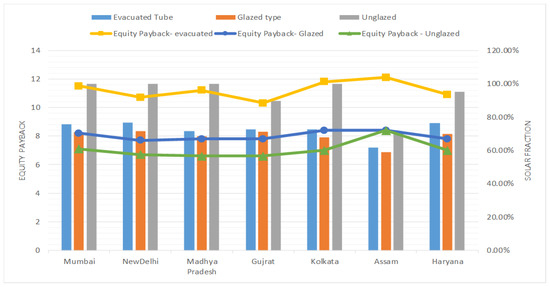
Figure 19.
Relation between equity payback period and solar fraction.
7. Conclusions
The techno-economic analysis for solar water heaters of glazed, unglazed and evacuated tube type was performed on RETscreen. The comparative analysis for the seven cities shows the following results:
- In terms of backup fuel analysis, two unglazed solar collectors saved more energy as compared to the other two types of collectors. Gujrat showed the greater energy saving potential, than the other sites, for the two evacuated and glazed collectors, while for the two unglazed collectors, Madhya Pradesh had the greater potential.
- For GHG emissions reduction in terms of CO2, two unglazed collectors reduce more GHG emissions as compared to the other two types of collectors. Haryana reduced more GHG emissions, as compared to the other sites, if two glazed and evacuated collectors were used, while Madhya Pradesh showed more reduction in GHG emissions for two unglazed collectors.
- For annual heating energy saved, Gujrat showed better results among all other sites for all three types of collectors.
- Solar fraction increased as number of collectors increased for three evacuated and glazed collectors. Haryana and Gujrat were the best among the selected sites, while some sites even received 100% solar fraction after using two unglazed collectors.
- Benefit to cost ratio for unglazed collectors was better than the other two types of collectors, while the equity payback period for evacuated SWHs was highest among the other two SWHs.
Author Contributions
Conceptualization, T.A.H.R. and G.H.; methodology and formal analysis, S.A.R. and S.S.A.; software, validation, and resources, M.A. All authors have read and agreed to the published version of the manuscript.
Funding
This research was funded through Researchers Supporting Project number (RSP-2020/274), King Saud University, Riyadh, Saudi Arabia.
Acknowledgments
This research was funded through Researchers Supporting Project number (RSP-2020/274), King Saud University, Riyadh, Saudi Arabia. The authors are also thankful to National University of Sciences and Technology (Pakistan) and GIK Institute (Pakistan) for providing technical and financial support in this research.
Conflicts of Interest
The authors declare no conflict of interest.
Nomenclature
| Symbols | Represents |
| Ac | Collector area given in m2 |
| f | Fraction of the total monthly load given by SWHs in % |
| fdirt | Losses encounter by SWHs due to dirt |
| FR | Heat removal factor of collector |
| FRUL | Thermal losses of solar collector in ((W/m2)/°C) |
| Conversion factor | |
| G | Global incident solar radiation in W/m2 |
| HT | Monthly average daily solar radiation falling on the collector surface per unit area in (KWh/m2/d) |
| L | Total heating load in a month in GJ |
| N | Days in a month |
| Energy collected per unit collector area in W/m2 | |
| Ta | Average ambient temperature in a month in °C |
| Tw | Minimum acceptable water temperature in °C |
| Tm | Mains water supply temperature in °C |
| Tref | Reference temperature (100 °C) |
| ΔT | Difference of temperature between the working fluid entering the collector and outside in °C |
| UL | Overall heat loss coefficient of the collector in ((W/m2)/°C) |
| Transmittance of cover | |
| Short wave absorptivity of the collector |
References
- Seetharaman, G. Coal Here to Stay Despite India’s Ambitious Goals for Renewable Energy. The Economic Times. 2020. Available online: https://economictimes.indiatimes.com/industry/energy/power/india-will-not-be-able-to-achieve-its-renewable-energy-targets-anytime-soon/articleshow/69286279.cms?from=mdr (accessed on 26 November 2020).
- Latitude and Longitude Finder, Lat Long of Indian States. Maps of India. 2020. Available online: https://www.mapsofindia.com/lat_long/ (accessed on 26 November 2020).
- India Energy Portal. Indiaenergyportal.Org. 2020. Available online: http://www.indiaenergyportal.org/subthemes.php?text=solar (accessed on 26 November 2020).
- Abd-ur-Rehman, H.M.; Al-Sulaiman, F.A. Techno-Economic Evaluation of Different Types of Solar Collectors for Water Heating Application in Domestic Sector of Saudi Arabia. In Proceedings of the 2014 5th International Renewable Energy Congress (IREC), Hammamet, Tunisia, 25–27 March 2014. [Google Scholar] [CrossRef]
- Rajab, Z.; Zuhier, M.; Khalil, A.; El-Faitouri, S.A. Techno-Economic Feasibility Study of Solar Water Heating System in Libya. In Proceedings of the 2017 8th International Renewable Energy Congress (IREC), Amman, Jordan, 21–23 March 2017. [Google Scholar] [CrossRef]
- Yasin, A. Technical and Financial Assessment of Glazed and Evacuated Tubes Solar Collectors for Domestic Water Heating Application in Palestine. An-Najah Univ. J. Res. A (Nat. Sci.) 2017, 31, 151–172. Available online: https://hdl.handle.net/20.500.11888/2900 (accessed on 26 November 2020).
- Kablan, M. Techno-Economic Analysis of the Jordanian Solar Water Heating System. Energy 2004, 29, 1069–1079. [Google Scholar] [CrossRef]
- Hagos, D.A.; Gebremedhin, A.; Zethraeus, B. Solar Water Heating as A Potential Source for Inland Norway Energy Mix. J. Renew. Energy 2014, 1–11. [Google Scholar] [CrossRef]
- Gautam, A.; Chamoli, S.; Kumar, A.; Singh, S. A review on technical improvements, economic feasibility and world scenario of solar water heating system. Renew. Sustain. Energy Rev. 2017, 68, 541–562. [Google Scholar] [CrossRef]
- Taborianski, V.M.; Prado, R.T. Comparative evaluation of the contribution of residential water heating systems to the variation of greenhouse gases stock in the atmosphere. Build. Environ. 2004, 39, 645–652. [Google Scholar] [CrossRef]
- Lima, J.B.A.; Prado, R.T.A.; Taborianski, V.M. Optimization of tank and flat-plate collector of solar water heating system for single-family households to assure economic efficiency through the TRNSYS program. Renew. Energy 2006, 31, 1581–1595. [Google Scholar] [CrossRef]
- Urmee, T.; Walker, E.; Bahri, P.A.; Baverstock, G.; Rezvani, S.; Saman, W. Solar water heaters uptake in Australia—Issues and barriers. Sustain. Energy Technol. Assess. 2018, 30, 11–23. [Google Scholar] [CrossRef]
- Nahar, N.M. Performance and testing of a natural circulation solar water heating system. Int. J. Ambient. Energy 1988, 9, 149–154. [Google Scholar] [CrossRef]
- Basson, J.A. Using solar energy to heat water in low income housing. Int. J. Ambient. Energy 1982, 3, 187–194. [Google Scholar] [CrossRef]
- Murali, G.; Mayilsamy, K.; Arjunan, T.V. An Experimental Study of PCM-Incorporated Thermosyphon Solar Water Heating System. Int. J. Green Energy 2015, 12, 978–986. [Google Scholar] [CrossRef]
- Notton, G.; Diaf, S. Available Solar Energy for Flat-Plate Solar Collectors Mounted on a Fixed or Tracking Structure. Int. J. Green Energy 2016, 13, 181–190. [Google Scholar] [CrossRef]
- Koholé, Y.W.; Tchuen, G. Experimental and numerical investigation of a thermosyphon solar water heater. Int. J. Ambient. Energy 2018, 41, 384–394. [Google Scholar] [CrossRef]
- Zhang, T.; Yan, Z.W.; Wang, L.Y.; Zheng, W.J.; Su, Y.H. Comparative study on the annual performance between loop thermosyphon solar water heating system and conventional solar water heating system. Sol. Energy 2020, 197, 433–442. [Google Scholar] [CrossRef]
- Touaba, O.; Cheikh, M.S.A.; Slimani, M.E.-A.; Bouraiou, A.; Ziane, A.; Necaibia, A.; Harmim, A. Experimental investigation of solar water heater equipped with a solar collector using waste oil as absorber and working fluid. Sol. Energy 2020, 199, 630–644. [Google Scholar] [CrossRef]
- Balaji, K.; Khan, A.I.; Kumar, P.G.; Iniyan, S.; Goic, R. Experimental analysis on free convection effect using two different thermal performance enhancers in absorber tube of a forced circulation flat plate solar water heater. Sol. Energy 2019, 185, 445–454. [Google Scholar] [CrossRef]
- Kumar, R.; Rosen, M.A. Comparative performance investigation of integrated collector-storage solar water heaters with various heat loss reduction strategies. Int. J. Energy Res. 2010, 35, 1179–1187. [Google Scholar] [CrossRef]
- Tanha, K.; Fung, A.S.; Kumar, R. Simulation and experimental investigation of two hybrid solar domestic water heaters with drain water heat recovery. Int. J. Energy Res. 2015, 39, 1879–1889. [Google Scholar] [CrossRef]
- Google Earth. Map of India. Available online: https://earth.google.com/web/search/india/@20.98801342,82.75252922,257.77508621a,4445122.56713124d,35y,0h,0t,0r/data=CnAaRhJACiUweDMwNjM1ZmYwNmI5MmI3OTE6MHhkNzhjNGZhMTg1NDIxM2E2GZEotKz7lzRAIT1-b9OfvVNAKgVpbmRpYRgCIAEiJgokCd2rt1WjXTNAEd2rt1WjXTPAGV5wMf9RAEFAIf4wvYiHmFDA (accessed on 14 November 2020).
- Duffie, J.A.; Beckman, W.A. Solar Engineering of Thermal Processes; Wiley: Hoboken, NJ, USA, 2013. [Google Scholar]
- Kalogirou, S. Solar Energy Engineering, 2nd ed.; Academic Press: Waltham, MA, USA, 2013. [Google Scholar]


Publisher’s Note: MDPI stays neutral with regard to jurisdictional claims in published maps and institutional affiliations. |
© 2020 by the authors. Licensee MDPI, Basel, Switzerland. This article is an open access article distributed under the terms and conditions of the Creative Commons Attribution (CC BY) license (http://creativecommons.org/licenses/by/4.0/).