Research on Starting Control Method of New-Energy Vehicle Based on State Machine


Abstract
1. Introduction
2. Models and Methods
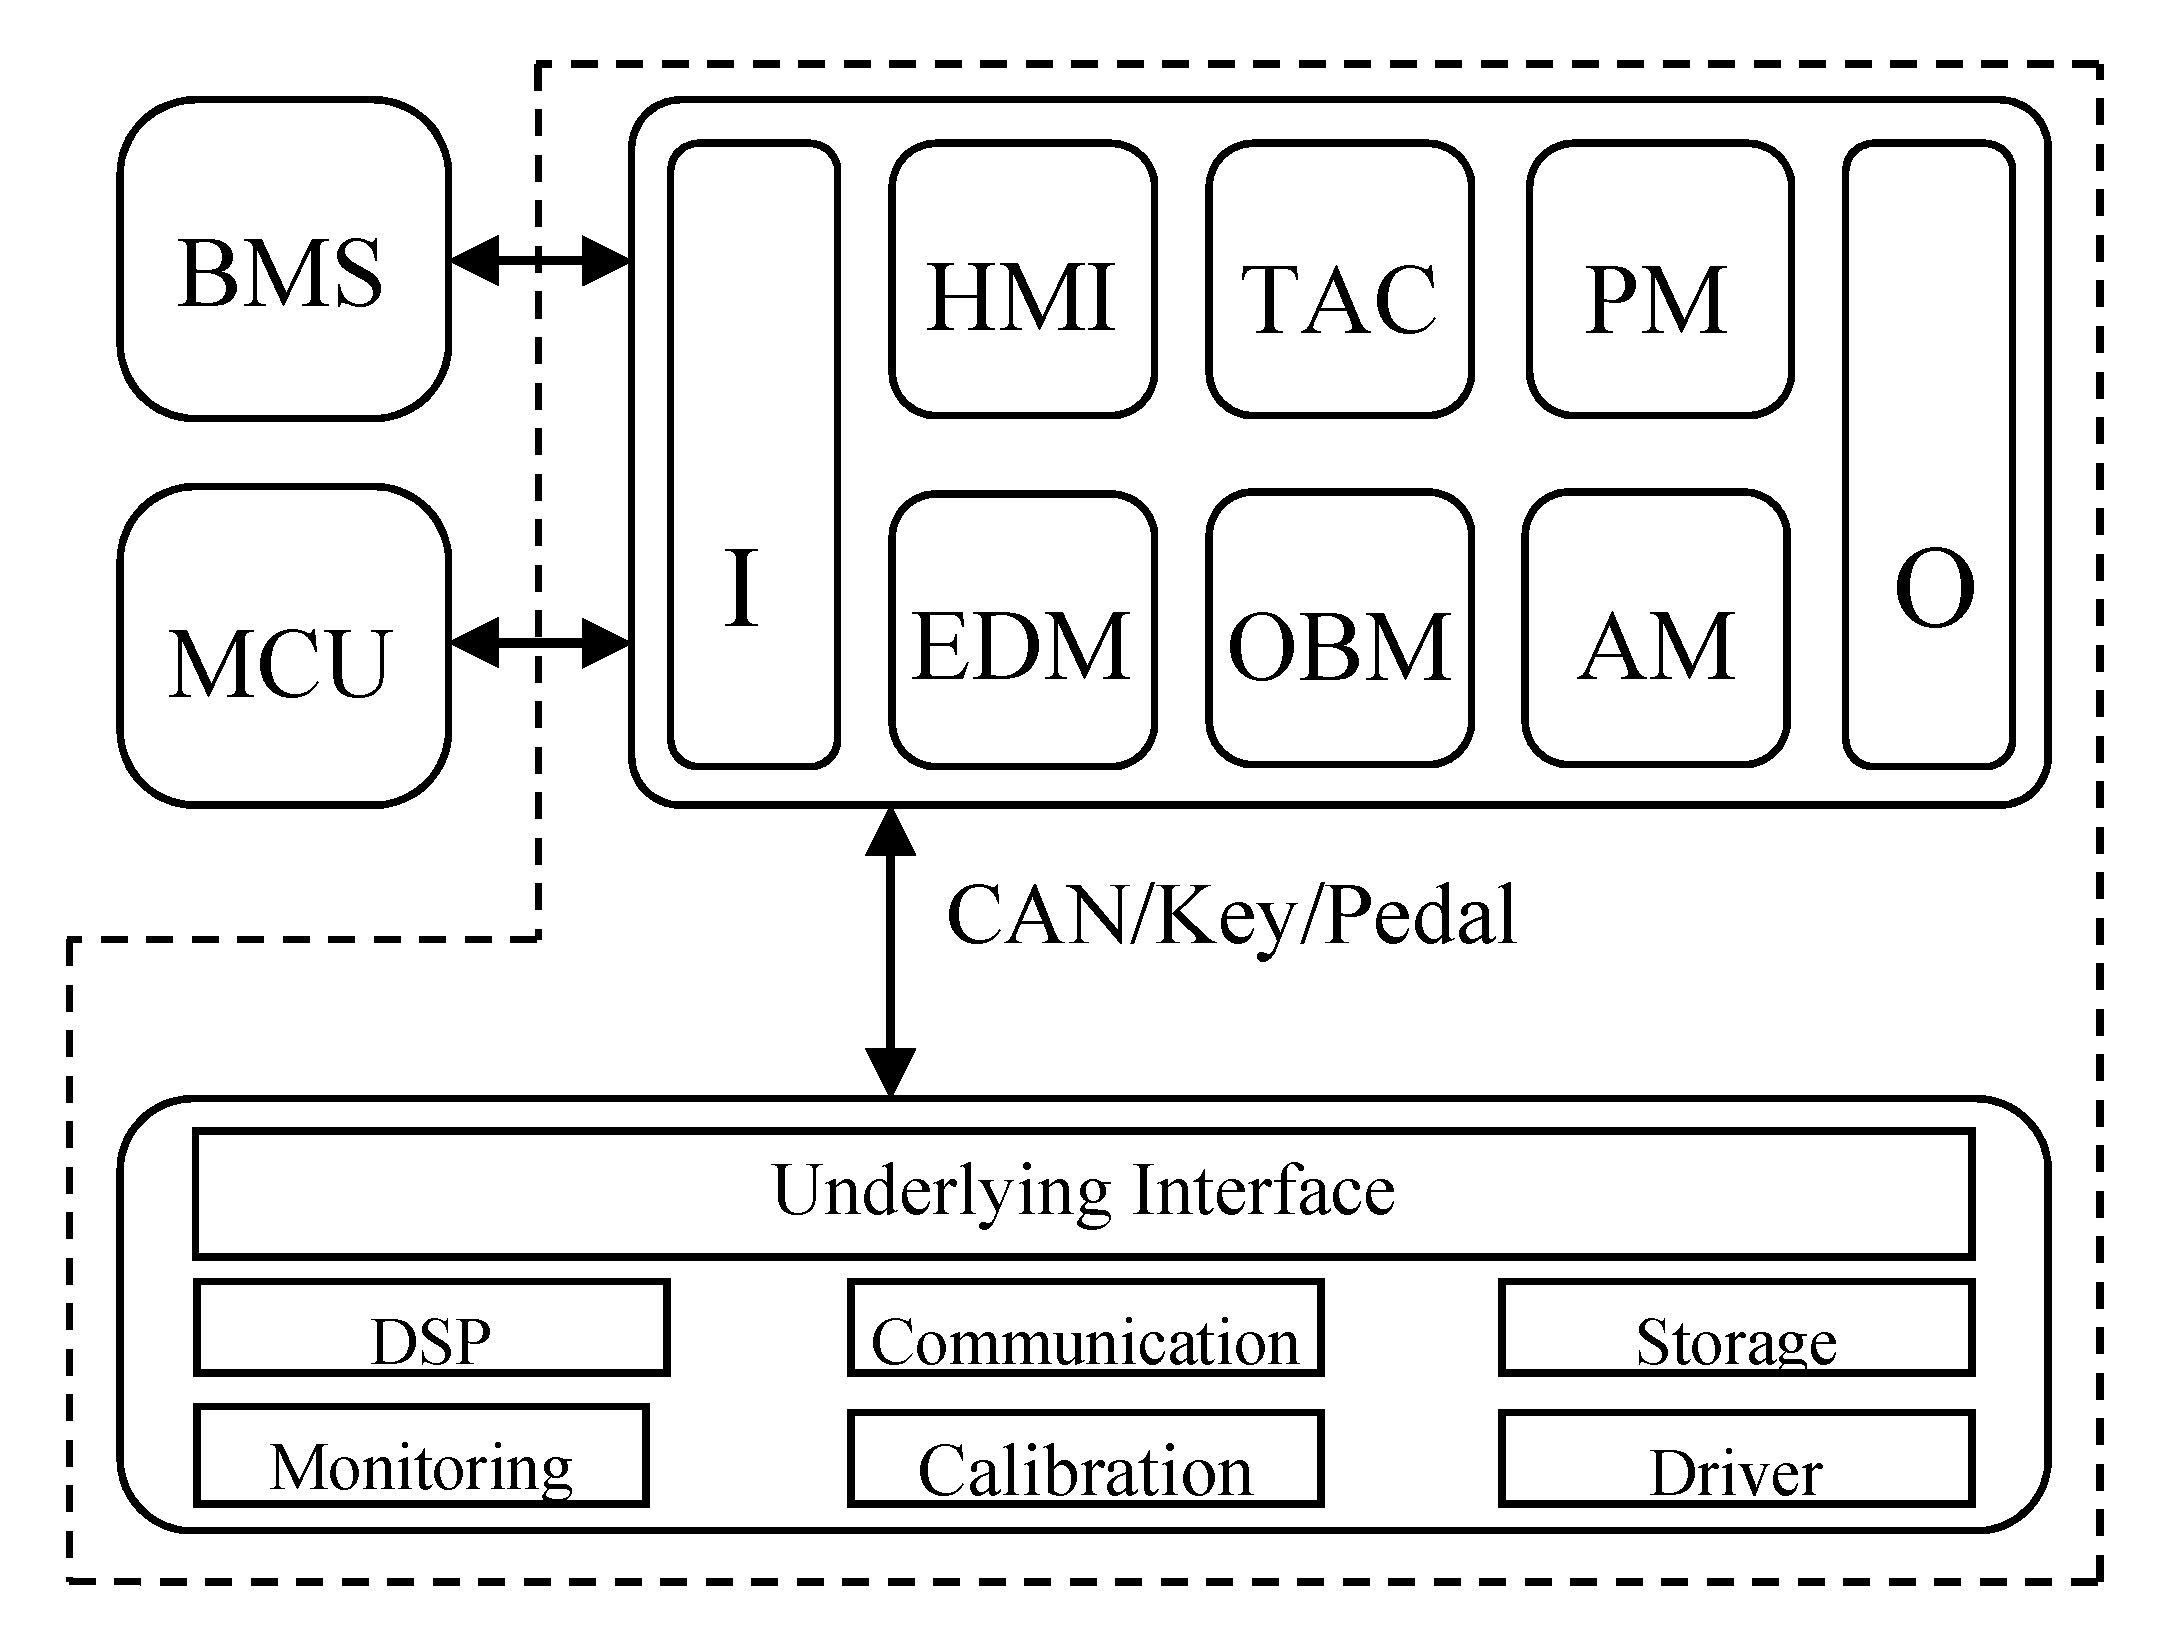
2.1. Controller Architecture
2.2. Mathematical Model
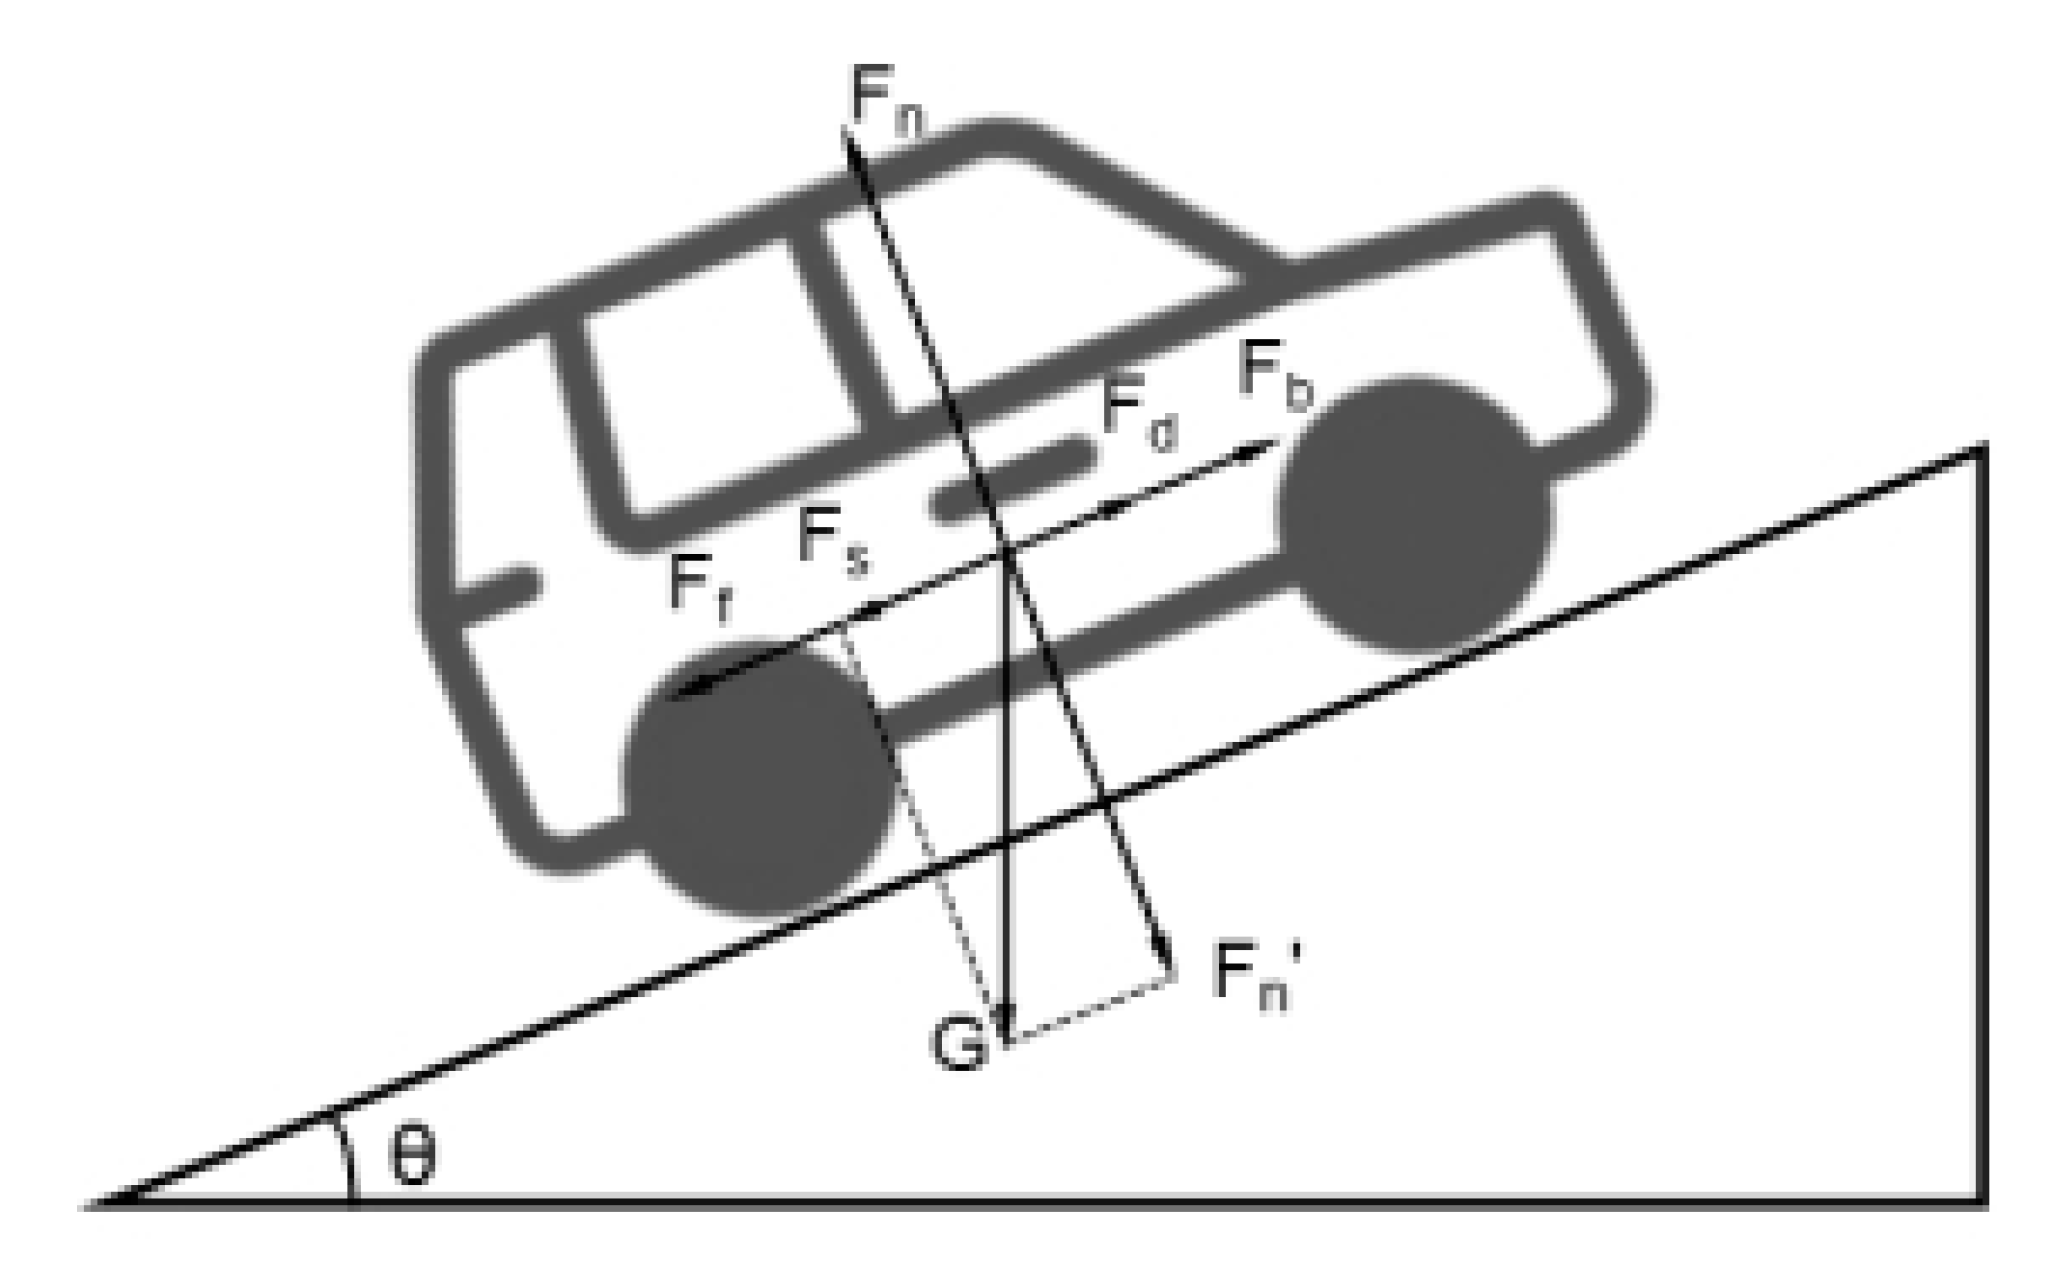
2.2.1. Vehicle Modeling
- Ft is the longitudinal driving force of the vehicle.
- m is the mass of the vehicle,
- g is the acceleration of gravity.
- CD is the air resistance coefficient,
- A is the windward area,
- v is the longitudinal driving speed of the vehicle.
2.2.2. Wheel Modeling
- Tt is the torque by wheel,
- Td is the longitudinal traction torque by the motor,
- Tb is the braking torque,
- Tr is the rolling resistance moment term.
- P is the brake cylinder pressure,
- N is the wheel speed,
- Npads is the number of brake pads,
- μstatic is the static friction coefficient,
- μ is the dynamic friction coefficient,
- Ba is the diameter of the brake cylinder,
- Rm is the average radius of the brake pad.
- Ro is the radius of the outer circle of the brake pad,
- Ri is the radius of the inner circle of the brake pad.
- ω is the angular velocity of the wheel,
- Re is the effective tire radius under load and given pressure,
- Le is the relaxation length of the tire,
- Fx is the longitudinal force due to slippage.
- Fz is the normal force acting on the wheel,
- pi is the tire pressure,
- a is constant term coefficient,
- b is first term coefficient,
- c is quadratic term coefficient,
- λ is tire pressure coefficient,
- ξ is normal force coefficient.
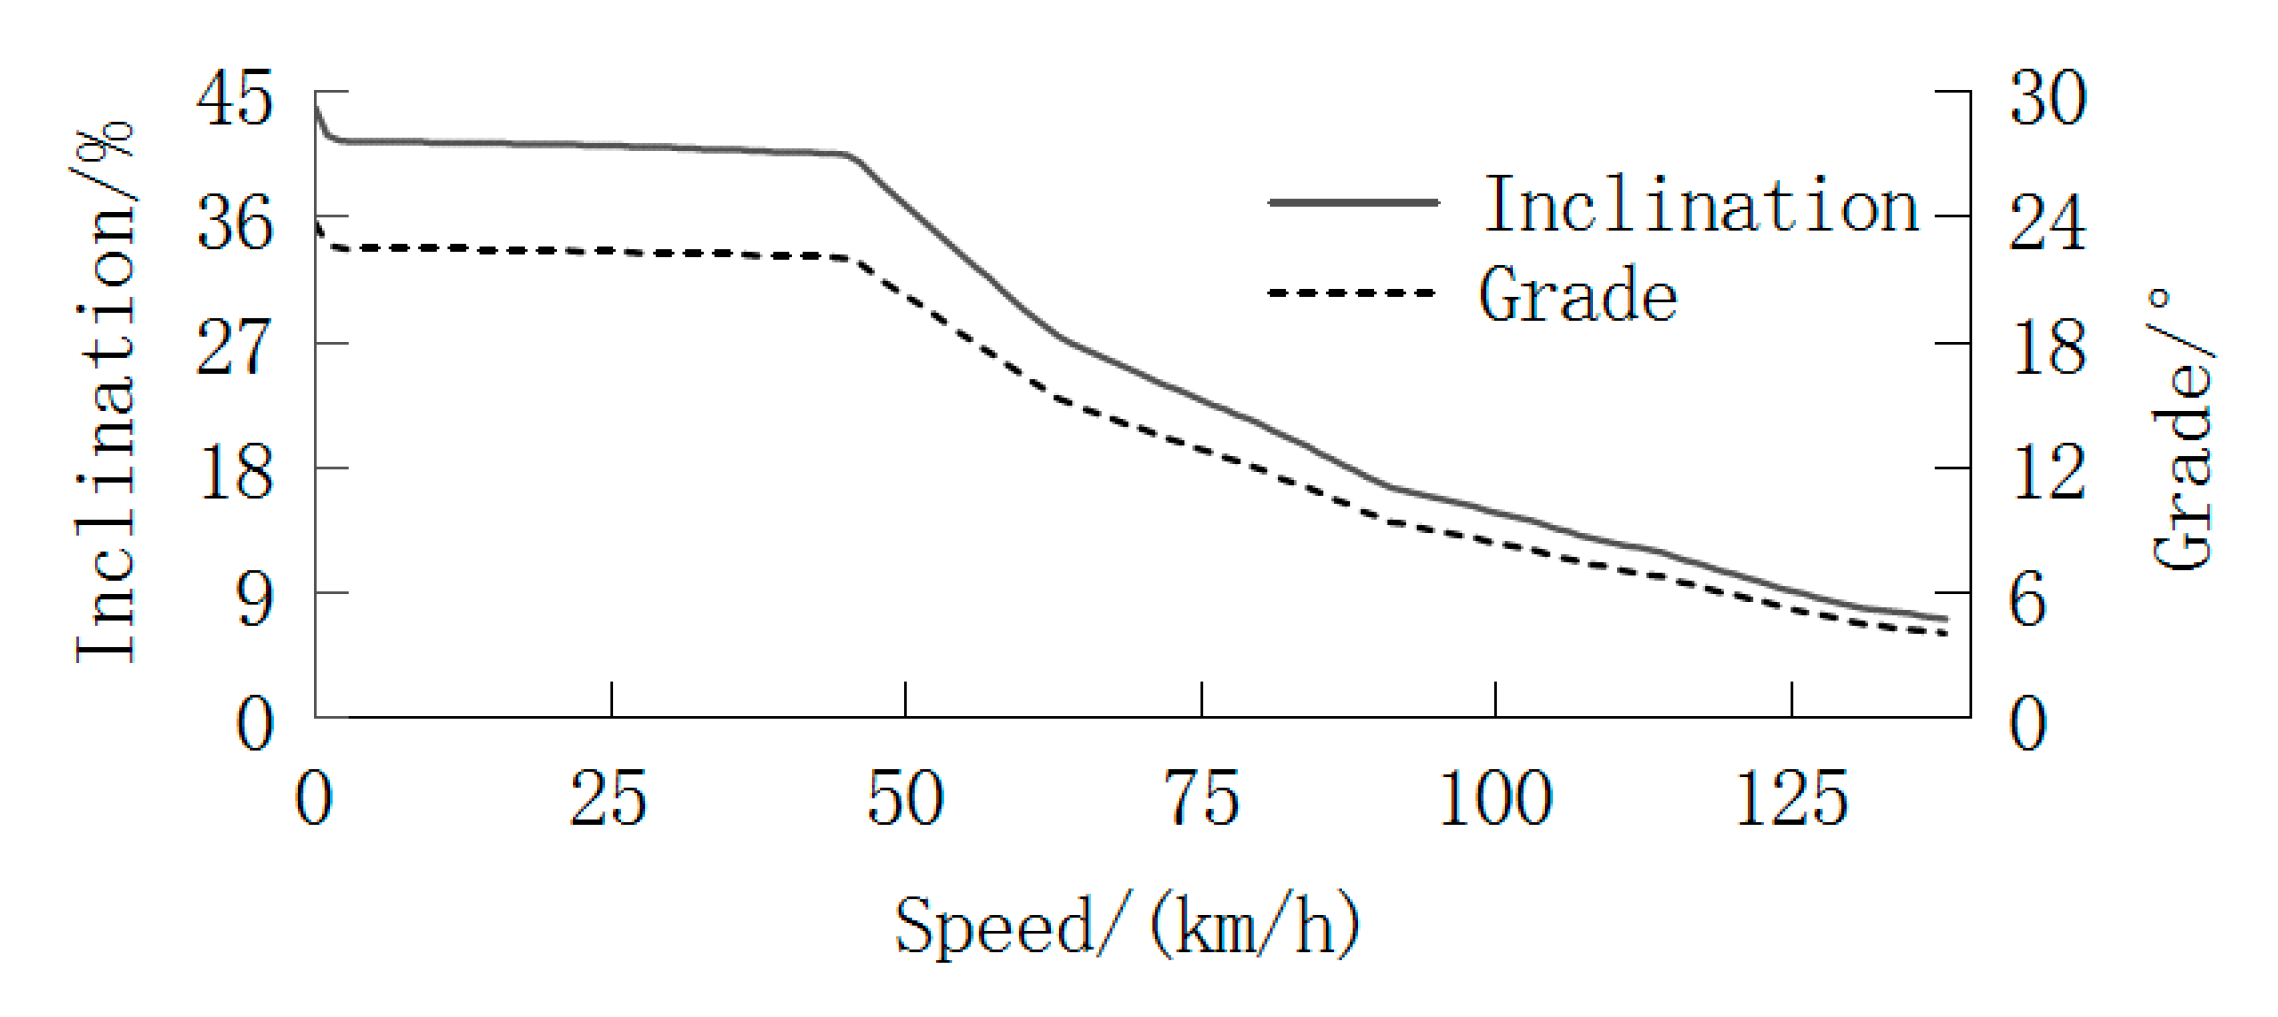
2.3. Inclination Calculation Method
2.4. Starting Control Method
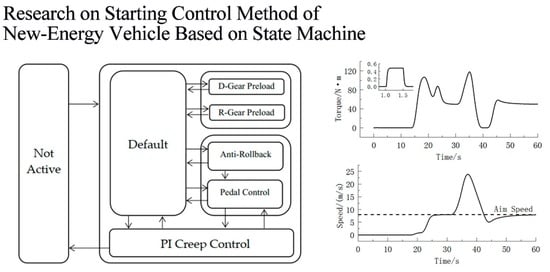
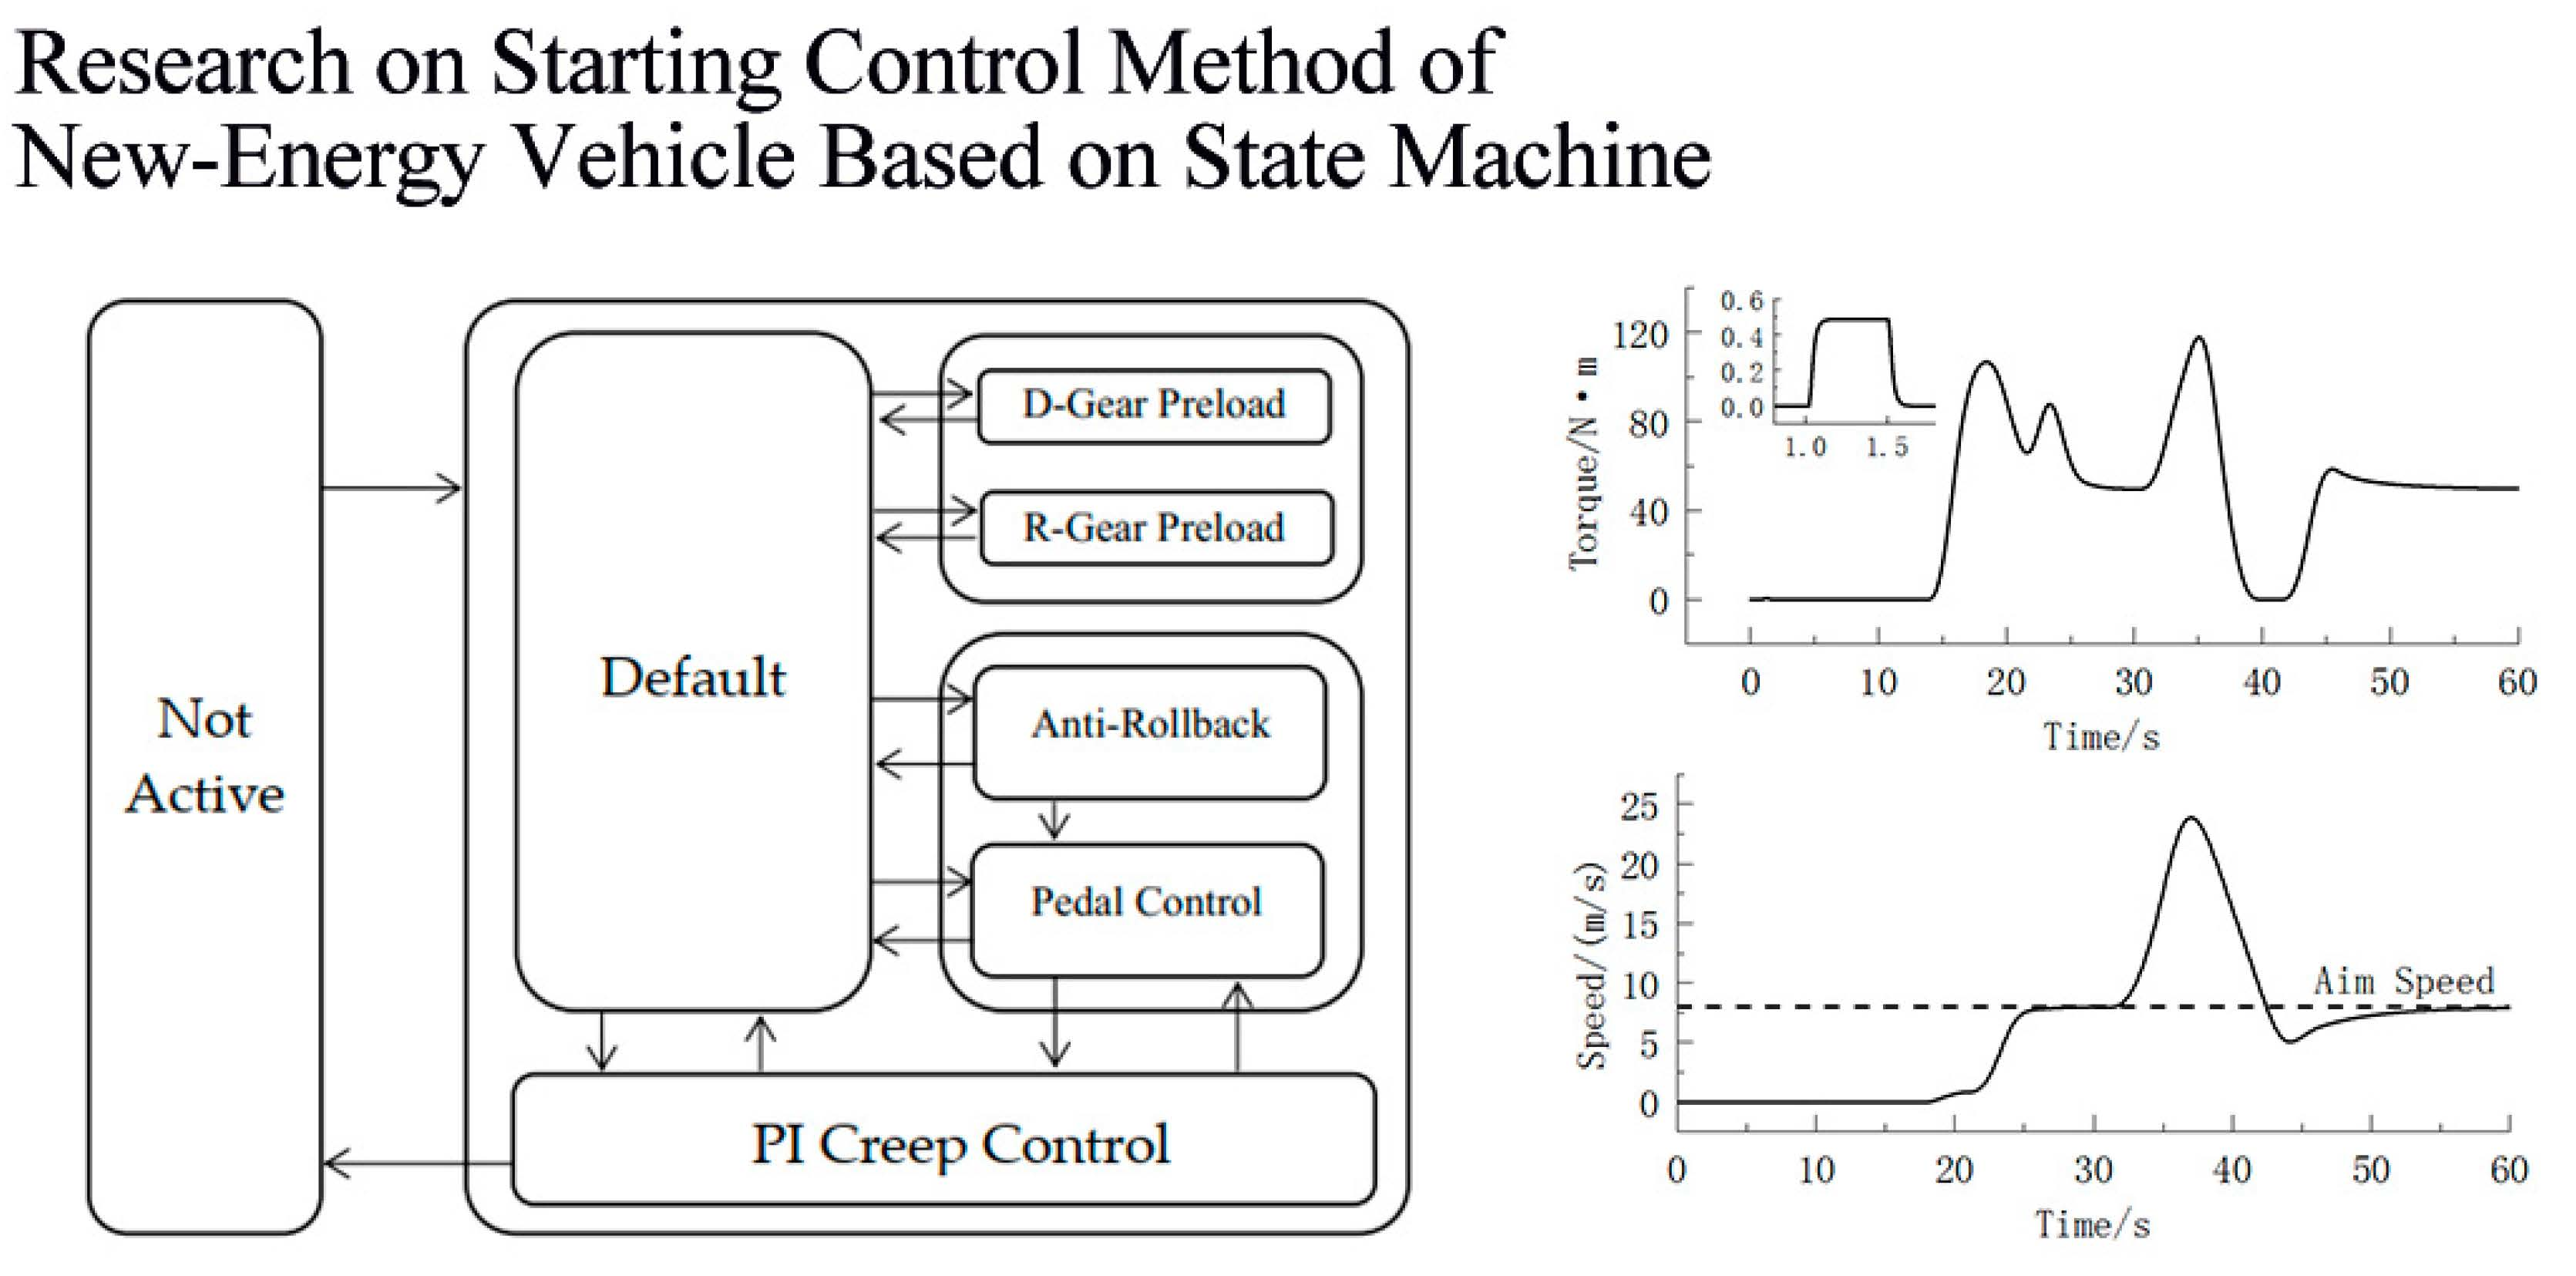
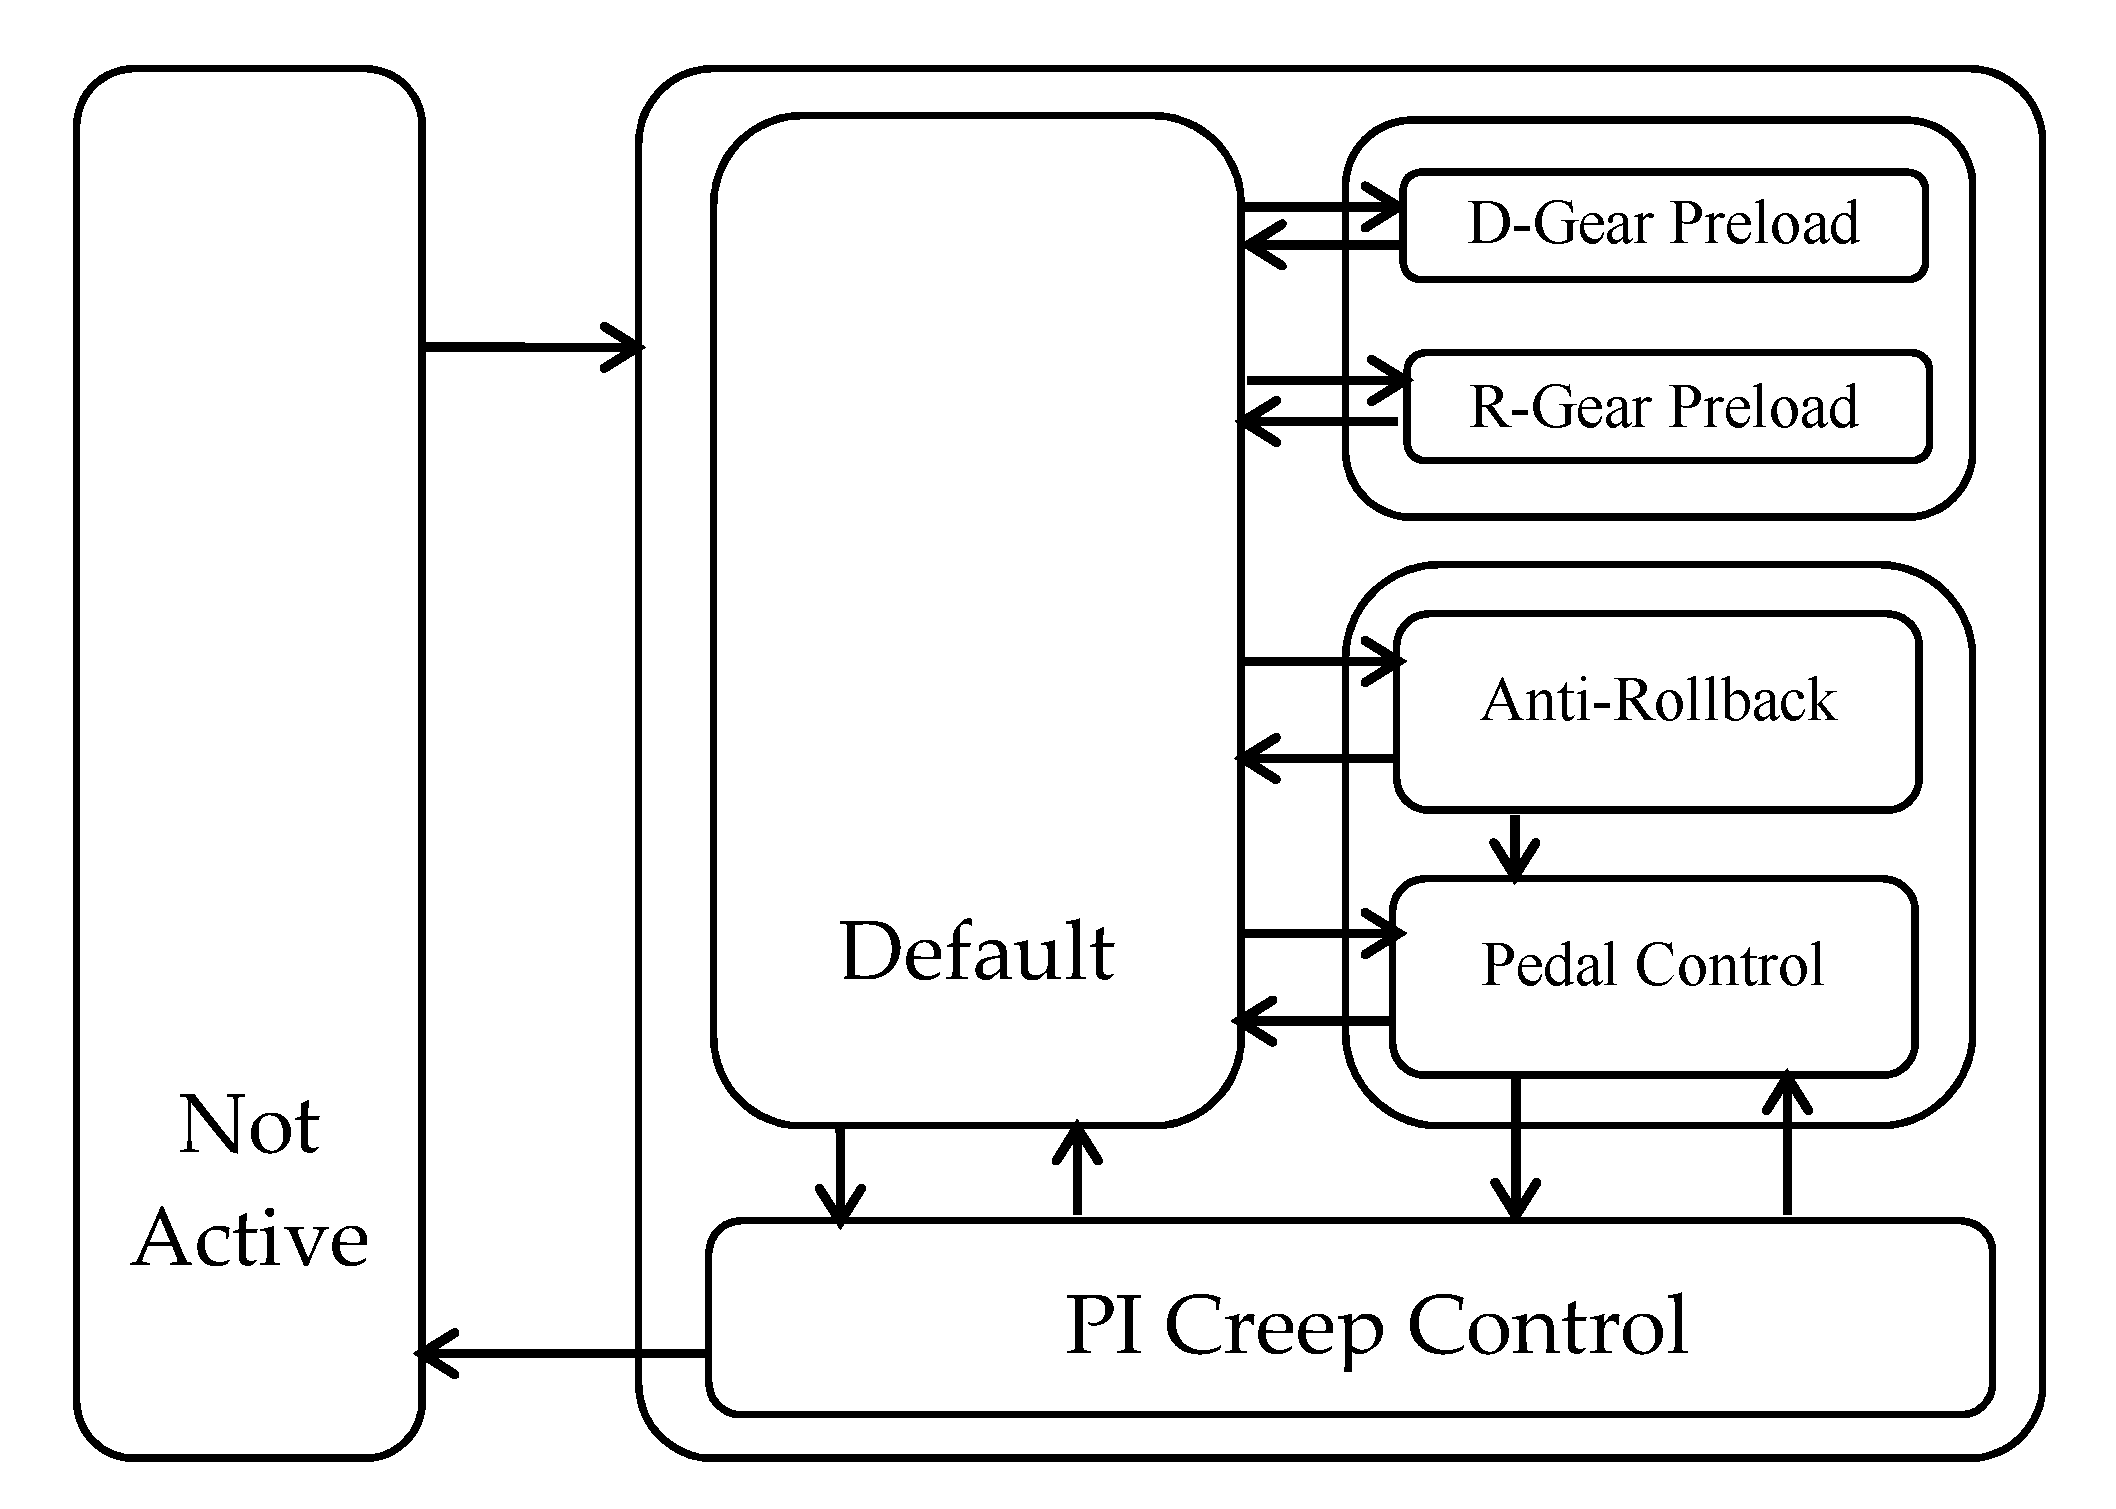
2.4.1. Framework and State Machine
2.4.2. Conversion Criteria
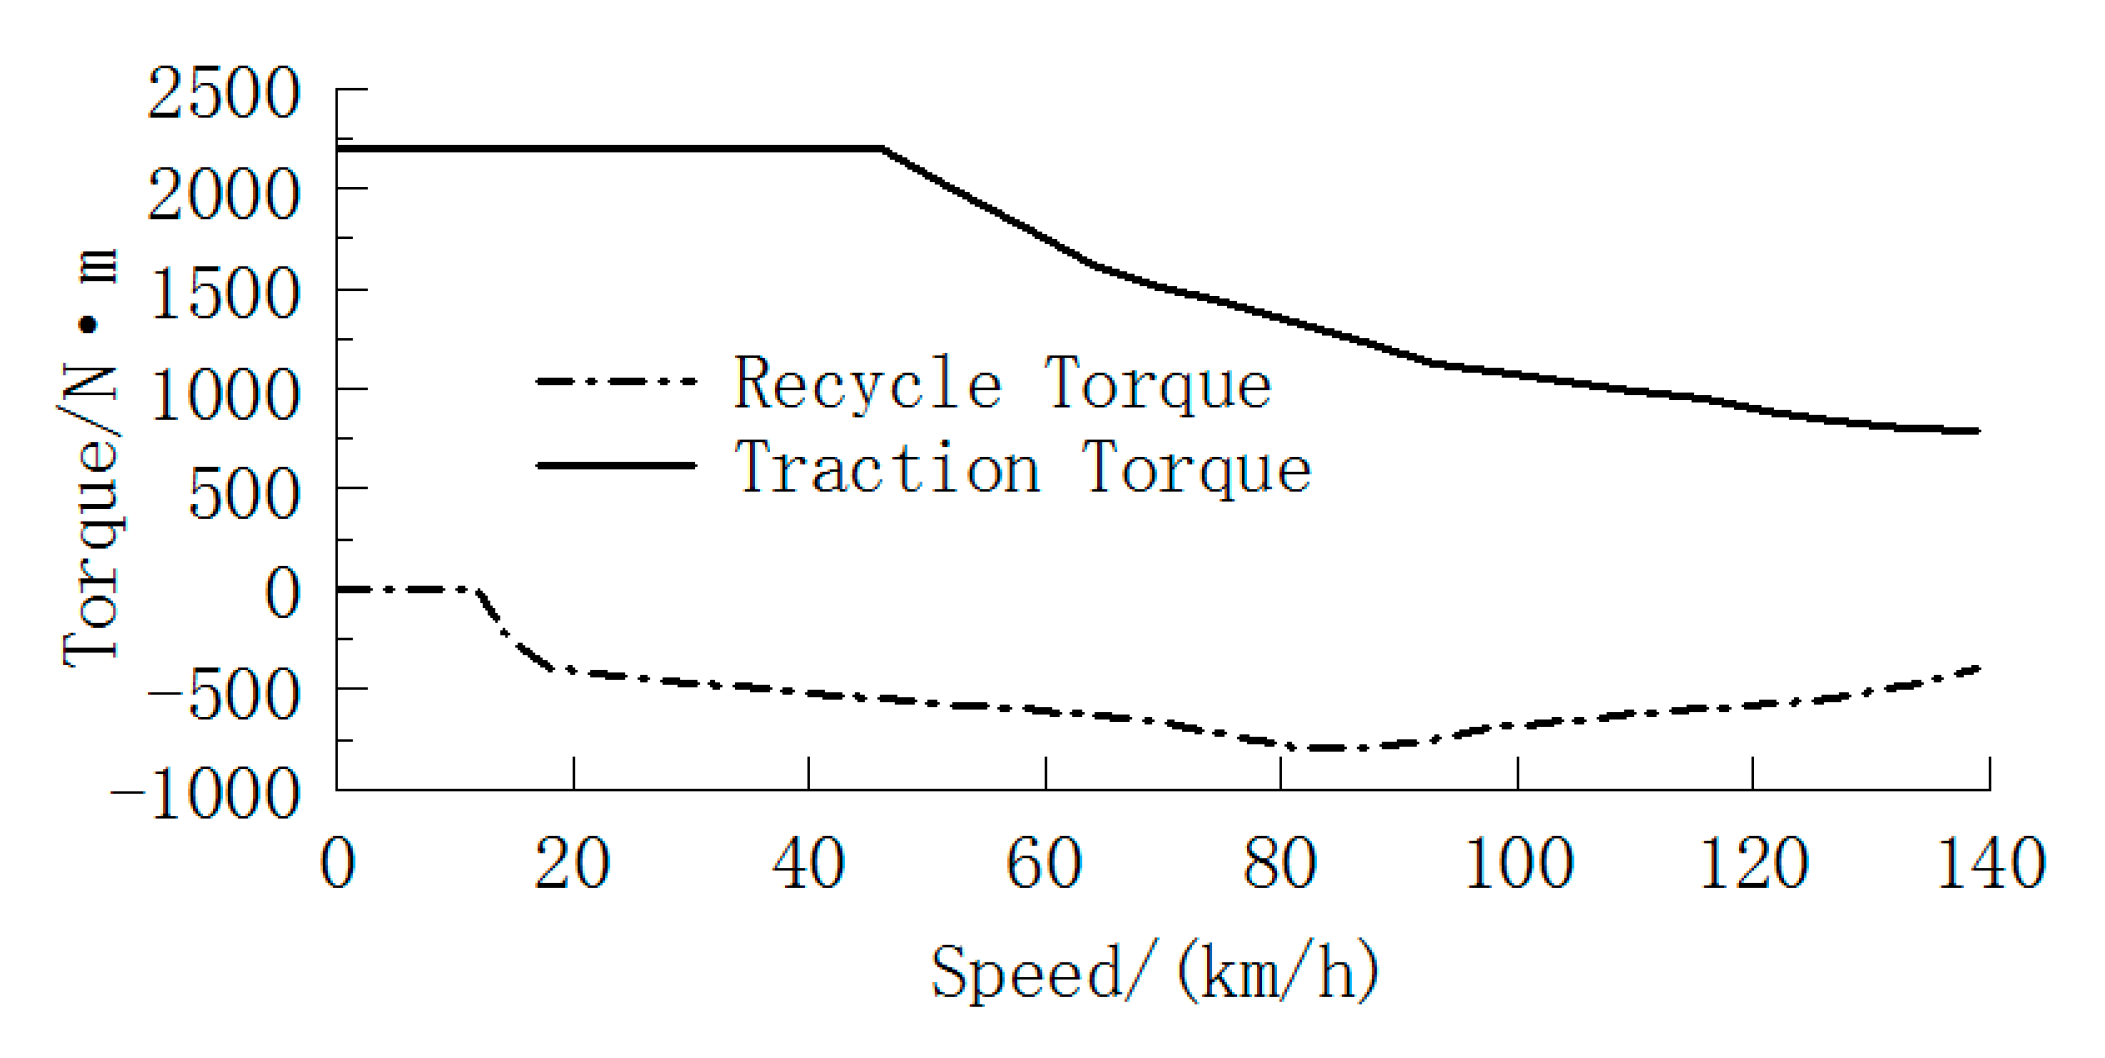
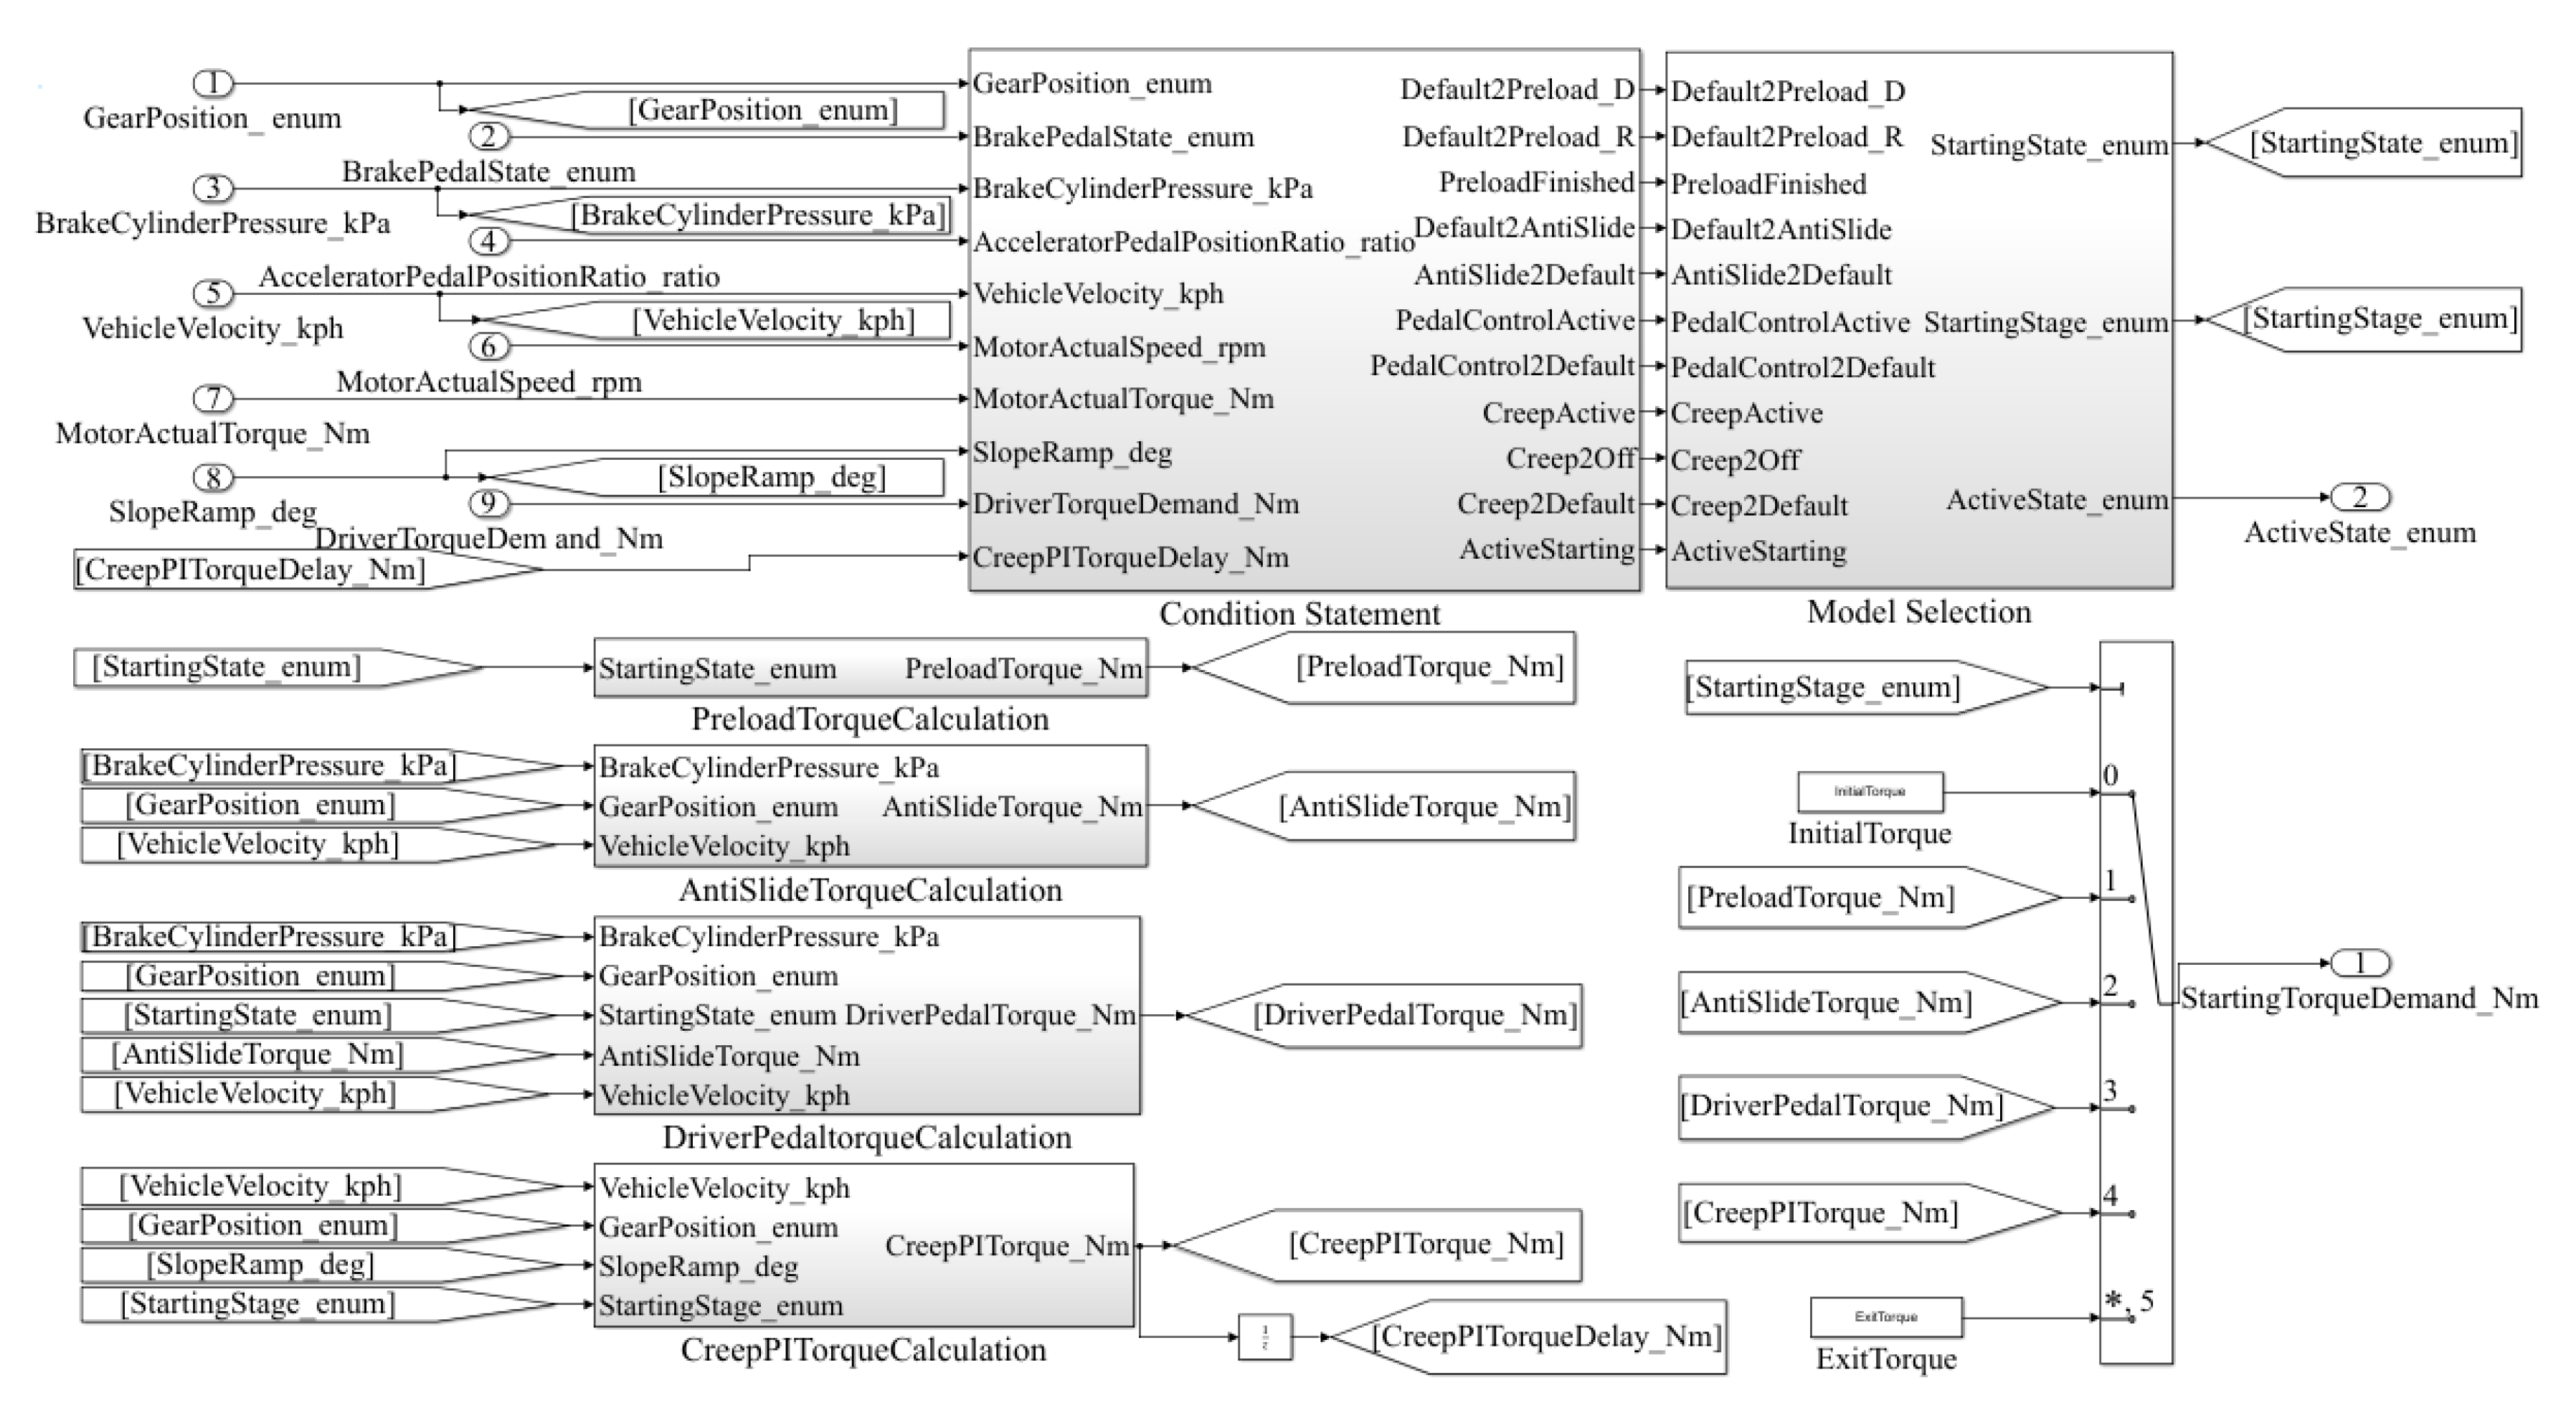
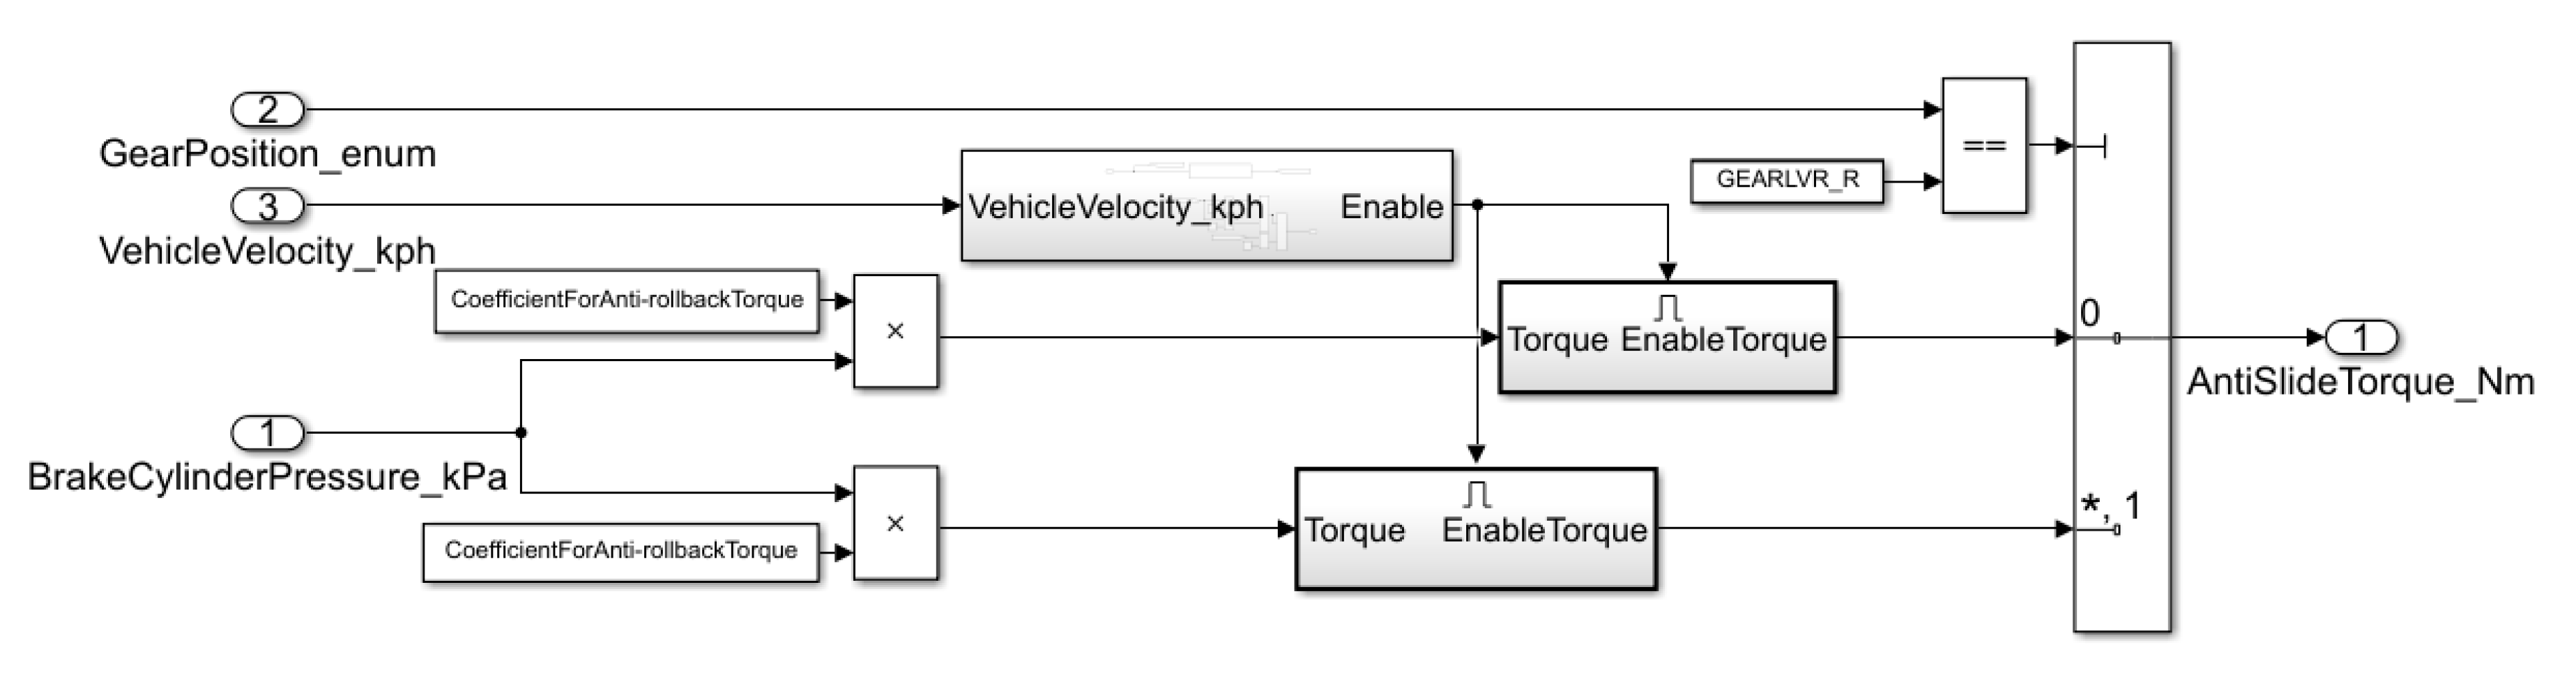
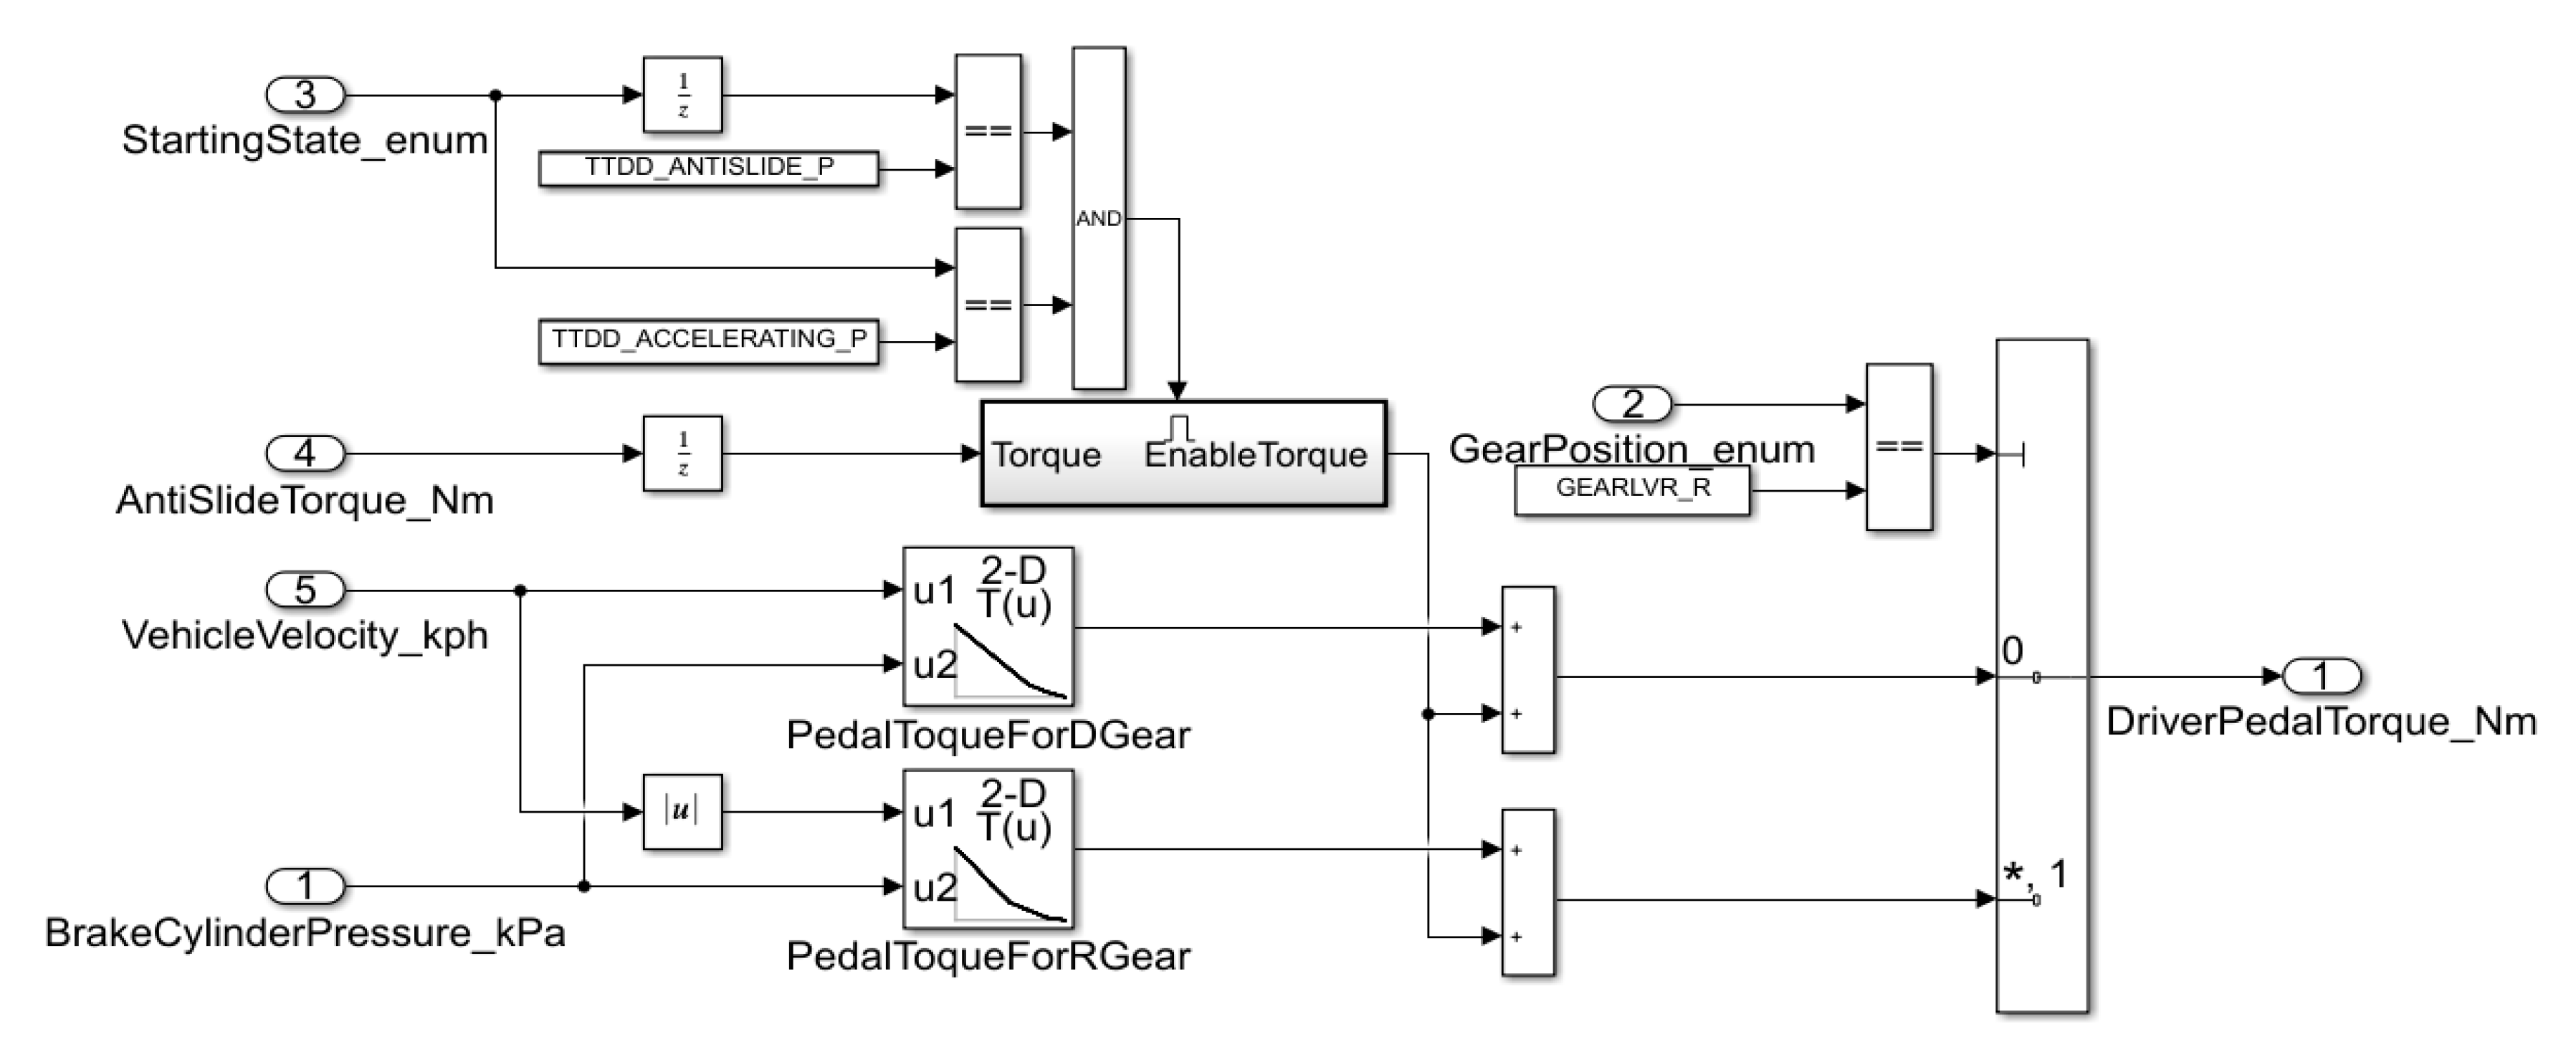
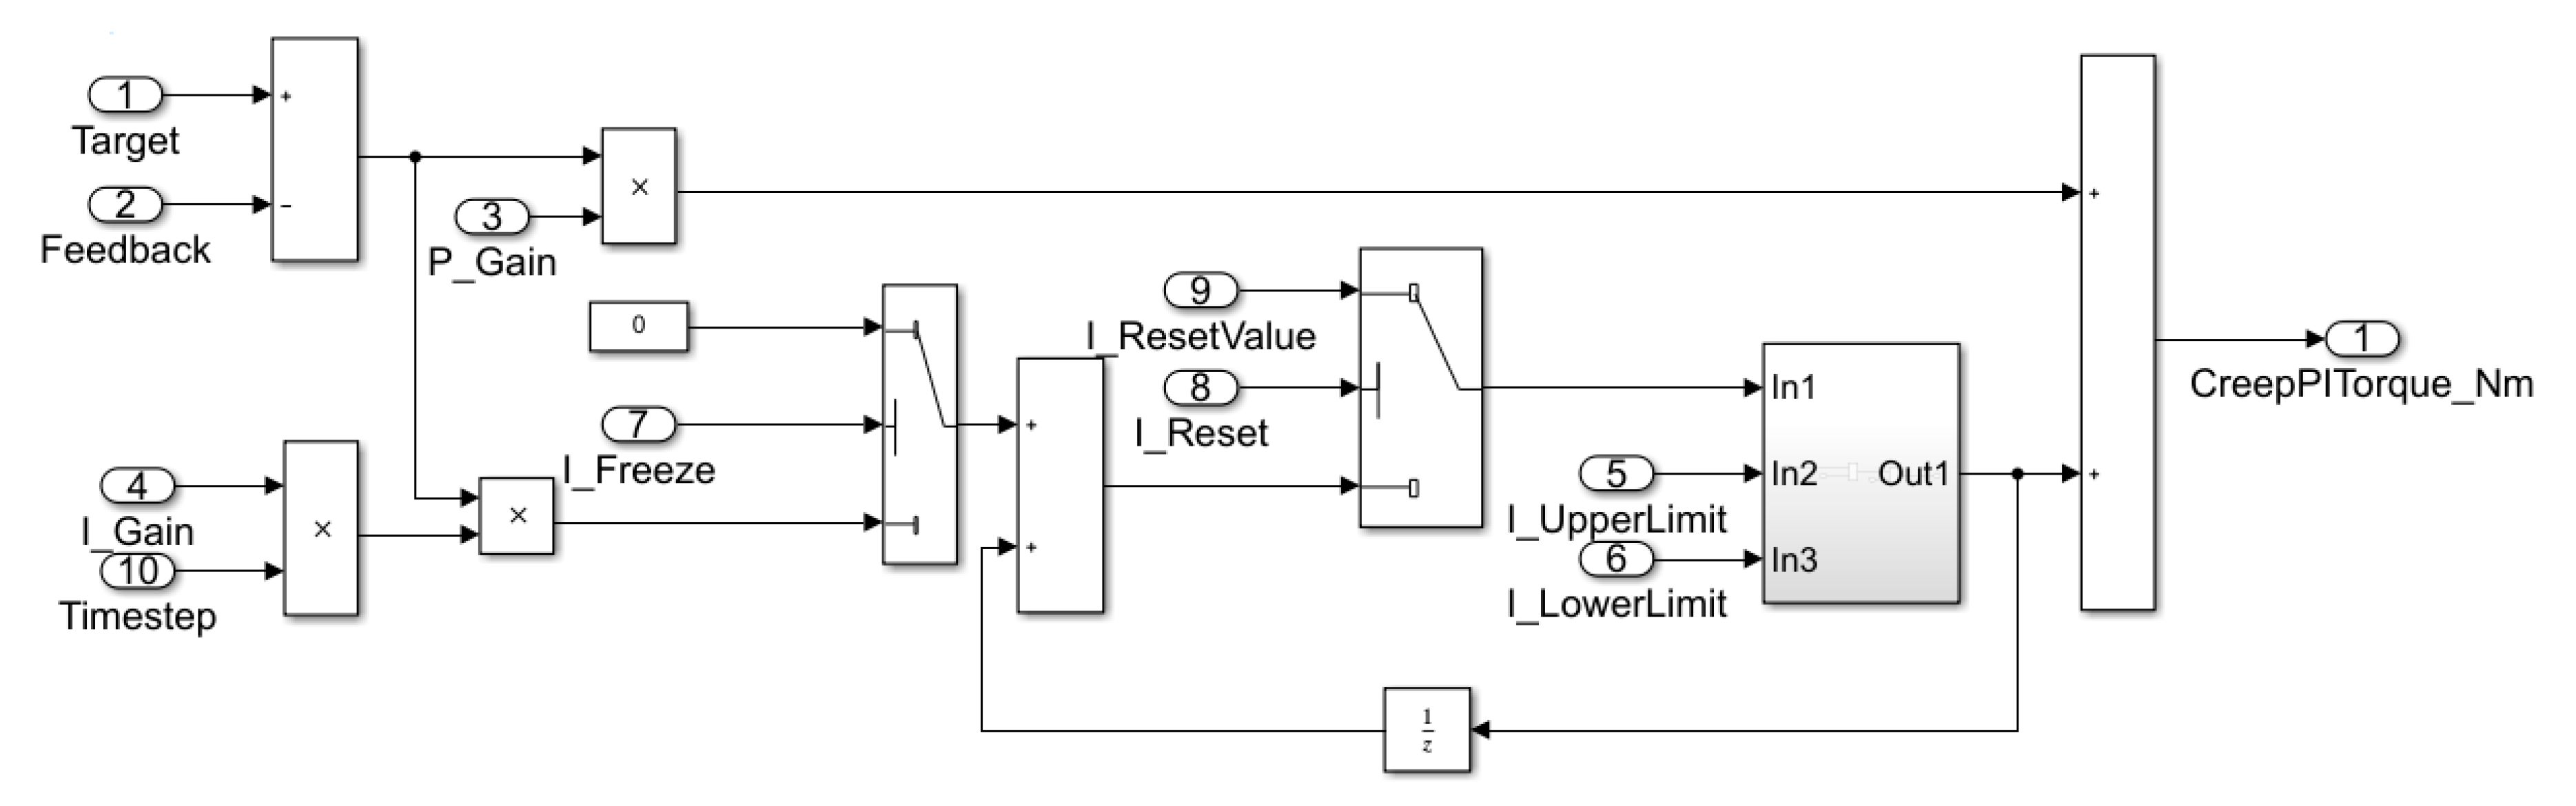
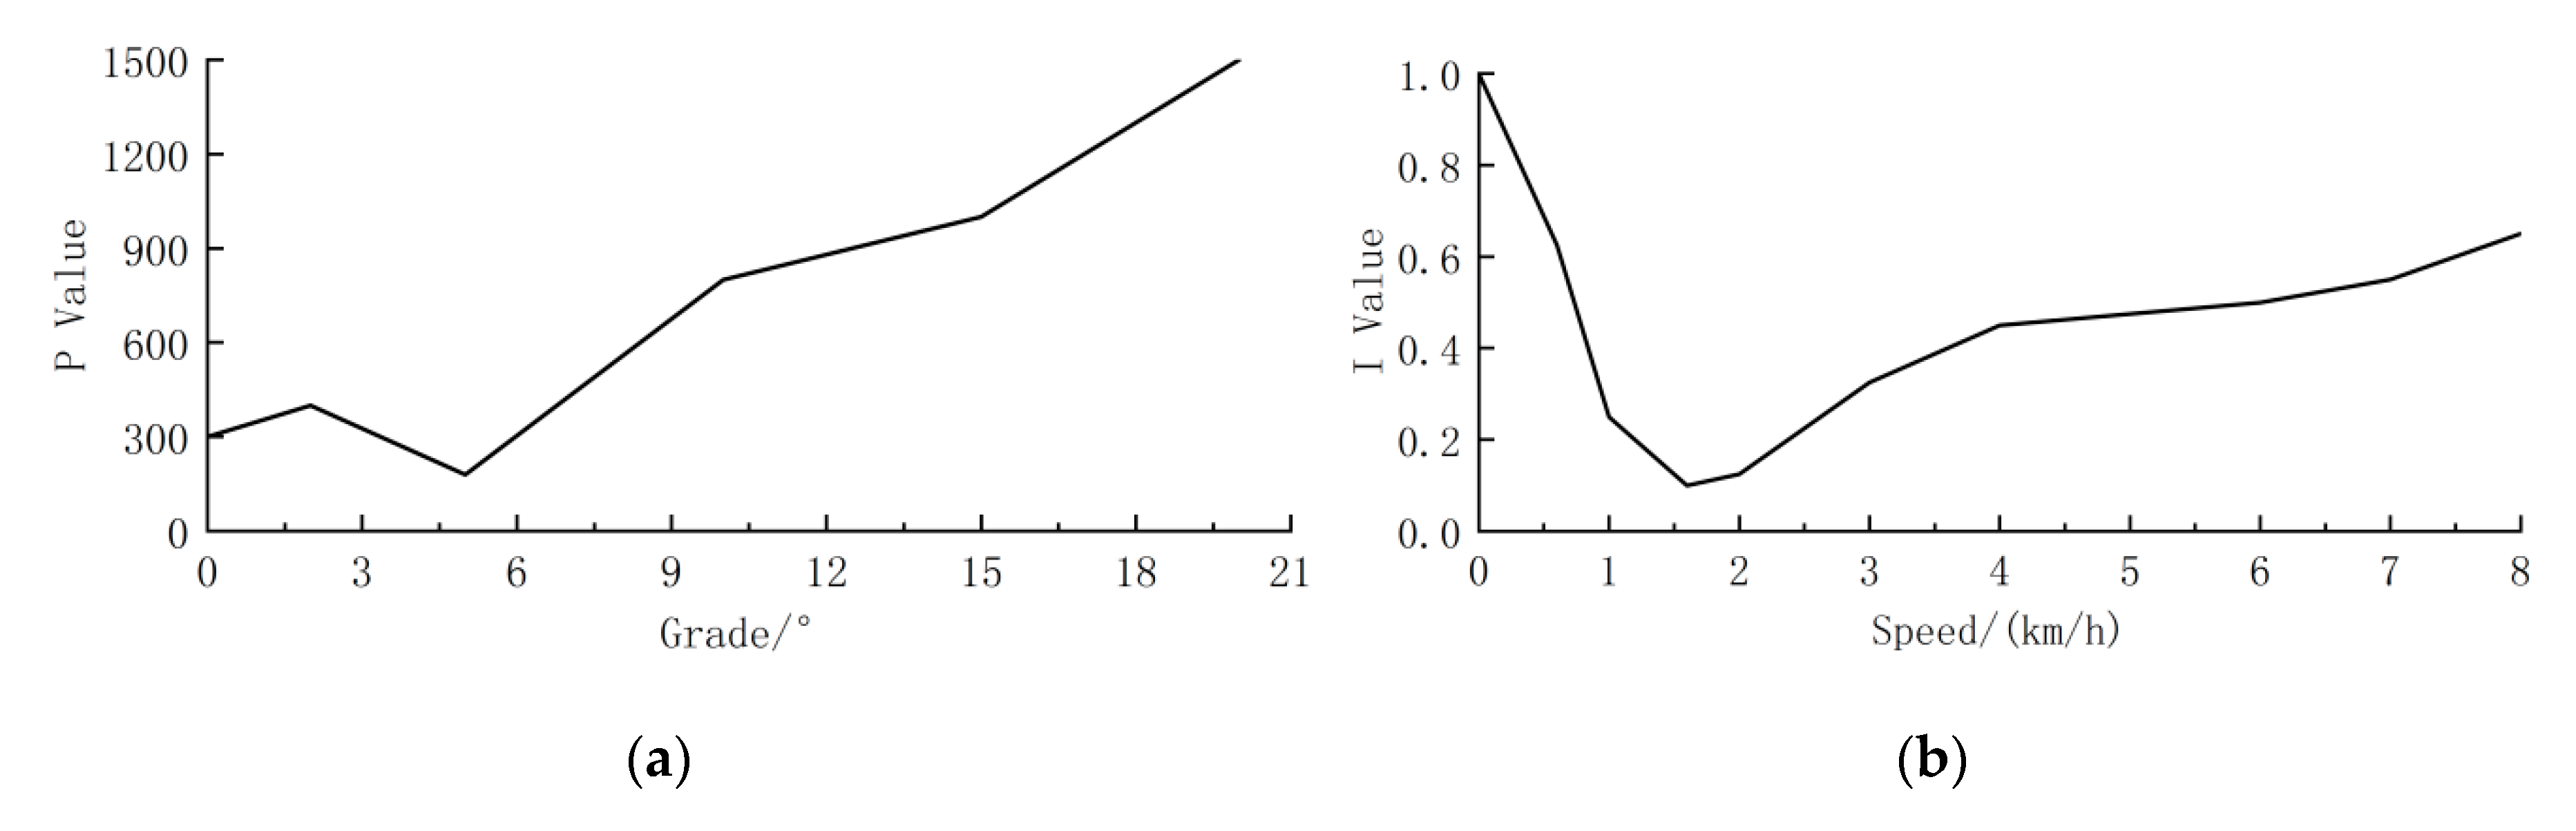
2.4.3. Torque Calculation
- β is the pedal aperture
- σ is the starting coefficient,
- β1 is 70% pedal aperture,
- β2 is the current pedal aperture,
- Tmax is the maximum braking torque,
- T10 is the braking torque at 70% pedal aperture.
- va is the target speed,
- p is the proportional coefficient,
- I is the integral coefficient.
- R is the wheel radius,
- η is the correction factor.
3. Results
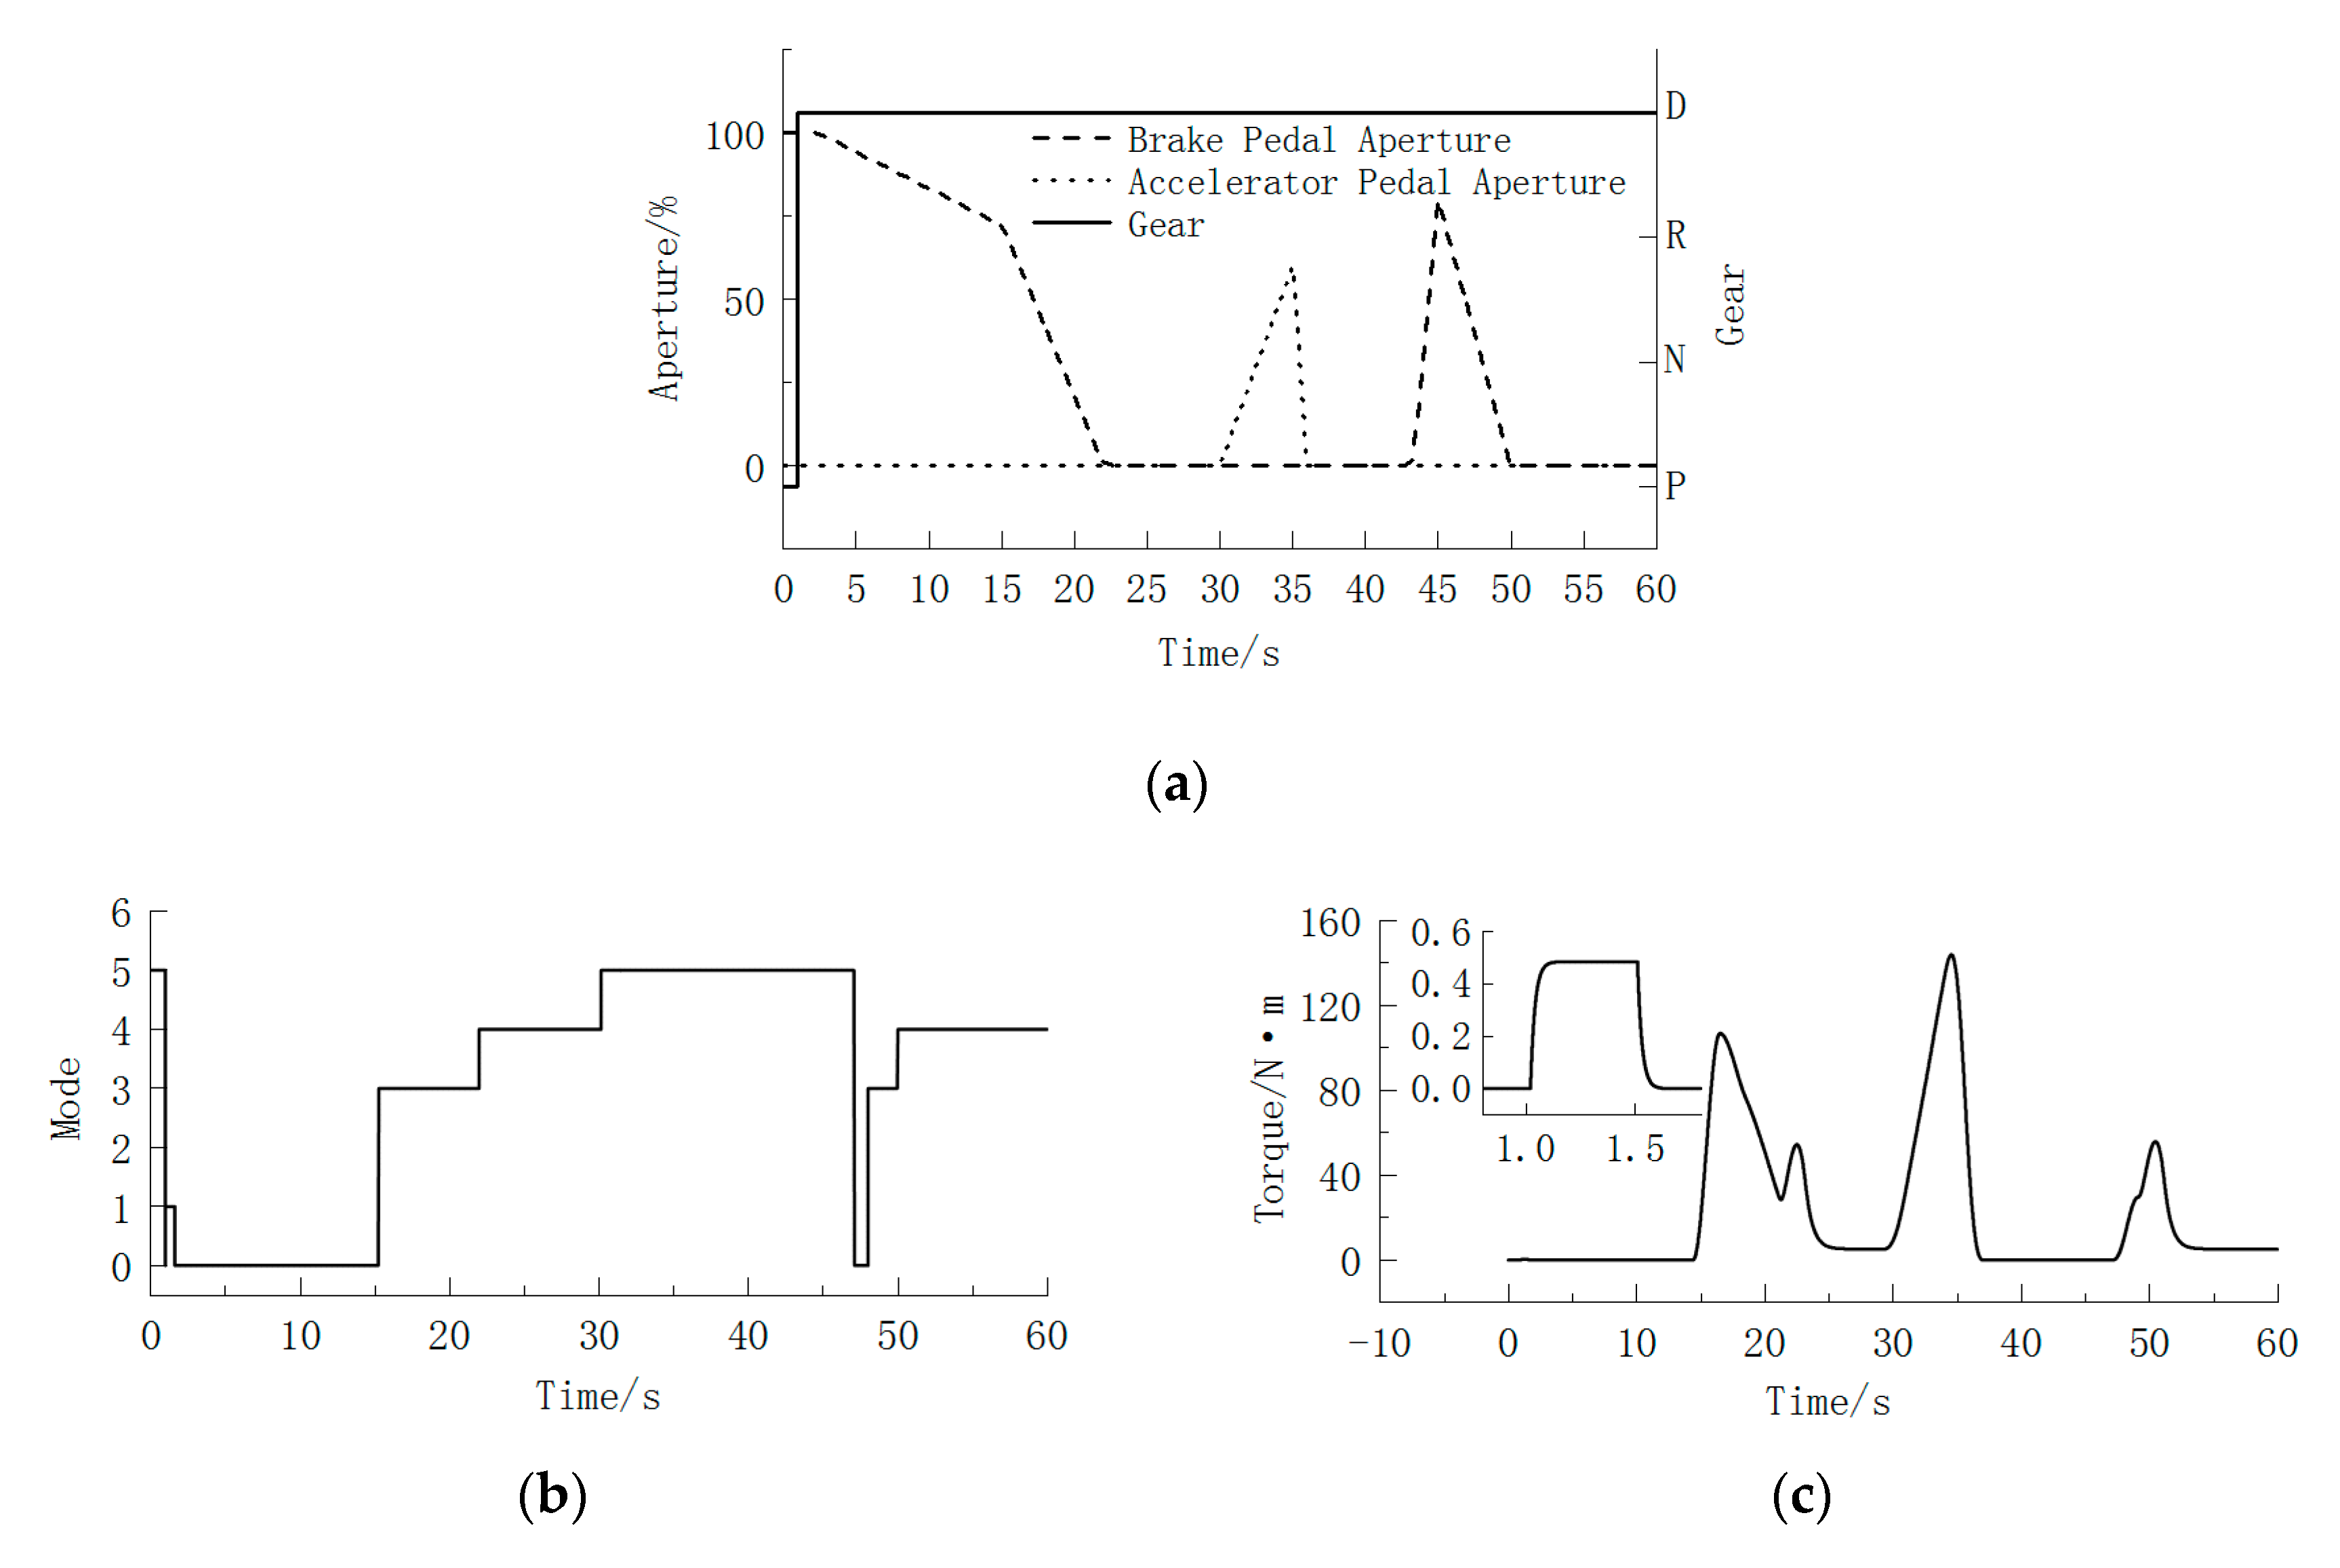
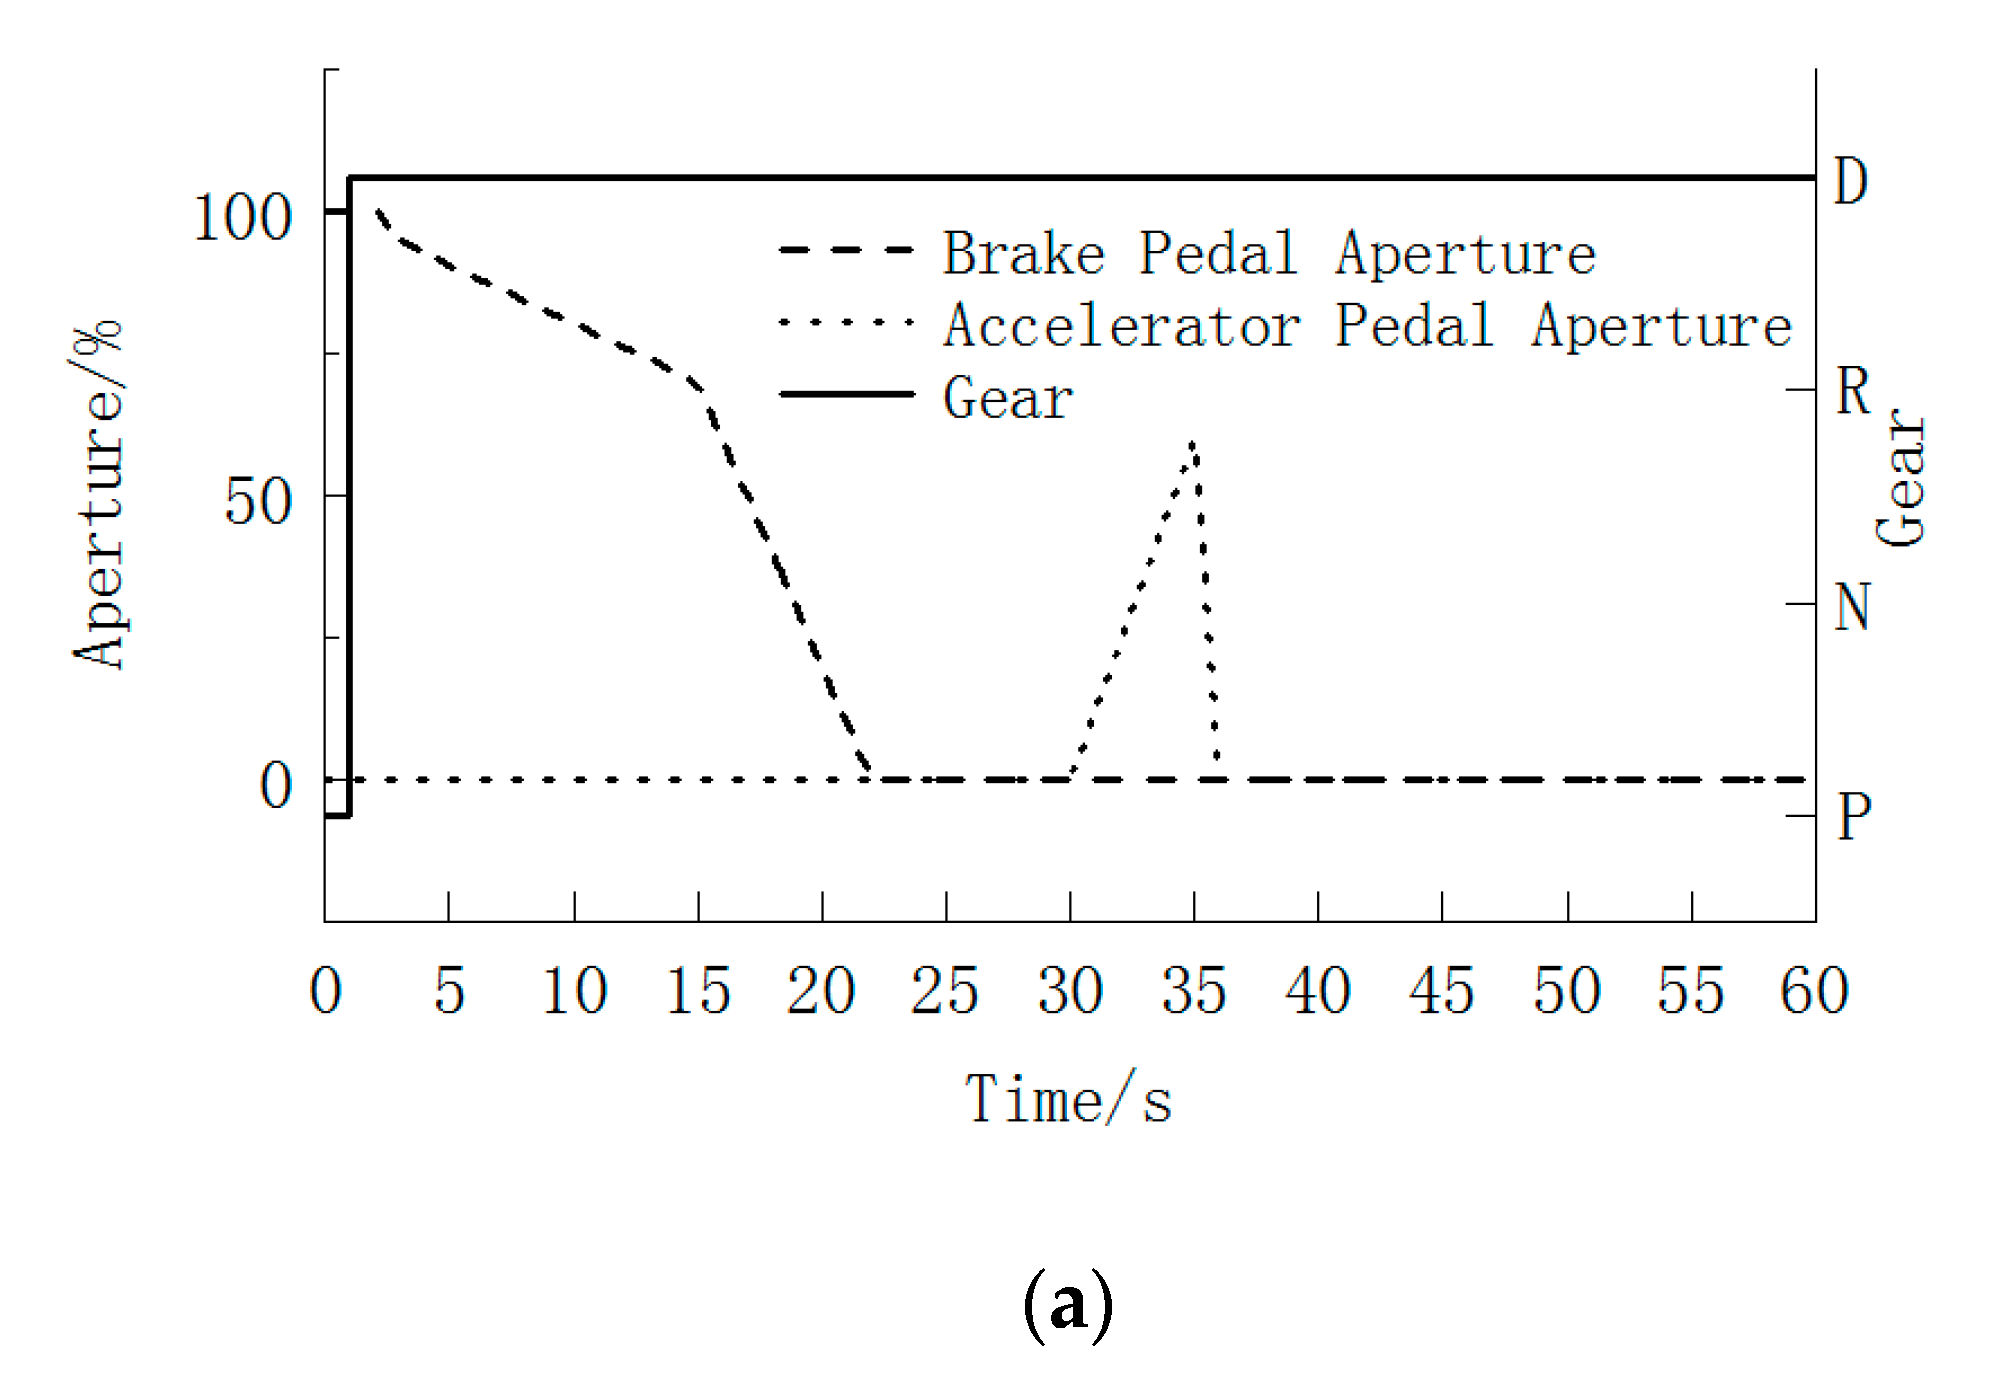
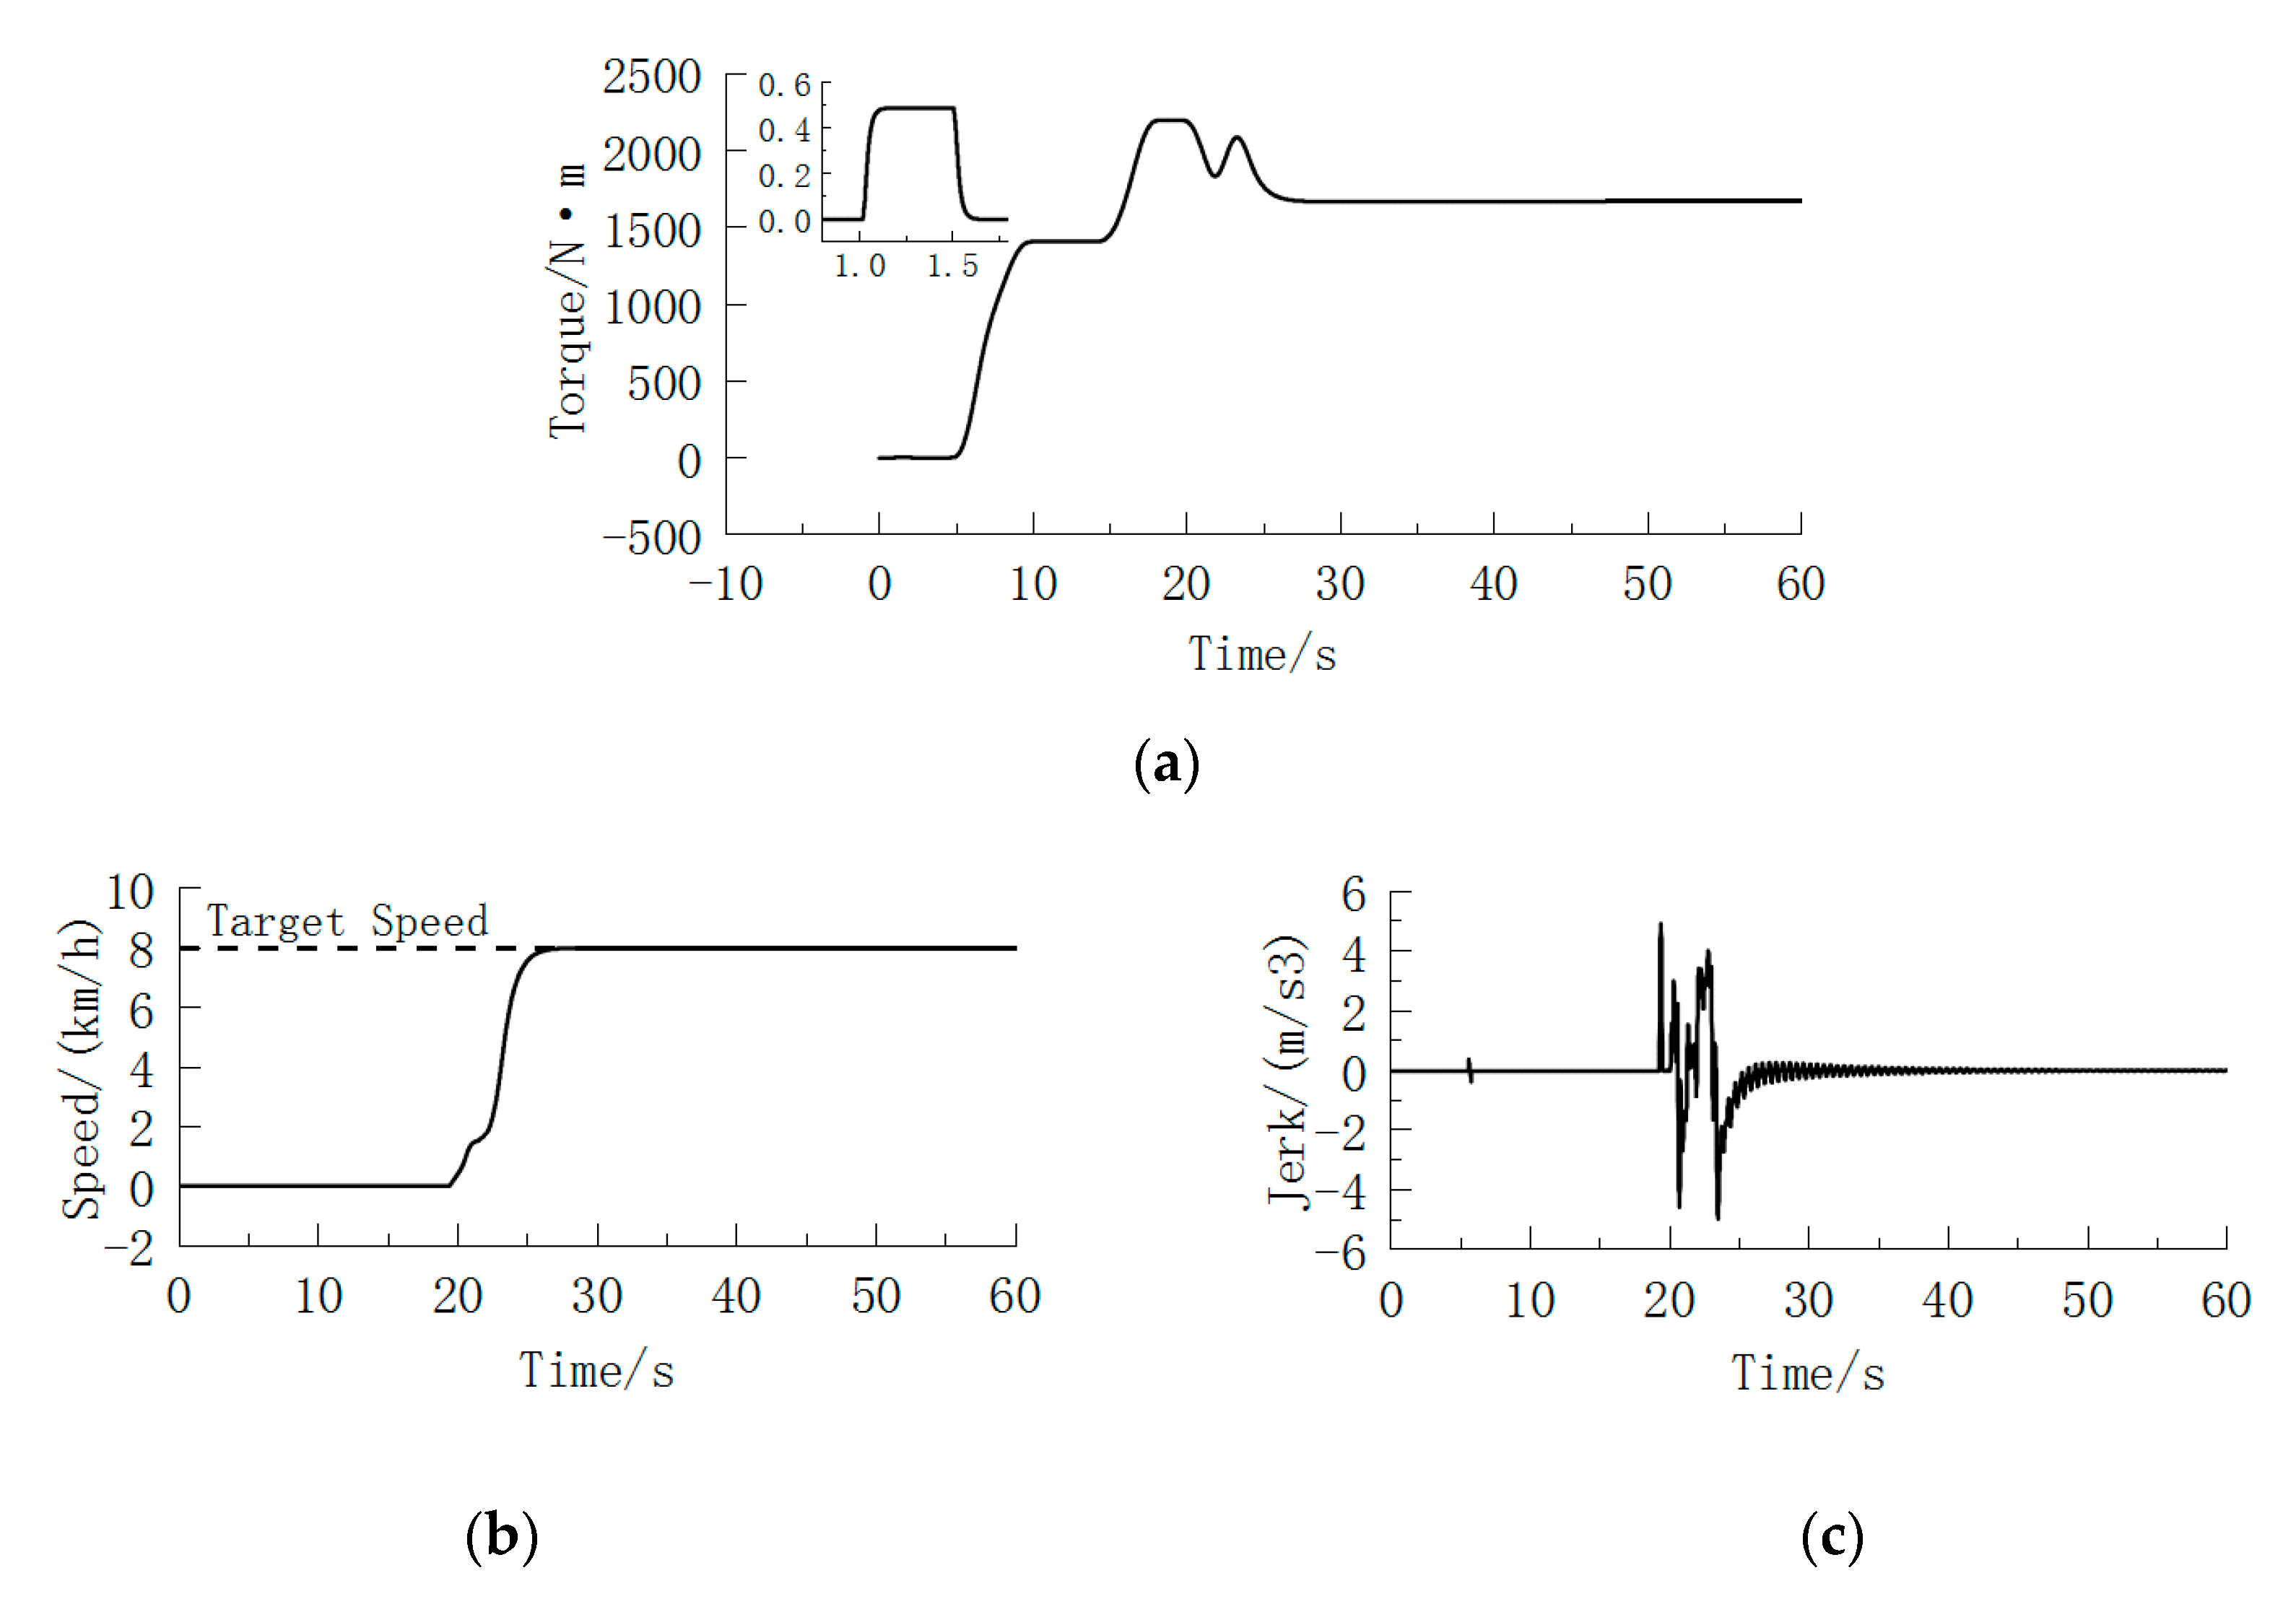
3.1. Flat Road
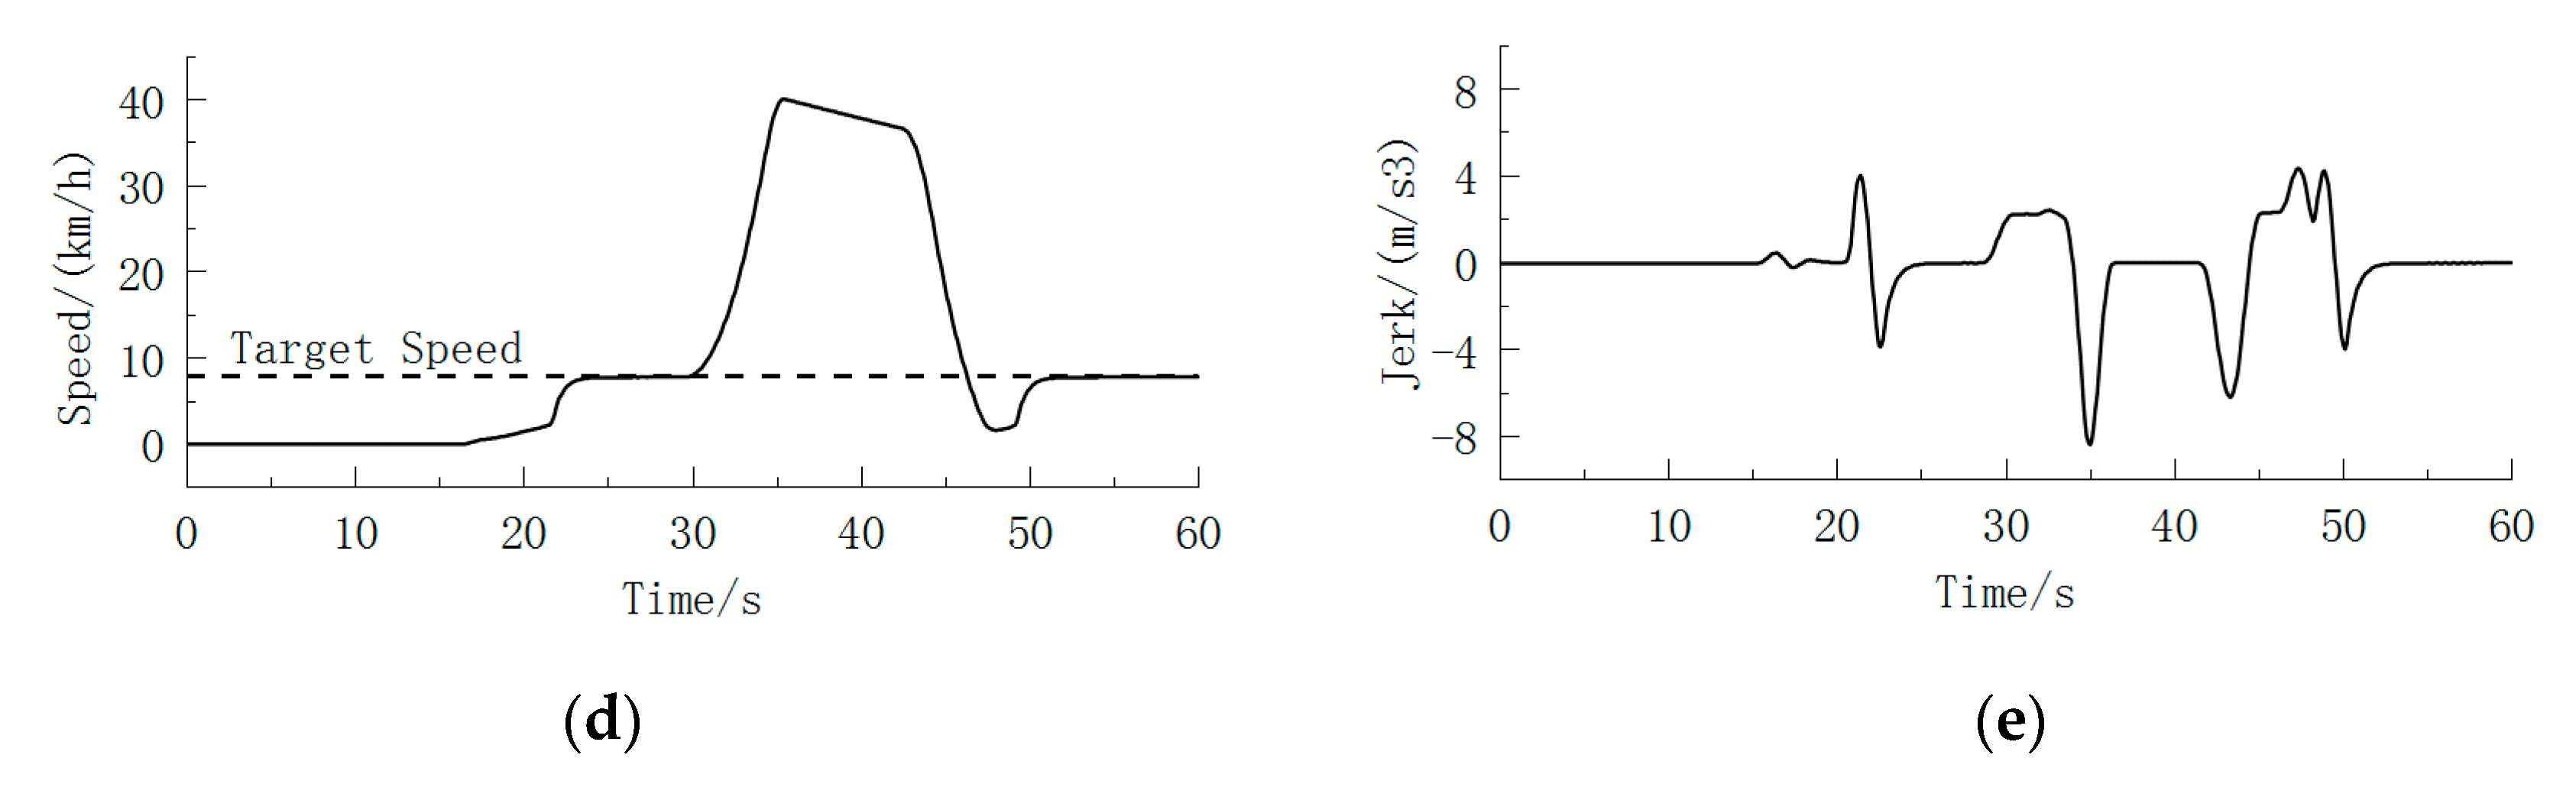
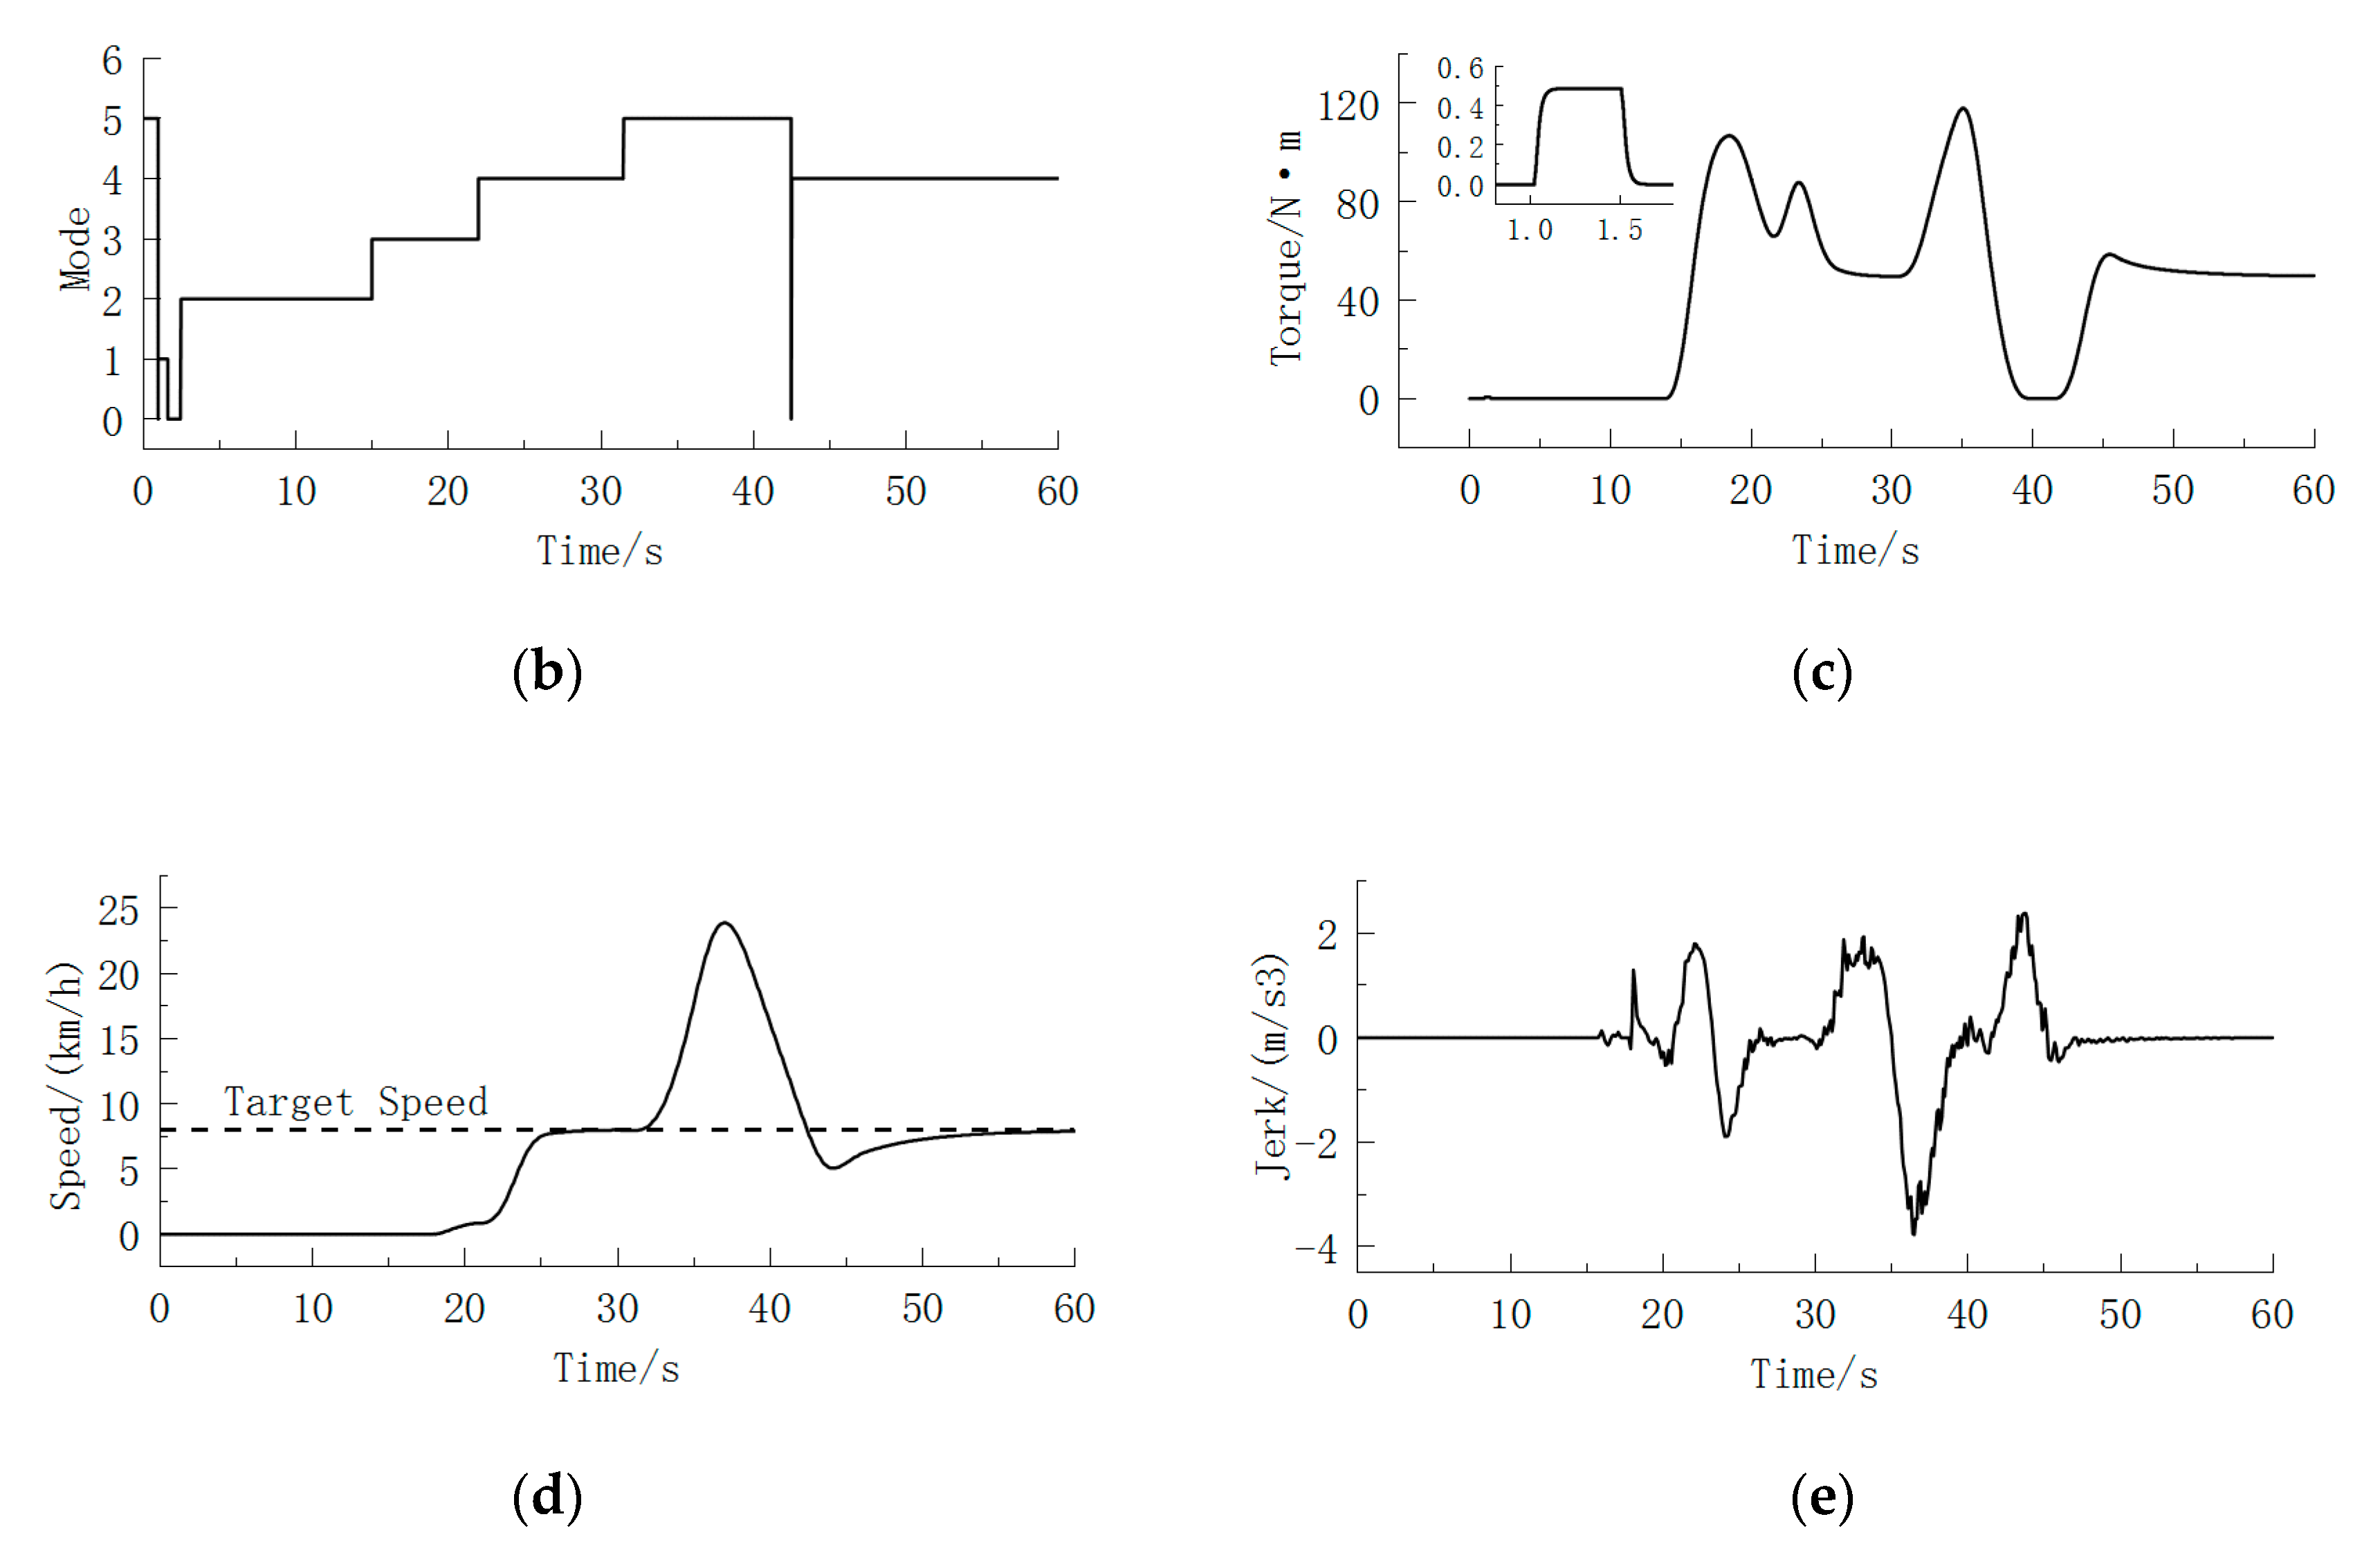
3.2. Slight Slope
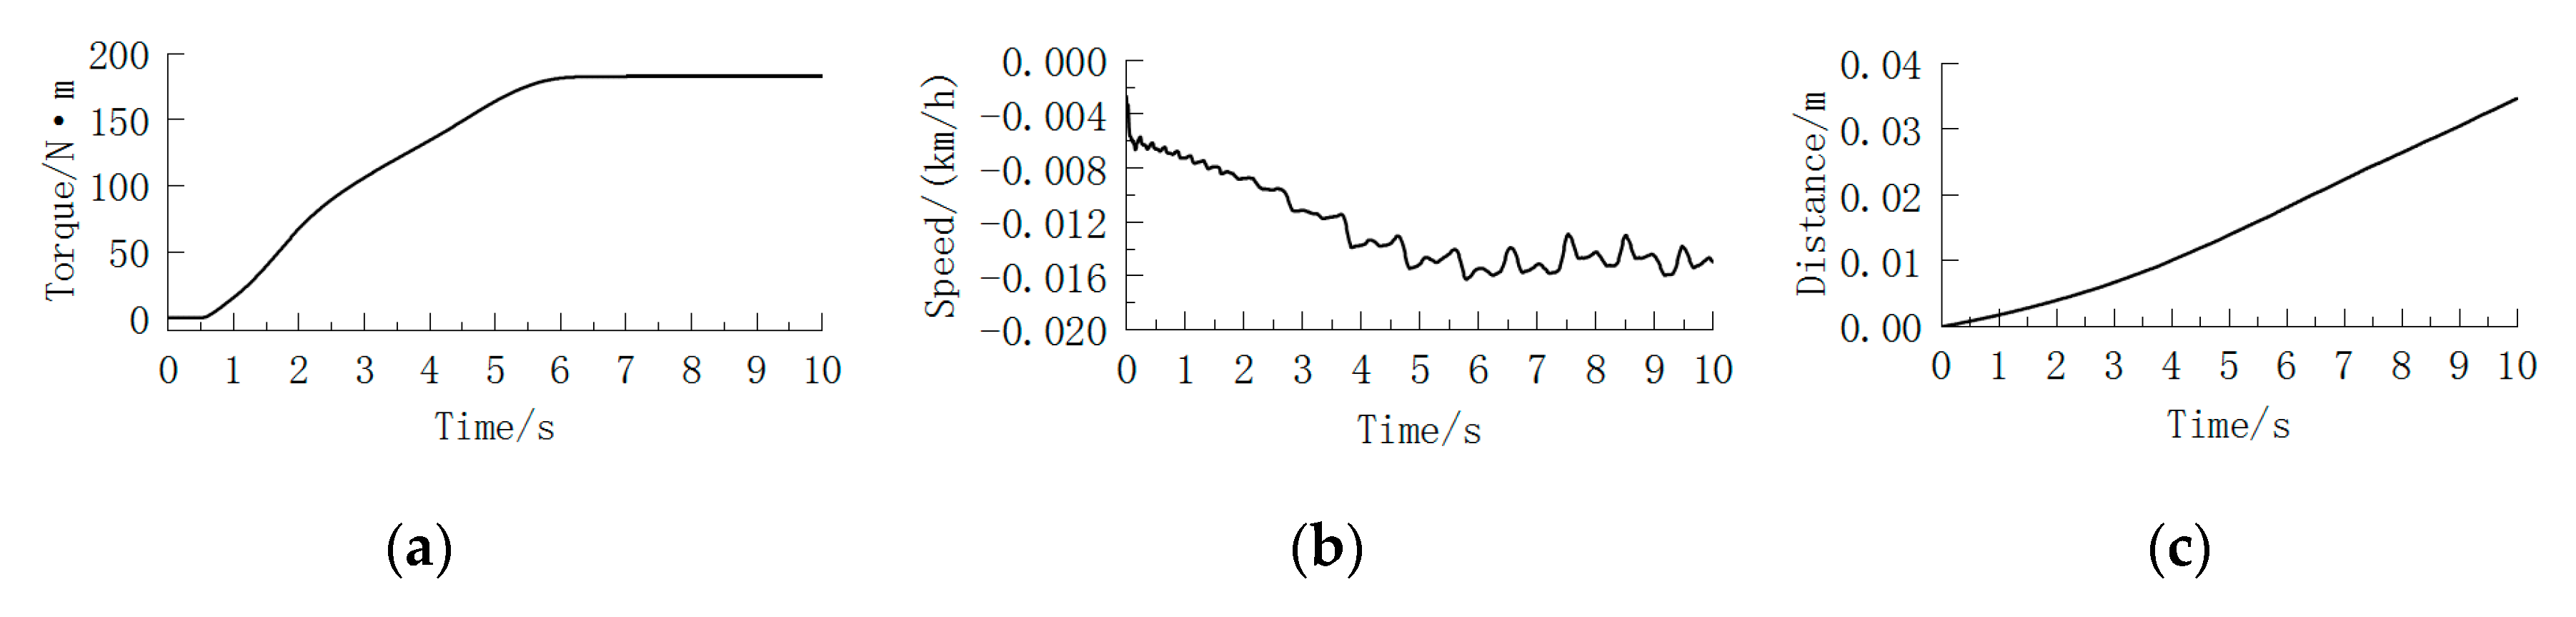
3.3. Steep Slope
4. Discussion
4.1. Performance Index
4.1.1. Jerk
- J is the jerk.
4.1.2. Speed
4.1.3. Stabilization Time
4.1.4. Rollback Distance
4.2. Engineering Value
5. Conclusions
- (1)
- A starting control method is designed based on state machine control, which is of clear logic, strong integration, strong portability and strong control stability. The control strategies of torque preloading, anti-rollback, pedal control and PI creep are studied.
- (2)
- The torque transition between each mode is smooth, and the jerk of the whole starting stage is less than 10 m/s3, which meets the requirements of comfort design.
- (3)
- Under various working conditions, the brake pedal aperture and speed have good matching performance. The time to reach the creeping speed meets the driver’s expectation and the requirements of maneuverability design. Stable standing on a steep slope can be achieved to meet the design requirements of driving safety.
- (4)
- The method focuses on the torque management of vehicles, which is in low-speed including starting. It can be integrated in torque management calculation coordinated with high-speed torque management. This method can be applied in most new-energy vehicles with starting by motor.
- (5)
- In this paper, the design method is studied at the simulation level, and further verification will be considered combined with the actual vehicle test.
Author Contributions
Funding
Conflicts of Interest
References
- Iyer, R.; Awade, Y.; Doshi, P. Safety and Comfort for All: An Affordable Hill-Hold and Automated Parking Brake System. SAE Tech. Pap. 2019, 26. [Google Scholar] [CrossRef]
- Wang, H.; Peng, P.; Gu, W. Simulation and Experiment of Hill-start of EPB with Logic Threshold Control. Automot. Eng. 2018, 40, 1302–1307. [Google Scholar]
- Liu, J.; Liu, K.; Xiong, L. Research of Intelligent Prediction Control Technology of CVT Starting Clutch. J. Highw. Transp. Res. Dev. 2016, 33, 135–142. [Google Scholar]
- Wu, B.; Zhou, P. Study on Starting Control Strategy of Ramp Based on Pure Electric Vehicle. Agric. Equip. Veh. Eng. 2019, 57, 37–40. [Google Scholar]
- Li, G.; Wu, Z.; Jiang, F. The Motor-Driven Still Hold System for Electric Vehicle on Slope. Trans. Beijing Inst. Technol. 2020, 9, 941–948. [Google Scholar] [CrossRef]
- Yang, Y.; He, Y.; Yang, Z.; Fu, C.; Cong, Z. Torque Coordination Control of an Electro-Hydraulic Composite Brake System During Mode Switching Based on Braking Intention. Energies 2020, 13, 2031. [Google Scholar] [CrossRef]
- Zhou, J.; Sun, J.; He, L.; Ding, Y.; Cao, H.; Zhao, W. Control Oriented Prediction of Driver Brake Intention and Intensity Using a Composite Machine Learning Approach. Energies 2019, 12, 2483. [Google Scholar] [CrossRef]
- Mo, X.; Zhu, Y.; Yang, H. A Study on Motor Speed Control for Ramp Start Up of Electric Vehicle. Comput. Simul. 2018, 35, 107–111+324. [Google Scholar]
- Shen, P.; Zhao, Z.; Zhan, X.; Li, J. Particle Swarm Optimization of Driving Torque Demand Decision Based on Fuel Economy for Plug-in Hybrid Electric Vehicle. Energy 2017, 123, 89–107. [Google Scholar] [CrossRef]
- Hu, J.; Du, R.; Ji, Y. Control Strategy for Starting Up of Pure Electric Vehicles. J. Chongqing Univ. 2013, 36, 19–25. [Google Scholar]
- Qin, D.; Chen, S.; Hu, M. Electric Vehicle Start Control with Coordination of Motor and Brake. China Mech. Eng. 2012, 23, 1758–1763. [Google Scholar]
- Pi, X.; Jing, T.; Liu, L. Research on a Verification Simulation Model Based on Finite State Machine Research. Comput. Eng. Sci. 2012, 34, 153–156. [Google Scholar]
- Zhu, W.; Huang, H.; Ma, J. A Research on Parking Space Detection Algorithm Based on Image Recognition. Automot. Eng. 2019, 41, 744–749+756. [Google Scholar]
- Gowtham, R.; Anjali, M. Automated dynamic approach for detecting ransomware using finite-state machine. Decis. Support Syst. 2020, 138, 113400. [Google Scholar]
- Hayet, B.; Achraf, M.; Walid, G.; Boualem, B. Toward higher-level abstractions based on state machine for cloud resources elasticity. Inf. Syst. 2020, 90, 101450. [Google Scholar]
- Wang, J.; Zhao, C.; Pratt, A.; Baggu, M. Design of an advanced energy management system for microgrid control using a state machine. Appl. Energy 2018, 228, 2407–2421. [Google Scholar] [CrossRef]
- Wu, J.; Zhong, S.; Jiang, C. Characteristic Frequency Scanning System of EMI for New Energy Vehicles Based on Finite State Machine. China Meas. Test 2018, 44, 102–105+129. [Google Scholar]
- Zhou, S.; Ren, J.; Fu, X. Study on Torque Signal Processing for Electric Vehicle Based on Driving Safety Performance. J. Highw. Transp. Res. Dev. 2018, 35, 115–122. [Google Scholar]
- Iqbal, H. Electric and Hybrid Vehicles: Design Fundamentals, 2nd ed.; CRC Press: Boca Raton, FL, USA, 2010; pp. 31–65. [Google Scholar]
- Zhao, C.; Zhu, B.; Xu, Y. Analysis of a Coordinated Engine-Start Control Strategy for P2 Hybrid Electric Vehicle. SAE Tech. Pap. 2019, 1. [Google Scholar] [CrossRef]
- Wang, S.; Chen, J.; Tian, X. Research on Weights of Subjective Evaluation of Automobile Braking Performance Based on AHP. J. Highw. Transp. Res. Dev. 2015, 32, 138–142. [Google Scholar]


| Name/Unit | Value | Name/Unit | Value |
|---|---|---|---|
| Mass/kg | 1712 | Center of Mass Height/m | 0.5 |
| Wheel radius/m | 0.31 | Rated Power of Motor/kW | 37 |
| Friction Coefficient of Brake Disc | 0.35 | Peak Power of Motor /kW | 95 |
| Vehicle Resistant Coefficient | 192.35 | Maximum Speed of Motor /rpm | 12,000 |
| 0.6462 | Battery Nominal Voltage/V | 334 | |
| 0.047 | Battery Capacity/Ah | 37 | |
| Windward Area /m2 | 2.27 | Battery Internal Resistance/ mΩ | 96 |
| Wheelbase /m | 2.75 |
Publisher’s Note: MDPI stays neutral with regard to jurisdictional claims in published maps and institutional affiliations. |
© 2020 by the authors. Licensee MDPI, Basel, Switzerland. This article is an open access article distributed under the terms and conditions of the Creative Commons Attribution (CC BY) license (http://creativecommons.org/licenses/by/4.0/).
Share and Cite
Wu, Y.; Xu, Y.; Zhou, J.; Wang, Z.; Wang, H. Research on Starting Control Method of New-Energy Vehicle Based on State Machine. Energies 2020, 13, 6249. https://doi.org/10.3390/en13236249
Wu Y, Xu Y, Zhou J, Wang Z, Wang H. Research on Starting Control Method of New-Energy Vehicle Based on State Machine. Energies. 2020; 13(23):6249. https://doi.org/10.3390/en13236249
Chicago/Turabian StyleWu, Yezhen, Yuliang Xu, Jianwei Zhou, Zhen Wang, and Haopeng Wang. 2020. "Research on Starting Control Method of New-Energy Vehicle Based on State Machine" Energies 13, no. 23: 6249. https://doi.org/10.3390/en13236249
APA StyleWu, Y., Xu, Y., Zhou, J., Wang, Z., & Wang, H. (2020). Research on Starting Control Method of New-Energy Vehicle Based on State Machine. Energies, 13(23), 6249. https://doi.org/10.3390/en13236249